ultrastructural changes and activation differences in platelet concentrates stored in plasma and...
TRANSCRIPT
B L O O D C O M P O N E N T S
Ultrastructural changes and activation differences in plateletconcentrates stored in plasma and additive solution
Thomas Wagner, Angelika Vetter, Natascha Dimovic, S.E. Guber, Wolfgang Helmberg,
Wolfgang Kroll, Gerhard Lanzer, W.R. Mayr, and Josef Neumuller
BACKGROUND: The aim of this study was to demon-strate how ultrastructural morphology of platelets storedin different media correlate with the appearance of par-ticular activation markers on their cell surface.STUDY DESIGN AND METHODS: Concentrates ofbuffy coat-derived platelets were stored in plasma or aglucose-free citrate-acetate-NaCl platelet additive solu-tion (PAS2, Baxter Healthcare Corp.). Activation mark-ers on platelets were measured by flow cytometry andcompared with changes in the platelet cell surface asdemonstrated by electron microscopy. Levels of the va-soactive cytokines vascular endothelial growth factor(VEGF) and RANTES (regulated upon activation, nor-mal T-cell expressed and secreted) were determined inthe storage medium of the platelet concentrate.RESULTS: The activation markers CD62P and CD63and the binding of thrombospondin measured by flowcytometry were expressed to a higher extent in thePAS2 group compared with the plasma group. The dif-ference reached significance on Day 3 (CD62P: 66.37± 2.44 vs. 37.83 ± 2.03, p < 0.001; CD63: 42.11 ± 3.29vs. 34.84 ± 2.04, p < 0.05; and thrombospondin binding:18.84 ± 3.9 vs. 13.98 ± 3.87, p < 0.001, respectively).The form factor that is related to changes of the plateletshape was determined by image analysis and corre-lated significantly with the cell surface expression ofCD62P (p < 0.001) and with CD63 (p < 0.05) and withthrombospondin binding (p < 0.05). The chemokinesVEGF and RANTES were measured at higher levels inthe PAS2 group.CONCLUSIONS: With exception of baseline activationprobably due to necessary handling procedures, plate-lets remain relatively unaltered and more stable inplasma in comparison to storage in PAS2.
The transfusion of allogeneic platelets plays amajor role in the treatment of patients aftermarrow and stem cell transplantation as well asin patients experiencing thrombocytopenia. In-
creasingly aggressive chemotherapeutic and marrowtransplant protocols have led to increasing demands forplatelet concentrates. Therefore, many transfusion ser-vices store platelet concentrates to fulfill these demands.However, longer storage times are frequently associatedwith febrile transfusion reactions.1 Accumulating datafrom literature demonstrate that both inflammatory cy-tokines2,3 released from WBCs that undergo activationduring storage4,5 and plasma proteins are responsible fora variety of adverse transfusion reactions. Therefore,WBCs are largely removed from the units by use of bothdifferent filter devices and apheresis methods. To reduceplasma protein content, platelet additive solutions can beused.
Severe morphologic alterations of stored platelets in-
ABBREVIATIONS: FC = flow cytometry; FF = form factor; FL1
= green fluorescence; FL2, FL3 = red fluorescences; FSC = for-
ward light scatter signal; GMP = granule membrane protein;
GP = glycoprotein; RANTES = regulated upon activation, nor-
mal T-cell expressed and secreted; SSC = 90� light scatter sig-
nal; VEGF = vascular endothelial growth factor.
From the Department of Blood Group Serology and Transfu-
sion Medicine and Department of Anesthesiology, Graz, Aus-
tria; the Ludwig Boltzmann Institute of Rheumatology and Bal-
neology, Vienna; and the Departments of Virology and of
Blood Group Serology and Transfusion Medicine, General
Hospital, and Institute for Histology and Embryology, Univer-
sity of Vienna, Vienna, Austria
Address reprint requests to: Josef Neumuller, PhD, Insti-
tute for Histology and Embryology, Department for Cell Biol-
ogy and Ultrastructure Research, University of Vienna,
Schwarzspanierstrasse 17, A-1090 Vienna, Austria; e-mail:
Received for publication June 19, 2001; revision received
December 2, 2001, and accepted February 8, 2002.
TRANSFUSION 2002;42:719-727.
Volume 42, June 2002 TRANSFUSION 719
dicate low hemostatic efficacy. Activated platelets maybecome hyperactive or platelets may become refractoryto any of their physiologic agonists.6 Therefore, relativelynormal function and adequate recovery of stored plate-lets following transfusion are essential. Storage tempera-ture,7 pH, agitation, and a significant number of residualWBC are variables that are known to affect stored plateletfunction and activation.
In the present study, we examined buffy coat-derivedplatelet concentrates resuspended in plasma and a glu-cose-free, citrate-acetate-NaCl platelet additive solution(PAS2, Baxter Healthcare Corporation, Vienna, Austria)with respect to morphologic changes, cytokine release,and activation markers. An adapted encapsulation pro-cedure was used to obtain platelet preparations that werenot damaged mechanically because these platelets pro-vide better ultrastructural pictures that could be corre-lated to various activation markers obtained from flowcytometric analysis.
MATERIALS AND METHODS
Preparation of blood cells from wholeblood donationsBuffy coat-derived platelet concentrates were preparedfrom whole blood according to recently described proto-cols.8 In brief, 450 mL whole blood � 10 percent wasobtained from healthy volunteer blood donors accordingto the Austrian regulations for blood donation and afterinformed consent. Whole blood was collected into triplebags containing 63 mL CPD in the primary bag (MacoPharma, LAB.Pharmaceutiques, Tourcoing, France) andcentrifuged at 4000 � g for 10 minutes at 20�C within 12hours. RBCs and plasma were separated from the buffycoat fraction and transferred into satellite containers byuse of an automated separator (Compomat G3, NPBI,Amsterdam, the Netherlands). Subsequently, accordingto a randomization scheme, buffy coats from four differ-ent donors and one bag containing 300 mL plasma fromone of the four donors (n = 12) or one bag containing 300mL of additive solution (PAS2; composition, 116 mM so-dium chloride, 30 mM sodium acetate, 2.94 g/L sodiumcitrate, pH 7.2) (n = 12) were connected by use of a sterileconnection device (TSCD, Terumo Corp., Tokyo, Japan)and were pooled in one container. Subsequently a 1-Lpolyolefin bag (Baxter) and a WBC-reduction filter (Au-tostop BC, Pall, Cornwall, UK) were connected, and thepool was centrifuged at 500 � g for 8 minutes at 22�C.The supernatant was expressed immediately into thestorage bag by means of a plasma extractor. The remain-ing pellet was resuspended with 100 mL of PBS. The buffycoat pool was stored for up to 5 days at 22�C on a flat-bedagitator under constant agitation at 60 rpm. In terms oftime between collection and generation of the final pool
and the centrifugation speed, both preparations wereproduced similarly.
In vitro measurementsSamples were taken under sterile conditions on Days 1, 3,and 5 for further analysis. Cell content and WBC differ-entiation were performed by means of an automatic ana-lyzer (H2-Technicon, Hitachi, Tokyo, Japan). Addition-ally, residual WBC counts were performed bymicroscopic counting by use of a Nageotte chamber andby flow cytometry (FC) (FACSCalibur, Becton Dickinson,Vienna, Austria) and a commercially available kit (Leuco-Count, Becton Dickinson) according to the manufactur-er’s instructions (Day 1 samples only). We determinedthe pH, pO2, pCO2, lactate, and glucose by use of a bloodgas analyzer (Omni, AVL, Graz, Austria). The density wasmeasured by use of a density meter (DMA 48, A. Paar KG,Graz, Austria) and total protein was measured by use ofan automatic analyzer (Hitachi 911, Hitachi).
Platelet surface antigensFC was performed with the FACSCalibur with standardequipment to measure the forward light scatter signal(FSC), the 90� light scatter signal (SSC), the green fluores-cence (FL1), and the red fluorescences FL2 and FL3, all atlogarithmic amplification. The run-to-run precision waschecked by use of computer software (FACSComp, Bec-ton Dickinson) in combination with fluorescent polysty-rene calibration beads (Calibrite 3, Becton Dickinson) ona daily basis. The FACSCalibur settings were as follows:threshold, 88; log FSC, E00; log SSC, 382; log FL1, 629; logFL2, 645; log FL3, 721.
In every sample run, 10,000 events were acquired inlist mode. The list mode files were processed by use ofcomputer software (Cellquest, Becton Dickinson). Two-parameter histograms (dot plots; FSC � SSC) were ob-tained to gate a cell population that could be clearly iden-tified as platelets.
The fluorescence of antibody-labeled platelets wasshown in single-parameter histograms with 1024 chan-nels for FL1, FL2, or FL3. The percentage of positivelystained cells and the mean channel were used for theevaluation of measurement data.
A three-color analysis that used FITC-, PE-, and peri-din chlorophyll � protein (PerCP)-labeled MoAbs wasperformed. In detail, eight tubes (polypropylene tubes)for every buffy coat pool were prepared in advance with100 �L of PBS plus 2 percent FCS (Biochrome SZ 0113,Vienna, Austria) and the following antibodies (10 �L eachsingle antibody) in different combinations: anti-glycoprotein (GP) IIIa (CD61PercP, Becton Dickinson),anti-GP IIa/IIIb (CD41aFITC, Coulter-Immunotech, Mar-saille, France), anti-GP IV (CD36FITC, Coulter-Immunotech), anti-GP Ib (CD42bFITC, Coulter-
WAGNER ET AL.
720 TRANSFUSION Volume 42, June 2002
Immunotech), anti-granule membrane protein (GMP)140 (CD62P-PE, Becton Dickinson), antiplatelet GP40( C D 6 3 P E , C o u l t e r - I m m u n o t e c h ) , a n d a n t i -thrombospondin (thrombospondin PE, Coulter-Immunotech). Ten microliters from each platelet con-centrate was added to each vial and incubated for 15minutes at room temperature in the dark. Immediatelythereafter 1 mL of fixative (CellFix, Becton Dickinson)diluted 1 in 10 in distilled water was added to terminatethe reaction. The flow cytometric analysis was startedimmediately after preparation.
Transmission electron microscopyNine-hundred microliters of platelet concentrate, ob-tained either from plasma or from PAS2, was fixed with0.25-percent glutaraldehyde (Fluka, Vienna, Austria) for 5minutes. Subsequently, 250 �L of the fixed platelets wasmixed with 750 �L alginate (2% [wt/vol] in PBS; Kelco,Rahway, NJ). Platelets were encapsulated in alginatebeads by use of a syringe by dropping the platelet plusalginate suspension in 0.2 M aqueous CaCl2 solution. Af-ter 5 minutes of gelation the alginate beads were trans-ferred to 10 mL of 2.5-percent glutaraldehyde in 0.1 Mcacodylate buffer (pH 7.2) and incubated for 90 minutesat 4�C. Encapsulation in alginate was performed to mini-mize platelet damage during preparation after fixation.This method was a modification of the preparation pro-tocol for chondrocyte cultures by Hauselmann et al.9 Af-ter being washed with cacodylate buffer for 30 minutesthe beads were fixed again with 1-percent OsO4 (Fluka)for 90 minutes. Samples were washed again, dehydratedin ethanol, and embedded in Spurr epoxy resin (Fluka).Sixty-nanometer ultrathin sections were performed on anultramicrotome (Ultracut E, Reichert-Jung, Vienna, Aus-tria), contrasted with uranyl acetate (Fluka) and lead cit-rate (Fluka), and examined in an electron microscope(EM 109, Carl Zeiss, Oberkochen, Germany).
Scanning electron microscopyOne milliliter of platelet concentrate was fixed by mixingwith 2 mL of 2.5-percent glutaraldehyde in PBS for atleast 90 minutes at 4�C. Cells were washed with PBS bycentrifugation, resuspended in 0.5 mL of PBS, and trans-ferred to poly-L-lysine hydrobromide solution- (molecu-lar weight 70,000-250,000) coated coverslips for 5 minutesaccording to the manufacturer’s instructions (Sigma, Vi-enna, Austria). After a short rinsing in PBS, platelets werefixed again with 1-percent OsO4 for 15 minutes. Thesamples were dried in a gradual series of ethanol, trans-ferred to tertiary butanol (Merck, Darmstadt, Germany)for 60 minutes, and freeze-dried. The samples were ex-amined in a scanning electron microscope (StereoscanS90, Cambridge Instruments, Cambridge, UK).
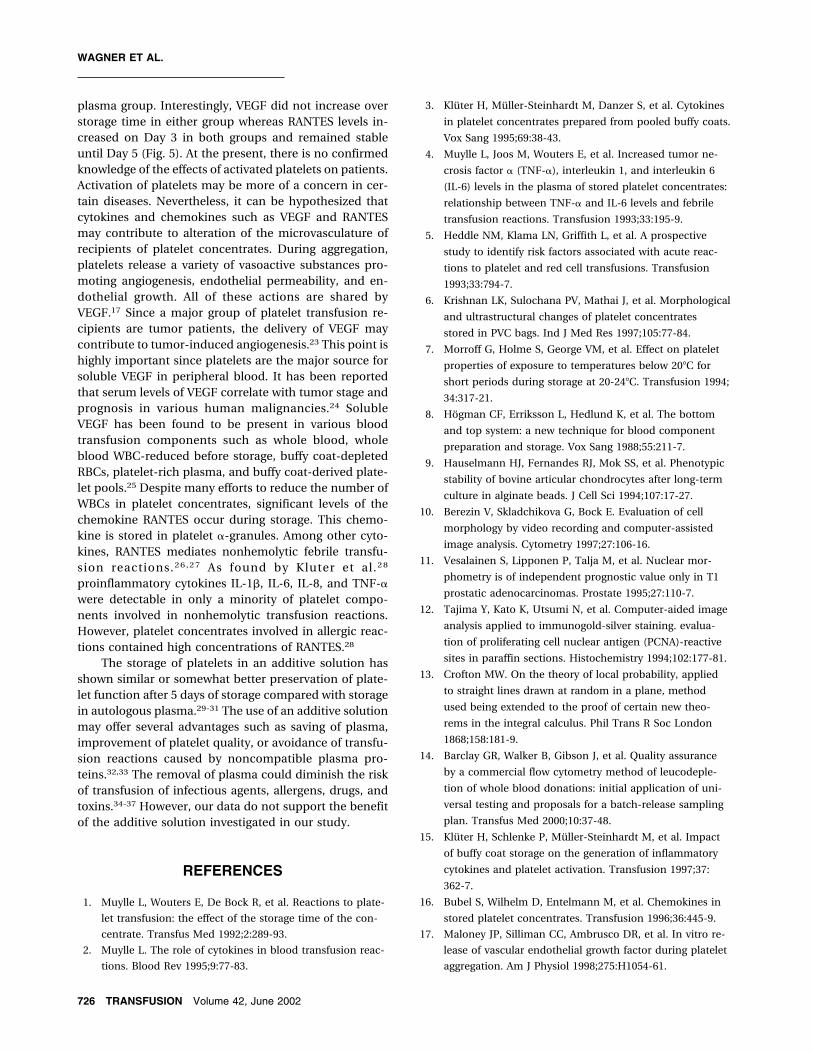
Image analysisTransmission electron micrographs (magnification,7000�) showing a group of sectioned platelets were per-formed and digital images from negatives (taken by adigital camera Olympus, Tokyo, Japan) were imported inan image analysis computer (KS-400, Carl Zeiss). The ab-erration of the ideal circular shape was measured interms of the form factor (FF = 4� � area/perimcroft2).The FF, also referred as the shape factor,10-12 calcu-lates the relation of the filled area of a platelet to its pe-rimeter, the length of which changes due to increasingnumbers of cell projections during platelet activation.Perimcroft, as a morphometric measure describing theperimeter of an object placed at the square lattice of acomputer image, is calculated according to the formulaof Crofton.13 The mean of the FF was calculated from atleast 20 platelets in a treatment group. Values range be-tween 0 and 1, with a FF of 1 corresponding to the idealcircular or discoid form. Since FF calculations from cross-sections of discoid platelets taken from the side instead ofthe face perturb the results, the following condition wasintroduced: pictures from platelet sections where theshort diameter was smaller than half of the long diameterwere excluded from measurements.
Cytokine measurementAliquots of 4 mL of platelet concentrate, withdrawn aftereach storage interval, were centrifuged at 3000 � g for 10minutes, and the supernatants were stored frozen at–30�C until measurement. Supernatant levels of RANTES(regulated upon activation, normal T-cell expressed andsecreted) were quantified by means of an ELISA (humanRANTES, R & D systems, Wiesbaden-Nordenstadt, Ger-many) according to the manufacturer’s instructions. Thedetection level as stated by the manufacturer was 8 pgper mL. Supernatant levels of human vascular endothe-lial growth factor (VEGF) were quantified by means of anELISA (human VEGF, R & D systems) according to themanufacturer’s instructions. The detection limit as statedby the manufacturer was 5 pg per mL.
Statistical analysisStatistical analysis was performed by use of commerciallyavailable computer software (WinStat for Excel, R. FitchSoftware, Staufen, Germany). All data were expressed asmean � SEM. We compared samples on different days ofstorage with the aid of the paired t-test. The Mann-Whitney U-test was used for comparison of data thatwere not normally distributed. The Pearson correlationwas used to correlate the values of the FF and the acti-vation markers. A p value < 0.05 was considered signifi-cant.
ACTIVATION AND MORPHOLOGY IN PLATELET POOLS
Volume 42, June 2002 TRANSFUSION 721
RESULTSIn vitro measurementsWe investigated a total of 24 platelet concentrates with amean volume of 296 � 35 mL. As shown in Table 1 plate-let counts are significantly different between the twogroups. It can be assumed that this effect is caused by thedifferent densities of plasma and PAS2, which is sup-ported by the fact that the platelets are present in higherconcentrations in the remaining PAS2 pellet (Table 1).Additionally, total protein was found nearly four timeshigher and density nearly 10 times higher in the plasmagroup compared to the PAS2 group (Table 1). Results ofthe blood gas analysis after various storage intervals aregiven in Table 2. Interestingly, the pH levels were higherin the PAS2 group compared to plasma (7.25 � 0.03 vs.7.11 � 0.02, p < 0.001) and remained stable during stor-age time.
Residual WBC countsTo count residual WBCs after filtration, a newly devel-oped flow cytometric analysis was used (LeucoCount). Asreported recently,14 this procedure is capable of measur-ing cell numbers as low as 500 WBC per mL. Lower num-bers are reportable but of uncertain accuracy. In com-parison to microscopic counting by means of theNageotte chamber, we found a significantly higheramount of residual WBCs by use of FC in both PAS2- andplasma-containing platelet concentrates (Table 1) Addi-tionally, we observed a significantly lower WBC count inthe PAS2 compared to the plasma group (Table 1).
Platelet surface antigensWe examined the impact of storage time on platelet ac-tivation by use of MoAb binding to various platelet anti-gens. The proportions of CD61+, CD41a+, and CD42b+platelets were not statistically different between the twostudy groups and remained about 97 percent over theentire storage period. In contrast to others,15 we observeda slightly higher percentage of CD62P+ platelets in theplasma group, and a strongly elevated value in the PAS2group (Table 3).
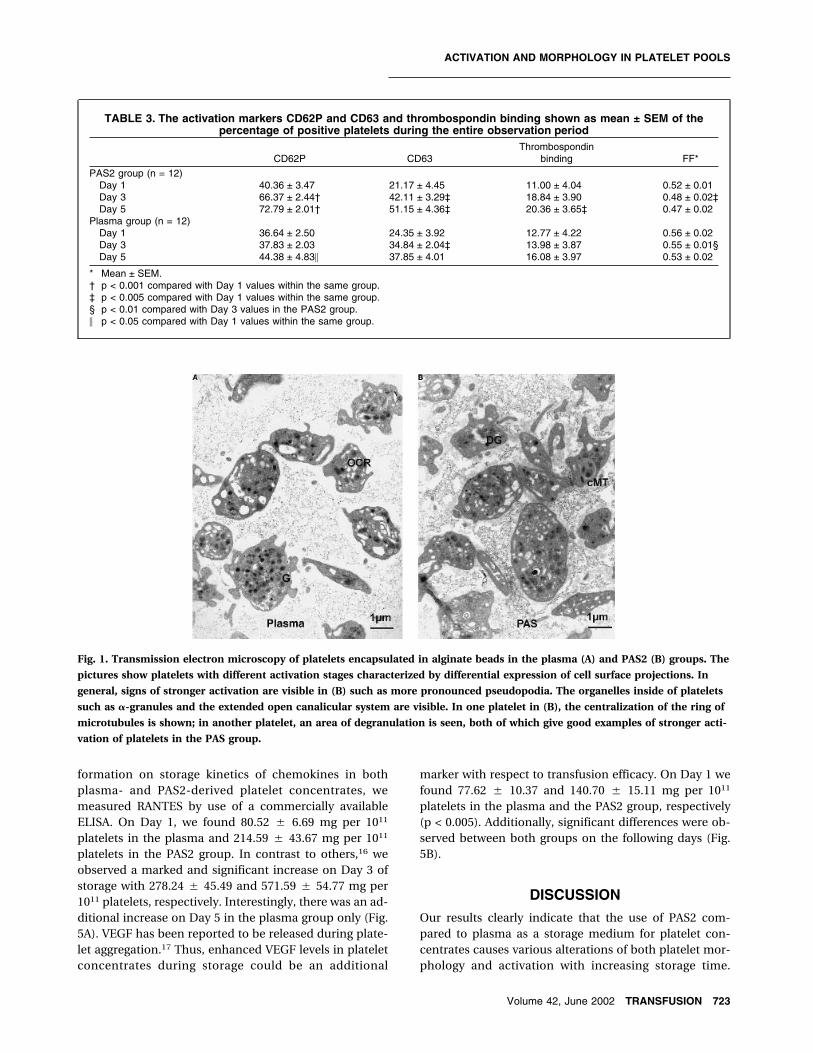
Ultrastructural morphologyEncapsulation of platelets after glutaraldehyde fixationprovides excellent preservation of the ultrastructural
morphology and of their changes in the course of plateletactivation (Fig. 1). Platelet activation observed in oursamples was associated with a deviation from the typicaldiscoid shape. Several activation stages ranging from for-mation of small to extended surface projections gave ahighly irregular appearance to the platelets. Thesechanges could also be demonstrated in detail by scan-ning electron microscopy (Figs. 2 and 3). Some plateletsform microaggregates as shown in Fig. 3. Strong activa-tion of platelets shows also a centralization of the ring ofmicrotubules located at the periphery of nonactivateddiscoid platelets. This process is accompanied by de-granulation of �-granules via the open canalicular sys-tem. Depending on the section plane, the degranulationprocess cannot be sufficiently quantified by use of mor-phometric methods. In contrast, the activation-dependent changes of the surface morphology as devia-tion from the ideal discoid shape can be calculated interms of the FF. Examples of different activation stages ofplatelets where the FF is indicated are shown in Fig. 4. Inour experiments, the FF correlated significantly with thecell surface expression of CD62P (r = 0.96, p < 0.001) andsignificantly with CD63 (r = 0.72, p < 0.05) and thrombo-spondin binding (r = 0.8, p < 0.05) (Table 3).
Cytokine measurementThe chemokine RANTES is known to be released fromthrombin-stimulated platelets. To obtain additional in-
TABLE 1. Comparison of various measurements of pooled, WBC-reduced platelet concentrations stored in PAS2 orplasma as well as total platelet content of the remaining pellet*
PLTs(×1011/unit)
Volume(mL)
PLTs(×1011/pellet)
Density(g/mL)
Total protein(g/dL)
WBCs (106/unit)
Nageotte LeucoCount
PAS2 1.67 ± 0.08 294.9 ± 2.59 1.31 ± 0.12 1.006 ± 0.0005 1.57 ± 0.03 0.024 ± 0.01 0.97 ± 0.17Plasma 2.64 ± 0.12 297.5 ± 1.94 0.66 ± 0.04 1.020 ± 0.0005 6.12 ± 0.08 0.149 ± 0.08 1.91 ± 0.32
p < 0.001 p = 0.41 p < 0.0001 p < 0.0001 p < 0.0001 p = 0.14 p < 0.01
* Results are shown as means ± SEM.
TABLE 2. Levels of pH, lactate, and glucose asmeasured during storage time in pooled,
WBC-reduced platelet concentrates stored in PAS2and plasma*
pH(37°C)
Lactate(mM )
Glucose(mg/dL)
PAS2 group (n = 12)Day 1 7.25 ± 0.03 3.98 ± 0.15 104 ± 3Day 3 7.17 ± 0.03 5.55 ± 0.23† 88 ± 4†Day 5 7.20 ± 0.01 6.68 ± 0.22† 76 ± 3†
Plasma group (n = 12)Day 1 7.11 ± 0.02‡ 8.17 ± 0.31‡ 317 ± 5‡Day 3 7.06 ± 0.09 11.65 ± 0.91† 277 ± 7‡Day 5 7.11 ± 0.08 14.30 ± 0.98† 250 ± 15†
* Results are shown as mean ± SEM.† p < 0.0001 compared to the PAS group.‡ p < 0.0001 compared to Day 1 values within the same group.
WAGNER ET AL.
722 TRANSFUSION Volume 42, June 2002
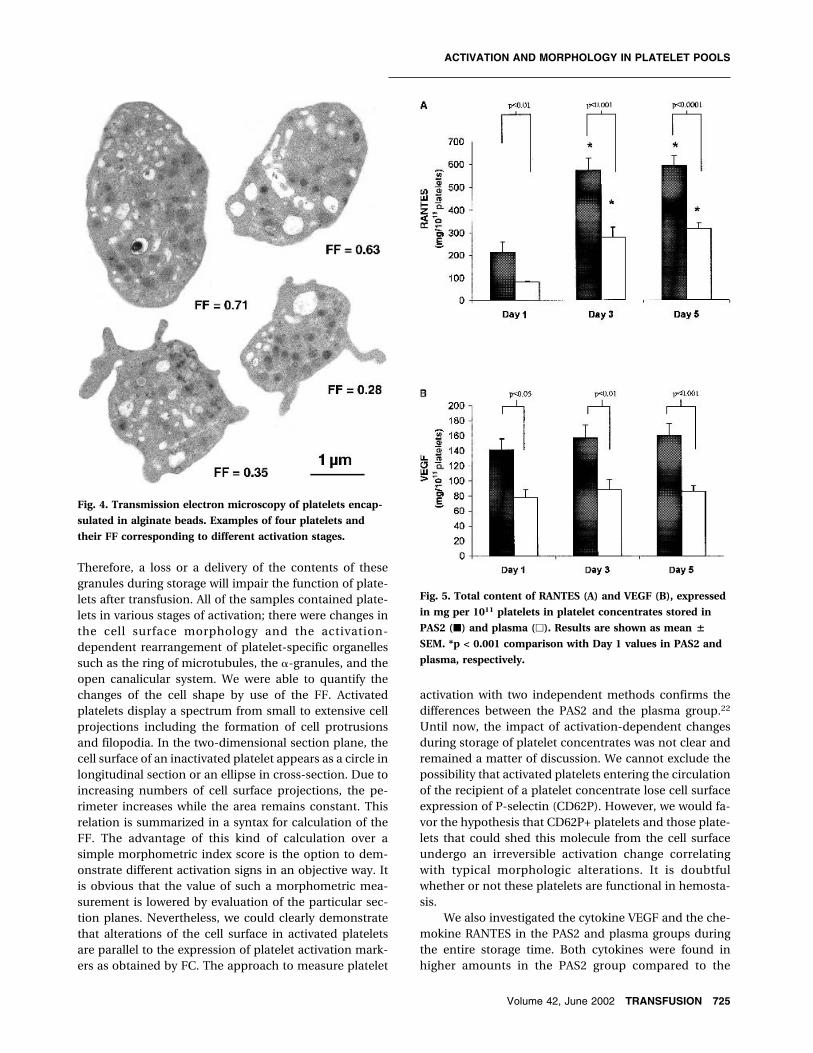
formation on storage kinetics of chemokines in bothplasma- and PAS2-derived platelet concentrates, wemeasured RANTES by use of a commercially availableELISA. On Day 1, we found 80.52 � 6.69 mg per 1011
platelets in the plasma and 214.59 � 43.67 mg per 1011
platelets in the PAS2 group. In contrast to others,16 weobserved a marked and significant increase on Day 3 ofstorage with 278.24 � 45.49 and 571.59 � 54.77 mg per1011 platelets, respectively. Interestingly, there was an ad-ditional increase on Day 5 in the plasma group only (Fig.5A). VEGF has been reported to be released during plate-let aggregation.17 Thus, enhanced VEGF levels in plateletconcentrates during storage could be an additional
marker with respect to transfusion efficacy. On Day 1 wefound 77.62 � 10.37 and 140.70 � 15.11 mg per 1011
platelets in the plasma and the PAS2 group, respectively(p < 0.005). Additionally, significant differences were ob-served between both groups on the following days (Fig.5B).
DISCUSSION
Our results clearly indicate that the use of PAS2 com-pared to plasma as a storage medium for platelet con-centrates causes various alterations of both platelet mor-phology and activation with increasing storage time.
Fig. 1. Transmission electron microscopy of platelets encapsulated in alginate beads in the plasma (A) and PAS2 (B) groups. The
pictures show platelets with different activation stages characterized by differential expression of cell surface projections. In
general, signs of stronger activation are visible in (B) such as more pronounced pseudopodia. The organelles inside of platelets
such as �-granules and the extended open canalicular system are visible. In one platelet in (B), the centralization of the ring of
microtubules is shown; in another platelet, an area of degranulation is seen, both of which give good examples of stronger acti-
vation of platelets in the PAS group.
TABLE 3. The activation markers CD62P and CD63 and thrombospondin binding shown as mean ± SEM of thepercentage of positive platelets during the entire observation period
CD62P CD63Thrombospondin
binding FF*
PAS2 group (n = 12)Day 1 40.36 ± 3.47 21.17 ± 4.45 11.00 ± 4.04 0.52 ± 0.01Day 3 66.37 ± 2.44† 42.11 ± 3.29‡ 18.84 ± 3.90 0.48 ± 0.02‡Day 5 72.79 ± 2.01† 51.15 ± 4.36‡ 20.36 ± 3.65‡ 0.47 ± 0.02
Plasma group (n = 12)Day 1 36.64 ± 2.50 24.35 ± 3.92 12.77 ± 4.22 0.56 ± 0.02Day 3 37.83 ± 2.03 34.84 ± 2.04‡ 13.98 ± 3.87 0.55 ± 0.01§Day 5 44.38 ± 4.83� 37.85 ± 4.01 16.08 ± 3.97 0.53 ± 0.02
* Mean ± SEM.† p < 0.001 compared with Day 1 values within the same group.‡ p < 0.005 compared with Day 1 values within the same group.§ p < 0.01 compared with Day 3 values in the PAS2 group.� p < 0.05 compared with Day 1 values within the same group.
ACTIVATION AND MORPHOLOGY IN PLATELET POOLS
Volume 42, June 2002 TRANSFUSION 723
Additionally, both measured cytokines were found moreelevated in the PAS2 group. With respect to the differentplatelet counts, it could be demonstrated that plateletswere lost during the second centrifugation step to ahigher extent in the PAS2 group mainly due to lower den-sity of this storage medium (Table 1).
FC analyses of antigen expression at the platelet sur-face have contributed to detection and understanding ofplatelet activation. The use of fluorolabeled MoAbs hasshown that there are three types of receptor changes onthe platelet surface that accompany activation: 1) confor-mational changes in the fibrinogen receptor (GP IIb/IIIa,CD61/CD41a), which is present in the resting state andan increase in its number; 2) expression of �-granules orlysosomal proteins that are not present in the restingstate on the cell surface including GMP 140, gp53, CD62,and CD63; and 3) binding of soluble factors such as fi-
brinogen and thrombospondin to thesurface of activated, but not restingplatelets. Our FC results clearly demon-strate a significant difference in the ac-tivation of platelets during storage timein PAS2 and plasma (Table 3). It seemsthat plasma contains protecting factorsthat prevent platelet activation, whichare not present in PAS2-suspendedplatelet concentrates in sufficientamounts. Plasma preparations containfour times more total protein comparedto PAS2 preparations (Table 1). Amongthe activation markers measured,CD62P and thrombospondin showed asignificant increase on the surface ofplatelets after 3 days of storage in thePAS2 group only. Interestingly, CD63was found significantly increased inboth groups. After 5 days of storage,CD62P and CD63 were increased inboth groups whereas thrombospondinwas increased in the PAS2 group only.
Morphologic investigations ofplatelets contribute to the understand-ing of the development of the storagelesion and may supplement the evalu-ation of new methods for preparationand storage of platelet concentrates.18,19
In a recent study, ultrastructural mor-phometry was employed to quantify thestorage-induced injury of cells in plate-let concentrates stored in plasma.20 The�-granules are the major storage organ-elles of platelets for substances whichare necessary in hemostasis, inflam-matory, and regenerative processes.21
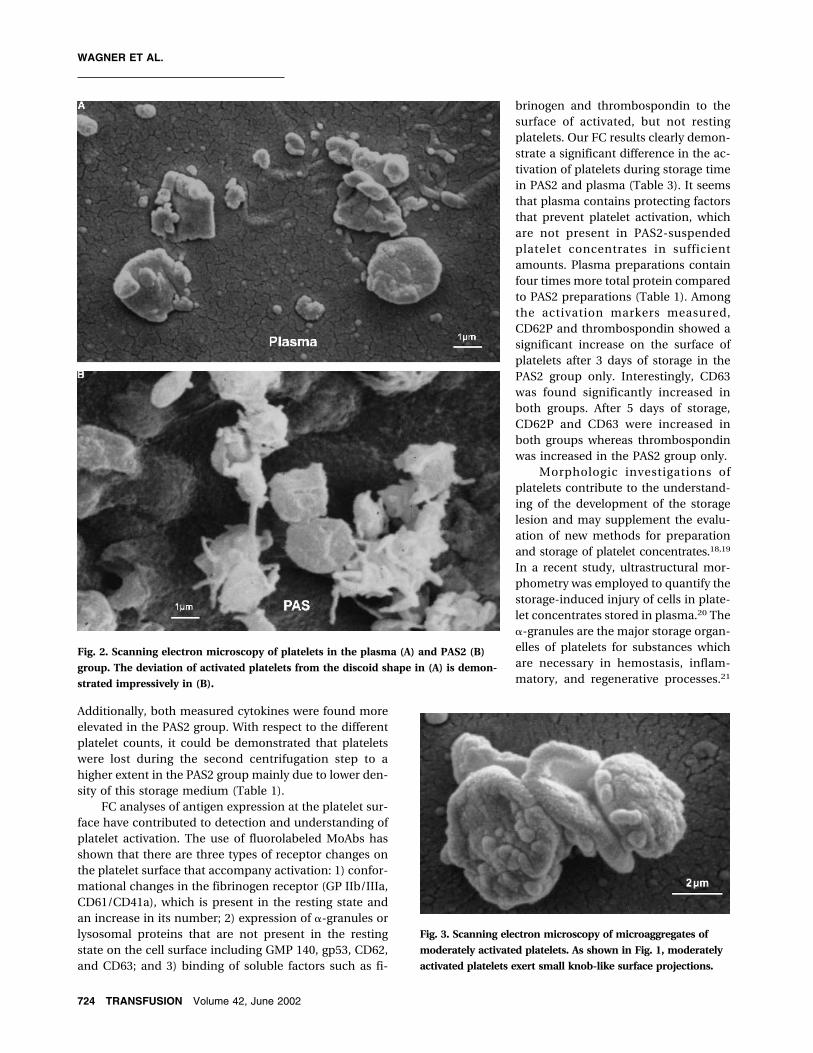
Fig. 2. Scanning electron microscopy of platelets in the plasma (A) and PAS2 (B)
group. The deviation of activated platelets from the discoid shape in (A) is demon-
strated impressively in (B).
Fig. 3. Scanning electron microscopy of microaggregates of
moderately activated platelets. As shown in Fig. 1, moderately
activated platelets exert small knob-like surface projections.
WAGNER ET AL.
724 TRANSFUSION Volume 42, June 2002
Therefore, a loss or a delivery of the contents of thesegranules during storage will impair the function of plate-lets after transfusion. All of the samples contained plate-lets in various stages of activation; there were changes inthe cell surface morphology and the activation-dependent rearrangement of platelet-specific organellessuch as the ring of microtubules, the �-granules, and theopen canalicular system. We were able to quantify thechanges of the cell shape by use of the FF. Activatedplatelets display a spectrum from small to extensive cellprojections including the formation of cell protrusionsand filopodia. In the two-dimensional section plane, thecell surface of an inactivated platelet appears as a circle inlongitudinal section or an ellipse in cross-section. Due toincreasing numbers of cell surface projections, the pe-rimeter increases while the area remains constant. Thisrelation is summarized in a syntax for calculation of theFF. The advantage of this kind of calculation over asimple morphometric index score is the option to dem-onstrate different activation signs in an objective way. Itis obvious that the value of such a morphometric mea-surement is lowered by evaluation of the particular sec-tion planes. Nevertheless, we could clearly demonstratethat alterations of the cell surface in activated plateletsare parallel to the expression of platelet activation mark-ers as obtained by FC. The approach to measure platelet
activation with two independent methods confirms thedifferences between the PAS2 and the plasma group.22
Until now, the impact of activation-dependent changesduring storage of platelet concentrates was not clear andremained a matter of discussion. We cannot exclude thepossibility that activated platelets entering the circulationof the recipient of a platelet concentrate lose cell surfaceexpression of P-selectin (CD62P). However, we would fa-vor the hypothesis that CD62P+ platelets and those plate-lets that could shed this molecule from the cell surfaceundergo an irreversible activation change correlatingwith typical morphologic alterations. It is doubtfulwhether or not these platelets are functional in hemosta-sis.
We also investigated the cytokine VEGF and the che-mokine RANTES in the PAS2 and plasma groups duringthe entire storage time. Both cytokines were found inhigher amounts in the PAS2 group compared to the
Fig. 4. Transmission electron microscopy of platelets encap-
sulated in alginate beads. Examples of four platelets and
their FF corresponding to different activation stages.
Fig. 5. Total content of RANTES (A) and VEGF (B), expressed
in mg per 1011 platelets in platelet concentrates stored in
PAS2 (�) and plasma (�). Results are shown as mean �
SEM. *p < 0.001 comparison with Day 1 values in PAS2 and
plasma, respectively.
ACTIVATION AND MORPHOLOGY IN PLATELET POOLS
Volume 42, June 2002 TRANSFUSION 725
plasma group. Interestingly, VEGF did not increase overstorage time in either group whereas RANTES levels in-creased on Day 3 in both groups and remained stableuntil Day 5 (Fig. 5). At the present, there is no confirmedknowledge of the effects of activated platelets on patients.Activation of platelets may be more of a concern in cer-tain diseases. Nevertheless, it can be hypothesized thatcytokines and chemokines such as VEGF and RANTESmay contribute to alteration of the microvasculature ofrecipients of platelet concentrates. During aggregation,platelets release a variety of vasoactive substances pro-moting angiogenesis, endothelial permeability, and en-dothelial growth. All of these actions are shared byVEGF.17 Since a major group of platelet transfusion re-cipients are tumor patients, the delivery of VEGF maycontribute to tumor-induced angiogenesis.23 This point ishighly important since platelets are the major source forsoluble VEGF in peripheral blood. It has been reportedthat serum levels of VEGF correlate with tumor stage andprognosis in various human malignancies.24 SolubleVEGF has been found to be present in various bloodtransfusion components such as whole blood, wholeblood WBC-reduced before storage, buffy coat-depletedRBCs, platelet-rich plasma, and buffy coat-derived plate-let pools.25 Despite many efforts to reduce the number ofWBCs in platelet concentrates, significant levels of thechemokine RANTES occur during storage. This chemo-kine is stored in platelet �-granules. Among other cyto-kines, RANTES mediates nonhemolytic febrile transfu-sion reactions.26,27 As found by Kluter et al.28
proinflammatory cytokines IL-1�, IL-6, IL-8, and TNF-�
were detectable in only a minority of platelet compo-nents involved in nonhemolytic transfusion reactions.However, platelet concentrates involved in allergic reac-tions contained high concentrations of RANTES.28
The storage of platelets in an additive solution hasshown similar or somewhat better preservation of plate-let function after 5 days of storage compared with storagein autologous plasma.29-31 The use of an additive solutionmay offer several advantages such as saving of plasma,improvement of platelet quality, or avoidance of transfu-sion reactions caused by noncompatible plasma pro-teins.32,33 The removal of plasma could diminish the riskof transfusion of infectious agents, allergens, drugs, andtoxins.34-37 However, our data do not support the benefitof the additive solution investigated in our study.
REFERENCES
1. Muylle L, Wouters E, De Bock R, et al. Reactions to plate-
let transfusion: the effect of the storage time of the con-
centrate. Transfus Med 1992;2:289-93.
2. Muylle L. The role of cytokines in blood transfusion reac-
tions. Blood Rev 1995;9:77-83.
3. Kluter H, Muller-Steinhardt M, Danzer S, et al. Cytokines
in platelet concentrates prepared from pooled buffy coats.
Vox Sang 1995;69:38-43.
4. Muylle L, Joos M, Wouters E, et al. Increased tumor ne-
crosis factor � (TNF-�), interleukin 1, and interleukin 6
(IL-6) levels in the plasma of stored platelet concentrates:
relationship between TNF-� and IL-6 levels and febrile
transfusion reactions. Transfusion 1993;33:195-9.
5. Heddle NM, Klama LN, Griffith L, et al. A prospective
study to identify risk factors associated with acute reac-
tions to platelet and red cell transfusions. Transfusion
1993;33:794-7.
6. Krishnan LK, Sulochana PV, Mathai J, et al. Morphological
and ultrastructural changes of platelet concentrates
stored in PVC bags. Ind J Med Res 1997;105:77-84.
7. Morroff G, Holme S, George VM, et al. Effect on platelet
properties of exposure to temperatures below 20�C for
short periods during storage at 20-24�C. Transfusion 1994;
34:317-21.
8. Hogman CF, Erriksson L, Hedlund K, et al. The bottom
and top system: a new technique for blood component
preparation and storage. Vox Sang 1988;55:211-7.
9. Hauselmann HJ, Fernandes RJ, Mok SS, et al. Phenotypic
stability of bovine articular chondrocytes after long-term
culture in alginate beads. J Cell Sci 1994;107:17-27.
10. Berezin V, Skladchikova G, Bock E. Evaluation of cell
morphology by video recording and computer-assisted
image analysis. Cytometry 1997;27:106-16.
11. Vesalainen S, Lipponen P, Talja M, et al. Nuclear mor-
phometry is of independent prognostic value only in T1
prostatic adenocarcinomas. Prostate 1995;27:110-7.
12. Tajima Y, Kato K, Utsumi N, et al. Computer-aided image
analysis applied to immunogold-silver staining. evalua-
tion of proliferating cell nuclear antigen (PCNA)-reactive
sites in paraffin sections. Histochemistry 1994;102:177-81.
13. Crofton MW. On the theory of local probability, applied
to straight lines drawn at random in a plane, method
used being extended to the proof of certain new theo-
rems in the integral calculus. Phil Trans R Soc London
1868;158:181-9.
14. Barclay GR, Walker B, Gibson J, et al. Quality assurance
by a commercial flow cytometry method of leucodeple-
tion of whole blood donations: initial application of uni-
versal testing and proposals for a batch-release sampling
plan. Transfus Med 2000;10:37-48.
15. Kluter H, Schlenke P, Muller-Steinhardt M, et al. Impact
of buffy coat storage on the generation of inflammatory
cytokines and platelet activation. Transfusion 1997;37:
362-7.
16. Bubel S, Wilhelm D, Entelmann M, et al. Chemokines in
stored platelet concentrates. Transfusion 1996;36:445-9.
17. Maloney JP, Silliman CC, Ambrusco DR, et al. In vitro re-
lease of vascular endothelial growth factor during platelet
aggregation. Am J Physiol 1998;275:H1054-61.
WAGNER ET AL.
726 TRANSFUSION Volume 42, June 2002
18. White JG. Ultrastructural changes in stored plasma. Blood
Cells 1992;18:461-75.
19. Klinger MHF, Mendoza AS, Kluter H, et al. Storage lesion
of human PLT as revealed by ultrathin sections and
freeze-fracture replicas. Cell Tissue Res 1994;276:477-83.
20. Klinger MHF, Kluter H. Morphological changes in throm-
bocytes during blood bank storage: an ultrastructural
morphometric study. Ann Anat 1993;175:163-70.
21. Harrison P, Cramer EM. Platelet �-granules. Blood Rev
1993;7:52-62.
22. Klinger MHF, Josch M, Kluter H. PLT stored in a glucose-
free additive solution or in autologous plasma—an ultra-
structural and morphometric evaluation. Vox Sang 1996;
71:13-20.
23. Verheul HM, Jorna AS, Hoekman K, et al. Vascular endothe-
lial growth factor-stimulated endothelial cells promote ad-
hesion and activation of platelets. Blood 2000;96:4216-21.
24. Gunsilius E, Petzer A, Stockhammer G, et al. Thrombo-
cytes are the major source for soluble vascular endothe-
lial growth factor in peripheral blood. Oncology 2000;58:
169-74.
25. Nielsen HJ, Werther K, Mynster T, et al. Soluble vascular
endothelial growth factor in various blood transfusion
components. Transfusion 1999;39:1078-83.
26. Wadhwa M, Seghatchian MJ, Dilger P, et al. Cytokines in
WBC-reduced apheresis PCs during storage: a com-
parison of two WBC-reduction methods. Transfusion
2000;40:1118-26.
27. Kameyoshi Y, Dorschner A, Mallet AI, et al. Cytokine
RANTES released by thrombin-stimulated platelets is a
potent attractant for human eosinophils. J Exp Med 1992;
176:587-92.
28. Kluter H, Bubel S, Kirchner H, et al. Febrile and allergic
transfusion reactions after the transfusion of white cell-
poor platelet preparations. Transfusion 1999;39:1179-84.
29. Rock G, White J, Labow R. Storage of PLT in balanced salt
solutions: a simple platelet storage medium. Transfusion
1991;31:21-5.
30. van Rhenen DJ, Vermeij H, Kappers-Klunne M, et al.
Evaluation of a new citrate-acetate-NaCl platelet additive
solution for the storage of white cell-reduced platelet
concentrates obtained from half-strength CPD pooled
buffy coats. Transfusion 1995;35:50-3.
31. Rock G, Swenson SD, Adams GA. Platelet storage in a
plasma-free medium. Transfusion 1985;25:551-6.
32. Heddle NM, Klama L, Singer J, et al. The role of plasma
from platelet concentrates in transfusion reactions.
N Engl J Med 1994;331:625-8.
33. Kurner K, Sahlmen P, Zimmermann B, et al. In vitro
platelet function during storage in three different additive
solutions. Vox Sang 1994;67:154-9.
34. Gulliksson H. Storage of PLT in additive solutions: the
effect of citrate and acetate in in vitro studies. Transfu-
sion 1993;33:301-3.
35. Bertolini F, Murphy S, Rebulla P, et al. Role of acetate
during platelet storage in a synthetic medium. Transfu-
sion 1992;32:152-6.
36. Shimizu T, Murphy S. Roles of acetate and phosphate in
the successful storage of platelet concentrates prepared
with an acetate-containing additive solution. Transfusion
1993;33:304-10.
37. Hogmann CF, Eriksson L, Gulliksson H, et al. Preparation
of platelet concentrates from buffy coats suspended in an
additive solution. Transfus Sci 1990;11:353-5.
ACTIVATION AND MORPHOLOGY IN PLATELET POOLS
Volume 42, June 2002 TRANSFUSION 727