ultrasound-based sensing models for finger motion
TRANSCRIPT
1
Ultrasound-based Sensing Models for FingerMotion Classification
Youjia Huang, Student Member, IEEE, Xingchen Yang, Student Member, IEEE,Yuefeng Li, Student Member, IEEE, Dalin Zhou, Student Member, IEEE, Keshi He, Member, IEEE, and
Honghai Liu*, Senior Member, IEEE
Abstract—Motions of the fingers are complex since hand grasp-ing and manipulation are conducted by spatial and temporalcoordination of forearm muscles and tendons. The dominantmethods based on surface electromyography (sEMG) could notoffer satisfactory solutions for finger motion classification due toits inherent nature of measuring the electrical activity of motorunits at the skin’s surface. In order to recognize morphologicalchanges of forearm muscles for accurate hand motion prediction,ultrasound imaging is employed to investigate the feasibility ofdetecting mechanical deformation of deep muscle compartmentsin potential clinical applications. In this study, finger motionclassification has been represented as subproblems: recognizingthe discrete finger motions and predicting the continuous fingerangles. Predefined 14 finger motions are presented in both sEMGsignals and ultrasound images and captured simultaneously.Linear discriminant analysis classifier shows the ultrasound hasbetter average accuracy (95.88%) than the sEMG (90.14%). Onthe other hand, the study of predicting the metacarpophalangeal(MCP) joint angle of each finger in non-period movements alsoconfirms that classification method based on ultrasound achievesbetter results (average correlation 0.89 ± 0.07 and NRMSE 0.15± 0.05) than sEMG (0.81 ± 0.09 and 0.19 ± 0.05). The researchoutcomes evidently demonstrate that the ultrasound can be afeasible solution for muscle-driven machine interface, such asaccurate finger motion control of prostheses and wearable roboticdevices.
Index Terms—Ultrasound imaging, surface electromyography,finger motion classification, human-machine interface (HMI),prosthesis control.
I. INTRODUCTION
MONITORING muscle activities using non-invasivehuman-machine interface (HMI) is an extremely valu-
able and challenging task, which can be applied to remotemanipulation, muscle rehabilitation and prosthesis control.The core technology is to achieve accurate and stable handgesture classification using forearm muscle information. Withthe development of more advanced execution devices suchas hand prostheses, more accurate, dexterous and intuitivecontrol is urgently needed [1]–[3]. Many sensor technologieshave been applied to this field and are aimed at acting as a
This work is supported by the National Natural Science Foundation ofChina (Grant No.51575338).
Huang, Yang, Li, He and Liu are with the State Key Laboratory ofMechanical System and Vibration, School of Mechanical Engineering, Shang-hai Jiao Tong University, Shanghai, China (e-mail: [email protected],[email protected], [email protected], [email protected],[email protected]).
Zhou and Liu are with the School of Computing, the University ofPortsmouth, PO1 3HE, Portsmouth, UK(e-mail: [email protected], [email protected]). Corresponding author: H.Liu.
satisfactory HMI, achieving a desirable gesture classificationperformance [4].
Among all the sensing techniques, sEMG and ultrasound arethe most suitable alternatives for hand gesture classification,because of the ability of detecting muscle information ofthe forearm. sEMG is a kind of predominant technology forprosthesis control, but it has some inherent limitations forinstance crosstalk, attenuation, low signal to noise ratio, non-stationarity and lacking specificity for deep muscles [4]. Onthe contrary, ultrasound can detect morphological changesof both superficial and deep muscles, with a high spatialand temporal resolution [5]. Therefore, ultrasound could besuperior for hand gesture classification.
Among all the hand gestures, the finger motion is of vitalimportance. Because it can provide multi-degree of freedomcontrol which is significant for an intelligent and dexterousexecution device. To achieve finger motion control, accuratefinger motion classification is a premise. Fig. 1 (a) shows thedistribution and structure of the forearm muscles. Among thesemuscles, flexor pollicis longus, flexor digitorum superficialis,flexor digitorum profundus, extensor digiti minimi, abduc-tor pollicis longus, extensor digitorum and extensor pollicislongus are related to finger movements. Generally speaking,the flexor digitorum superficialis, flexor digitorum profundusand extensor digitorum are the most important muscles forfinger-related movements, which control the flexion and theextension of index, middle, ring and little fingers. The move-ment of the thumb is relatively independent and controlled bythe extensor pollicis longus, the flexor pollicis longus and theabductor pollicis longus. Since some finger-related musclesare deep below the skin and sEMG fails to capture deepmuscle activity precisely, ultrasound takes some advantagesfor accurate finger motion classification.
In this paper, the finger motion classification performancesfor sEMG and ultrasound were compared, including discretefinger motion recognition and continuous finger position esti-mation. It can be considered as the follow-up to [6], exceptthat more comprehensive situations are considered including acontinuous decoding part. It aims at evaluating the ultrasound-based models for finger motion classification, using the sEMGas the baseline. This article is not aimed at any specificapplication scenarios, but rather to compare the accuracy andstability of sEMG and ultrasound in the expression of forearmmuscle information. To guarantee fairness, sEMG signals andultrasound images were collected simultaneously during theexperiment.

2
Flexor digitorum superficialis
Flexor digitorum frofundus
Pronator quadratus
Ulna Radius
Flexor pollicislongus
(a)
(c)(b)
Fig. 1. (a) is the distribution and structure of the forearm muscles. (b) is aultrasound image which demonstrates the cross-section of the forearm musclesin the specific position. (c) is the sEMG signal of 8 channels correspondingto the position labeled in (a).
The study consists of two experiments for the purpose ofevaluating the ultrasound/sEMG sensing models for fingermotion classification. In Experiment 1, we compared thediscrete finger motion recognition accuracies of these twoHMIs for 14 different finger motions. In Experiment 2, thecontinuous decoding property of sEMG and ultrasound fordifferent metacarpophalangeal (MCP) joint angles of eachfinger were evaluated.
The rest of the paper is organized as follows: first, the relat-ed works about sEMG/ultrasound-based gesture classificationare introduced in Section II. The details about the experimentsetup and the methods used to process the obtained signals aredescribed in Sections III and IV. The experiment results areshown in Section V. Comprehensive discussion is provided forboth methodology and future challenges in Section VI. Finally,conclusion is drawn in Section VII.
II. RELATED WORKS
A. sEMG-based Gesture Classification
Since sEMG is closely related to neural signals, it iswidely used for hand gesture classification. Many studies aboutgesture classification based on sEMG has been reported, andvarious features and classifiers have been compared accordingto the classification performance [4], [7]–[10].
Duo to the inherent limitations such as lacking sufficientinformation of deep muscles and crosstalk, it is difficultto recognize deep-muscles-related finger motions for sEMG.However, given the necessity that the finger motions canprovide more precise prosthesis control, it still attracts tremen-dous attentions [7]–[9]. Besides, some practical gestures like
hand manipulation, which are highly related to finger motions,have been studied recently [11], [12]. But due to limitedinformation of deep muscles can be captured, the classificationperformance of finger motion is not desirable enough to beapplied in real implement.
A shortcoming of traditional pattern recognition controlis that it is unable to provide a continuous and intuitivefeeling for the subjects. Jiang et al. achieved a proportionalcontrol of wrist movements with multiple degrees of freedomby non-negative matrix factorization [13]. Furthermore, therelationship between the sEMG feature and the finger anglewas studied by some researchers [14]–[17]. These studies aimto continuously decode the finger joint angles from sEMG sig-nals. However, as same as discrete finger motion recognition,the performance of sEMG-based continuous decoding cannotmeet the realistic requirement.
B. Ultrasound-based Gesture Classification
In order to overcome the limitations of sEMG and promotethe HMI into clinical application, some new HMIs beginto emerge. The ultrasound imaging is regarded as the mostpromising one because it is non-invasive, safe and has highresolution about the morphological structure of both superficialand deep muscles [5]. These morphological features such asmuscle thickness, pennation angle and fascicle length can givea more detailed description of muscle contractions.
Recently, many researchers have started to apply ultrasoundto control external devices such as prostheses. Related studiesprove that it is feasible for ultrasound to replace sEMG inanalyzing muscle activities [18]–[20]. Considering the highresolution of the ultrasound imaging, it is suitable for somedexterous tasks like finger motion classification. Some re-searchers have studied the finger motion classification usingthe ultrasound imaging technology and derived promisingresults [21]–[23].
Besides, Sikdar et al. realized the online classification ofhand and finger motions based on ultrasound imaging, whichvalidated the online performance of ultrasound-based HMI.They also investigated the robustness of the ultrasound-basedHMI when the arm was in the different positions, proving thatit was robust against arm position changing. [24].
Furthermore, Castellini’s research focused on predicting thefinger position and finger force by ultrasound images andfound the linear relationships between a spatial first-orderfeature, finger position and finger tip force [5], [25].
There are also some studies involving the comparison of theabove two HMIs in estimating the wrist angle, the torque of thebiceps brachii muscles and finger tip force [26]–[28]. However,so far little is known about their comparative performance forfinger motion classification, which is the gap we are addressingin this paper.
III. DATA ACQUISITION
A. Experiment Setup
Eight able-limbed male subjects participated in these ex-periments (age: 20-24 years old; height: 167-187 cm; weight:55-75 kg). Half of the subjects have the experience on hand

3
gesture recognition based on either sEMG or ultrasound, whilethe other half do not. The experiment setup is shown inFig. 2. The data collection during the experiments includedultrasound images, sEMG signals and MCP joint angles, thelatter was for Experiment 2 only. For ultrasound, a clinicalportable ultrasound system Mindray DP-50 with a 38mm7.5 MHZ central frequency linear transducer 75L38EA wasemployed. The ultrasound images produced by the systemwere captured through a commercial video capture card (TC-540N1). The final video with a 30 Hz frame rate was saved inthe computer for a further analysis. Trigno Wireless System(Delsys Inc., USA) was used to collect sEMG signals. Thesampling frequency was set to 2000 Hz. Furthermore, inExperiment 2, a 5DT Data Glove (5DT Inc., USA) with14 strain gauges was employed, and 5 corresponding straingauges were used to record the MCP joint angles of eachfinger.
Fig. 2. Experiment setup. The subjects would perform different finger motionsfollowing a prompt video in Experiment 1. The difference in Experiment 2is that the subjects were asked to wear a data glove to collect the MCP jointangles.
Considering the fairness of the comparison, both the sEMGsensors and the ultrasound probe were placed on the forearmto ensure simultaneous data acquisition. All the superficialfinger-related muscles were selected at first, then eight sEMGsensors were used and each sEMG sensor was attached on theskin above the corresponding muscle. As each EMG sensorwas placed, its position was adjusted to make sure the sEMGsignals from corresponding muscle could be properly detected.The eight sEMG sensors were attached on the skin abovethe following muscles: flexor pollicis longus, flexor digitorumsuperficialis, flexor digitorum superficialis, flexor digitorumprofundusa, extensor digiti minimi, extensor digitorum, ab-ductor pollicis longus and extensor pollicis longus [14], [15].When attaching the sEMG sensors, the position of ultrasoundprobe was taken into consideration. The probe was fixed on thesubjects’ forearm which was approximately 6cm away fromthe wrist and perpendicular to the ulna using a customizedcuff. The details about the sensor placement are shown in Fig.3.
41 32
57 68
Ultrasound probe
Fig. 3. The placement of the sEMG sensors and ultrasound probe.
B. Experiment Scenarios
1) Experiment 1: Discrete Finger Motion Recognition: Inthis experiment, the subjects were asked to sit in front oftwo computer screens. One was used to instruct the subjectsto complete corresponding finger motions while the otherwas used to show the acquired ultrasound images and sEMGsignals. Initially, the forearm of each subject was cleaned withmedical alcohol. Then eight sEMG sensors were attached tothe predefined positions. Before fixing the ultrasound probe,ultrasound gel was applied between the probe and the skin toreduce acoustic impendence between them. The subjects wereinstructed to hold their forearms supine on the table in orderto avoid probe shifting with the influence of gravity. Finally,the predefined 14 finger motions including rest state in Fig.4 were performed. There were 10 trials’ experiments in total.In each trial, the subjects were required to perform above 14different motions once. Each motion was held for 5 secondsfollowed by a 5-second rest. After completing the first 5 trials,the subjects took a 5 minutes’ rest to avoid muscle fatigue.
2) Experiment 2: Continuous Decoding of MCP Joint An-gles: The preparation process of the Experiment 2 was nearlyas same as Experiment 1. The difference was that the subjectswere required to wear a data glove. During this experiment, thesubjects were asked to move their five fingers with instruction.Each finger’s movement was non-periodic and lasted for 60seconds, between various finger movements, there were 2 min-utes’ rest time to avoid muscle fatigue. The ultrasound images,sEMG signals and the MCP joint angles were collected forfurther analysis simultaneously.

4
Fig. 4. The experimental paradigm, including 5 single finger motions, 2double finger motions, 2 triple finger motions, 2 four finger motions, handopen, fist and rest.
IV. METHODOLOGY
A. Synchronization between Different Signals
At the stage of data acquisition, it was hard to ensure thatall the equipment started to gather data simultaneously, whichwould have significant effect on predicting the MCP jointangles of each finger. To solve this problem, the subjects wereasked to fist five times quickly at the beginning of Experiment2, when the ultrasound images, sEMG signals and glovedata were collected. Preprocessing was applied to extract thefeatures of ultrasound images and sEMG signals as introducedin section IV-B. After normalization and resampling, thecross-correlations between MCP angles of middle finger andthe principal components of the sEMG features, ultrasoundfeatures were estimated respectively based on Equation 1 [29].
Rxy(m) =
N−m−1∑
n=0xn+my∗n, m ≥ 0
Ryx(−m), m < 0(1)
Where x and y are two different signals, N is the lengthof the signal and the asterisk denotes complex conjugation.Cross-correlation is a widely used method in signal processingto determine the delay time of two signals. The coordinateof the maximum value in cross-correlation Rxy is relatedto delay time between the signals as shown in Equation 2.The frequency represents the frequency of the signal afterresampling.
delay = {arg maxm
R(m)}/frequency (2)
A specific subject’s example is shown in Fig. 5. Initial-ly, the cross-correlation between sEMG features’ principalcomponent and the glove data, the ultrasound image fea-tures’ principal component and the glove data were calculatedrespectively. Latter, Equation 2 was used to determine thedelay. For this subject, the EMG signals were 1.24 secondsbehind the glove data while the glove data was 0.29 secondsbehind the ultrasound images. This method was acceptable
for eliminating the primary time-delay between signals in theExperiment 2. It is noteworthy that time-calibration is neededonly once for each subject, because the data of three sensors iscontinuously collected without a break no matter during fingermovements or rest.
Fig. 5. Time delay between sEMG signals and glove data, ultrasound imagesand glove data. The upper two figures show the glove data and the signals’principal component after resampling, and the lower two figures show thecross-correlation results between them.
B. Feature Extraction
1) sEMG Feature Extraction: Feature extraction is a crucialstep for pattern recognition. For sEMG based hand gesturerecognition, there are many kinds of feature extraction meth-ods [4]. TD features applied in this study were first proposedby Hudgins et al. and have been proved to be features withsuperior classification performance [30]–[32]. Initially, theraw sEMG signals were segmented into a series of movingwindows with 200 milliseconds’ length and 50 milliseconds’step. Latter, the TD features, namely, mean absolute value(MAV), number of zero crossings (ZC), waveform length(WL) and number of slope changes (SSC) were extractedfrom each window. Since eight sEMG sensors were used andthe features were concatenated together, the feature vector ofsEMG signals was 32 dimensions. Each motion lasted for5 seconds and 2 seconds’ signals were selected as stablesignals for each finger motion. Eight subjects participated inthe experiment. There were 10 trials for each subject and14 finger motions in each trial. Considering the rest state,which was regard as one kind of motion, accounted for halfof the experimental time, the whole number of samples were26×10×36.
As for Experiment 2, the MAV feature was extracted fromthe sEMG signals. The window length and the overlap lengthwere the same as Experiment 1. Both the features and the angledata were filtered by applying a 2nd order Butter-worth filterwith a 10 Hz cut-off frequency [14]. Then, the sEMG featuresand the MCP joint angles of each finger were resampled to thesame frequency. The time delay between features and MCPjoint angles can be eliminated by the method mentioned insection IV-A.

5
2) Feature Extraction of Ultrasound Images: In the field ofultrasound-based HMI, there are mainly two feature extractionmethods. The first method is to extract features from the imagesequences, for instance optical flow and correlation methods[21] [22]. The second approach is to extract features from thestatic ultrasound images such as a spatial first-order feature [5].The B-mode ultrasound probe consisted of multiple transducerelements, each element in the linear probe of the B-modeequipment can be regarded as a single-element transducer usedin A-mode ultrasound. In addition, using the whole ultrasoundimages to classify finger motions seemed redundant, becausethe different parts of the image were highly related because ofsynergic movement of muscles. Hence, the feature used in thisstudy did not focus on the whole image, but only 5 columns ofthe image were chosen, which were uniformly selected fromthe original ultrasound image. The data of each column ofthe B-mode ultrasound image can be considered as the dataderived from A-mode ultrasound. By this means, the data usedin this paper can be considered as A-mode ultrasound signal.
An external video graphics array (VGA) connector wasapplied to grab the ultrasound video from adopted B-modeultrasound system. Initially, the unrelated area in the video waseliminated in order to obtain the image sequences which onlycontained the ultrasound images with respect to the forearmmuscles. The color images were then transformed to grayimages and the gray values were scaled to the range of 0-1 for further processing.
As mentioned in sEMG signals preprocessing, 36 imageswere uniformly selected from the 2nd second to the 4thsecond in a 5-second motion period. Latter, five columns’ datafrom each selected ultrasound image was chosen evenly. Eachcolumn’s data was segmented into several windows with asegmentation-length of 20 pixels. In each window, the linearfitting was used for fitting the data. The fitting coefficientswere noted as the features. Hence the whole sample numberof ultrasound images was as same as sEMG signals. The wholefeature extraction flow chart is shown in Fig. 6.
(b)
(c)
(a)
Feature = (a1 ,b1… ai ,bi … an ,bn)
N=channel number * window numbery = ai x+bi
Fig. 6. The overall schematic of ultrasound image feature extraction.
In Experiment 2, the feature extraction process of ultrasoundimages was almost the same as that in Experiment 1. Thefeature vectors of ultrasound images and the finger anglesfrom data glove were both filtered by a 2nd order butterworthfilter with a cut-off frequency of 10 Hz. The feature vectorswere resampled to the same frequency and the time delay wasremoved. Finally, principal component analysis (PCA) wasapplied to reduce the dimension of original feature space to 12
dimensions. All the procedures of data processing in this ex-periment were performed off-line. The raw data was separatedinto multiple windows and the features were extracted fromsegmented windows. The data were divided into two sections,one was for training the classifier model and the other wasfor testing. For Experiment 2, before the feature vectors weretransferred to the classifier model, filtering, resampling andsynchronization process were conducted.
Raw dataUltrasound images
sEMG
Feature extraction
Testing data
Model :LDA,MLR,ANN
Filtering, resampling,
synchronization
Filtering, resampling,
synchronization
Training Testing
Output :classification accuracy and MCP joint angle
Training data
Preprocessing and segmentation
Fig. 7. Overall algorithm of sEMG and ultrasound signal processing.
C. Classification and Regression1) Classification of Discrete Finger Motions: LDA is one
of the most commonly used classifiers in myoelectric patternrecognition. It has been proved to be one of the most effectiveclassifiers in this area [31], [32]. Considering the relativefairness of evaluation on ultrasound and sEMG, the LDAclassifier was used in pattern recognition both for ultrasoundimages and sEMG signals. In this part, 2-fold cross-validationwas used for the data being used in this research. The cross-validation was repeated 50 times. For each time, 5 trialsdata was randomly chosen from the whole data set (both forultrasound data set and sEMG data set) to train the classifier,and the remaining data was used for testing. The overallaverage classification accuracy (CA) of the 50 times was thenused to evaluate the performances of ultrasound and sEMG.The CA used in this study was the ratio of the number ofcorrectly classified samples to the number of the whole testingsamples, defined as follows:
CA =number of correctly classified samples
number of the whole test samples×100% (3)

6
2) Regression of Continuous MCP Joint Angles: Artificialneural network (ANN) is the most commonly used methodfor continuous finger movement decoding in sEMG [15]–[17].Castellinis et al. proved that there was a significant linearrelationship between the spatial first-order feature of B-modeultrasound images and the finger angles according to a multiplelinear regression (MLR) [5]. Both the two regression methodswere used in this study.
The entire 60-second data for each finger was separatedinto two parts. The first 30-second data was used to trainthe model and the remaining 30-second data was used toevaluate the model. The evaluation criteria of the regressionwere root mean square deviation (NRMSE) and the correlationcoefficient between predicted finger MCP joint angles y andthe angles y measured by the data glove. The NRMSE andthe correlation coefficient are defined in Equations 4 and 5.
NRMSE =
√(y − y)
T × (y − y)/n
ymax − ymin(4)
correlationyy =
∑ni=1 (yi − y)(yi −¯y)√∑n
i=1 (yi − y)2 ∑n
i=1 (yi −¯y)2
(5)
D. Statistical Analysis
In Experiment 1, one-way ANOVA was used to analyze theperformance of various signals in terms of the CA of the 14discrete finger motions. In Experiment 2, a two-way ANOVAwas used to evaluate the regression accuracy, the factorswere regression methods, linear regression and neural networkregression, and the signal types (sEMG and ultrasound). Thesignificance level of all tests was set as p < 0.05.
V. EXPERIMENT RESULTS
A. Experiment 1: Discrete Finger Motion Recognition
The CA for the eight subjects over 14 different fingermotions is shown in Fig. 8. The average CA for all the subjectsis 95.88% for ultrasound and 90.14% for sEMG. One-wayANOVA analysis demonstrates that the result of the ultrasoundbased method significantly outperforms sEMG base method(p = 0.009). The standard deviation (SD) of the ultrasoundfor each subject is clearly lower (p = 0.005) than that of thesEMG, which indicates that the ultrasound approach performsmore stable for the recognition of different finger motions.Furthermore, the result also shows that there is a significantdifference between four skilled subjects (subject 1, 3, 6 and8) and four inexperienced subjects (subject 2,4,5 and 7) forboth the sEMG and ultrasound based pattern recognition.
The CA confusion matrixs of the sEMG and ultrasoundare given in Fig. 9 and Fig. 10. One-way ANOVA analysisdemonstrates that for each finger motion, the CA of theultrasound is obviously higher than that of the sEMG. Themotion class from 1 to 14 is corresponding to the experimentalparadigm in Fig. 4. Experimental result represents that theaccuracies of thumb flexion and the little finger flexion arerelatively lower for both ultrasound and sEMG. The motion
Subject1 2 3 4 5 6 7 8 AVG
Acc
urac
y
0.7
0.75
0.8
0.85
0.9
0.95
1
1.05
1.1USEMG
Fig. 8. Classification accuracy of the ultrasound (US)-based and sEMG-basedHMI for each subject. The height of the bars denotes the average classificationaccuracy of 14 different finger motions for each subject while error barsrepresent the standard deviation.
pairs whose difference is related to the little finger or thumbhave a higher confusion error rate, such as the pair consistingof class 2 and class 13.
As for ultrasound, the probe width of the ultrasound systemis 38 mm. The muscles, corresponding to thumb and littlefinger movements, are towards the periphery of the visual fieldof the imaging transducer. What’s more, the morphologicalchanges of the muscles related to thumb and little finger isrelatively small. On the other hand, it is hard to detect thesEMG signals of the deep muscles, as there is a crosstalkbetween different muscles. The related sEMG signals of littlefinger or thumb are relatively weaker. However, there mightexist some relationship between the muscle morphologicalchanges and sEMG signals since the distribution of confusionerror rates of different motions is a little similar for ultrasoundand sEMG.
B. Experiment 2: Continuous Decoding of MCP Joint Angles
1) Signal Correlation: Fig. 11 shows that the correlationcoefficients of the predicted and actual MCP joint angles.When using sEMG and MLR, sEMG and ANN, ultrasoundand MLR, and ultrasound and ANN, the correlation coeffi-cients are 0.75 ± 0.11, 0.81 ± 0.09, 0.86 ± 0.08 and 0.89 ±0.07 respectively. A two-way ANOVA analysis demonstratesthat both the regression methods, MLR or ANN, and the signaltypes, ultrasound or sEMG, have a significant effect on theprediction accuracy. The p value for regression methods is0.016 which implies that the ANN performs significantly betterthan the MLR. The ultrasound makes a more precise predictionthan its counterpart (p=0.007). The p value of interaction is0.0001 which indicates that the combination of ANN andultrasound can obtain the best regression performance in thissituation. Compared with the MLR, the ANN can deal withsome nonlinear situations and it is more robust since theregularization is considered in the model.
2) NRMSE: Fig. 12 shows the average normalized rootmean square error (NRMSE) of the predicted and actual MCPjoint angles under four different situations: sEMG and MLR,

7
98.78%
0.60%
1.32%
0.29%
0.47%
1.57%
0.01%
0.41%
0.06%
1.87%
0.13%
1.54%
0.11%
0.26%
0.06%
78.85%
0.70%
0.14%
0.06%
2.67%
1.30%
0.00%
0.28%
2.77%
0.08%
0.45%
6.29%
0.03%
0.17%
0.21%
88.57%
0.42%
0.02%
1.13%
3.68%
0.01%
0.09%
0.00%
0.62%
3.49%
0.00%
3.03%
0.08%
1.21%
0.05%
96.94%
1.24%
0.91%
0.99%
0.04%
1.97%
0.04%
1.46%
0.31%
0.03%
0.04%
0.09%
0.00%
0.00%
0.17%
95.08%
0.24%
0.02%
0.28%
0.38%
0.56%
0.19%
0.05%
0.04%
0.00%
0.42%
0.44%
1.78%
0.03%
0.13%
88.14%
2.33%
0.40%
0.24%
0.72%
0.00%
1.56%
1.46%
0.00%
0.01%
1.22%
1.93%
0.24%
0.10%
0.15%
84.91%
0.00%
0.00%
0.00%
0.48%
2.05%
0.01%
0.11%
0.01%
0.33%
0.00%
0.00%
0.75%
0.17%
0.00%
96.28%
0.47%
0.01%
0.35%
0.00%
0.08%
3.35%
0.01%
0.05%
0.00%
0.63%
0.41%
0.01%
0.06%
1.49%
92.09%
0.09%
3.03%
0.54%
0.01%
0.00%
0.18%
4.42%
0.00%
0.07%
0.50%
1.88%
0.90%
0.09%
0.89%
88.28%
0.12%
0.39%
5.32%
0.01%
0.02%
0.00%
0.06%
0.39%
0.74%
0.01%
0.01%
0.19%
2.89%
0.44%
90.83%
0.07%
0.00%
1.95%
0.16%
3.21%
5.33%
0.68%
0.15%
2.18%
4.77%
0.09%
0.53%
1.08%
0.38%
89.19%
0.84%
0.13%
0.02%
9.45%
0.00%
0.00%
0.00%
0.91%
1.02%
0.00%
0.02%
4.14%
0.03%
0.36%
85.82%
0.00%
0.00%
0.00%
0.27%
0.00%
0.36%
0.04%
0.00%
0.71%
0.08%
0.00%
2.31%
0.01%
0.00%
91.08%
Predicted classclass1 class2 class3 class4 class5 class6 class7 class8 class9 class10class11class12class13class14
Tru
e cl
ass
class1
class2
class3
class4
class5
class6
class7
class8
class9
class10
class11
class12
class13
class14
Fig. 9. Classification accuracy confusion matrix of 14 different finger motions for sEMG, using LDA classifier and 2-fold cross-validation. The motion class1 to 14 are corresponding to the experimental paradigm in Fig. 4. The row of each element in the confusion matrix denotes the actual class while the columnindicates the predicted class.
98.55%
1.16%
1.71%
2.00%
0.44%
10.34%
1.60%
0.00%
0.49%
2.32%
0.08%
0.65%
0.91%
0.05%
0.03%
88.86%
0.03%
0.00%
0.00%
0.26%
0.19%
0.00%
0.00%
0.53%
0.00%
1.16%
3.94%
0.00%
0.01%
0.00%
95.88%
0.28%
0.00%
0.02%
0.01%
0.00%
0.00%
0.00%
0.00%
0.80%
0.00%
0.00%
0.09%
0.00%
0.00%
96.75%
0.20%
0.00%
0.00%
0.27%
0.20%
0.00%
0.94%
0.00%
0.00%
0.02%
0.06%
0.02%
0.27%
0.53%
98.90%
0.37%
0.00%
0.26%
0.19%
0.15%
0.05%
0.00%
0.00%
0.03%
0.83%
0.09%
0.49%
0.07%
0.18%
87.64%
0.68%
0.00%
0.02%
0.51%
0.01%
0.05%
0.20%
0.00%
0.15%
0.69%
0.02%
0.08%
0.01%
0.93%
97.48%
0.00%
0.00%
0.04%
0.00%
0.00%
0.30%
0.00%
0.00%
0.00%
0.00%
0.00%
0.00%
0.00%
0.00%
98.15%
0.22%
0.00%
0.02%
0.00%
0.00%
2.66%
0.04%
0.00%
0.00%
0.08%
0.00%
0.00%
0.00%
0.35%
95.87%
0.02%
4.85%
0.00%
0.00%
0.21%
0.09%
0.92%
0.03%
0.02%
0.21%
0.01%
0.00%
0.00%
0.03%
94.09%
0.24%
0.00%
1.94%
0.00%
0.04%
0.00%
0.00%
0.11%
0.06%
0.03%
0.00%
0.26%
2.80%
0.00%
93.52%
0.00%
0.00%
0.51%
0.07%
0.16%
1.54%
0.08%
0.00%
0.05%
0.03%
0.00%
0.00%
0.88%
0.03%
97.05%
0.01%
0.00%
0.04%
8.10%
0.03%
0.00%
0.00%
0.35%
0.02%
0.00%
0.00%
1.45%
0.00%
0.27%
92.69%
0.00%
0.01%
0.00%
0.01%
0.00%
0.00%
0.00%
0.00%
0.71%
0.19%
0.00%
0.26%
0.00%
0.00%
96.51%
Predicted classclass1 class2 class3 class4 class5 class6 class7 class8 class9 class10class11class12class13class14
Tru
e cl
ass
class1
class2
class3
class4
class5
class6
class7
class8
class9
class10
class11
class12
class13
class14
Fig. 10. Confusion matrix of classification accuracy for ultrasound-based HMI. The motion from 1 to 14 are corresponding to the experimental paradigm inFig. 4.
sEMG and ANN, ultrasound and MLR, and ultrasound andANN. The NRMSE under these four conditions are 0.22 ±0.05, 0.19 ± 0.05, 0.19 ± 0.08 and 0.15 ± 0.05, respectively.Two-way ANOVA analysis demonstrates that both the regres-sion methods and the signal types significantly affect the valueof the NRMSE. The p values for regression methods, typesof signals and the interaction are 0.011, 0.002 and 0.0002,respectively. This indicates that the ANN performs better thanthe MLR and ultrasound outperforms sEMG. When usingultrasound together with ANN, the NRMSE can get the mini-
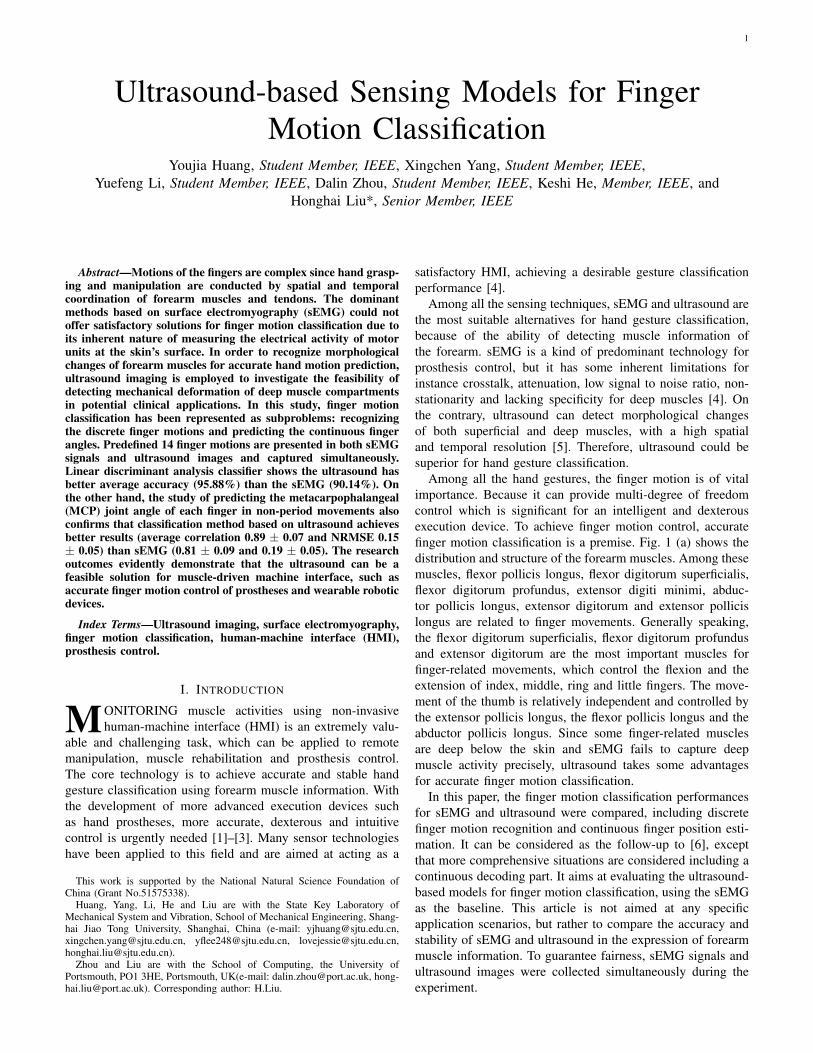
mum value. Fig. 13 shows the predicted and actual MCP jointangles of the index and little fingers for subject 8 with ANN.The correlation coefficients and NRMSE values of the foursub-figures are 0.93 and 0.10 for Ultrasound index, 0.86 and0.13 for sEMG index, 0.89 and 0.15 for Ultrasound little,and 0.67 and 0.27 for Ultrasound little, respectively.

8
Subject1 2 3 4 5 6 7 8 AVG
Cor
rela
tion
0.4
0.5
0.6
0.7
0.8
0.9
1
1.1
1.2
EMG_MLREMG_ANNUS_MLRUS_ANN
(a)
Finger1 2 3 4 5
Correlation
0.5
0.6
0.7
0.8
0.9
1
1.1
1.2EMG_MLREMG_ANNUS_MLRUS_ANN
(b)
Fig. 11. The correlation coefficient of the predicted and actual joint angles. The different color bars denote the correlation and its standard deviation underfour different situations: sEMG and MLR, sEMG and ANN, ultrasound and MLR, and sEMG and ANN. The x-axis label represents the eight different subjects(a) and five different MCP joint angle of the fingers (b) respectively.
Subject1 2 3 4 5 6 7 8 AVG
NR
MS
E
0
0.05
0.1
0.15
0.2
0.25
0.3
0.35
0.4EMG_MLREMG_ANNUS_MLRUS_ANN
(a)
Finger1 2 3 4 5
NRMSE
0
0.05
0.1
0.15
0.2
0.25
0.3
0.35
0.4 EMG_MLREMG_ANNUS_MLRUS_ANN
(b)
Fig. 12. The NRMSE of the predicted and actual joint angles for sEMG and ultrasound. The different color bars denote the NRMSE and its standard deviationunder four different situations described above. The x-axis label represents the eight different subjects (a) and five different MCP joint angles of the fingers(b) respectively.
VI. DISCUSSIONS
A. Experiment Design
The aim of this study is to evaluate the performance ofultrasound-based HMI in finger motion recognition in com-parison with the dominant sEMG-based methods. The study isgiven priority to the classification of the more dexterous handgestures. The design of this experiment ensures the fairnessof the evaluation by collecting both the sEMG signals andthe ultrasound images simultaneously in the same situation,avoiding the influence of some irrelevant factors. The inter-ference between these two kinds of sensors is also proved tobe non-existent. When attaching the sEMG sensors at first,we found there was no obvious changes for sEMG signalswhether the ultrasound probe was used or not, and vice versa.This phenomenon may imply that these two kinds signalscan be used in some special fields such as sensor fusionor feedback of the actual control. For example, ultrasound
imaging can be used to classify hand gestures while sEMGcan be used for force estimation. The placement of sEMGelectrodes and ultrasound probe may be impractical in somesituations, while this study focuses on the comparison ofmonitoring the muscle activities of these two methods, theplacement of the sensors give the priority to sEMG and it’scompletely fair for sEMG. On the other hand, considering thecompleteness of the evaluation, the whole experiment in thisstudy is decomposed into two part: recognizing the discretefinger motions and predicting the continuous finger angles.
Recently, Zheng et al. and Sikdar et al. have studied the dis-crete finger motion recognition based on the ultrasound images[21], [22], and Castellini et al. have done some researcheson continuous finger angle prediction using ultrasound [5].However, these researches didn’t give a comprehensive com-parison of ultrasound and sEMG based HMIs, to strength thesuperiority of the ultrasound-based HMI in prosthesis control.Moreover, the hand gestures selected in the past researches
9
time/s30 40 50 60
rela
tive
angl
e
-0.5
0
0.5
1
1.5Ultrasound_index
time/s30 40 50 60
rela
tive
angl
e
-0.5
0
0.5
1
1.5Ultrasound_little
time/s30 40 50 60
rela
tive
angl
e
-0.5
0
0.5
1
1.5EMG_index
time/s30 40 50 60
rela
tive
angl
e
-0.5
0
0.5
1
1.5EMG_little
glove datapredicted data
Fig. 13. The predicted and actual MCP joint angles of the index and littlefingers for subject 8. The correlation coefficients and NRMSE values of thefour sub-figures are 0.93 and 0.10 for Ultrasound index, 0.86 and 0.13for sEMG index, 0.89 and 0.15 for Ultrasound little, 0.67 and 0.27 forUltrasound little, respectively.
were always related to single finger motion. Finger motionssuch as hand grasping and manipulation, which were alwaysconducted by spatial and temporal coordination of forearmmuscles, were complex. The finger motions used in this studycontained not only single finger flexion but also combinedfinger motions. In Sikdar’s recent research, more hand gestureshave been taken into consideration, but his study focused onthe situation that the elbow was in different positions [24]. Allthe finger-related muscles in the forearm were involved in theexperiment paradigm designed in this study. Therefore, thisexperiment provides a fair and comprehensive comparison ofultrasound and sEMG based HMIs for not only single fingerflexion but also combined finger motions recognition.
B. Methods
All the data processing procedures were designed as similaras possible for both the sEMG and ultrasound in order toensure the experiment results to be comparative, althoughthere may be some unavoidable alterations when some motionchanges happened in the feature extraction stage.
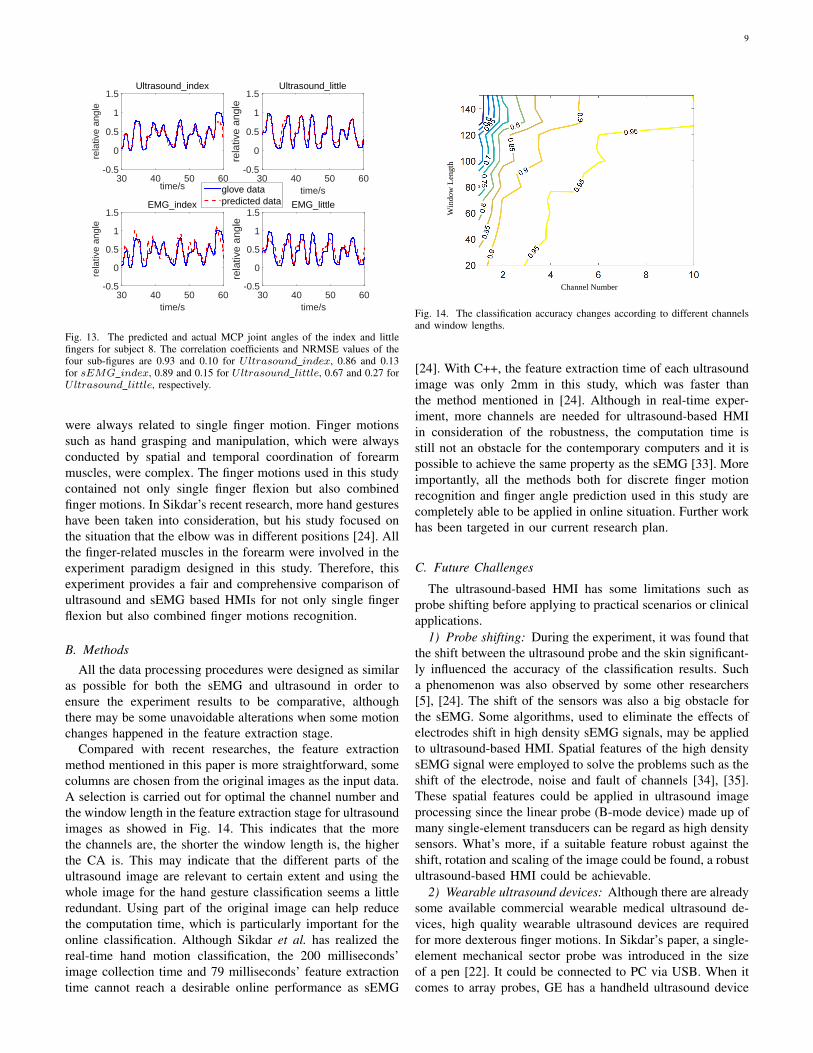
Compared with recent researches, the feature extractionmethod mentioned in this paper is more straightforward, somecolumns are chosen from the original images as the input data.A selection is carried out for optimal the channel number andthe window length in the feature extraction stage for ultrasoundimages as showed in Fig. 14. This indicates that the morethe channels are, the shorter the window length is, the higherthe CA is. This may indicate that the different parts of theultrasound image are relevant to certain extent and using thewhole image for the hand gesture classification seems a littleredundant. Using part of the original image can help reducethe computation time, which is particularly important for theonline classification. Although Sikdar et al. has realized thereal-time hand motion classification, the 200 milliseconds’image collection time and 79 milliseconds’ feature extractiontime cannot reach a desirable online performance as sEMG
Channel Number
Win
dow
Len
gth
Fig. 14. The classification accuracy changes according to different channelsand window lengths.
[24]. With C++, the feature extraction time of each ultrasoundimage was only 2mm in this study, which was faster thanthe method mentioned in [24]. Although in real-time exper-iment, more channels are needed for ultrasound-based HMIin consideration of the robustness, the computation time isstill not an obstacle for the contemporary computers and it ispossible to achieve the same property as the sEMG [33]. Moreimportantly, all the methods both for discrete finger motionrecognition and finger angle prediction used in this study arecompletely able to be applied in online situation. Further workhas been targeted in our current research plan.
C. Future Challenges
The ultrasound-based HMI has some limitations such asprobe shifting before applying to practical scenarios or clinicalapplications.
1) Probe shifting: During the experiment, it was found thatthe shift between the ultrasound probe and the skin significant-ly influenced the accuracy of the classification results. Sucha phenomenon was also observed by some other researchers[5], [24]. The shift of the sensors was also a big obstacle forthe sEMG. Some algorithms, used to eliminate the effects ofelectrodes shift in high density sEMG signals, may be appliedto ultrasound-based HMI. Spatial features of the high densitysEMG signal were employed to solve the problems such as theshift of the electrode, noise and fault of channels [34], [35].These spatial features could be applied in ultrasound imageprocessing since the linear probe (B-mode device) made up ofmany single-element transducers can be regard as high densitysensors. What’s more, if a suitable feature robust against theshift, rotation and scaling of the image could be found, a robustultrasound-based HMI could be achievable.
2) Wearable ultrasound devices: Although there are alreadysome available commercial wearable medical ultrasound de-vices, high quality wearable ultrasound devices are requiredfor more dexterous finger motions. In Sikdar’s paper, a single-element mechanical sector probe was introduced in the sizeof a pen [22]. It could be connected to PC via USB. When itcomes to array probes, GE has a handheld ultrasound device
10
VSCAN, which integrates the probe and its backend in the sizeof a smartphone. Philips Lumify is a new comer in this field,which provides a linear array probe subscription service. Theprobe can be connected to any Android phones and ultrasoundimages are displayed directly on the phone. Konica MinoltaSonimage P3 is another handhold ultrasound machine in asimilar size, with limited choices of probes. All of the devicesmentioned above are able to provide high-quality B-modeultrasound images and can be wearable. In our research group,a wearable ultrasound device is under development, which canuse multiple large-scale single element transducers (A-modeultrasound transducer) to inspect muscle information. By thismeans, the data processing can be simplified and the systemcan be wearable and cost-effective [23].
3) Classification robustness: The problem of gesture clas-sification robustness will be focused on in future as well,which is crucial in clinical application. To achieve robustfinger motion recognition, various features and classifierswill be tried, and deep learning method will be taken intoconsideration, which has been applied in tumor classificationwith a small ultrasound dataset [36].
VII. CONCLUSION
In this study, we evaluated the performance of the sEMG-based HMI and the ultrasound-based HMI in terms of fingermotion classification. The results have demonstrated that theultrasound performed significantly better than the sEMG insuch a more dexterous and accurate control. Further, we havediscussed the problems of the ultrasound-based HMI in detailand provided some feasible suggestions on its further explo-ration. This study confirms that the ultrasound-based HMI hasthe potential to replace the sEMG-based HMI, especially formore accurate control and dexterous manipulation.
REFERENCES
[1] M. S. Johannes, J. D. Bigelow, J. M. Burck, S. D. Harshbarger, M. V.Kozlowski, and T. Van Doren, “An overview of the developmentalprocess for the modular prosthetic limb,” Johns Hopkins APL TechnicalDigest, vol. 30, no. 3, pp. 207–216, 2011.
[2] Pan-American Health Organization, International Federation for Medicaland Biological Engineering, and Institute of Electrical and ElectronicsEngineers, Eds., 2009 Pan American health care exchanges (PAHCE2009): Mexico City, Mexico, 16 - 20 March 2009 ; [conference,workshops, and exhibits, cooperation/linkages]. Piscataway, NJ: IEEE,2009.
[3] C. Lake and R. Dodson, “Progressive upper limb prosthetics,” Phys.Med. Rehabil. Clin. N. Am., vol. 17, no. 1, pp. 49–72, 2006.
[4] Y. Fang, N. Hettiarachchi, D. Zhou, and H. Liu, “Multi-Modal SensingTechniques for Interfacing Hand Prostheses: A Review,” IEEE SensorsJournal, vol. 15, no. 11, pp. 6065–6076, Nov. 2015.
[5] C. Castellini, G. Passig, and E. Zarka, “Using Ultrasound Images ofthe Forearm to Predict Finger Positions,” IEEE Transactions on NeuralSystems and Rehabilitation Engineering, vol. 20, no. 6, pp. 788–797,Nov. 2012.
[6] Y. Huang and H. Liu, “Performances of surface emg and ultrasoundsignals in recognizing finger motion,” in Human System Interactions(HSI), 2016 9th International Conference on. IEEE, 2016, pp. 117–122.
[7] J. Rafiee, M. A. Rafiee, F. Yavari, and M. P. Schoen, “Feature extractionof forearm emg signals for prosthetics,” Expert. Syst. Appl., vol. 38,no. 4, pp. 4058–4067, 2011.
[8] S. Shin, R. Langari, and R. Tafreshi, “A Performance Comparison ofEMG Classification Methods for Hand and Finger Motion,” in ASME2014 Dynamic Systems and Control Conference. American Society ofMechanical Engineers, 2014, pp. V002T16A008–V002T16A008.
[9] M. Atzori, A. Gijsberts, I. Kuzborskij, S. Elsig, A.-G. Mittaz Hager,O. Deriaz, C. Castellini, H. Muller, and B. Caputo, “Characterizationof a Benchmark Database for Myoelectric Movement Classification,”IEEE Transactions on Neural Systems and Rehabilitation Engineering,vol. 23, no. 1, pp. 73–83, Jan. 2015.
[10] A. Shafti, R. R. Manero, A. Borg, K. Althoefer, and M. J. Howard,“Designing embroidered electrodes for wearable surface electromyog-raphy,” in Robotics and Automation (ICRA), 2016 IEEE InternationalConference on. IEEE, 2016, pp. 172–177.
[11] Z. Ju, H. Liu, X. Zhu, and Y. Xiong, “Dynamic Grasp RecognitionUsing Time Clustering, Gaussian Mixture Models and Hidden MarkovModels,” Advanced Robotics, vol. 23, no. 10, pp. 1359–1371, Jan. 2009.
[12] Z. Ju, G. Ouyang, M. Wilamowska-Korsak, and H. Liu, “SurfaceEMG Based Hand Manipulation Identification Via Nonlinear FeatureExtraction and Classification,” IEEE Sensors Journal, vol. 13, no. 9, pp.3302–3311, Sep. 2013.
[13] N. Jiang, K. B. Englehart, P. Parker et al., “Extracting simultaneousand proportional neural control information for multiple-dof prosthesesfrom the surface electromyographic signal,” Biomedical Engineering,IEEE Transactions on, vol. 56, no. 4, pp. 1070–1080, 2009.
[14] L. Pan, D. Zhang, J. Liu, X. Sheng, and X. Zhu, “Continuous estimationof finger joint angles under different static wrist motions from surfaceEMG signals,” Biomedical Signal Processing and Control, vol. 14, pp.265–271, Nov. 2014.
[15] M. Hioki and H. Kawasaki, “Estimation of finger joint angles fromsemg using a recurrent neural network with time-delayed input vectors,”in Rehabilitation Robotics, 2009. ICORR 2009. IEEE InternationalConference on. IEEE, 2009, pp. 289–294.
[16] J. Ngeo, T. Tamei, and T. Shibata, “Continuous estimation of fingerjoint angles using muscle activation inputs from surface emg signals,”in Engineering in Medicine and Biology Society (EMBC), 2012 AnnualInternational Conference of the IEEE. IEEE, 2012, pp. 2756–2759.
[17] R. J. Smith, F. Tenore, D. Huberdeau, R. E. Cummings, and N. V.Thakor, “Continuous decoding of finger position from surface emg sig-nals for the control of powered prostheses,” in Engineering in Medicineand Biology Society, 2008. EMBS 2008. 30th Annual InternationalConference of the IEEE. IEEE, 2008, pp. 197–200.
[18] K. B. Kiesel, T. L. Uhl, F. B. Underwood, D. W. Rodd, and A. J. Nitz,“Measurement of lumbar multifidus muscle contraction with rehabilita-tive ultrasound imaging,” Manual therapy, vol. 12, no. 2, pp. 161–166,2007.
[19] Y. Zheng, M. Chan, J. Shi, X. Chen, and Q. Huang, “Sonomyography:Monitoring morphological changes of forearm muscles in actions withthe feasibility for the control of powered prosthesis,” Medical Engineer-ing & Physics, vol. 28, no. 5, pp. 405–415, Jun. 2006.
[20] J. Shi, Y. Zheng, X. Chen, and Q. Huang, “Assessment of musclefatigue using sonomyography: Muscle thickness change detected fromultrasound images,” Medical Engineering & Physics, vol. 29, no. 4, pp.472–479, May 2007.
[21] J. Shi, J.-Y. Guo, S.-X. Hu, and Y.-P. Zheng, “Recognition of FingerFlexion Motion from Ultrasound Image: A Feasibility Study,” Ultra-sound in Medicine & Biology, vol. 38, no. 10, pp. 1695–1704, Oct.2012.
[22] S. Sikdar, H. Rangwala, E. B. Eastlake, I. A. Hunt, A. J. Nelson, J. De-vanathan, A. Shin, and J. J. Pancrazio, “Novel Method for PredictingDexterous Individual Finger Movements by Imaging Muscle ActivityUsing a Wearable Ultrasonic System,” IEEE Transactions on NeuralSystems and Rehabilitation Engineering, vol. 22, no. 1, pp. 69–76, Jan.2014.
[23] Y. Li, K. He, X. Sun, and H. Liu, “Human-machine interface basedon multi-channel single-element ultrasound transducers: A preliminarystudy,” in e-Health Networking, Applications and Services (Healthcom),2016 IEEE 18th International Conference on. IEEE, 2016, pp. 1–6.
[24] N. Akhlaghi, C. Baker, M. Lahlou, H. Zafar, K. Murthy, H. Rangwala,J. Kosecka, W. Joiner, J. Pancrazio, and S. Sikdar, “Real-time Classifica-tion of Hand Motions using Ultrasound Imaging of Forearm Muscles,”IEEE Transactions on Biomedical Engineering, pp. 1–1, 2015.
[25] C. Castellini and D. S. Gonzalez, “Ultrasound imaging as a human-machine interface in a realistic scenario,” in Intelligent Robots andSystems (IROS), 2013 IEEE/RSJ International Conference on. IEEE,2013, pp. 1486–1492.
[26] J.-Y. Guo, Y.-P. Zheng, L. P. Kenney, A. Bowen, D. Howard, and J. J.Canderle, “A comparative evaluation of sonomyography, electromyog-raphy, force, and wrist angle in a discrete tracking task,” Ultrasound inmedicine & biology, vol. 37, no. 6, pp. 884–891, 2011.
[27] J. Shi, Y.-P. Zheng, Q.-H. Huang, and X. Chen, “Continuous monitoringof sonomyography, electromyography and torque generated by normal

11
upper arm muscles during isometric contraction: sonomyography assess-ment for arm muscles,” Biomedical Engineering, IEEE Transactions on,vol. 55, no. 3, pp. 1191–1198, 2008.
[28] V. Ravindra and C. Castellini, “A comparative analysis of three non-invasive human-machine interfaces for the disabled,” Frontiers in neu-rorobotics, vol. 8, 2014.
[29] P. Stoica and R. L. Moses, Spectral analysis of signals. Pearson/PrenticeHall Upper Saddle River, NJ, 2005.
[30] B. Hudgins, P. Parker, and R. N. Scott, “A new strategy for multifunctionmyoelectric control,” Biomedical Engineering, IEEE Transactions on,vol. 40, no. 1, pp. 82–94, 1993.
[31] K. Englehart, B. Hudgins, P. A. Parker, and M. Stevenson, “Classifi-cation of the myoelectric signal using time-frequency based represen-tations,” Medical engineering & physics, vol. 21, no. 6, pp. 431–438,1999.
[32] M. A. Oskoei and H. Hu, “Support vector machine-based classificationscheme for myoelectric control applied to upper limb,” BiomedicalEngineering, IEEE Transactions on, vol. 55, no. 8, pp. 1956–1965, 2008.
[33] T. R. Farrell and R. F. Weir, “The optimal controller delay for myoelec-tric prostheses,” Neural Systems and Rehabilitation Engineering, IEEETransactions on, vol. 15, no. 1, pp. 111–118, 2007.
[34] A. Stango, F. Negro, and D. Farina, “Spatial correlation of high densityemg signals provides features robust to electrode number and shift inpattern recognition for myocontrol,” Neural Systems and RehabilitationEngineering, IEEE Transactions on, vol. 23, no. 2, pp. 189–198, 2015.
[35] J. M. Hahne, B. Graimann, and K.-R. Muller, “Spatial filtering for robustmyoelectric control,” Biomedical Engineering, IEEE Transactions on,vol. 59, no. 5, pp. 1436–1443, 2012.
[36] J. Shi, S. Zhou, X. Liu, Q. Zhang, M. Lu, and T. Wang, “Stacked deeppolynomial network based representation learning for tumor classifica-tion with small ultrasound image dataset,” Neurocomputing, vol. 194,pp. 87–94, 2016.
Youjia Huang Youjia Huang received the Master’sdegree from the School of Mechanical Engineer-ing, Shanghai Jiao Tong University, Shanghai, Chi-na, in 2017 and the Bachelor’s degree from theSchool of Mechanical Engineering, Jilin University,Changchun, China in 2014.
His research interest lies in machine learningand biological signal processing on hand gestureclassification.
Xingchen Yang received the Bachelor’s degreein mechanical engineering from Tianjin University,Tianjin, Shanghai, China, in 2015. He is currentlypursuing the Ph.D. degree in the School of Mechan-ical Engineering, Shanghai Jiao Tong University,Shanghai, China.
His research interests include biological signalprocessing and machine learning.
Yuefeng Li received the Master’s degree from theSchool of Mechanical Engineering, Shanghai JiaoTong University, Shanghai, China, in 2017.
His research interest lies in ultrasound signalprocessing on hand gesture and prediction and thedevelopment of the ultrasound transducers.
Dalin Zhou received the B.S. degree in automationfrom the University of Science and Technology ofChina, in 2012. He is currently pursuing the Ph.D.degree with the Intelligent System and Biomed-ical Robotics Group, University of Portsmouth,Portsmouth, U.K.
His research interests are signal processing andmachine learning.
Keshi He received the Ph.D. degree from the Schoolof Electronic Information and Electrical Engineer-ing, Shanghai Jiao Tong University, Shanghai, Chi-na, 2015. He is currently working as a postdoc atthe Robotic Institute, Shanghai Jiao Tong University,Shanghai, China.
His research interests include machine learning,image processing, and biological signal processingwith application to upper limb prosthesis control.
Honghai Liu received the Ph.D. degree in roboticsfrom King’s College London, London, U.K., in2003.
He is the Chair Professor of Intelligent Systemsand Robotics, University of Portsmouth, Portsmouth,U.K. His research interests include biomechatronics,pattern recognition, intelligent video analytics, intel-ligent robotics, and their practical applications withan emphasis on approaches that could make contri-bution to the intelligent connection of perception toaction using contextual information.
Prof. Liu is a fellow of the Institution of Engineering and Technology. He isan Associate Editor of the IEEE TRANSACTIONS ON HUMAN MACHINESYSTEMS, IEEE TRANSACTIONS ON INDUSTRIAL ELECTRONICS,and IEEE TRANSACTIONS ON INDUSTRIAL INFORMATICS.