ultrasound assessment of antibiotic-induced pulmonary reaeration
TRANSCRIPT

Ultrasound assessment of antibiotic-induced pulmonary reaerationin ventilator-associated pneumonia*
Belaïd Bouhemad, MD, PhD; Zhi-Hai Liu, MD; Charlotte Arbelot, MD; Mao Zhang, MD;Fabio Ferarri, MD, PhD; Morgan Le-Guen, MD; Martin Girard, MD; Qin Lu, MD, PhD;Jean-Jacques Rouby, MD, PhD
I n critically ill patients with acutelung injury, pulmonary aerationmay be reliably assessed usingbedside lung ultrasound (LUS)
(1). Normal aeration is detected as thevisualization of the pleural line with itscharacteristic lung sliding and artifactualhorizontal A-lines (2). Pulmonary inter-stitial syndrome, which induces a moder-ate decrease in lung aeration caused bythe thickening of interlobular septa, isdetected as the presence of multiple and
regularly spaced vertical B-lines (comettails), at least 7 mm apart (3). Alveolar-interstitial edema resulting from the ir-ruption of liquid within the alveolar spacecorresponds to the computed tomogra-phy (CT) entity of ground glass and isdetected as abutting comet tails �3 mmapart (3). Lung consolidation appears as atissue structure whose dimensions do notvary with respiratory movements andwhich contains white points character-ized by an inspiratory reinforcement, cor-
responding to persisting aeration of distalbronchioles (4).
CT is the reference method for mea-suring lung aeration and its variations (5,6). CT requires the transportation of thepatient outside the intensive care unit (7)and exposes the patient to high radiationexposure (8), two limitations that pre-clude that routine use of CT in clinicalpractice. In addition, quantitative analy-sis of lung aeration is time consumingand requires much training. As differentultrasound patterns correspond to differ-ent degrees of aeration loss, therapeuticinterventions aimed at increasing lungaeration, such as positive end-expiratorypressure or antimicrobial therapy fortreating ventilator-associated pneumonia(VAP), should result in LUS changes. Ifthe whole lung is examined, LUS mightbe accurate enough to quantify lung re-aeration.
A prospective study was undertaken tocompare the accuracy of bedside chestradiography (CRx) and LUS for measur-ing lung reaeration resulting from theadministration of antibiotics in patients
Objectives: To compare lung reaeration measured by bedsidechest radiography, lung computed tomography, and lung ultra-sound in patients with ventilator-associated pneumonia treatedby antibiotics.
Design: Computed tomography, chest radiography, and lungultrasound were performed before (day 0) and 7 days followinginitiation of antibiotics.
Setting: A 26-bed multidisciplinary intensive care unit in LaPitie-Salpetriere hospital (University Paris–6).
Patients: Thirty critically ill patients studied over the first 10days of developing ventilator-associated pneumonia.
Interventions: Antibiotic administration.Measurements and Main Results: Computed tomography re-
aeration was measured as the additional volume of gas presentwithin both lungs following 7 days of antimicrobial therapy. Lungultrasound of the entire chest wall was performed and fourentities were defined: consolidation; multiple irregularly spacedB-lines and multiple abutting ultrasound lung “comets” issued
from the pleural line or a small subpleural consolidation; normalaeration. For each of the 12 regions examined, ultrasoundchanges were measured between day 0 and 7 and a reaerationscore was calculated. An ultrasound score >5 was associatedwith a computed tomography reaeration >400 mL and a success-ful antimicrobial therapy. An ultrasound score <–10 was asso-ciated with a loss of computed tomography aeration >400 mLand a failure of antibiotics. A highly significant correlation wasfound between computed tomography and ultrasound lung re-aeration (Rho � 0.85, p < .0001). Chest radiography was inac-curate in predicting lung reaeration.
Conclusions: Lung reaeration can be accurately estimated withbedside lung ultrasound in patients with ventilator-associatedpneumonia treated by antibiotics. Lung ultrasound can also detectthe failure of antibiotics to reaerate the lung. (Crit Care Med 2009;39:000–000)
KEY WORDS: ventilator-associated pneumonia; lung ultrasound;alveolar recruitment
*See also p. xxx.From the Reanimation Polyvalente Pierre Viars,
Department of Anesthesiology and Critical Care, Hopi-tal de la Pitie-Salpetriere Assistance Publique Hopitauxde Paris, Paris, France; Universite Pierre et Marie CurieParis-6, Paris, France (BB, FF, ML, CA, MG, QL, JJR);and Department of Emergency Medicine, Second Af-filiated Hospital, Zhejiang University, School of Medi-cine, Hangzhou, China (ZH, MZ).
Fabio Ferarri is a research fellow with the Depart-ment of Anesthesiology, Faculdade de Medicina daUniversidade Estadual Paulista Julio de Mesquita Filho,Botucatu, Brazil, and recipient of a postdoctorateaward from CNPQ-Brasil/Processo 201023/2005-9.Martin Girard is a Research Fellow with the Depart-
ment of Anesthesiology and Critical Care, Centre Hos-pitalier de l’Universite de Montreal, Canada, and re-cipient of a scholarship from the Royal College ofPhysicians and Surgeons of Canada.
Presented, in part, at the 19th Annual Congress ofthe European Society of Intensive Care Medicine, Bar-celona, Spain, September 24–27, 2006.
The authors have not disclosed any potential con-flicts of interest.
For information regarding this article, E-mail: [email protected]
Copyright © 2009 by the Society of Critical CareMedicine and Lippincott Williams & Wilkins
DOI: 10.1097/CCM.0b013e3181b08cdb
1Crit Care Med 2009 Vol. 39, No. 12

with VAP. CT of the whole lung served asgold standard for measuring lung reaera-tion.
METHODS
Patients. After gaining approval of the eth-ical committee of La Pitie-Salpetriere hospitaland obtaining written informed consent frompatients’ next of kin, we prospectively included30 consecutive patients with VAP proven byclinical, radiologic, biological, and microbio-logical criteria (9). For each patient, the diag-nosis of VAP was established according to twocriteria: a clinical pulmonary infection score�6 (10) and a positive lower respiratory tractspecimen obtained from a fiberoptic nonpro-tected bronchoalveolar lavage (BAL) or a pro-tected minibronchoalveolar lavage (mini-BAL)(11). A positive sample was defined as �104
colony-forming units/mL for nonprotectedBAL and �103 colony-forming units/mL forprotected mini-BAL (10, 12, 13). In each pa-tient, a transesophageal echocardiographywas performed to rule out systolic and dia-stolic left ventricular dysfunction causingcardiogenic pulmonary edema. Subcutane-ous emphysema and thoracic dressings wereexclusion criteria.
Lung Ultrasound. LUS was performed us-ing an HP-SONOS 5500 (Hewlett-Packard, An-dover, MA) and a 2- to 4-MHz round-tippedprobe. As previously described (1), all inter-costal spaces of upper and lower parts of an-terior, lateral, and posterior regions of left andright chest wall were examined, and videoswere stored on magneto-optical disks. Eachregion of interest was extensively examined,and the worst ultrasound abnormality de-tected was considered as characterizing theregion examined. The mean duration of acomplete ultrasound exam was around 10mins.
Four ultrasound patterns were defined: 1)normal aeration (no bronchopneumonia):presence of lung sliding with A-lines and, oc-casionally, an isolated B-line (2); 2) loss oflung aeration resulting from scattered foci ofbronchopneumonia or interstitial pneumonia:presence of multiple well-defined and irregu-larly spaced ultrasound lung “comets” issuedfrom the pleural line or a small subpleuralconsolidation; 3) loss of lung aeration result-ing from confluent bronchopneumonia: mul-tiple abutting ultrasound lung comets issuedfrom the pleural line (Fig. 1 A) or a smallsubpleural consolidation (Fig. 1B); 4) lungconsolidation characterizing extensive bron-chopneumonia (Fig. 1C): presence of a tissuepattern (14) containing hyperechoic puncti-form images representative of air bron-chograms (15).
An ultrasound lung reaeration score wascalculated from changes in the ultrasoundpattern of each region of interest betweenday 0 and day 7. The method of calculationis summarized in Table 1. Intra- and inter-observer reproducibility of the lung ultra-
sound score was performed by analyzing pa-tient’s lung ultrasound data stored in videofiles either by two different investigatorsblinded to each other’s evaluations and toCT and CRx or by the same investigatortwice at different time intervals.
Bedside Chest Radiography. Anterior por-table radiographs were obtained by using anAMX4 (General Electric, Kawasaki, Japan)with high voltage (120–130 kV) with standard-ized exposure time, focus-film distance, anddegree of exposure. Lung parenchyma was di-
Figure 1. Computed Tomography (CT) section and corresponding ultrasound pattern in a patientwith ventilator associated pneumonia characterized by multiple rounded CT attenuations and con-solidation. Figure 1A shows confluent CT attenuations of the left upper lobe (white arrow) correspondto abutting ultrasound lung comets arising from the pleural line (gray arrow). Figure 1B shows asubpleural and intraparenchymal rounded CT attenuation of the right upper lobe (white arrow),corresponding to irregularly spaced and abutting ultrasound lung comets arising from a subpleuralconsolidation (gray arrow). Figure 1C shows consolidation of right lower lobe with parapneumonicpleural effusion. The white and gray arrows indicate position of the probe.
2 Crit Care Med 2009 Vol. 39, No. 12

vided into 12 regions by cephalocaudal mid-clavicular and transversal hilar lines. Upperlung regions were defined as lung regionsdelineated by the apex, midclavicular, medias-tinal, and hilar lines. Upper and lower lateral
lung regions were defined as lung regionsdelineated by the external limit of the chestwall, midclavicular line, and apex (upper) ordiaphragm (lower). Upper and lower posteriorlung regions were defined as lung regions with
radiologic signs erasing the mediastinum bor-der (silhouette sign) and delineated by themediastinum, midclavicular line, hilar line,and apex (upper) or diaphragm (lower). Pleu-ral effusion, alveolar consolidation, and alveo-lar-interstitial syndrome were defined accord-ing to the terminology recommended by theNomenclature Committee of the FleischnerSociety (16). The extent of lung injury wasassessed as the number of lung regions withradiologic signs suggestive of alveolar consol-idation or alveolar-interstitial syndrome.
Thoracic Computed Tomography. Lungscanning was performed from the apex to thediaphragm without injection of contrast ma-terial during a 15-sec apnea. Contiguous axialCT sections 10 mm thick were reconstructedfrom the volumetric data (17) and recorded onan optical disk. On each CT section, lung paren-chyma was manually delineated. As previouslydescribed (18) using the software Lungview (In-
Table 1. Lung ultrasound reaeration score aimed at evaluating the effects of antibiotics on lungaeration
Quantification of Reaeration Quantification of Loss of Aeration
1 point 3 points 5 points �5 points �3 points �1 pointB13 N B23 N C3 N N3 C N3 B2 N3 B1B23 B1 C3 B1 B13 C B13 B2C3 B2 B23 C
B1, ultrasound lung comets with well-defined and irregular spacing; B2, abutting ultrasound lungcomets; C, alveolar consolidation; N, normal pattern. First, ultrasound lung aeration (N, B1, B2, andC) was measured in each of the 12 regions of interest before (day 0) and after antibiotic administration(day 7). Second, the score of lung reaeration was calculated as the sum of each score characterizingeach region of interest according to the scale table.
Table 2. Computed tomography (CT) lung morphology at day 0 (before antibiotic administration) in the 30 patients with ventilator-associated pneumonia
Patients, No. Left Upper Lobe Right Upper Lobe Left Lower Lobe Right Lower Lobe
Four patients with disseminatedrounded CT attenuations
1 Normal Normal Rounded CT attenuations Normal1 Normal Rounded CT attenuations Rounded CT attenuations Rounded CT attenuations1 Rounded CT attenuations Normal Rounded CT attenuations Rounded CT attenuations1 Rounded CT attenuations Rounded CT attenuations Rounded CT attenuations Rounded CT attenuations
Three patients with lobarconsolidations
1 Normal Normal Normal Consolidation1 Normal Normal Consolidation Consolidation1 Consolidation Normal Consolidation Consolidation
23 patients with disseminatedrounded CT attenuationsand lobar consolidations
5 Rounded CT attenuations Rounded CT attenuations� consolidation
Rounded CT attenuations Rounded CT attenuations� consolidation
2 Rounded CT attenuations Rounded CT attenuations Rounded CT attenuations� consolidation
Rounded CT attenuations� consolidation
1 Rounded CT attenuations� consolidation
Rounded CT attenuations Rounded CT attenuations� consolidation
Rounded CT attenuations
1 Rounded CT attenuations Rounded CT attenuations Rounded CT attenuations� consolidation
Rounded CT attenuations� consolidation
1 Rounded CT attenuations Rounded CT attenuations Rounded CT attenuations� consolidation
Rounded CT attenuations
1 Rounded CT attenuations Rounded CT attenuations Consolidation Rounded CT attenuations� consolidation
2 Rounded CT attenuations Rounded CT attenuations Consolidation Consolidation1 Consolidation Rounded CT attenuations
� consolidationConsolidation Consolidation
1 Rounded CT attenuations Rounded CT attenuations Rounded CT attenuations� consolidation
consolidation
1 Rounded CT attenuations Rounded CT attenuations Rounded CT attenuations consolidation1 Normal Normal Rounded CT attenuations Consolidation1 Normal Rounded CT attenuations
� consolidationRounded CT attenuations
� consolidationRounded CT attenuations
1 Normal Rounded CT attenuations� consolidation
Rounded CT attenuations Rounded CT attenuations
1 Rounded CT attenuations Normal Consolidation Rounded CT attenuations1 Rounded CT attenuations Normal Rounded CT attenuations consolidation1 Rounded CT attenuations Normal Rounded CT attenuations
� consolidationNormal
1 Rounded CT attenuations Normal Rounded CT attenuations� consolidation
Rounded CT attenuations
3Crit Care Med 2009 Vol. 39, No. 12
stitut National des Telecommunications, Evry,France) (19), the total volume of gas was com-puted as (–CT/1000) � total volume (total num-ber of voxels), where CT is the CT attenuation ofvoxels with a CT number �0. Lung reaerationresulting from antibiotics administration wasdefined as the additional volume of gas presentwithin both lungs following 7 days of antimicro-bial therapy.
Protocol. To provide similar conditions ofmeasurements at day 0 and day 7, a time atwhich nearly half of the patients were sponta-neously breathing, CRx, LUS, and CT wereconsecutively performed in the supine posi-tion at zero end-expiratory pressure. Eachexam was separated by a time interval �2 hrs,allowing the reestablishment of positive end-expiratory pressure to avoid prolonged dere-cruitment in mechanically ventilated patients.The posterior zone was examined in the su-pine position using a short probe pointed “tothe sky” and placed between the back and thebed as far as possible toward the spine. Accu-racy of CRx for detecting lung reaeration wasperformed as follows: Radiographies obtainedat day 0 and 7 were blinded, and two indepen-dent radiologists unaware of the clinical, bio-logical, ultrasound, and CT findings statedwhether CRx at day 7 was identical, improved,or deterioratedcompared with day 0. Lung aer-ation was assessed by comparing the extensionof consolidation and alveolar-interstitial syn-drome at day 0 and 7. Intra- and inter-observerreproducibility of CRx assessment was per-formed. After 7 days of antimicrobial therapy,clinical, radiologic (CRx and CT), biological,and microbiological variables were measuredagain. Nonprotected BAL or protected mini-BAL was performed at days 1, 3, and 7. VAPwas considered as successfully treated by an-timicrobial therapy if three criteria were met:1) decrease in clinical pulmonary infectionscore; 2) CT reaeration corresponding to par-tial or complete regression of consolidationsand rounded CT attenuations; and 3) eitherextubation between day 4 and 7 or negativemini-BAL in patients remaining ventilated atday 7.
Statistical Analysis. Normality of data dis-tribution was assessed by a Kolmogorov-Smirnov test. Data with normal distributionare expressed as mean � SD. Data withoutnormal distribution are expressed as medianand interquartile range. Inter- and intra-observer agreements in lung reaeration score(Table 1) determined for each region of inter-est were assessed using the kappa coefficienttest (20). Correlations between ultrasoundlung reaeration score and CT reaerations weretested using Spearman correlation rank anal-ysis. The amount of statistical uncertainty wasassessed by reporting the 95% confidence in-terval. Statistical analysis was performed us-ing NCSS 2004 software (NCSS, Statistical &Power Analysis Software, Kaysville, UT), andstatistical significance level was fixed at .05.
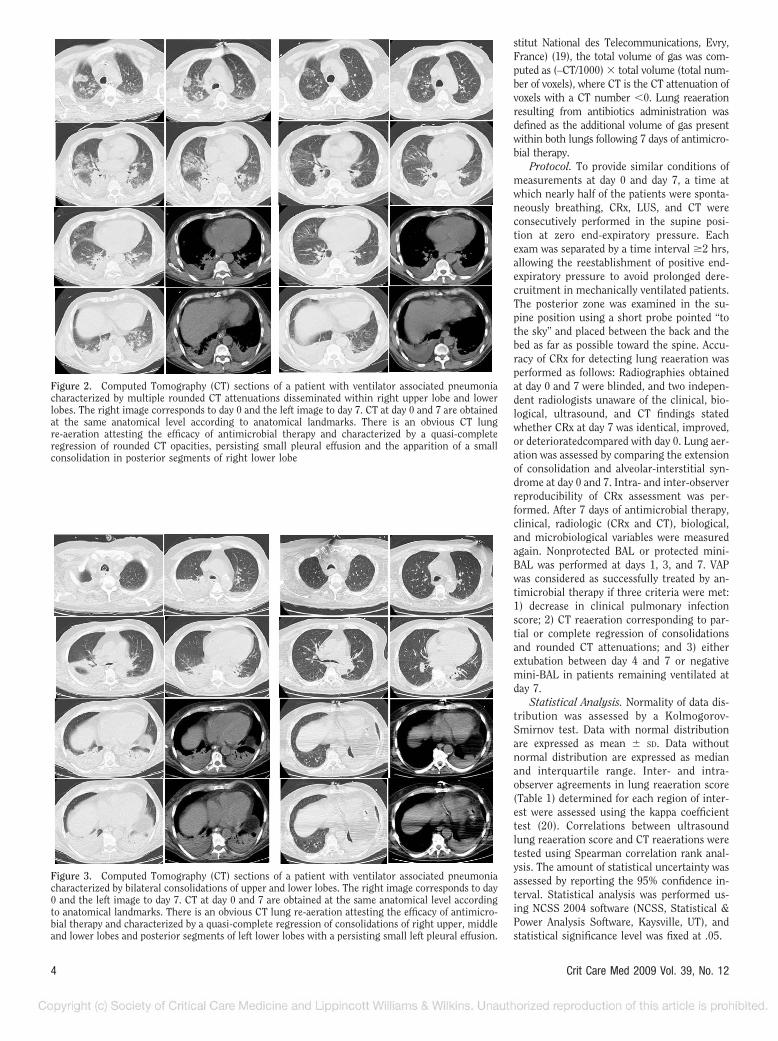
Figure 2. Computed Tomography (CT) sections of a patient with ventilator associated pneumoniacharacterized by multiple rounded CT attenuations disseminated within right upper lobe and lowerlobes. The right image corresponds to day 0 and the left image to day 7. CT at day 0 and 7 are obtainedat the same anatomical level according to anatomical landmarks. There is an obvious CT lungre-aeration attesting the efficacy of antimicrobial therapy and characterized by a quasi-completeregression of rounded CT opacities, persisting small pleural effusion and the apparition of a smallconsolidation in posterior segments of right lower lobe
Figure 3. Computed Tomography (CT) sections of a patient with ventilator associated pneumoniacharacterized by bilateral consolidations of upper and lower lobes. The right image corresponds to day0 and the left image to day 7. CT at day 0 and 7 are obtained at the same anatomical level accordingto anatomical landmarks. There is an obvious CT lung re-aeration attesting the efficacy of antimicro-bial therapy and characterized by a quasi-complete regression of consolidations of right upper, middleand lower lobes and posterior segments of left lower lobes with a persisting small left pleural effusion.
4 Crit Care Med 2009 Vol. 39, No. 12

RESULTS
Patients. Forty one consecutive surgi-cal patients with VAP were prospectivelyscreened for inclusion and 30 included inthe study. Ten were excluded because ofthe presence of large thoracic dressingsand one for the presence of subcutaneousemphysema. Mean age was 58 � 18 yrs.Initial etiology was major vascular sur-gery (n � 14), multiple trauma (n � 10),digestive or urologic surgery (n � 5), andcardiac surgery (n � 1). At inclusion inthe study, the mean Severity Acute Phys-iologic Score was 34 (median, 36; inter-quartile range, 24–42), Lung Injury Se-verity Score (21) was 2.0 � 0.5, and meanClinical Pulmonary Infection score was8.0 (median, 8.0; interquartile range,7.0–9.0), (10). Mortality rate was 7%. Tenpatients had early VAP, caused by sensi-tive bacteria of the oropharyngeal flora inthree and by sensitive Pseudomonasaeruginosa in seven. Twenty patients hadlate VAP caused by P. aeruginosa that wasmultidrug resistant in three patients. Allpatients were treated by a combination ofantibiotics during a 7-day period. In 22patients, VAP was considered as success-fully treated by antimicrobial therapy onthe following arguments: a) the meanClinical Pulmonary Infection Score had
decreased to 4.7 at day 7 (median, 4.5;interquartile range, 3.0–5.0); b) a signif-icant CT reaeration was observed at day 7together with a partial regression or acomplete disappearance of consolidationsand round CT attenuations that werepresent at day 0; c) 14 patients were ex-tubated between day 4 and 7; d) mini-BALs performed in the eight patients whoremained ventilated were negative at day7. In eight patients, VAP was consideredas unsuccessfully treated by antimicro-bial therapy on the following arguments:a) the mean Clinical Pulmonary Infectionscore remained at 5.7 � 1.6 (median, 5.0;interquartile range, 5.0–6.0); b) in fourpatients, no significant CT reaeration wasobserved at day 7, corresponding to per-sisting consolidations and round CT at-tenuations present at day 1; c) in fourpatients, no significant CT reaeration wasobserved at day 7, corresponding to newconsolidations and round CT attenua-tions whereas consolidations and roundCT attenuations present at day 0 had par-tially disappeared; d) the eight patientswere still on mechanical ventilation atday 7; and e) mini-BALs performed in theeight patients were all positive at day 7.Therapeutic failure was related to lack oferadication of causative microorganismin four patients and to secondary lung
infection by another microorganism re-sistive to the antimicrobial therapy infour patients.
Lung Morphology CharacterizingVentilator-Associated Pneumonia. Asshown in Table 2, in four patients (12%),VAP was exclusively characterized by in-traparenchymal and subpleural roundedCT attenuations disseminated within up-per and/or lower lobes (Fig. 2). In threepatients (10%), VAP was exclusively char-acterized by consolidations of lower lobesassociated or not with consolidation ofupper lobes (Fig. 3). In 23 patients (78%),VAP was characterized by an associationof consolidations affecting one or severallobes with intraparenchymal and sub-pleural rounded CT attenuations dissem-inated within upper and/or lower lobes(Fig. 4). Rounded CT attenuations wereeither isolated or confluent, formingmore or less extended ground glass areas.Their size ranged between 1 and 15 mm,and many of them were subpleural, sur-rounded by normally aerated lung paren-chyma.
Accuracy of Bedside CRx for Measur-ing Lung Reaeration After 7 Days of An-tibiotic Administration. CRx was poorlyaccurate for detecting changes in lungaeration following antimicrobial therapy.Among the 22 patients whose VAP wassuccessfully treated by antimicrobialtherapy, CRx remained unchanged inthree, improved in nine, and deterioratedin eight. Among the eight patients whoseVAP was unsuccessfully treated by anti-microbial therapy, CRx remained un-changed in three, improved in two, anddeteriorated in three.
Diagnostic Accuracy of Ultrasound forQuantifying Antibiotic-Induced Lung Re-aeration. As shown in Figure 5, a highlystatistically significant correlation wasfound between CT and ultrasound lungreaeration, considering both or each lungseparately. As shown in Figure 6, LUS wasaccurate for detecting significant varia-tion of aeration. A loss of aeration (failureof antibiotics to treat lung infection)�400 mL was detected by a lung ultra-sound score �–10, and a reaeration�400 mL (success of antibiotics to treatlung infection) was detected by a lungultrasound score �5. Lung ultrasoundscore was less effective for detectingsmaller changes of lung aeration. Intra-and interobserver agreements for esti-mating antibiotic-induced changes inlung aeration were good as attested bykappa coefficients of 0.75 and 0.70, re-spectively.
Figure 4. Computed Tomography (CT) sections of a patient with ventilator associated pneumoniacharacterized by bilateral consolidations of lower lobes and rounded CT attenuations disseminatedwithin upper lobes. The right image corresponds to day 0 and the left image to day 7. CT at day 0 and7 are obtained at the same anatomical level according to anatomical landmarks. There is an obviousCT lung re-aeration attesting of the efficacy of antimicrobial therapy and characterized by a regressionof rounded CT opacities, pleural effusion and consolidation.
5Crit Care Med 2009 Vol. 39, No. 12

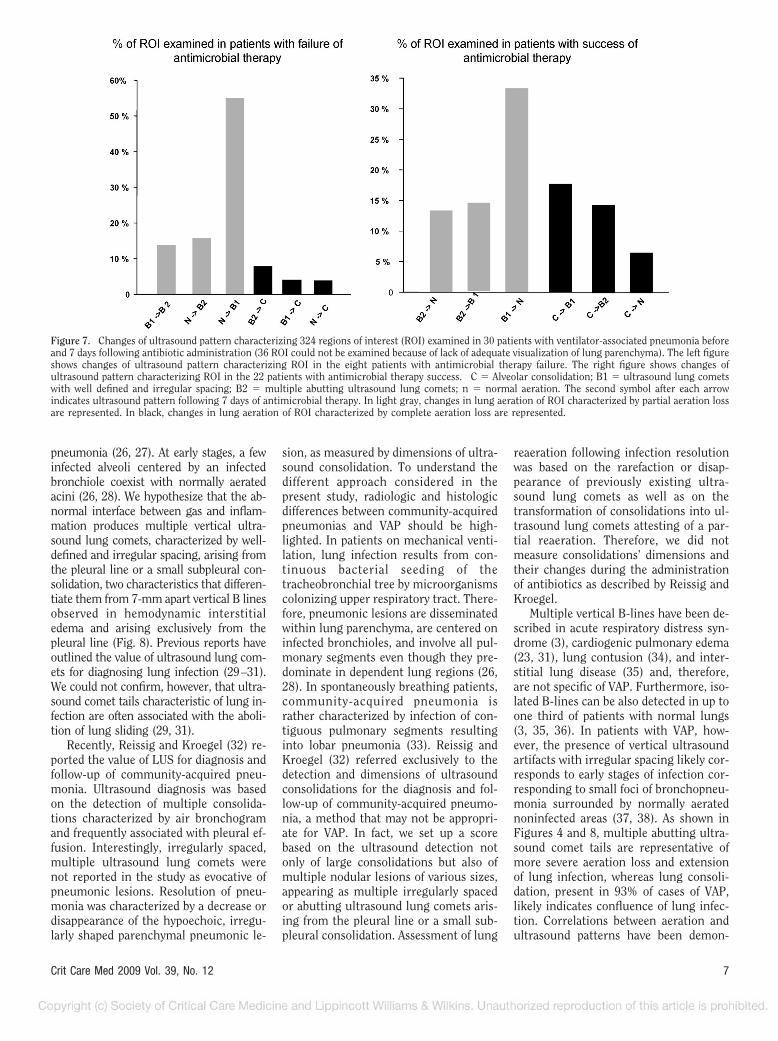
Characteristics of Lung ReaerationFollowing Antibiotic Administration. Atotal of 248 lung regions of interest wereexamined before and after antimicrobialtherapy. As shown in Figure 7, ultra-sound lung reaeration following antibi-otic administration was predominantlycaused by disappearance or growing in-frequency of ultrasound lung comets(61%) and also by transformation of ul-trasound consolidation into ultrasoundlung comets. Inversely, failure of antibi-otics to treat lung infection was charac-terized by the new appearance of ultra-sound lung comets (87%) and, lessfrequently, by the appearance of consoli-dation (3%) or the transformation of ul-
trasound lung comets into consolidation(7%). Such patterns corresponded to CTchanges: Success of antimicrobial ther-apy was characterized by predominantdisappearance of rounded opacities,whereas antibiotic failure was mainlycharacterized by new rounded opacitiesdisseminated within both lungs.
DISCUSSION
This study demonstrates that bedsidelung ultrasound is more appropriate thanbedside chest radiography for quantifyinglung reaeration in patients with ventila-tor-associated pneumonia who are suc-cessfully treated by antibiotics. The com-
parison between CT lung morphologyand corresponding ultrasound patternsobserved in VAP provides a solid rationalefor understanding this result of potentialclinical relevance.
Correlations Between Changes inComputed Tomography Aeration andLung Ultrasound Reaeration Score. Untilnow, the value of LUS for assessingchange in pulmonary aeration has beenreported in a few studies. Tsubo et al (22)reported that positive end-expiratorypressure-induced reaeration of a consoli-dated left lower lobe can be assessed us-ing transesophageal echocardiography.As shown in Figure 6 of the paper, theultrasound tissue pattern characteristicof lung consolidation was replaced byabutting ultrasound lung comets follow-ing positive end-expiratory pressure, in-dicating partial reaeration. Agricola et al(23, 24) showed that an ultrasound scorebased on the total number of comet tailscorrelates with extravascular lung waterand pulmonary artery occlusion pressuremeasured in cardiac patients and pigswith oleic acid-induced lung injury (25).Since increased extravascular lung wateris associated with loss of lung aeration,these studies suggest that LUS can accu-rately detect aeration changes.
Comparison Between CT Lung Mor-phology and Corresponding LUS Pat-terns Characterizing VAP. The infectedlung is characterized by tissue inflamma-tion extending to lung periphery, pre-dominating in lower lobes, and is associ-ated with various degrees of aeration loss,depending on the severity and extension of
Figure 5. Correlations between lung ultrasound re-aeration score and computed tomography (CT)measurement of lung re-aeration in 30 patients with ventilator-associated pneumonia treated byantibiotics during 7 days. Figure 5A: Correlation between overall CT lung re-aeration followingantibiotic administration (mL) and lung ultrasound re-aeration score calculated on both lungs. Figure5B: Correlation between CT right lung re-aeration following antibiotic administration (mL) and rightlung ultrasound re-aeration score calculated on the right lung. Figure 5C: Correlation between CT leftlung re-aeration following antibiotic administration (mL) and left lung ultrasound re-aeration scorecalculated.
Figure 6. Accuracy of lung ultrasound re-aeration score for quantifying changes in lungaeration following antibiotic administration in 30patients with ventilator-associated pneumonia.Each closed circle represents an individual pa-tient.
6 Crit Care Med 2009 Vol. 39, No. 12
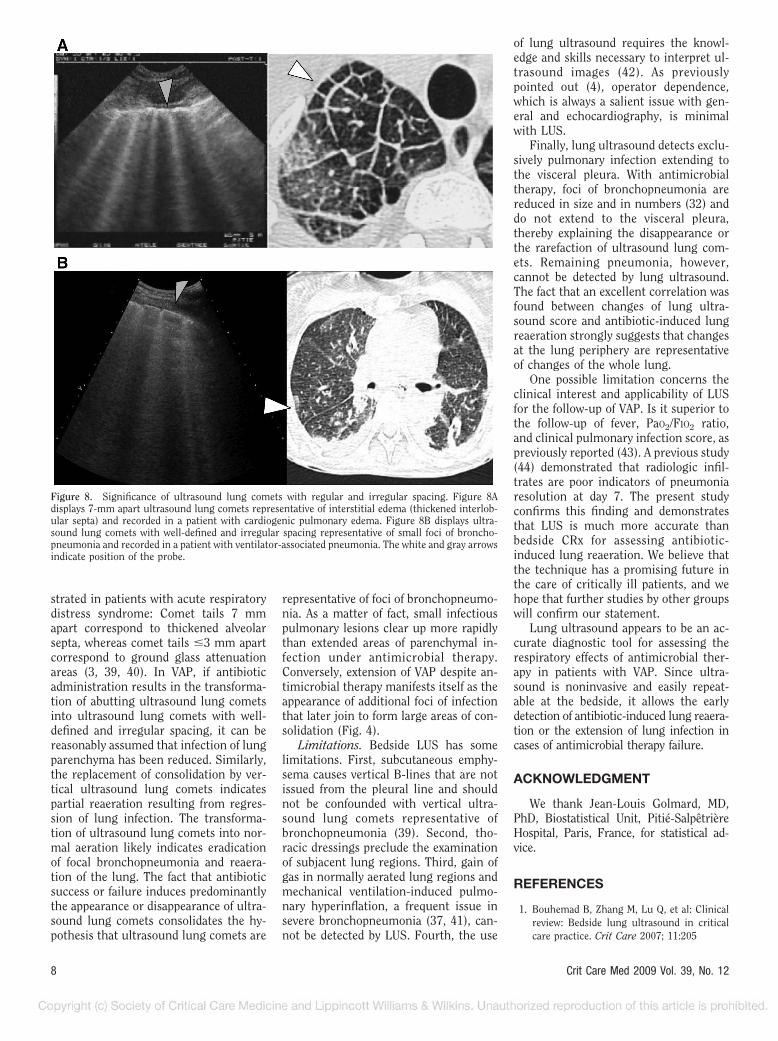
pneumonia (26, 27). At early stages, a fewinfected alveoli centered by an infectedbronchiole coexist with normally aeratedacini (26, 28). We hypothesize that the ab-normal interface between gas and inflam-mation produces multiple vertical ultra-sound lung comets, characterized by well-defined and irregular spacing, arising fromthe pleural line or a small subpleural con-solidation, two characteristics that differen-tiate them from 7-mm apart vertical B linesobserved in hemodynamic interstitialedema and arising exclusively from thepleural line (Fig. 8). Previous reports haveoutlined the value of ultrasound lung com-ets for diagnosing lung infection (29–31).We could not confirm, however, that ultra-sound comet tails characteristic of lung in-fection are often associated with the aboli-tion of lung sliding (29, 31).
Recently, Reissig and Kroegel (32) re-ported the value of LUS for diagnosis andfollow-up of community-acquired pneu-monia. Ultrasound diagnosis was basedon the detection of multiple consolida-tions characterized by air bronchogramand frequently associated with pleural ef-fusion. Interestingly, irregularly spaced,multiple ultrasound lung comets werenot reported in the study as evocative ofpneumonic lesions. Resolution of pneu-monia was characterized by a decrease ordisappearance of the hypoechoic, irregu-larly shaped parenchymal pneumonic le-
sion, as measured by dimensions of ultra-sound consolidation. To understand thedifferent approach considered in thepresent study, radiologic and histologicdifferences between community-acquiredpneumonias and VAP should be high-lighted. In patients on mechanical venti-lation, lung infection results from con-tinuous bacterial seeding of thetracheobronchial tree by microorganismscolonizing upper respiratory tract. There-fore, pneumonic lesions are disseminatedwithin lung parenchyma, are centered oninfected bronchioles, and involve all pul-monary segments even though they pre-dominate in dependent lung regions (26,28). In spontaneously breathing patients,community-acquired pneumonia israther characterized by infection of con-tiguous pulmonary segments resultinginto lobar pneumonia (33). Reissig andKroegel (32) referred exclusively to thedetection and dimensions of ultrasoundconsolidations for the diagnosis and fol-low-up of community-acquired pneumo-nia, a method that may not be appropri-ate for VAP. In fact, we set up a scorebased on the ultrasound detection notonly of large consolidations but also ofmultiple nodular lesions of various sizes,appearing as multiple irregularly spacedor abutting ultrasound lung comets aris-ing from the pleural line or a small sub-pleural consolidation. Assessment of lung
reaeration following infection resolutionwas based on the rarefaction or disap-pearance of previously existing ultra-sound lung comets as well as on thetransformation of consolidations into ul-trasound lung comets attesting of a par-tial reaeration. Therefore, we did notmeasure consolidations’ dimensions andtheir changes during the administrationof antibiotics as described by Reissig andKroegel.
Multiple vertical B-lines have been de-scribed in acute respiratory distress syn-drome (3), cardiogenic pulmonary edema(23, 31), lung contusion (34), and inter-stitial lung disease (35) and, therefore,are not specific of VAP. Furthermore, iso-lated B-lines can be also detected in up toone third of patients with normal lungs(3, 35, 36). In patients with VAP, how-ever, the presence of vertical ultrasoundartifacts with irregular spacing likely cor-responds to early stages of infection cor-responding to small foci of bronchopneu-monia surrounded by normally aeratednoninfected areas (37, 38). As shown inFigures 4 and 8, multiple abutting ultra-sound comet tails are representative ofmore severe aeration loss and extensionof lung infection, whereas lung consoli-dation, present in 93% of cases of VAP,likely indicates confluence of lung infec-tion. Correlations between aeration andultrasound patterns have been demon-
Figure 7. Changes of ultrasound pattern characterizing 324 regions of interest (ROI) examined in 30 patients with ventilator-associated pneumonia beforeand 7 days following antibiotic administration (36 ROI could not be examined because of lack of adequate visualization of lung parenchyma). The left figureshows changes of ultrasound pattern characterizing ROI in the eight patients with antimicrobial therapy failure. The right figure shows changes ofultrasound pattern characterizing ROI in the 22 patients with antimicrobial therapy success. C � Alveolar consolidation; B1 � ultrasound lung cometswith well defined and irregular spacing; B2 � multiple abutting ultrasound lung comets; n � normal aeration. The second symbol after each arrowindicates ultrasound pattern following 7 days of antimicrobial therapy. In light gray, changes in lung aeration of ROI characterized by partial aeration lossare represented. In black, changes in lung aeration of ROI characterized by complete aeration loss are represented.
7Crit Care Med 2009 Vol. 39, No. 12
strated in patients with acute respiratorydistress syndrome: Comet tails 7 mmapart correspond to thickened alveolarsepta, whereas comet tails �3 mm apartcorrespond to ground glass attenuationareas (3, 39, 40). In VAP, if antibioticadministration results in the transforma-tion of abutting ultrasound lung cometsinto ultrasound lung comets with well-defined and irregular spacing, it can bereasonably assumed that infection of lungparenchyma has been reduced. Similarly,the replacement of consolidation by ver-tical ultrasound lung comets indicatespartial reaeration resulting from regres-sion of lung infection. The transforma-tion of ultrasound lung comets into nor-mal aeration likely indicates eradicationof focal bronchopneumonia and reaera-tion of the lung. The fact that antibioticsuccess or failure induces predominantlythe appearance or disappearance of ultra-sound lung comets consolidates the hy-pothesis that ultrasound lung comets are
representative of foci of bronchopneumo-nia. As a matter of fact, small infectiouspulmonary lesions clear up more rapidlythan extended areas of parenchymal in-fection under antimicrobial therapy.Conversely, extension of VAP despite an-timicrobial therapy manifests itself as theappearance of additional foci of infectionthat later join to form large areas of con-solidation (Fig. 4).
Limitations. Bedside LUS has somelimitations. First, subcutaneous emphy-sema causes vertical B-lines that are notissued from the pleural line and shouldnot be confounded with vertical ultra-sound lung comets representative ofbronchopneumonia (39). Second, tho-racic dressings preclude the examinationof subjacent lung regions. Third, gain ofgas in normally aerated lung regions andmechanical ventilation-induced pulmo-nary hyperinflation, a frequent issue insevere bronchopneumonia (37, 41), can-not be detected by LUS. Fourth, the use
of lung ultrasound requires the knowl-edge and skills necessary to interpret ul-trasound images (42). As previouslypointed out (4), operator dependence,which is always a salient issue with gen-eral and echocardiography, is minimalwith LUS.
Finally, lung ultrasound detects exclu-sively pulmonary infection extending tothe visceral pleura. With antimicrobialtherapy, foci of bronchopneumonia arereduced in size and in numbers (32) anddo not extend to the visceral pleura,thereby explaining the disappearance orthe rarefaction of ultrasound lung com-ets. Remaining pneumonia, however,cannot be detected by lung ultrasound.The fact that an excellent correlation wasfound between changes of lung ultra-sound score and antibiotic-induced lungreaeration strongly suggests that changesat the lung periphery are representativeof changes of the whole lung.
One possible limitation concerns theclinical interest and applicability of LUSfor the follow-up of VAP. Is it superior tothe follow-up of fever, PaO2/FIO2 ratio,and clinical pulmonary infection score, aspreviously reported (43). A previous study(44) demonstrated that radiologic infil-trates are poor indicators of pneumoniaresolution at day 7. The present studyconfirms this finding and demonstratesthat LUS is much more accurate thanbedside CRx for assessing antibiotic-induced lung reaeration. We believe thatthe technique has a promising future inthe care of critically ill patients, and wehope that further studies by other groupswill confirm our statement.
Lung ultrasound appears to be an ac-curate diagnostic tool for assessing therespiratory effects of antimicrobial ther-apy in patients with VAP. Since ultra-sound is noninvasive and easily repeat-able at the bedside, it allows the earlydetection of antibiotic-induced lung reaera-tion or the extension of lung infection incases of antimicrobial therapy failure.
ACKNOWLEDGMENT
We thank Jean-Louis Golmard, MD,PhD, Biostatistical Unit, Pitie-SalpetriereHospital, Paris, France, for statistical ad-vice.
REFERENCES
1. Bouhemad B, Zhang M, Lu Q, et al: Clinicalreview: Bedside lung ultrasound in criticalcare practice. Crit Care 2007; 11:205
Figure 8. Significance of ultrasound lung comets with regular and irregular spacing. Figure 8Adisplays 7-mm apart ultrasound lung comets representative of interstitial edema (thickened interlob-ular septa) and recorded in a patient with cardiogenic pulmonary edema. Figure 8B displays ultra-sound lung comets with well-defined and irregular spacing representative of small foci of broncho-pneumonia and recorded in a patient with ventilator-associated pneumonia. The white and gray arrowsindicate position of the probe.
8 Crit Care Med 2009 Vol. 39, No. 12

2. Lichtenstein DA, Menu Y: A bedside ultra-sound sign ruling out pneumothorax in thecritically ill: Lung sliding. Chest 1995; 108:1345–1348
3. Lichtenstein D, Meziere G, Biderman P, et al:The comet-tail artifact: An ultrasound sign ofalveolar-interstitial syndrome. Am J RespirCrit Care Med 1997; 156:1640–1646
4. Lichtenstein D, Lascols N, Meziere G, et al:Ultrasound diagnosis of alveolar consolida-tion in the critically ill. Intensive Care Med2004; 30:276–281
5. Malbouisson LM, Muller JC, Constantin JM,et al: Computed tomography assessment ofpositive end-expiratory pressure-induced al-veolar recruitment in patients with acute re-spiratory distress syndrome. Am J Respir CritCare Med 2001; 163:1444–1450
6. Rouby JJ, Puybasset L, Nieszkowska A, et al:Acute respiratory distress syndrome: Lessonsfrom computed tomography of the wholelung. Crit Care Med 2003; 31:S285–295
7. Beckmann U, Gillies DM, Berenholtz SM, etal: Incidents relating to the intra-hospitaltransfer of critically ill patients: An analysisof the reports submitted to the AustralianIncident Monitoring Study in Intensive Care.Intensive Care Med 2004; 30:1579–1585
8. Mayo JR, Aldrich J, Muller NL: Radiationexposure at chest CT: A statement of theFleischner Society. Radiology 2003; 228:15–21
9. Guidelines for the management of adultswith hospital-acquired, ventilator-associated,and healthcare-associated pneumonia. Am JRespir Crit Care Med 2005; 171:388–416
10. Pugin J, Auckenthaler R, Mili N, et al: Diag-nosis of ventilator-associated pneumonia bybacteriologic analysis of bronchoscopic andnonbronchoscopic “blind” bronchoalveolarlavage fluid. Am Rev Respir Dis 1991; 143:1121–1129
11. Rouby JJ, Rossignon MD, Nicolas MH, et al: Aprospective study of protected bronchoalveo-lar lavage in the diagnosis of nosocomialpneumonia. Anesthesiology 1989; 71:679–685
12. Papazian L, Thomas P, Garbe L, et al: Bron-choscopic or blind sampling techniques forthe diagnosis of ventilator-associated pneu-monia. Am J Respir Crit Care Med 1995;152:1982–1991
13. Kollef MH, Bock KR, Richards RD, et al: Thesafety and diagnostic accuracy of minibron-choalveolar lavage in patients with suspectedventilator-associated pneumonia. Ann InternMed 1995; 122:743–748
14. Yang PC, Luh KT, Chang DB, et al: Ultra-sonographic evaluation of pulmonary consol-idation. Am Rev Respir Dis 1992; 146:757–762
15. Weinberg B, Diakoumakis EE, Kass EG, et al:The air bronchogram: Sonographic demon-stration. Am J Roentgenol 1986; 147:593–595
16. Tuddenham WJ: Glossary of terms for tho-racic radiology: Recommendations of the No-
memclature Committee of the FleischnerSociety. Am J Roentgenol 1984; 143:509–517
17. Lu Q, Malbouisson M, Mourgeon E, et al:Assessment of PEEP-induced reopening ofcollapsed lung regions in acute lung injury:Are one or three CT sections representativeof the entire lung ? Intensive Care Med 2001;27:1504–1510
18. Puybasset L, Cluzel P, Gusman P, et al: Re-gional distribution of gas and tissue in acuterespiratory distress syndrome, I: Conse-quences for lung morphology. CT ScanARDS Study Group. Intensive Care Med2000; 26:857–869
19. Malbouisson LM, Preteux F, Puybasset L, etal: Validation of a software designed for com-puted tomographic (CT) measurement oflung water. Intensive Care Med 2001; 27:602–608
20. Sim J, Wright CC: The kappa statistic inreliability studies: Use, interpretation, andsample size requirements. Phys Ther 2005;85:257–268
21. Murray JF, Mathay JM, Luce JM, et al: Anexpanded definition of the adult respiratorydistress syndrome. Am Rev Respir Dis 1988;138:720–723
22. Tsubo T, Sakai I, Suzuki A, et al: Densitydetection in dependent left lung region usingtransesophageal echocardiography. Anesthe-siology 2001; 94:793–798
23. Agricola E, Bove T, Oppizzi M, et al: “Ultra-sound comet-tail images”: A marker of pul-monary edema: A comparative study withwedge pressure and extravascular lung wa-ter. Chest 2005; 127:1690–1695
24. Agricola E, Picano E, Oppizzi M, et al: As-sessment of stress-induced pulmonary inter-stitial edema by chest ultrasound during ex-ercise echocardiography and its correlationwith left ventricular function. J Am SocEchocardiogr 2006; 19:457–463
25. Gargani L, Lionetti V, Di Cristofano C, et al:Early detection of acute lung injury uncou-pled to hypoxemia in pigs using ultrasoundlung comets. Crit Care Med 2007; 35:2769–2774
26. Rouby JJ, Martin De Lassale E, Poete P, et al:Nosocomial bronchopneumonia in the criti-cally ill: Histologic and bacteriologic aspects.Am Rev Respir Dis 1992; 146:1059–1066
27. Elman M, Goldstein I, Marquette CH, et al:Influence of lung aeration on pulmonaryconcentrations of nebulized and intravenousamikacin in ventilated piglets with severebronchopneumonia. Anesthesiology 2002;97:199–206
28. Fabregas N, Torres A, El-Ebiary M, et al:Histopathologic and microbiologic aspects ofventilator-associated pneumonia. Anesthesi-ology 1996; 84:760–771
29. Lichtenstein DA, Meziere GA: Relevance oflung ultrasound in the diagnosis of acuterespiratory failure. Chest 2008; 134:117–125
30. Volpicelli G, Caramello V, Cardinale L, et al:Detection of sonographic B-lines in patientswith normal lung or radiographic alveolar
consolidation. Med Sci Monit 2008; 14:CR122-CR128
31. Copetti R, Soldati G, Copetti P: Chest sonog-raphy: A useful tool to differentiate acutecardiogenic pulmonary edema from acute re-spiratory distress syndrome. Cardiovasc Ul-trasound 2008; 6:16
32. Reissig A, Kroegel C: Sonographic diagnosisand follow-up of pneumonia: A prospectivestudy. Respiration 2007; 74:537–547
33. Khun C: Bacterial Infections: Pathology ofthe Lung. Second Edition. Edited by Thurl-beck WM, Churg AM (Eds). Stuttgart-New-York, Thieme Medical Publishers, 1995, pp267–302
34. Soldati G, Testa A, Silva FR, et al: Chestultrasonography in lung contusion. Chest2006; 130:533–538
35. Reissig A, Kroegel C: Transthoracic sonogra-phy of diffuse parenchymal lung disease: Therole of comet tail artifacts. J Ultrasound Med2003; 22:173–180
36. Volpicelli G, Mussa A, Garofalo G, et al: Bed-side lung ultrasound in the assessment ofalveolar-interstitial syndrome. Am J EmergMed 2006; 24:689–696
37. Goldstein I, Bughalo MT, Marquette CH,et al: Mechanical ventilation-induced air-space enlargement during experimentalpneumonia in piglets. Am J Respir Crit CareMed 2001; 163:958–964
38. Rios Vieira SR, Goldstein I, Lenaour G, et al:Experimental ventilator-associated pneumo-nia: Distribution of lung infection and con-sequences for lung aeration. Braz J Infect Dis2003; 7:216–223
39. Lichtenstein D, Meziere G, Biderman P, et al:The comet-tail artifact: An ultrasound signruling out pneumothorax. Intensive CareMed 1999; 25:383–388
40. Lichtenstein D, Meziere G: A lung ultrasoundsign allowing bedside distinction betweenpulmonary edema and COPD: The comet-tailartifact. Intensive Care Med 1998; 24:1331–1334
41. Sartorius A, Lu Q, Vieira S, et al: Mechanicalventilation and lung infection in the genesisof air-space enlargement. Crit Care 2007;11:R14
42. Lichtenstein D, Goldstein I, Mourgeon E,et al: Comparative diagnostic performancesof auscultation, chest radiography and chestultrasonography in acute respiratory distresssyndrome. Anesthesiology 2004; 100:9–15
43. Luna CM, Blanzaco D, Niederman MS, et al:Resolution of ventilator-associated pneumo-nia: Prospective evaluation of the clinicalpulmonary infection score as an early clinicalpredictor of outcome. Crit Care Med 2003;31:676–682
44. Vidaur L, Gualis B, Rodriguez A, et al: Clin-ical resolution in patients with suspicion ofventilator-associated pneumonia: A cohortstudy comparing patients with and withoutacute respiratory distress syndrome. CritCare Med 2005; 33:1248–1253
9Crit Care Med 2009 Vol. 39, No. 12