ultrasonically enhanced disintegration - · pdf fileultrasonically enhanced disintegration...
TRANSCRIPT
Dissertation VTT PUBLICATIONS 734
Antti Grönroos
Ultrasonically Enhanced Disintegration
Polymers, Sludge, and Contaminated Soil

VTT PUBLICATIONS 734
Ultrasonically Enhanced Disintegration
Polymers, Sludge, and Contaminated Soil
Antti Grönroos VTT
University of Jyväskylä Department of Chemistry
Laboratories of Applied Chemistry and Organic Chemistry
A dissertation for the degree of Doctor of Philosophy is to be presented, by permission of the Faculty of Mathematics and Science,
the University of Jyväskylä, for public examination and debate in auditorium KEM4 at Department of Chemistry (Survontie 9, Jyväskylä),
on the 28th of May, 2010, at 12 noon.
2
ISBN 978-951-38-7389-9 (soft back ed.) ISSN 1235-0621 (soft back ed.)
ISBN 978-951-38--7390-5 (URL: http://www.vtt.fi/publications/index.jsp) ISSN 1455-0849 (URL: http://www.vtt.fi/publications/index.jsp)
Copyright © VTT 2010
JULKAISIJA – UTGIVARE – PUBLISHER
VTT, Vuorimiehentie 5, PL 1000, 02044 VTT puh. vaihde 020 722 111, faksi 020 722 4374
VTT, Bergsmansvägen 5, PB 1000, 02044 VTT tel. växel 020 722 111, fax 020 722 4374
VTT Technical Research Centre of Finland, Vuorimiehentie 5, P.O. Box 1000, FI-02044 VTT, Finland phone internat. +358 20 722 111, fax + 358 20 722 4374
Technical editing Mirjami Pullinen Edita Prima Oy, Helsinki 2010
3
Antti Grönroos. Ultrasonically Enhanced Disintegration. Polymers, Sludge, and Contaminated Soil. Espoo 2010. VTT Publications 734. 100 p. + app. 27 p.
Keywords ultrasound, cavitation, disintegration, polymers, polymer degradation, sludge, anaerobicdigestion, contaminated soil
Abstract There are a great variety of potential applications of high–intensity ultrasonic energy. Of these, cleaning, plastic pounding, and at present also sludge disintegration and the remediation of contaminated soil are probably the best known and offer the most general market for high-intensity ultrasonics. All developments within the area of ultrasound applications lead to the creation of environmentally friendly processes and compounds, emphasizing the role of ultrasound in “green chemistry”. Ultrasound technology is considered not easy to use in industrial processes, since devices providing high sonic energy are not easy to construct. This thesis investigates on a semi-pilot scale if it is possible to enhance the disintegration of three quite different samples: polymers, sludge, and contaminated soil by using ultrasound.
The results indicate that it is possible to enhance the disintegration of polymers by means of ultrasonic power only when the cavitation threshold is exceeded. Above the cavitation threshold, the most extensive degradation took place at the lowest ultrasonic frequency used. The biggest decrease (from 115,000 g/mol to 30,000 g/mol) in relative molecular mass (RMM) was observed when the concentration of polyvinyl alcohol (PVA) was the lowest (1.0%). However, in the case of carboxymethylcellulose (CMC) it was observed that when viscosity was not adjusted there is an optimum polymer concentration (1.5–2.0%) where degradation is most efficient. The thesis shows that the extent of ultrasonic depolymerization decreases with decreasing molecular mass of the CMC polymer. The study also reveals that ultrasonic irradiation causes narrowing of the molecular mass distribution. The degradation of CMC polymer proceeded linearly and the rate of ultrasonic depolymerization decreased with decreasing molecular mass. In cases where the initial dynamic viscosities of polymer solutions were not the same, the sonolytic degradation of CMC polymer mainly depended on the initial dynamic viscosity. The higher the initial dynamic viscosity, the faster the degradation. This work confirms the general assumption
4
that the shear forces generated by the rapid motion of the solvent following cavitational collapse are responsible for the breakage of the chemical bonds within the polymer. The effect of polymer concentration could be interpreted in terms of the increase in viscosity with concentration, causing the molecules to become less mobile in solution with smaller velocity gradients around collapsing bubbles.
Ultrasonic disintegration of sludge increased the amount of soluble chemical oxygen demand (SCOD) and the production of methane. Multivariate data analysis suggested that ultrasonic power, sludge dry solids (DS), sludge temperature, and ultrasonic treatment time significantly affect sludge disintegration. It was also found that high ultrasound power together with a short treatment time is more efficient than low ultrasound power with a long treatment time. When using high ultrasound power, the ultrasound propagation is an important factor both in cavitation erosion prevention and reactor scale-up. Ultrasound efficiency rose linearly with input power in sludge at small distances from the transducer. On the other hand, ultrasound efficiency started even to decrease with input power at long distances from the transducer. When using oxidizing agents together with ultrasonic disintegration there was no increase in SCOD and only a slight increase in total organic carbon (TOC) compared to ultrasonic treatment alone. However, when using oxidizing agents together with ultrasound, no enhancement in methane production was observed.
Ultrasound improved the remediation results of both products (sink and float products) in heavy medium separation. This phenomenom was based on the fact that the amount of ultrafine metal fraction was diminished when attrition conditioning was replaced by ultrasound. The remediation process produced float product (cleaned soil) that could be left where it was. This would make for lower process costs since there is no need to move large quantities of soil material.
5
Doctoral thesis University of Jyväskylä, Department of Chemistry, Laboratories of Applied and Organic Chemistry, Jyväskylä, 2010
Supervisors Prof. Raimo Alén, Department of Chemistry, Laboratory of Applied Chemistry, University of Jyväskylä, Finland
Prof. Erkki Kolehmainen, Department of Chemistry, Laboratory of Organic Chemistry, University of Jyväskylä, Finland
Examiners Prof. José González García, Profesor Titular de Universidad Departamento de Química Física e Instituto de Electroquímica, Universidad de Alicante, Spain
Prof. Gareth J. Price, Professor of Chemistry, Department of Chemistry University of Bath, UK
6
Preface This study was carried out in the Laboratories of Applied and Organic Chemistry at University of Jyväskylä. The experimental part of the work was carried out mainly during 1999–2006 at the Technical Research Centre of Finland (VTT), Jyväskylä.
First of all, I wish to express my sincere gratitude to Professors Raimo Alén and Erkki Kolehmainen of the University of Jyväskylä for their support and guidance during this work.
I am very grateful to VTT for giving me the opportunity to do this long-term work. I want to thank my colleagues at VTT for their great help, especially with my technical problems. I wish to express my special thanks to Dr. Tech. Hanna Kyllönen and Lic. Tech. Pentti Pirkonen for their support, encouragement, and valuable comments throughout my research work. The experimental part of the work was partly performed with the assistance of Hannu Sekki, Jorma Ihalainen, and Hannu Mursunen. I want to express sincere thanks to all of them.
I want to express my special thanks to my official pre-examiners, Professor José González García, Universidad de Alicante, and Professor Gareth J. Price, University of Bath.
The financial support of VTT, the Academy of Finland and the Finnish Funding Agency for Technology and Innovation (Tekes) are gratefully acknowledged. I am also grateful to CP-Kelco Oy, Finnsonic Oy, GTK, Neste Oil Oyj, and Kemira Chemicals Oyj for their co-operation.
Finally, I want to thank Hanna and my whole family for their patience and support in every field during this work. Jyväskylä, April 2010
Antti Grönroos
7
Contents
Abstract ................................................................................................................. 3
Doctoral thesis ...................................................................................................... 5
Supervisors ........................................................................................................... 5
Examiners ............................................................................................................. 5
Preface.................................................................................................................. 6
List of publications............................................................................................... 10
List of symbols .................................................................................................... 12
List of abbreviations ............................................................................................ 14
1. Introduction ................................................................................................... 17
2. Aims of the study .......................................................................................... 19
3. General aspects of ultrasound...................................................................... 20 3.1 Introduction ......................................................................................................................... 20 3.2 The generation of ultrasound – transducers ....................................................................... 21 3.3 Cavitation bubble formation ................................................................................................ 22
3.3.1 Transient cavitation................................................................................................ 24 3.3.2 Stable cavitation..................................................................................................... 24
3.4 Factors affecting cavitation ................................................................................................. 25 3.4.1 Frequency of ultrasound ........................................................................................ 25 3.4.2 Intensity of ultrasound............................................................................................ 25 3.4.3 Solvent ................................................................................................................... 29 3.4.4 Temperature........................................................................................................... 30 3.4.5 Dissolved gas and particles ................................................................................... 31 3.4.6 Pressure................................................................................................................. 31 3.4.7 Attenuation of ultrasound ....................................................................................... 32
3.5 Power ultrasound applications............................................................................................ 32
4. Ultrasound-assisted degradation of polymers .............................................. 34 4.1 Introduction ......................................................................................................................... 34 4.2 Factors affecting degradation ............................................................................................. 34
4.2.1 Frequency of ultrasound ........................................................................................ 35 4.2.2 Intensity of ultrasound............................................................................................ 35 4.2.3 Solvent ................................................................................................................... 37 4.2.4 Temperature........................................................................................................... 38 4.2.5 Molecular mass and concentration of polymers..................................................... 38
4.3 Degradation mechanisms ................................................................................................... 40
8
5. Ultrasound-assisted disintegration of sewage sludge as pre-treatment for anaerobic digestion.................................................................................. 42 5.1 Introduction ......................................................................................................................... 42 5.2 Ultrasound – one method for sludge disintegration ............................................................ 43
5.2.1 The effects of ultrasound frequency, intensity, sonication time, and ultrasonic specific energy....................................................................................... 44
5.2.2 The effects of sludge temperature, sludge pH, sludge concentration, and each sludge part ............................................................................................. 47
5.2.3 Residence time of the digesters............................................................................. 49 5.3 Ultrasound-assisted disintegration on full scale.................................................................. 51
6. Ultrasound-assisted remediation of contaminated soil ................................. 53 6.1 Introduction ......................................................................................................................... 53
6.1.1 Surface cleaning of particles.................................................................................. 54 6.1.2 Leaching of pollutants from soil ............................................................................. 55
6.2 Ultrasound-assisted surface cleaning of particles, leaching of pollutants, and extraction of contaminated soil ............................................................................................................ 56
7. Materials and methods.................................................................................. 62 7.1 Ultrasound assisted polymer degradation (I → III) ............................................................. 62
7.1.1 Ultrasound equipment ............................................................................................ 62 7.1.2 Degradation methods............................................................................................. 63
7.1.2.1 Polyvinyl alcohol........................................................................................ 63 7.1.2.2 Carboxymethylcellulose ............................................................................ 63
7.2 Disintegration of sewage sludge (IV) .................................................................................. 65 7.2.1 Ultrasound equipment ............................................................................................ 65 7.2.2 Sludge and methane production assays................................................................ 66 7.2.3 Oxidizing experiments............................................................................................ 66 7.2.4 Multivariate data analyses...................................................................................... 67
7.3 Remediation of contaminated soil (V)................................................................................. 67 7.3.1 Ultrasound equipment ............................................................................................ 67 7.3.2 The soil samples .................................................................................................... 69
8. Results and discussion ................................................................................. 71 8.1 Degradation of polymer (I → III) ......................................................................................... 71
8.1.1 Effects of the main ultrasound parameters ............................................................ 71 8.1.1.1 Frequency of ultrasound............................................................................ 71 8.1.1.2 Intensity of ultrasound ............................................................................... 72 8.1.1.3 Molecular mass and concentration of polymers........................................ 74
8.1.2 Degradation mechanisms ...................................................................................... 79 8.2 Disintegration of sewage sludge (IV) .................................................................................. 80
8.2.1 Multivariate data analysis and SCOD .................................................................... 80 8.2.2 Effects on methane production .............................................................................. 83 8.2.3 Oxidizing measurements ....................................................................................... 84 8.2.4 Propagation of ultrasonic waves ............................................................................ 85
8.3 Remediation of contaminated soil (V)................................................................................. 87 8.3.1 Ultrasonic pre-treatment in heavy medium separation .......................................... 87

9
8.3.2 Ultrasonically assisted flotation tests ..................................................................... 89
9. Conclusions................................................................................................... 91
References.......................................................................................................... 95
Appendices
Publications I–V
10
List of publications This doctoral thesis is based on the following articles, which will be referred to in the text by the Roman numerals given below:
I Grönroos, A., Pirkonen, P., Heikkinen, J., Ihalainen, J., Mursunen, H., and Sekki H., Ultrasonic depolymerization of aqueous polyvinyl alcohol, Ultrasonics Sonochemistry, Vol. 8, Issue 3, July 2001, pages 259–264.
II Grönroos, A., Pirkonen, P., and Ruppert, O., Ultrasonic depolymerization of aqueous carboxymethylcellulose, Ultrasonics Sonochemistry, Vol. 11, Issue 1, January 2004, pages 9–12.
III Grönroos, A., Pirkonen, P., and Kyllönen, H., Ultrasonic degradation of aqueous carboxymethylcellulose: Effect of viscosity, molecular mass, and concentration, Ultrasonics Sonochemistry, Vol. 15, Issue 4, April 2008, pages 644–648.
IV Grönroos, A., Kyllönen, H., Korpijärvi, K., Pirkonen, P., Paavola, T., Jokela, J., and Rintala J., Ultrasound assisted method to increase soluble chemical oxygen demand (SCOD) of sewage sludge for digestion, Ultrasonics Sonochemistry, Vol. 12, Issues 1–2, January 2005, pages 115–120.
V Kyllönen, H., Pirkonen, P., Hintikka, V., Parvinen, P., Grönroos, A., and Sekki, H., Ultrasonically aided mineral processing technique for remediation of soil contaminated by heavy metals, Ultrasonics Sonochemistry, Vol. 11, Issues 3–4, May 2004, pages 211–216.
The author Antti Grönroos was the main researcher and the author of articles I–III. In article IV Antti Grönroos was the author and the researcher in the areas of design of the ultrasonic reactors and propagation of ultrasound in the sludge

11
studies. In article V the author Antti Grönroos was the researcher in the areas of ultrasonic reactor design and some ultrasound studies. Some of the measurements were done by technicians at VTT, the University of Jyväskylä, and GTK.
12
List of symbols A area (m2)
c concentration (mol/l)
c velocity of sound (m/s)
dx thickness (m)
E energy density (J)
Et energy of whole wave (J)
f frequency (1/s)
I intensity of acoustic field (W/cm2)
KE kinetic energy (J)
m mass (kg)
Mlim limiting value below which no further degradation takes place (g/mol)
p pressure of sound (atm)
P total pressure (atm)
PA pressure amplitude (atm)
Pa acoustic pressure (atm)
Pc negative pressure on rarefaction (atm)
Ph hydrostatic pressure (atm)
Pm pressure at the start of collapse (atm)

13
Pmax maximum pressure effects resulting from the cavitation bubbles collapse (atm)
Pv vapour pressure of the medium (atm)
R critical molecular distance (m)
t time (s)
Tmax maximum temperature effects resulting from the cavitation bubbles collapse (oC)
U0 the value of voltage (V)
Ueff the effective value of voltage (V)
Uhydrofone the hydrophone value of the voltage (V)
v velocity of layer (m/s)
vmax maximum velocity of the particle (m/s)
vp velocity of the particles (M/s)
vs velocity of sound (m/s)
x thickness of the layer (m)
Y phase difference of pressure amplitude and the velocity of an imaginary particle (°)
z acoustic impedance (kg/m2s)
λ wavelength (m)
ŋ viscosity (poise)
ρ density (g/cm3)
σ surface tension (N/m)
14
List of abbreviations BDH British Drug House
BOD biochemical oxygen demand
CMC carboxymethylcellulose
COD chemical oxygen demand
dc direct current
DDT 4,4'-(2,2,2-trichloroethane-1,1-diyl)bis(chlorobenzene)
DNA deoxyribonucleic acid
DS dry solids
ENI Electronic Navigation Industries
EPS extracellular polymeric substances
GC-MS gas chromatography-mass spectrometry
GTK Geological Survey of Finland
HRT hydraulic retention time
IEC International Electric Co.
KAX K-amyl xanthate
MM molecular mass
NA not analyzed
NaIPX Na-isopropyl xanthate
NS no significant meaning
15
PAH polycyclic aromatic hydrocarbons
PCB polychlorinated biphenyl
P.E. population equivalent
PEG polyethylene glycol
PLS partial least squares
PVA polyvinyl alcohol
RaRa turnip fatty acid
RMM relative molecular mass
SCOD soluble chemical oxygen demand
SFS Finnish Standards Association
SIF separation in froth
SRT sludge residence time
TCOD total chemical oxygen demand
TOC total organic carbon
TS total solids
TVFA total volatile fatty acids
US ultrasonic
USA United States of America
VS volatile solids
VTT Technical Research Centre of Finland
WAS waste activated sludge
XRF X-ray fluorescence

16
1. Introduction
17
1. Introduction The term “ultrasound” means vibrations which are similar to sound waves, but with frequencies too high to be detected by the human ear. The upper frequency limit of human hearing varies from about 10 kHz to about 18 kHz (Cracknell 1980). For any given person the threshold frequency decreases with increasing age. The basis for the present-day generation of ultrasound was established as far back as 1880 with the discovery of the piezoelectric effect and its inverse by the Curies. The first commercial applications of ultrasound appeared 1917 with Langevin’s echo-sounding technique for estimating the depth of water. Langevin’s discovery was the direct result of an idea which arose from a competition organized in 1912 to find a method to detect icebergs in the open sea and so avoid any repetition of the disaster which befell the Titanic. Cracknell (1980) reported that some work on the development of using ultrasonic cleaning was performed in Germany during the Second World War. Since that time ultrasonic cleaning equipment has been developed by many different manufactures for a wide variety of applications. For example, Mason and Lorimer (1988) reported 20 years ago that much of the ultrasonic equipment in industry is involved in welding or riveting plastic mouldings for the consumer market. Most modern ultrasonic devices rely on transducers which use the inverse effect, i.e. the production of a charge in the dimension of certain materials by the application of an electrical potential across opposite faces. If the potential is alternated at high frequencies the crystal converts the electrical to mechanical (sound) vibration – rather like a loudspeaker. At sufficiently high alternating potential, ultrasound is generated (Mason and Lorimer 1988).
There are a great variety of high-intensity applications and potential applications of ultrasonic energy (Mason and Lorimer 1988). They include cleaning, soldering, plastic pounding, spot welding of metals, liquid atomization, materials forming, foam control, emulsification of liquids, drying and dewatering, sludge
1. Introduction
18
disintegration, compaction of powered metals and plastic, acceleration of chemical activity, accelerated diffusion, alleviation of frictional effects, depolymerization, fragmentation and dispersion of particles, control of grain size in solidifying melts, dust and smoke precipitation, and many others. Of these, cleaning, plastic pounding, and also sludge disintegration and the remediation of contamined soil are probably the best known and offer the most general market for high-intensity ultrasonics. Even if really large-scale applications are still in the future, experiments starting from several tens of grams have already been reported (Kardos and Luche 2001). Recent progress in sonochemical engineering and in ultrasound generators with improved energetic yields should be applicable to industrialization. All these developments will lead to the creation of environmentally friendly processes and compounds, emphasizing the role of ultrasound in “green chemistry”. Ultrasound technology is considered not easy to use in industrial processes, since devices providing high sonic energy are not easy to manufacture. However, based on research work already carried out and referred to in this work there are industrial processes, where is used low energy ultrasound. For example, installing an ultrasonic device before an anaerobic unit consumes electricity produces no additional harmful matter, but greatly improves anaerobic efficiency. For this reason, ultrasonic technology may be a clean and “green” way to deal with sludge.
This study, first reviews general aspects of ultrasound, such as ultrasound generation, cavitation, and factors affecting cavitation. In this part there is also a discussion of the factors that have an effect on ultrasound-assisted polymer degradation, sludge disintegration or soil remediation. This is because the aim of the experimental part of this study was to investigate on a semi-pilot scale whether it is possible to enhance by ultrasound the disintegration of three quite different samples: polymers, sludge, and contaminated soil.
2. Aims of the study
19
2. Aims of the study The aim of the study was to investigate whether it is possible to enhance the disintegration process using ultrasound. For this purpose, three rather different samples (polymers, sludge, and contaminated soil) were studied in the laboratory on a semi-pilot scale.
3. General aspects of ultrasound
20
3. General aspects of ultrasound
3.1 Introduction
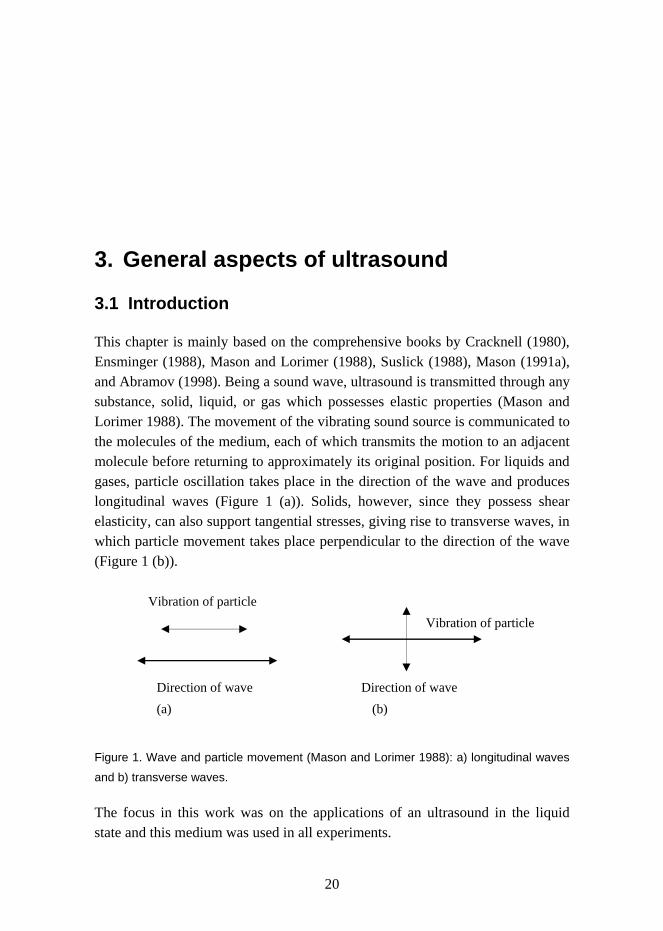
This chapter is mainly based on the comprehensive books by Cracknell (1980), Ensminger (1988), Mason and Lorimer (1988), Suslick (1988), Mason (1991a), and Abramov (1998). Being a sound wave, ultrasound is transmitted through any substance, solid, liquid, or gas which possesses elastic properties (Mason and Lorimer 1988). The movement of the vibrating sound source is communicated to the molecules of the medium, each of which transmits the motion to an adjacent molecule before returning to approximately its original position. For liquids and gases, particle oscillation takes place in the direction of the wave and produces longitudinal waves (Figure 1 (a)). Solids, however, since they possess shear elasticity, can also support tangential stresses, giving rise to transverse waves, in which particle movement takes place perpendicular to the direction of the wave (Figure 1 (b)).
Figure 1. Wave and particle movement (Mason and Lorimer 1988): a) longitudinal waves
and b) transverse waves.
The focus in this work was on the applications of an ultrasound in the liquid state and this medium was used in all experiments.
Direction of wave Direction of wave
Vibration of particle Vibration of particle
(a) (b)
3. General aspects of ultrasound
21
3.2 The generation of ultrasound – transducers
A transducer is the name for a device capable of converting one form of energy into another, a simple example being a loudspeaker which converts electrical energy to sound energy (Mason 1991a). Ultrasonic transducers are designed to convert either mechanical or electrical energy into high-frequency sound. There are three main types of ultrasound transducers: gas-driven, liquid-driven, and electromechanical equipment. The two main types of electromechanical transducers are based on either the piezoelectric or the magnetostrictive effect. The most commonly used are piezoelectric transducers and because these were also used in this thesis, they are more exhaustively described.
Piezoelectric materials have the following two complementary properties (Mason 1991a):
a) The direct effect – when pressure is applied across the large surfaces of the section, a charge is generated on each face equal in size but of the opposite sign. This polarity is reversed if tension is applied across the surfaces.
b) The inverse effect – if a charge is applied to one face of the section and an equal but opposite charge to the other face, then the whole section of crystal will either expand or contract depending on the polarity of the applied charges.
When applying rapidly reversing charges to a piezoelectric material, fluctuations in dimensions will be produced (Mason 1991a). This effect can be harnessed to transmit ultrasonic vibrations from the crystal section through the medium it is in contact with. Three materials (barium titanate, lead mataniobate, and the mixed crystal lead zirconate titanate) are commonly used as piezoelectric materials. These materials cannot be obtained as large single crystals and so, instead, they are ground with binders and sintered under pressure at above 1000 °C to form a ceramic. The crystallites of the ceramic are then aligned by cooling from above the ferroelectric transition temperature in a magnetic field. Ferroelectric ceramic materials are made piezoelectric by a biasing or polarization procedure. The procedure includes elevating the temperature of the material to above the Curie point and allowing it to cool slowly in a high dc electric field which is oriented along an axis of planned piezoelectric excitation. The Curie point is the temperature above which a material becomes inactive again (Ensminger 1988). It is not possible to use a given piece of piezoelectric
3. General aspects of ultrasound
22
material efficiently at every frequency. Optimum performance will only be obtained at the natural resonance frequency of the particular sample, and this depends upon its dimensions. This is why conventional ultrasonic equipment is of fixed frequency and why reports of comparative studies at different frequencies are not common (Mason 1991a).
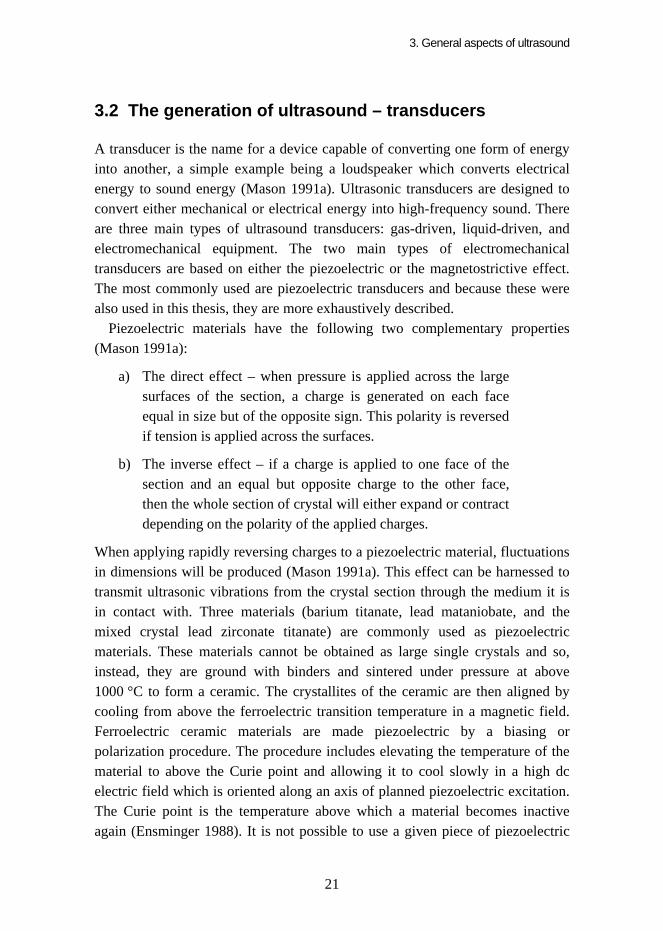
To reinforce the rather fragile ceramic transducers it is normal practice to clamp piezoelectric elements between metal blocks, which serve both to protect the dedicated crystalline material and to prevent it from overheating by acting as a heat sink (Mason 1991a). Usually two elements are combined so that their overall mechanical motion is additive. The construction of such transducers is shown in Figure 2.
Figure 2. Piezoceramic ultrasonic transducers (http://safin0522.en.ec21.com/).
The sound wave is usually introduced to the medium by an ultrasonic bath, an ultrasonic bar or an ultrasonic horn (Mason and Lorimer 1988). In every case, an alternating electrical field (generally in the range 20–50 kHz) produces a mechanical vibration in a transducer, which in turn causes vibration of the bottom of the bath (or the probe) at the applied electric field frequency.
3.3 Cavitation bubble formation
The progression of a sound wave through a liquid medium causes the molecules to oscillate around their mean position (Mason and Lorimer 1988, Mason
3. General aspects of ultrasound
23
1991a). During the compression cycle, the average distance between the molecules decreases, whilst during rarefaction the distance increases. If a sufficiently large negative pressure on rarefaction (Pc) is applied to the liquid such that the average distance between the molecules exceeds the critical molecular distance (R) necessary to hold the liquid intact, the liquid will break down and voids or cavities will be created and cavitation bubbles will be formed. Once produced, these cavities, voids, or bubbles may grow in size until the maximum of the negative pressure has been reached. However, in the succeeding compression cycle of the wave, they will be forced to contract, i.e. decrease in volume and some of them may even disappear totally. At the extreme of the rarefaction half of the cycle the bubble is at its maximum size and at the extreme of the compression half of the cycle it is at its minimum size.
It is possible to show that if the excess pressure amplitude of the ultrasound is sufficiently high, in other words if the intensity of the ultrasound is sufficiently high, and the initial size of the bubble is less than a certain critical value, the bubble will suddenly collapse during the compressional half of the cycle with the sudden release of a comparatively large amount of energy (Cracknell 1980). This collapse and the associated release of energy are known as cavitation. The pressure in a bubble just before it finally collapses may be very large indeed. Thus, when the bubble finally collapses an extremely powerful shock wave is produced and it is the energy in this shock wave which is responsible for many of the effects arising from cavitation. The shock waves produced on the total collapse of a bubble have been estimated to be of the order of several thousands of atmospheres and this is thought to be the cause of the considerable erosion of components observed in the vicinity of the bubble.
For any bubble created early in the rarefaction cycle, or initially present in the liquid, a growth in size will occur during the remainder of the cycle (Mason and Lorimer 1988). During the compression cycle all bubbles will be made to contract or collapse. However, if gas or vapor has diffused into the void or bubble during growth, complete collapse may not occur and the bubble may in fact oscillate in the applied field. Therefore, two types of bubbles must be considered: those which collapse completely (transient cavitation) and those which oscillate and exist for some considerable period of time (stable cavitation). Whether they collapse or oscillate depends upon many factors, e.g. temperature, acoustic amplitude, frequency, external pressure, bubble size, and gas type and content. There is further complication in that transient bubbles may grow into stable bubbles and vice versa. In any case it is certain that compression of a bubble
3. General aspects of ultrasound
24
containing either gas or vapor occurs very rapidly and leads to enormous temperatures (~10,000 K) and pressures (~1,000 atm) within the bubble itself. If complete collapse occurs, these pressures must be released into the liquid as shock waves.
During compression and rarefaction there will probably be several types of bubbles in the liquid, because during these cycles liquid vapor may, for example, evaporate into the partial void. Those bubble types may be (Mason and Lorimer 1988):
(a) the empty bubble (true cavitation), (b) the vapor-filled bubble, (c) the gas-filled bubble (unless the liquid is totally degassed), and (d) a combination of vapor- and gas-filled bubbles.
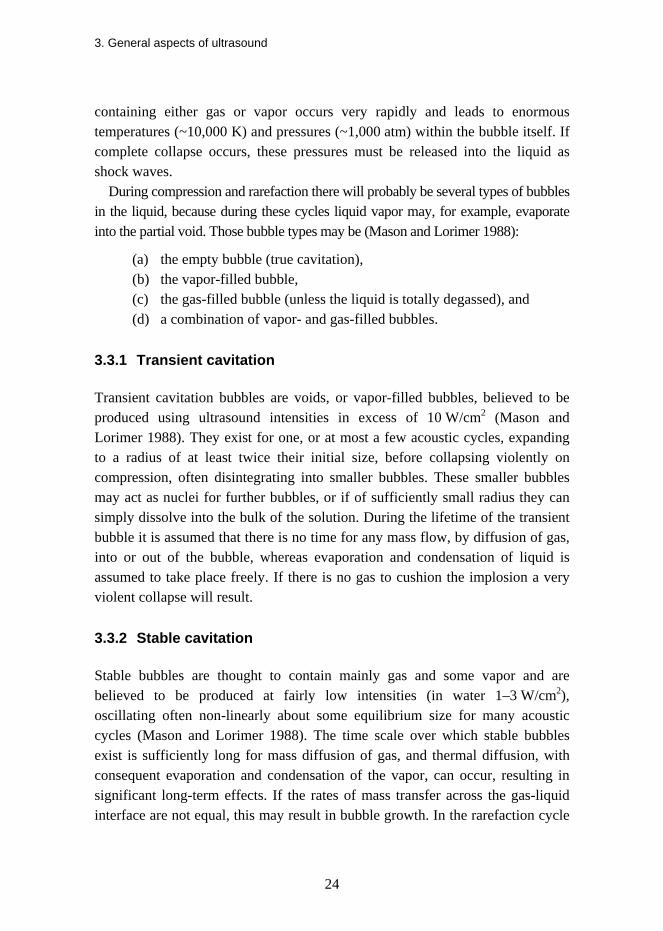
3.3.1 Transient cavitation
Transient cavitation bubbles are voids, or vapor-filled bubbles, believed to be produced using ultrasound intensities in excess of 10 W/cm2 (Mason and Lorimer 1988). They exist for one, or at most a few acoustic cycles, expanding to a radius of at least twice their initial size, before collapsing violently on compression, often disintegrating into smaller bubbles. These smaller bubbles may act as nuclei for further bubbles, or if of sufficiently small radius they can simply dissolve into the bulk of the solution. During the lifetime of the transient bubble it is assumed that there is no time for any mass flow, by diffusion of gas, into or out of the bubble, whereas evaporation and condensation of liquid is assumed to take place freely. If there is no gas to cushion the implosion a very violent collapse will result.
3.3.2 Stable cavitation
Stable bubbles are thought to contain mainly gas and some vapor and are believed to be produced at fairly low intensities (in water 1–3 W/cm2), oscillating often non-linearly about some equilibrium size for many acoustic cycles (Mason and Lorimer 1988). The time scale over which stable bubbles exist is sufficiently long for mass diffusion of gas, and thermal diffusion, with consequent evaporation and condensation of the vapor, can occur, resulting in significant long-term effects. If the rates of mass transfer across the gas-liquid interface are not equal, this may result in bubble growth. In the rarefaction cycle
3. General aspects of ultrasound
25
gas diffuses from the liquid into the bubble, while in the compression cycle gas diffuses out of the bubble into the liquid. Since the interfacial area is greater in the rarefaction cycle, the inward diffusion is greater and leads to an overall growth of the bubble. As the bubble grows the acoustic and environmental conditions of the medium will change and the bubble may be transformed into a transient bubble and undergo collapse. The violence of collapse, however, will be less than that for a vapor-filled transient bubble since gas will cushion the implosion. On the other hand, the bubbles may continue to grow during subsequent cycles until they are sufficiently buoyant to float to the surface and be expelled.
3.4 Factors affecting cavitation
3.4.1 Frequency of ultrasound
To completely rupture a liquid and hence provide a void, which may subsequently become filled with gas or vapour, requires a finite time (Mason and Lorimer 1988). For ultrasound waves with high frequencies, the time required to create the bubble may be longer than the available time during rarefaction. Thus it may be anticipated that as frequency increases the production of cavitation bubbles becomes more difficult to achieve in the available time and that greater pressure amplitudes will need to be employed to ensure that the cohesive forces of the liquid are overcome. In fact, in earlier studies (Mason and Lorimer 1988) it has been found that ten times more power is required to make water cavitate at 400 kHz than at 10 kHz. Although various proposals have been offered to explain this observation, at least in qualitative terms it may be argued that at very high frequency, where the rarefaction cycles are very short, the finite time required for the rarefaction cycle is too small to permit a bubble to grow to a size sufficient to cause disruption of the liquid. Even if a bubble were to be produced during rarefaction the time required to collapse that bubble may be longer than that available in the compression half-time. The resultant cavitational effects will therefore be less at higher frequencies.
3.4.2 Intensity of ultrasound
The intensity of ultrasound is a very important factor when studying the effect of ultrasound on disintegration. Mason and Lorimer (1988) have reported that the
3. General aspects of ultrasound
26
molecules of the liquid, under the action of the applied field, will vibrate around their mean position. An acoustic pressure (Pa) will be superimposed upon the already ambient pressure (usually hydrostatic, Ph) present in the liquid. The total pressure (P) in the liquid at any time (t) is
P = Ph + Pa = Ph + PAsin2пft, (1)
where PA is the pressure amplitude, f frequency, and t time. For the ultrasound, as for any sound wave, the wavelength (λ) of sound in the
medium is given by the relationship
vs = λf, (2)
where vs is the velocity of sound in the medium and f frequency. If the movement of a layer of the medium of area (A) and thickness (dx) under
the action of the ultrasound wave are considered, the kinetic energy (KE) of the layer is given by
KE = ½ mv2 = ½ (ρAdx)v2, (3)
where m is the mass of the layer, v the velocity of the layer, and ρ the density of the layer.
The energy of the whole wave (Et) is obtained by summing all such elements, i.e. integrating equation (3) to give
Et = ½ ρAxv2, (4)
where ρ is the density of the layer, A the area of the layer, x the thickness of the layer, and v the velocity of the layer.
The energy per unit volume or energy density (E) is given by
E = ½ ρv2, (5)
where ρ is the density of the layer and v the velocity of the layer. If the sound energy passes through a unit cross-section area (A = 1) with a
velocity of vs, then the volume swept out in a unit time is vs (since A = 1), and the energy flowing in a unit time is given by E vs. Because intensity (I) has been defined as the amount of energy flowing per unit area per unit time
I = E vs, (6)
where E is the energy intensity and vs the velocity of sound. Then we can obtain
I = ½ ρvp2 vs (7)
3. General aspects of ultrasound
27
For a plane progressive wave, the particle velocity (vp) can be shown to be related to the acoustic pressure (Pa) by the expression
Pa/vp = ρvs (8)
For maximum particle velocity (vmax) the amplitude of the oscillating acoustic pressure (PA) is given by
PA/vmax = ρvs, (9) i.e.
vmax = PA/ρvs (10)
Thus, the intensity of the sound wave (from equations (7) and (10)) can be expressed as,
I = ½ ρvmax2 vs = ½ ρ (PA/ρvs)2 vs = PA2/ρvs, (11)
i.e. the sound intensity is proportional to the square of the acoustic amplitude. In order to measure the sound intensity at a particular point in a medium,
either the maximum particle velocity (vmax) or the maximum pressure amplitude (PA) must be clearly determined. In practice, this is extremely difficult and for most ultrasonic applications a calorimetric determination of the total ultrasonic energy delivered to the medium is considered to be sufficient (Mason et al. 2004). Unfortunately, in ultrasound scale-up these calorimetric determinations are impossible to perform and so different kinds of intensity measurements are needed. In scale-up the ultrasonic intensity can be determined simply from the input or output power of the transducer per unit area of the transducer surface or using a hydrophone.
The intensity of ultrasound (I) relates directly to the amplitude of vibration of the ultrasonic source. In the strictest sense the ultrasonic intensity is the amount of energy carried per second per unit area by the wave (Mason and Lorimer 1988). The usual unit of ultrasonic intensity is W/cm2. In general, an increase in intensity will provide for an increase in the cavitational effects. Cavitation bubbles, initially difficult to create, will now be possible. However, ultrasonic energy input to the system cannot be increased indefinitely for three reasons (Mason 1991a):
1. The transducer used in the sonicator will eventually break down as the increasing dimensional changes in the transducer eventually fracture the material.
3. General aspects of ultrasound
28
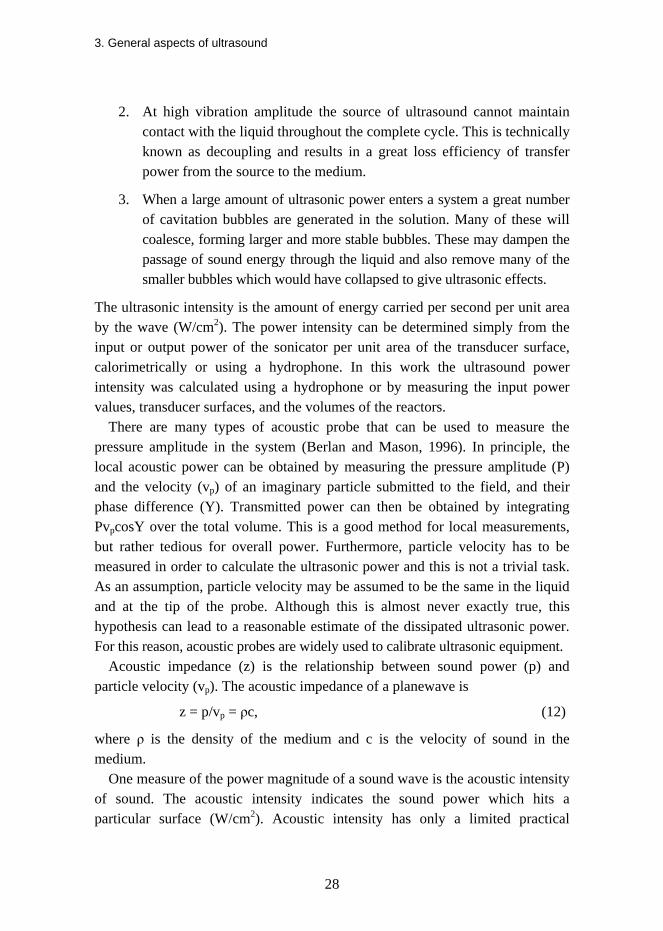
2. At high vibration amplitude the source of ultrasound cannot maintain contact with the liquid throughout the complete cycle. This is technically known as decoupling and results in a great loss efficiency of transfer power from the source to the medium.
3. When a large amount of ultrasonic power enters a system a great number of cavitation bubbles are generated in the solution. Many of these will coalesce, forming larger and more stable bubbles. These may dampen the passage of sound energy through the liquid and also remove many of the smaller bubbles which would have collapsed to give ultrasonic effects.
The ultrasonic intensity is the amount of energy carried per second per unit area by the wave (W/cm2). The power intensity can be determined simply from the input or output power of the sonicator per unit area of the transducer surface, calorimetrically or using a hydrophone. In this work the ultrasound power intensity was calculated using a hydrophone or by measuring the input power values, transducer surfaces, and the volumes of the reactors.
There are many types of acoustic probe that can be used to measure the pressure amplitude in the system (Berlan and Mason, 1996). In principle, the local acoustic power can be obtained by measuring the pressure amplitude (P) and the velocity (vp) of an imaginary particle submitted to the field, and their phase difference (Y). Transmitted power can then be obtained by integrating PvpcosY over the total volume. This is a good method for local measurements, but rather tedious for overall power. Furthermore, particle velocity has to be measured in order to calculate the ultrasonic power and this is not a trivial task. As an assumption, particle velocity may be assumed to be the same in the liquid and at the tip of the probe. Although this is almost never exactly true, this hypothesis can lead to a reasonable estimate of the dissipated ultrasonic power. For this reason, acoustic probes are widely used to calibrate ultrasonic equipment.
Acoustic impedance (z) is the relationship between sound power (p) and particle velocity (vp). The acoustic impedance of a planewave is
z = p/vp = ρc, (12)
where ρ is the density of the medium and c is the velocity of sound in the medium.
One measure of the power magnitude of a sound wave is the acoustic intensity of sound. The acoustic intensity indicates the sound power which hits a particular surface (W/cm2). Acoustic intensity has only a limited practical
3. General aspects of ultrasound
29
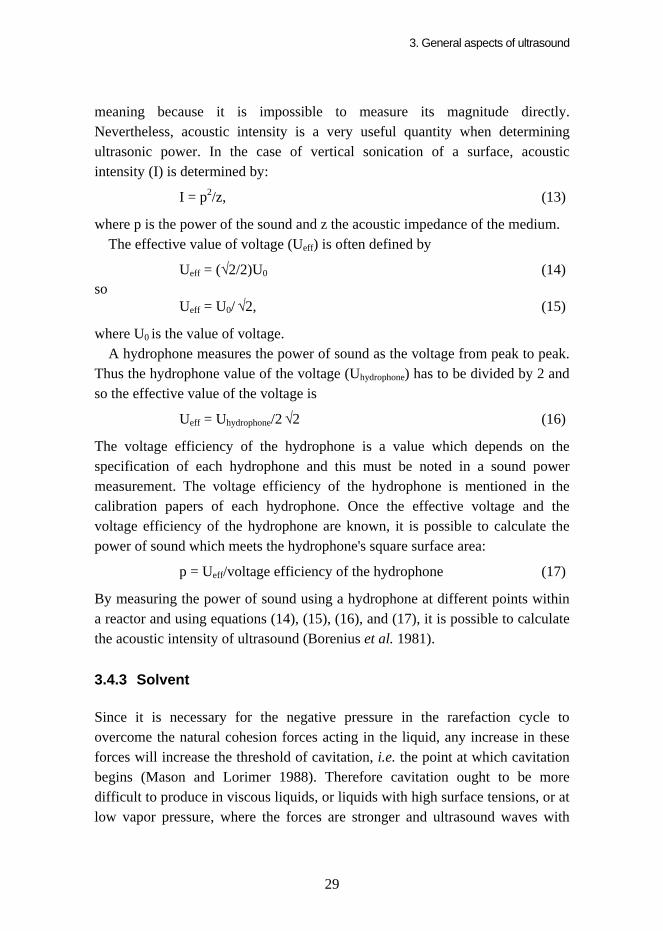
meaning because it is impossible to measure its magnitude directly. Nevertheless, acoustic intensity is a very useful quantity when determining ultrasonic power. In the case of vertical sonication of a surface, acoustic intensity (I) is determined by:
I = p2/z, (13)
where p is the power of the sound and z the acoustic impedance of the medium. The effective value of voltage (Ueff) is often defined by
Ueff = (√2/2)U0 (14) so
Ueff = U0/ √2, (15)
where U0 is the value of voltage. A hydrophone measures the power of sound as the voltage from peak to peak.
Thus the hydrophone value of the voltage (Uhydrophone) has to be divided by 2 and so the effective value of the voltage is
Ueff = Uhydrophone/2 √2 (16)
The voltage efficiency of the hydrophone is a value which depends on the specification of each hydrophone and this must be noted in a sound power measurement. The voltage efficiency of the hydrophone is mentioned in the calibration papers of each hydrophone. Once the effective voltage and the voltage efficiency of the hydrophone are known, it is possible to calculate the power of sound which meets the hydrophone's square surface area:
p = Ueff/voltage efficiency of the hydrophone (17)
By measuring the power of sound using a hydrophone at different points within a reactor and using equations (14), (15), (16), and (17), it is possible to calculate the acoustic intensity of ultrasound (Borenius et al. 1981).
3.4.3 Solvent
Since it is necessary for the negative pressure in the rarefaction cycle to overcome the natural cohesion forces acting in the liquid, any increase in these forces will increase the threshold of cavitation, i.e. the point at which cavitation begins (Mason and Lorimer 1988). Therefore cavitation ought to be more difficult to produce in viscous liquids, or liquids with high surface tensions, or at low vapor pressure, where the forces are stronger and ultrasound waves with
3. General aspects of ultrasound
30
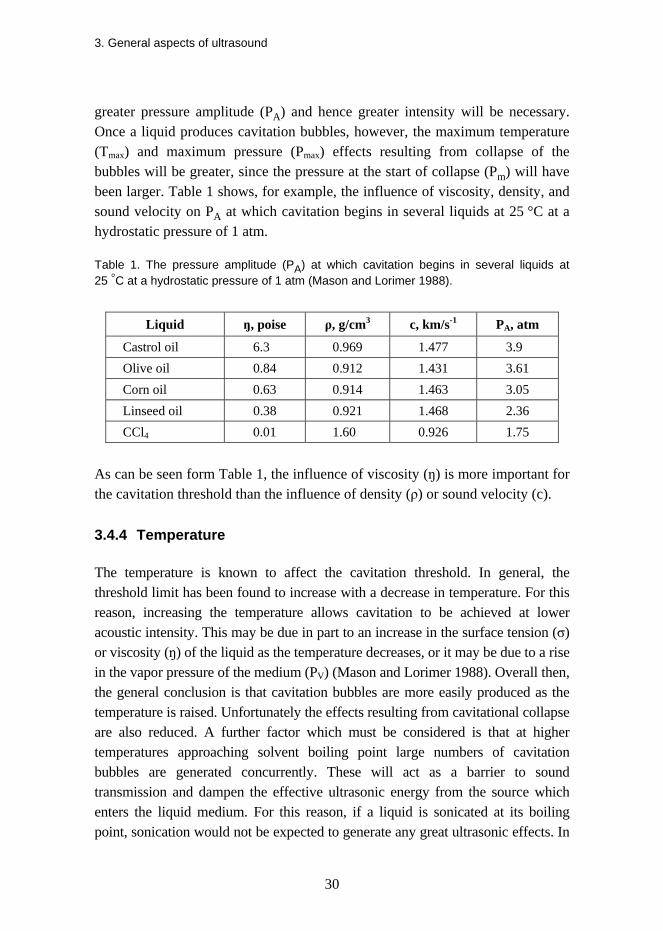
greater pressure amplitude (PA) and hence greater intensity will be necessary. Once a liquid produces cavitation bubbles, however, the maximum temperature (Tmax) and maximum pressure (Pmax) effects resulting from collapse of the bubbles will be greater, since the pressure at the start of collapse (Pm) will have been larger. Table 1 shows, for example, the influence of viscosity, density, and sound velocity on PA at which cavitation begins in several liquids at 25 °C at a hydrostatic pressure of 1 atm.
Table 1. The pressure amplitude (PA) at which cavitation begins in several liquids at 25 °C at a hydrostatic pressure of 1 atm (Mason and Lorimer 1988).
Liquid ŋ, poise ρ, g/cm3 c, km/s-1 PA, atm
Castrol oil 6.30 0.969 1.477 3.90 Olive oil 0.84 0.912 1.431 3.61 Corn oil 0.63 0.914 1.463 3.05 Linseed oil 0.38 0.921 1.468 2.36 CCl4 0.01 1.600 0.926 1.75
As can be seen form Table 1, the influence of viscosity (ŋ) is more important for the cavitation threshold than the influence of density (ρ) or sound velocity (c).
3.4.4 Temperature
The temperature is known to affect the cavitation threshold. In general, the threshold limit has been found to increase with a decrease in temperature. For this reason, increasing the temperature allows cavitation to be achieved at lower acoustic intensity. This may be due in part to an increase in the surface tension (σ) or viscosity (ŋ) of the liquid as the temperature decreases, or it may be due to a rise in the vapor pressure of the medium (PV) (Mason and Lorimer 1988). Overall then, the general conclusion is that cavitation bubbles are more easily produced as the temperature is raised. Unfortunately the effects resulting from cavitational collapse are also reduced. A further factor which must be considered is that at higher temperatures approaching solvent boiling point large numbers of cavitation bubbles are generated concurrently. These will act as a barrier to sound transmission and dampen the effective ultrasonic energy from the source which enters the liquid medium. For this reason, if a liquid is sonicated at its boiling point, sonication would not be expected to generate any great ultrasonic effects. In
3. General aspects of ultrasound
31
other words, to get maximum cavitational benefit, any ultrasound experiments should be conducted at as low a temperature as feasible or with a solvent of high surface tension and high viscosity or low vapor pressure at the chosen temperature.
3.4.5 Dissolved gas and particles
Estimates of the acoustic pressure necessary to cause cavitation in water have led to a value of approximately 1,500 atm (Mason and Lorimer 1988). In practice, cavitation occurs at considerably lower values (< 20 atm) and this is undoubtedly due to the presence of weak-spots in the liquid which lower the liquid’s tensile strength. There is, for example, sufficient experimental evidence to suggest that one cause of weak-spots is the presence of gas molecules in the liquid. It has been observed that the degassing of liquids leads to an increase in the cavitation threshold, i.e. to an increase in the values of applied acoustic pressure necessary before cavitation bubbles are observed (Mason and Lorimer 1988). It has also been found that the presence of particles, and more especially the occurrence of trapped vapor-gas nuclei in the cavities and recesses of these particles, lowers the cavitation threshold. For this reason, increasing the gas content of a liquid leads not only to a lowering of the cavitational threshold but also to a lowering of the intensity of the shock wave released on the collapse of the bubble. The threshold is lowered as a consequence of the increased number of gas nuclei (or weak-spots) present in the liquid, whilst the cavitation collapse intensity is decreased as a result of the greater cushioning effect in the bubble. If a soluble gas is used this will also provide large nucleus in the solvent. The greater the solubility of the gas, the greater the intensity of the shock wave created on bubble collapse. A further factor reducing the intensity of collapse may be that the more soluble the gas, the more likely it is to redissolved in the medium during the compression phase of the acoustic cycle.
3.4.6 Pressure
Increasing the external pressure (Ph) leads to an increase in both the cavitation threshold and the intensity of bubble collapse (Mason and Lorimer 1988). Greater ultrasonic energy is required to induce cavitation. Qualitatively, it can be assumed that there will no longer be a resultant negative pressure phase from the sound wave and so cavitation bubbles cannot be created. Clearly, a sufficiently large increase in the intensity of the applied ultrasonic field (I) could produce
3. General aspects of ultrasound
32
cavitation even at high overpressures. Increasing the value of Ph will lead to a more rapid and violent collapse.
3.4.7 Attenuation of ultrasound
For a variety of reasons the intensity of ultrasound is attenuated, i.e. it decreases as it progresses through a medium. Such reasons are for example the spreading of the ultrasound beam, scattering, and absorption due to various mechanisms (Ensminger 1988). If the acoustic impedance between the transducer and medium is small only some of this energy is dissipated in the form of heat, and there is little appreciable heating of the bulk medium during sonication (Mason 1991a). The extent of attenuation is inversely related to the frequency. In order to achieve identical intensities at a given distance in a medium it will be necessary to use a higher initial power for the source with the higher ultrasound frequency.
3.5 Power ultrasound applications
There are a number of low-intensity applications of ultrasonic energy, including process control, non-destructive testing, intrusion detecting, measurements of elastic properties, medical diagnosis, delay lines, signal processing, and appliance controls (such as television-channel selectors) (Ensminger 1988). Because this work concentrates on high-intensity or power ultrasound applications, those are considered more closely.
High-intensity applications of ultrasonic are those which produce changes in or effects on the media, or the contents of the media, through which the waves propagate. Various mechanisms may be activated by ultrasonic energy to promote such effects, but the mechanisms involved are not always known or understood. Most of the effects can probably be attributed to the following (Ensminger 1988):
1. Heat: as ultrasound progresses through a medium, energy is lost to the medium in the form of heat. Losses vary according to the nature of the medium. At certain interfaces, absorption may be high because of factors such as shear (friction) across the interface.
2. Stirring: intense ultrasound will produce violent agitation in a liquid medium of low viscosity and disperse material through the resulting currents of liquid or acceleration imparted to the particles.
3. General aspects of ultrasound
33
3. Cavitation: many of the effects associated with ultrasound occur in the presence of cavitation. Emulsification of otherwise immiscible liquids occurs under this condition.
4. Chemical effects: chemical activity, especially oxidation reactions, may be accelerated, sometimes manifold, under the influence of ultrasonically produced cavitation. The effects have been variously attributed to heat and to homolytic rapture (radical formation) of chemical bonds. In some cases, the effect is a result of mechanical mixing or of dispersion of saturated layers that ordinarily form at an interface between the participants in the reaction.
5. Mechanical effects: stresses developed in the ultrasonic field can cause ruptures to occur in materials. They may also cause relative motion between surfaces, which produces selective absorption at these surfaces, as in the ultrasonic bonding of materials. Stresses developed in cavitation bubble walls can cause severe erosion of surfaces.
6. Electrolytic effects: there are indications that when two metals separated on the electrolytic scale even to a slight degree are exposed to intense ultrasonic irradiation in water, an accelerated galvanic action may be induced which causes electrolytic corrosion.
7. Diffusion: ultrasonic energy promotes diffusion through cell walls, into gels, and through porous membranes.
8. Vacuum effects: during the low-pressure phase of each cycle, boiling in liquids may be induced and fluids may be drawn into tiny pores.
9. Cleansing: sometimes the observed effects may result from acoustic eroding of a protective coating from a surface so that reactions between two materials may occur that would not be possible otherwise.
Although the mechanism may not be understood and unexpected effects are often produced, all the effects encountered have logical explanations (Ensminger 1988).
4. Ultrasound-assisted degradation of polymers
34
4. Ultrasound-assisted degradation of polymers
4.1 Introduction
Various methods such as the application of heat, light, microwaves, x- or γ-rays, chemical reagents, and ultrasonic radiation can cause polymer degradation. The application of ultrasonic energy for polymer degradation dates back to the 1930s when natural polymers were subjected to sonication, which resulted in a reduction in viscosity (Price et al. 1994). Suslick (1988) reported that the first experiments in 1939 showed that ultrasonic irradiation depolymerized starch, gum arabic, gelatine, and polystyrene. These studies were followed by detailed examinations of sonochemical polymer degradation by many researchers.
4.2 Factors affecting degradation
Mason and Lorimer (1988) suggested that the frictional and impact forces needed for polymer breakdown are the consequence of cavity collapse and they calculated that there is a lower limit of relative molecular mass (RMM) below which degradation ought not to occur. Price et al. (1994) claimed that this limiting molecular mass has the added effect of narrowing the molecular mass distribution. Mason (1991a) and Kuijpers et al. (2004) also showed that ultrasonic degradation, unlike chemical or thermal decomposition, is a non-random process, in which cleavage takes place roughly at the center of the molecule. Mason (1991a) also reported that degradation is fastest with larger molecules. It has been noticed in earlier studies reported by Mason and Lorimer (1988), that the rate of ultrasonic depolymerization decreases with decreasing molecular mass of the polymer, and that the initial structure of the molecule, rather than its size, determines whether it will be broken by this means. For
4. Ultrasound-assisted degradation of polymers
35
example, Mason and Lorimer (1988), Mason (1991b), Lorimer et al. (1995), and Lorimer and Mason (1995) reported that the rate and the extent of degradation depends on the duration of irradiation, the concentration of the solution, the nature of the polymer and solvent, and the intensity of the ultrasound.
4.2.1 Frequency of ultrasound
The general conclusion that higher irradiation frequency is linked to a lower degradation rate is a view now shared by most workers in the field. Price et al. (1994) found that there were changes in the molecular mass distribution of a dextran sample at a frequency of 1.1 MHz, but no changes were found at a frequency of 3.3 MHz. Portenlänger and Heusinger (1997) noticed that the molecular mass distribution of dextran was dependent on frequency. The lower the frequency the more significant the changes were in the molecular mass distribution. It is also known that the higher the frequency of the ultrasound wave the more rapidly it is attenuated in the medium. Thus it is important to recognize that when comparing the effects of frequency, ultrasound intensity must be held constant. However, what is known is that the higher the applied frequency the shorter the period is in which bubble growth and collapse can occur and the more likely it is that there is insufficient time to produce cavitation. According to Mason and Lorimer (1988), there is a frequency limit (~10 MHz) above which cavitation does not occur. Some researchers have suggested that there is an optimum frequency at which the cavitation intensity attains maximum value and at this frequency maximum degradation occurs. For example, Mason and Lorimer (1988) reported maximum degradation at 1 MHz for polystyrene in benzene. In their view, the small observed degradation at the highest frequency (2 MHz), where presumably cavitation is negligible, is probably due to some kind of resonance effects.
4.2.2 Intensity of ultrasound
If degradation of polymers is due to cavitation then it is expected that degradation will only occur when the cavitation threshold is exceeded. This is confirmed by Mason and Lorimer (1988), who observed that the start of degradation coincides with the onset of cavitation. They found that the relative viscosity of the polystyrene in toluene after 90 minutes’ ultrasound irradiation showed very little reduction beyond an input power of 10 W/cm2.
4. Ultrasound-assisted degradation of polymers
36
Some researchers have observed that the degradation rate and extent of degradation increase with an increase in intensity. For example, Lorimer and Mason (1995) and Lorimer et al. (1995) studied the effect of ultrasound power on the degradation of dextrans and found that the higher the sonication power at a particular temperature and concentration, the faster the degradation rate is. Li et al. (2005a) found that the degradation of polystyrene is faster and proceeds futher at higher ultrasound intensity. Ebringerová and Hromádková (1997) and Ebringerová et al. (1997) observed that the degradation of corn hull xylan and corn cob xylan is dependent on the ultrasonic power. At higher sonic power and with a longer irradiation time, a high molecular fraction was slightly moved to a lower elution volume and a low-molecular fraction appeared. Yuntao et al. (2005) noticed that with an increase in ultrasonic intensity the weight average and number average molecular mass of high-density polyethylene melt decreases and the molecular weight distribution moves in the direction of low molecular mass, indicating that the extent of degradation of high-density polyethylene melt increases with a rise in ultrasonic intensity. Mason and Lorimer (1988) reported when using polystyrene in benzene or poly(methyl methacrylate) in chloroform, and Keqiang et al. (1985 and 1986) when using hydroxyethylcellulose and polyethylene oxide in aqueous solution, that degradation increases with an increase in intensity.
In addition, some other researchers have suggested that there is an optimum power which can be applied to a system to obtain the most beneficial effect. For example, Czechowska-Biskup et al. (2005) studied the influence of ultrasound power, i.e. ultrasound intensity, on the efficiency of chitosan degradation. In their study the sonication time was inversely proportional to the ultrasonic power, so that a constant amount of ultrasonic energy was always absorbed. They found that degradation is not efficient at low power. They explained that this can be attributed to the fact that in order to induce cavitation, the ultrasound power must reach some minimum value and the lowest power they used was close to that threshold. However, in the dose range 40–80 W the degradation yield was stable, while it seemed to decrease again at the highest power of 100 W. Czechowska-Biskup et al. (2005) have reported that it is known that at high power the efficiency of sonochemical prosesses may be diminished, since the cavitation bubbles present at high concentration may scatter the ultrasound waves. Qualitatively, it could be said that the number of bubbles produced at very high intensities serves to reduce power dissipation by reflecting the sound wave and creating a non-linear response to the increase in intensity. It
4. Ultrasound-assisted degradation of polymers
37
can also be argued that at high intensities the cavitation bubbles have grown so large on rarefaction that there is insufficient time available for collapse during the compression cycle.
4.2.3 Solvent
Most of the experimental data indicate that there is a decrease in the extent of depolymerization with increasing solvent vapor pressure. For example, Madras and Chattopadhyay (2001a) observed that the degradation of poly(vinyl acetate) is less efficient in solvents at higher vapor pressure. Chakraborty et al. (2004) also found that the degradation rate of polybutadiene and isotactic polypropylene decreases with increasing solvent vapor pressure. Mason and Lorimer (1988) found that this is also the case when the viscosities of solvents are similar. Basedow and Ebert (1975) have investigated the effect of ultrasound on the degradation of dextran in several solvents and found that the solvent characteristics have a considerable effect on the degradation rates and that there is a relationship between the degradation rate constants and the enthalpy of vaporisation of the solvent. However, quite often the viscosities are also different. Although the amount of degradation increases with a decrease in solvate vapor pressure, the order is also that of increasing solvent viscosity. Chakraborty et al. (2004) reported that better transmission of shock waves in a solution of higher kinematic viscosity is a probable reason explaining the increase in the degradation rate coefficients of polybutadiene and isotactic polypropylene at increasing kinematic viscosity. For this reason, while vapor pressure may be the major solvent factor involved in the degradation process there could also be a contribution from solvent viscosity or even, though less likely, from surface tension. Desai et al. (2008) reported that solvents with higher surface tension offer higher resistance to the formation of cavities in the system and hence the expected cavitational intensity is higher, resulting in a higher extent of degradation. Although an increase in viscosity makes it more difficult for cavitation to occur (Chapter 3.4.3), the pressure effects resulting from bubble collapse will be greater (providing that cavitation occurs at all). In other words, the cavitational effects of increasing vapor pressure and viscosity are partially compensatory, i.e. act in opposite directions.
4. Ultrasound-assisted degradation of polymers
38
4.2.4 Temperature
One way to raise the vapor pressure of a solvent is to increase the temperature. The consequence of this should be a decrease in the rate of degradation as a result of the lower intensities of cavitation collapse at the high temperatures. This prediction has also been verified in practice. For example, Lorimer and Mason (1995) and Lorimer et al. (1995) studied the effect of temperature on the rate of degradation of native dextran. They found that the lower the temperature at a particular sonication power and concentration, the faster the degradation rate. Vijayalakshmi and Madras (2004) observed that the degradation rate coefficient decreases with increasing temperature and attributed this to the higher vapor pressure and lower viscosity at higher temperature. Chakraborty et al. (2004) with polybutadiene and isotactic polypropylene and Trciński and Staszewska (2004) with chitosan observed a decrease in degradation with an increase in temperature. Chakraborty et al. (2004) reported that as the temperature of the solution increases, a large quantity of the solvent vapor enters the cavitation bubbles during their expansion and exerts a cushioning effect during collapse, leading to diminished intensity of the shock wave, reducing the jet velocity and leading to reduced degradation at higher temperatures. However, Petit et al. (2007) observed no change in the depolymerization process with exopolysaccharide in the studied temperature range. They reported that this could be the consequence of a compensation effect, due to the increase in viscosity with temperature.
4.2.5 Molecular mass and concentration of polymers
The degradation of the same polymer samples of various RMM has been studied. For example, Basedow and Ebert (1975), Mason and Lorimer (1988), Lorimer et al. (1995), Madras et al. (2000), Xiuyuan et al. (2001), Kuijpers et al. (2004), Li J. et al. (2004 and 2005), Li Y. et al. (2005), Waskiewicz et al. (2005), Vodeničarová et al. (2006), Petit et al. (2007), Desai et al. (2008), and Kobayashi et al. (2008) found that the degradation rate of polymers was highest for the sample with the largest RMM and/or that the degradation had a certain limiting value after which no degradation occurred. The effect of polymer solution concentration on degradation has also been studied and, for example, Mason and Lorimer (1988), Kanwal et al. (2000), Xiuyuan et al. (2001), Trciński and Staszewska (2004), Waskiewicz et al. (2005), Petit et al. (2007),
4. Ultrasound-assisted degradation of polymers
39
and Desai et al. (2008) have reported that in every case the rate and the extent of degradation decrease with an increase in polymer concentration. However, cavitation is difficult to achieve in viscous materials corresponding to high RMM polymers. For example, Desai et al. (2008) reported that it should be noted that the intensity of cavitation drops remarkably with an increase in the viscosity of the medium. For this reason, dilute solutions of polymers have been used for the study of ultrasonic depolymerization. It is known that the formation of cavitation in the liquid requires that the negative pressure in the rarefaction region of wave function must overcome the natural cohesion forces acting within the liquid. Therefore, cavitation should be more difficult to produce in viscous liquids, where the forces are stronger and waves with greater amplitude and hence greater intensity will be necessary. Thus, the higher the viscosity the more difficult it becomes to cavitate the solution at a given intensity and the smaller the degradation effect is. On the other hand, the effects of cavitation collapse in viscous liquids are stronger than collapse in less viscous liquids.
Lorimer and Mason (1995) studied the effect of ultrasound on the degradation of native dextran and found that the lower the concentration at a particular temperature and sonication power, the faster the degradation rate is. They also found that the “apparent” limiting RMM of native dextran is between 50,000 and 80,000 g/mol. Price (1996) studied the effect of ultrasound on the degradation of polystyrene and found that degradation proceeds more rapidly for higher molecular masses and approaches a limiting value (Mlim) below which no further degradation takes place, in his case ca. 30,000 g/mol. Portenlänger and Heusinger (1997) observed that when using dextrans in aqueous solutions there was a stronger increase in polymer degradation with increasing molecular weight. Taghizadeh and Mehrdad (2003) studied the effect of concentration of polyvinyl alcohol on polymer degradation. Their results indicate that the extent of degradation is more pronounced in more dilute solutions. Harkal et al. (2006) also found that at higher concentration the intensity of the cavitation phenomenon is depressed and therefore the extent of polymer chainbreaking decreases. Czechowska-Biskup et al. (2005) found that the degradation of chitosan decreases with increasing polymer concentration. They reported that the decrease is most probably due to an increase in viscosity of the solution, which is a parameter that reduces the intensity of cavitation. However, Vijayalakshmi and Madras (2005) reported that the degradation rate coefficient is independent of the initial molecular mass. Based on their experimental data on the ultrasonic degradation of poly(ethylene oxide) in various solvents, it was concluded that
4. Ultrasound-assisted degradation of polymers
40
the effect of the vapor pressure of the solvent plays a cruicial role in determing the degradation rate compared to the effect of the polymer-solvent interactions studied.
4.3 Degradation mechanisms
It is well established that prolonged exposure of solutions of macromolecules to high-energy ultrasonic waves produces a permanent reduction in viscosity (Mason and Lorimer 1988). Even when the irradiated polymers are isolated and redissolved, their viscosity remains low compared to non-irradiated solutions. The exact mechanism by which degradation occurs is still open to discussion, with various models being proposed (Suslick 1988). It is generally agreed that hydrodynamic forces are of primary importance. Hydrodynamic forces may originate as a result of increased frictional forces between the ultrasonically accelerated faster-moving solvent molecules and the larger, less mobile, macromolecules. Doulah (1978) suggested that hydrodynamic forces may also be due to the high-pressure shock waves associated with the collapse of cavitation bubbles. The results of his experiments indicated that the degradation rate is dependent upon acoustic intensity, the size of the macromolecule, and suggested that there is a minimum chain length below which degradation does not occur. On the other hand, for example, Ramsden and McKay (1986) have shown that it is also possible that the main chain scissions are secondary effects due to chemical reactions initiated by unstable intermediates, such as free radicals or ions, produced by ultrasound. Price et al. (1997) studied the production of hydroxyl radicals during ultrasound treatment. They found that clearly there is radical production at both frequencies studied (1.1 and 3.3 MHz) and that, as expected, radical production increased at higher intensities. Madras and Chattopadhyay (2001b) studied the ultrasonic degradation of poly(vinyl acetate) in the presence of benzoyl peroxide as an oxidizing agent. They found that, unlike thermal degradation, the presence of benzoyl peroxide lowered the degradation rate. Madras and Chattopadhyay (2001b) reported that a radical reaction mechanism explains their experimental results. Whatever the mechanism involved, depolymerization results in the homolytic breakage of covalent bonds in the macromolecule to produce long-chain radical entries. This has been established by Tabata and Sohma (1980a,b) when investigating the depolymerization process in the presence of various radical scavengers. Waskiewicz et al. (2005) reported that ultrasonic degradation undergoes a
4. Ultrasound-assisted degradation of polymers
41
different mechanism than ultraviolet and gamma degradation – probably a mechanical one.
If polymer degradation observations are the result of cavitation, then the extent of degradation should be zero if the process is carried out under conditions which eliminate cavitation, i.e. either in vacuo or at high overpressure (Mason and Lorimer 1988). These conditions can be achieved by degassing the solution or by increasing the external pressure. Both degradation in vacuo and at high overpressure have been observed. To explain these observations, it has been suggested that the decrease in solution viscosity on irradiation are the consequence of degradation of the polymer, as a result of increased frictional forces between the ultrasonically accelerated faster-moving solvent molecules and the larger less mobile macromolecules. Although different modes of interaction between the solvent and polymer molecules have been envisaged, it has been concluded that the increased forces are sufficient to break a C-C bond.
5. Ultrasound-assisted disintegration of sewage sludge as pre-treatment for anaerobic digestion
42
5. Ultrasound-assisted disintegration of sewage sludge as pre-treatment for anaerobic digestion
5.1 Introduction
Large quantities of biomass – sludge – are produced in biological wastewater treatment. Sewage sludge consists of water and solid matter. The biosolids predominantly consist of particulate microbial or plant cell material (Eder and Günthert 2002). Nickel (2002) reported that in Germany, for example, municipal wastewater treatment results in 60 million m3 of sewage sludge each year. In agriculture about 190 million m3 of liquid manure are produced in Germany. Further amounts of biosolids come from forestry and industrial food production. Treatment of such material requires several processes that include digestion, settling, and dewatering. The overall treatment procedure is referred to as stabilization since the sludge material continues to degrade with the evolution of noxious gases under ambient conditions and must be stopped, or stabilized, before it can be used or disposed of (Mason 2007b). Gogate and Kabadi (2009) also reported that because the sludge is highly susceptible to decay it has to be stabilized in order to enable environmentally safe utilization and disposal. Neis et al. (2001) and Mason (2007b) have reported that the standard stabilization technique for sludge is anaerobic digestion which results in reduced content of organic matter.
Nickel (2002) mentioned that in Germany, for example, more than 80% of sewage sludge is treated anaerobically, where the volatile compounds could be utilized as a source for renewable energy. This process yields a net reduction in biosolid mass and volume. A portion of the volatile solids (VS) is converted microbiologically into methane and carbon dioxide. This biogas is used for energy production. The final products are stable innocuous biosolids that can be
5. Ultrasound-assisted disintegration of sewage sludge as pre-treatment for anaerobic digestion
43
used as fertilizer. For example, Nickel (2002) and Benadballah El-Hadj et al. (2007) have reported that the principal disadvantage of anaerobic biosolid fermentation is the rate-limiting long hydraulic retention time required for the conversion of particulate organics into biogas. Retention times in excess of 20 days result in high fermenter volumes and thus capital costs. Large converted tanks along with pumps for feeding and circulation, heat exchangers and gas mixing are required. Despite the long retention times during anaerobic digestion, no complete degradation of the biosolids is achieved, since because of the complex structures, the biosolids are only partially biodegradable. For example, the structure of biosolids appears to be important in controlling the rate and degree of degradation. In the case of sewage sludge fermentation, the reduction in VS ranges between 20% and 60%.
Eder and Günthert (2002) reported that the cells of the solid matters (microorganisms) are disrupted by disintegration and that cell liquid is released into the sludge water. Improved biodegradability of the organic substance in the sludge increases the biogas yield and decreases the mixed liquor volatile suspended solids in the digested sludge. Further ranges of the disintegration can be seen in the denitrification and in the dewatering of the digested sludge. The material-flow-management of sludge with disintegration leads to an increase in both productivity and efficiency.
As stated, the rate-limiting step in the anaerobic digestion process is slow biological hydrolysis and since one of the major effects of power ultrasound on micro-organisms is the breakdown of cell walls and the subsequent release of cellular material, sonication can be used to make the dissolved organic compounds more readily available in the anaerobic digestion process. As a result the fermentation rate is greatly improved as is biogas production.
5.2 Ultrasound – one method for sludge disintegration
The biodegradability of biosolids can be improved by solubilization. Positive effects have been shown for thermal pre-treatment, ozonation, chemical hydrolysis by acidification or alkaline addition, and mechanical disintegration (Nickel 2002 and Appels et al. 2008). Quarmby et al. (1999) found that sonication of sewage sludge can be used as pre-treatment for anaerobic digestion. The efficiency potential of this process lies in the break-up and solubilization of solid sludge particles. Onyeche et al. (2002) reported that one of the mechanical disintegration mechanisms is ultrasound pre-treatment, after
5. Ultrasound-assisted disintegration of sewage sludge as pre-treatment for anaerobic digestion
44
which anaerobic digestion is accelerated, biogas production is improved and a reduction in the amount of sludge is observed. The major effects of power ultrasound on microorganisms are the breakdown of cell walls and the subsequent release of cellular material. This makes the dissolved organic compounds more readily available in the anaerobic digestion process and the fermentation rate is greatly improved. Sonication is also capable of improving settling through the removal of filamentous material, which is one of the reasons for flotation (Neis et al. 2001).
Bougrier et al. (2006) studied the effects of ultrasound, ozonation, and thermal pre-treatment. They found that all treatments lead to chemical oxygen demand and matter solubilization and have little influence on the mineral matter. In terms of solubilisation, thermal pre-treatment (170 or 190 °C) was found to be better than sonication or ozonation. But, in terms of anaerobic biodegradability, the best results were obtained with ultrasound and thermal treatment, which biodegraded sludge almost totally within 24 days of tests. Appels et al. (2008) reported that sonication is no doubt the most powerful method to disrupt sludge cells. Although cell disintegrations of 100% can be obtained at high power levels, power consumption then becomes a serious drawback. Bougrier et al. (2006) reported that it was impossible to determine whether sonication or thermal treatment is the best treatment method, because there was not enough difference between their sludge biodegradability results. So, in order to choose one treatment over the other, it is necessary to consider other parameters like costs, sanitation, simplicity of installation and so on. But in general, techniques other than ultrasonic disintegration have not as yet been successful technically and economically. There are dozens of wastewater treatment plants which have chosen ultrasound over anaerobic digestion for the pre-treatment process.
5.2.1 The effects of ultrasound frequency, intensity, sonication time, and ultrasonic specific energy
Tiehm et al. (2001) studied the effect of ultrasound frequency on sludge pre-treatment before anaerobic digestion. The ultrasound frequency varied within a range of 41 kHz to 3217 kHz. The impact of different ultrasound intensities and treatment times was also examined. Sludge disintegration was greatest at low frequencies. Short sonication times resulted in sludge flock deagglomeration without the destruction of bacteria cells. Longer sonication brought about the break-up of cell walls, sludge solids were disintegrated and dissolved organic
5. Ultrasound-assisted disintegration of sewage sludge as pre-treatment for anaerobic digestion
45
compounds were released. The anaerobic digestion of waste activated sludge following ultrasonic pre-treatment causing microbial cell lyses was significantly improved. There was an increase in VS degradation as well as an increase in biogas production. The increase in digestion efficiency was proportional to the degree of sludge disintegration. To a lesser degree the deagglomeration of sludge flocks also augmented the anaerobic VS degradation. Wang et al. (1999) examined the effect of sonication time on sludge disintegration using batch system digesting and waste activated sludge (WAS). The pre-treatment times were 10, 20, 30, and 40 min. They obtained increases in methane compared to the respective control values of 12%, 31%, 64%, and 69%. A 200 W ultrasonic disintegrator (Kubota Insonator model 200M) was used at an oscillation frequency of 9 kHz.
Quarmby et al. (1999) compared the performance of anaerobic digestion on unsonicated sludge and sludge sonicated at two different intensities. The tests were run as a series of bath flasks and three 100 L anaerobic digesters. The data from the batch tests clearly indicated the positive effect on anaerobic digestion through gas production (increase of 15%) and volatile fatty acid production. The data from the anaerobic digesters were less distinct. Little difference was observed between the volumes of gas produced, although there was an increase in methane production, VS reduction, and soluble chemical oxygen demand (SCOD) by up to 6%, 5.5%, and 15%, respectively, when comparing the sonicated and unsonicated sludge. However, sonication was observed to have a detrimental effect on sludge dewaterability. This effect was more acute when a higher sonication intensity was used, although anaerobic digestion did reduce this effect. Therefore, while sonication can enhance anaerobic digestion, the negative effect on sludge properties must be considered before applying this technique to any site where dewatering processes are used. The two different sonication intensities indicated that there was a minimal difference in performance. For this reason, the application of low-intensity sonication offers both process and economic benefits.
Xie et al. (2009) found that low-intensity ultrasound at 35 kHz with an intensity of 0.2 W/cm2 can promote the biological activity of anaerobic sludge remarkably. They also found that the activity of anaerobic sludge is significantly influenced by irradiation time. At an irradiation period of 10 min, the biological activity of sludge increased to the maximum, but as the irradiation time was prolonged, it decreased gradually. Xie et al. (2009) observed the marked influence of ultrasonic intensity and irradiation time and found the optimal

5. Ultrasound-assisted disintegration of sewage sludge as pre-treatment for anaerobic digestion
46
ultrasonic condition. They concluded that the function of low-intensity ultrasound causes the cell to be hurt in some ways and makes the cell membrane flaw, promoting the permeability and selectivity of the cell membrane and wall and accelerating all sorts of nutrition or molecule transport between cell membranes. In addition, ultrasound can increase the activity of enzymes and modifies the metabolism of cells.
Casellas et al. (2009) studied the effect of different specific ultrasound energies on the disintegration of sludge. They found that total solids (TS), VS, total nitrogen, and chemical oxygen demand (COD) solubilization increase with increasing specific energy supply. In their study conditions (f = 20 kHz, power supply 60 W, TS = 17.8 g/L), flow cytometry experiments showed that organic matter solubilization was not due to cell membrane breakage but more probably to flock breakage. Shen et al. (2007) also studied the influence of ultrasonic specific energy on sludge decomposition. They found that ultrasound irradiation can increase the SCOD of the sludge supernatant remarkably, which increased with ultrasound intensity and irradiation time. Benadballah El-Hadj et al. (2007) studied the effect of specific ultrasound energy on sludge disintegration and on anaerobic digestion efficiency using methane production measurements in their biodegradability test. They found that under both mesophilic and thermophilic conditions biogas production was improved with increasing specific ultrasound energy input. They also found that mesophilic anaerobic fermentation is more readily ultrasonically influenced than thermophilic anaerobic fermentation. Since the hydrolysis of organic matter is higher at thermophilic conditions, solubilization by ultrasound would affect mesophilic digester performance more. Bougrier et al. (2005) also studied the effect of specific ultrasound energy on sludge disintegration. They observed that ultrasound leads to an increase in sludge biodegradability, but that sludge was not fully biodegradable. At low specific energiy supply biogas production was the same, which can be explained by variation in particle size. Energy was used to reduce flock size, not to break cells. After that biogas production increased with greater ultrasonic energy supply and for each ultrasound treatment, biogas production was higher than that for untreated sludge. Dewil et al. (2006) reported that the release of COD from the sludge phase into the filtrate phase is a function of the specific ultrasound energy input. A major fraction of the COD is transformed into biodegradable organics.
5. Ultrasound-assisted disintegration of sewage sludge as pre-treatment for anaerobic digestion
47
5.2.2 The effects of sludge temperature, sludge pH, sludge concentration, and each sludge part
Shen et al. (2007) studied the influence of temperature on sludge decomposition. Their studies at 28.7 kHz ultrasound frequency showed that sludge temperature increases more quickly when the ultrasound intensity is higher or the treating time is longer. They also noticed that without ultrasound the decomposition caused by heat was very small. At the same temperature, the SCOD after ultrasound was two times as high as that without ultrasound. Shen et al. (2007) also found that when temperature was controlled, SCOD increased more slowly than without temperature control. Thus heating caused by ultrasound irradiation is not the main factor in sludge decomposition, but it does contribute to the decomposition.
Wang et al. (2005) found that ultrasonic density, i.e. ultrasonic power level (W/ml), ultrasonic intensity, disintegrated sludge pH, and sludge concentration have an impact on sludge disintegration (20 kHz). Based on kinetic models, ultrasonic disintegration was impacted in the order: sludge pH > sludge concentration > ultrasonic intensity > ultrasonic density. They determined that hydro-mechanical shear forces are predominantly responsible for ultrasonically activated sludge disintegration, and that the contribution of the oxidizing effect of hydroxyl radicals HO• becomes greater as ultrasonic intensity is increased.
An improvement in the biological activity of ultrasound pre-treated sludge was also successfully demonstrated using laboratory-scale reactors by Schläfer et al. (2000 and 2002). All the experiments showed improved gas production compared to untreated sludge samples. The results indicate that increased sludge concentration and disruption time lead to increased specific gas production. After laboratory-scale studies they developed a pilot-scale (200 L) bioreactor. Batch experiments were made by measuring the degradation rate of organic compounds of wastewater. The process parameters were kept constant while varying the ultrasonic (US) intensity. The most important aspect of the experimental results was that a more than 100% increase in the maximum biological degradation rate was achieved by ultrasound transduction with an optimum US intensity of 1.5 W/L at 25 kHz. Very low ultrasonic power led to a decrease in the degradation rate down to the reference value. Implementation of an overly high level of ultrasound led to a drastic decrease in biological activity to a level far below the reference value. The researchers claimed that their bioprocess reduced overall energy by using low-energy ultrasonic irradiation
5. Ultrasound-assisted disintegration of sewage sludge as pre-treatment for anaerobic digestion
48
below the cavitation level. The ultrasound-assisted biological degradation process should be presented together with its optimization and the economical calculation.
Show et al. (2007) examined the role of sonication time, sonication density, i.e. ultrasonic power level (W/ml), type of sludge, and solid content in ultrasound sonication. They found that the best ultrasound disruption effects were associated with secondary sludge at higher sonication density within an optimum total solids content ranging between 2.3% and 3.2%. Gonze et al. (2003) also studied the effect of sludge concentration on disintegration. They found that for a given dissipation of energy, the quantity of disintegrated particles will be much greater with concentrated sludge than with diluted sludge. This is due to the fact that particle disruprion is limited by the probability of an imploding cavity meeting a particle. This fact is important because it means that from the industrial development standpoint, it is better to apply the process to concentrated sludge. However, van Leeuwen et al. (2006) reported that sludge disintegration efficiency declines significantly at higher TS content. Thus there is a limiting TS concentration that could be effectively disintegrated by ultrasound, and this is governed by the capability of an ultrasonic unit to produce cavitation.
Bougrier et al. (2005) also studied the effect of each sludge part (soluble and particles) on biogas production. They found that the volume of biogas produced with the soluble part of sludge increased with specific supplied energy, whereas the volume of biogas produced with the particulate fraction was quite constant. They observed that for non-treated sludge, biogas was produced from the particulate matter at a rate of 97%, whereas for ultrasonically treated sludge biogas was produced from the particulate matter at a rate of 60% only. Total biogas volume increased because more matter was soluble. The solids contained in the particulate part of the sludge were made soluble due to the ultrasound. They were more available for bacteria in the soluble fraction, and thus biogas production increased. Chu et al. (2001) reported that for the original sludge most COD is associated with the solid phase rather than the soluble form. At a low ultrasound power level (0.11 W/mL, 120 min), the SCOD did not significantly change, but at 0.33 W/mL about 20% of the total COD was transformed into soluble form after 120 min sonication. The COD in soluble form thereby increased by 40 times after ultrasonic treatment. At the same time the ratio of biochemical oxygen demand (BOD) and total chemical oxygen demand (TCOD) increased from 66% to around 80%, indicating that most of the released COD is biodegradable. Feng et al. (2009) also observed that ultrasonication increased the transfer of COD from the particulate fraction to the soluble fraction, and
5. Ultrasound-assisted disintegration of sewage sludge as pre-treatment for anaerobic digestion
49
there was a strong, positive correlation between SCOD and the applied ultrasound energy dosage. He et al. (2008) observed that the SCOD/COD ratios after ultrasound pre-treatment were greatly changed, suggesting that a large amount of insoluble organics of sludge flocks were transferred into soluble organics. The increase in SCOD may result from the destruction of flock structure after ultrasonic pre-treatment, promoting the release of colloidal and soluble organics into the solution. The steady increase in SCOD during sonication might have originated from the release of extracellular polymeric substances (EPS), such as polysaccharides, proteins, nucleic acids, lipids, and other polymeric compounds, during flock disintegration and the release of cell components during cell lysis (Zhang et al. 2007).
Zhang et al. (2009) studied the effect of sludge organic content (VS/TS), solid concentration, ultrasonic intensity and ultrasonic treatment time on disintegration. They found that higher VS/TS benefited sludge sonication. Below the optimal TS range, TS increase provided more organic substances to be transferred into water and thus improved sludge lysis. Above the optimal TS range, too many solids hindered sound transfer and lowered the ultrasound energy efficiency. The sound intensity threshold for sludge was found to be 20–30 W/cm2 with most profound sludge lysis in the initial period of sonication. In terms of energy efficiency and sludge lysis efficiency, the following optimal operational conditions were proposed: sludge TS of 20–30 g/L, sound intensity of 158–251 W/cm2, and sonication time of 5–15 min.
5.2.3 Residence time of the digesters
Tiehm et al. (1997) studied the effect of ultrasound on sludge pre-treatment using ultrasound at a frequency of 31 kHz and high acoustic intensities. Ultrasound treatment resulted in raw sludge disintegration through an increase in COD in the sludge supernatant and size reduction of sludge solids. Semi-continuous fermentation experiments with disintegrated and untreated sludge were performed for four months on a semi-technical scale. One fermenter was operated as a control with a conventional residence time of 22 days. Four fermenters were operated with disintegrated sludge and residence times of 22, 16, 12, and 8 days. In the fermenter operated with residence time of 22 days, the reduction in VS was 45.8% for untreated sludge and 50.3% for disintegrated sludge. The fermentation of disintegrated sludge was stable even at the shortest residence time of 8 days with biogas production 2.2 times that of the control
5. Ultrasound-assisted disintegration of sewage sludge as pre-treatment for anaerobic digestion
50
fermenter. Clark and Nujjoo (2000) demonstrated the influence of the hydraulic retention time (HRT) on the gas yields from sonicated sludge. With a mesophilic digester they obtained a 61% increase in specific methane yield at a 15 day HRT. Bougrier et al. (2006) also reported that ultrasound pre-treatment accelerates sludge degradation. For untreated sludge, it took 24 days to produce 300 mL of biogas per gram of COD added, while in the case of sonicated sludge it took only 6 days to produce the same amont of biogas.
Nickel and Neis (2007) reported pilot- and full-scale ultrasonic disintegration studies of biosolids. They found that at a sludge residence time (SRT) of 8 days, ultrasonic disintegration of WAS enhanced the degree of anaerobic disintegration by more than 40%. The highest rate of VS degradation was obtained at the shortest SRT (4 days). The data demonstrated that the anaerobic degradation process is considerably accelerated by ultrasonic sludge pre-treatment. Yin et al. (2006) observed that ultrasound treatment (20 kHz; 600 W/m2; 1 min) enhances anaerobic digestion and reduces digestion time. At the same resolution ratio, say 49%, the digestion time of sludge with ultrasound pre-treatment was 7 days less than that without ultrasound.
Forster and Lafitte-Trouqué (2004) studied the influence of ultrasound and γ-irradiation on the digestion of sludge. The sonic conditions were a processing time of 90 s, a frequency of 23 kHz, a power of 47 W and a γ-irradiation dose of 500 krad. The thermophilic and mesophilic digesters (35 °C or 55 °C) were operated in a semi-continuous mode, being fed with fresh WAS every 24 h at HRT of 8, 10, and 12 days. Prior to any treatment, the WAS was thickened to give total solids (TS) concentrations of 20–25 g/L. The differences between the digesters, in terms of VS reduction and biogas production, were not statistically significant for any particular set of conditions. Thermophilic digestion performed better than mesophilic digestion in terms of biogas production, VS reduction, and specific methane yield. The optimum retention time was 10 days at both temperatures. The results obtained in the study led to the conclusion that pre-treatment with ultrasound, at an applied dose of 3.4–5.0 kJ/g VS, or with γ-irradiation (with a dose of 500 krad) did not significantly improve the anaerobic digestion in terms of solids removal, biogas production and specific methane yields. However, a significant improvement was seen in the hourly biogas production study at the thermophilic temperature with an HRT of 10 days over the first eight hours.
5. Ultrasound-assisted disintegration of sewage sludge as pre-treatment for anaerobic digestion
51
5.3 Ultrasound-assisted disintegration on full scale
Xie et al. (2007) reported ultrasound disintegration technology tests conducted in the field under tropical conditions with a full-scale ultrasonic facility and two 5000 m3 digesters (control and test). Each digester was fed with mixed primary (one-third) and thickened activated (two-thirds) sludge of identical quality and volumes of up to 200 m3/d. For both digesters, all the operating conditions were the same except for the inclusion (test) and omission (control) of the ultrasonic device to pretreat the sludge feed. The ultrasound facility consisted of five sets of a 20 kHz ultrasound generator, converter, booster and sonotrode, and one V-shaped reactor chamber housing five donut-shaped horns stacked one to top of another with a clearance of 5 cm. The power rating of the sonotrode was 6 kW. Under normal operating conditions, the power level of the ultrasound device was controlled at ≤ 50% of the maximum value. In comparison with the control, the five-month field study showed that ultrasound pre-treatment of sludge increases daily biogas production by up to 45%. There were no significant differences in biogas composition from the two digesters. When translating the increase in biogas production to its source (volatile suspended solids), an increase is sludge solids removal of up to 30% can be expected under optimal operation conditions.
After pilot-scale tests, Nickel and Neis (2007) focused their study on full-scale experiments. Ultrasound equipment has already been installed on a full scale in a number of wastewater treatment plants in several countries. As compared to mechanical, thermal, and chemical disintegration methods, ultrasound application shows significant advantages especially with regard to operating conditions: ultrasonic reactors are very compact, simple to install and easy to operate. Nickel and Neis (2007) listed the requirements for a full-scale ultrasound reactor operating in a wastewater treatment plant:
• capacity for treating large volumetric sludge flows
• capacity to accept varying sludge properties (solids concentration, viscosity)
• removal of coarse and shaggy impurities prior to sonication to avoid reactor blocking
• automatic control of operation.
Appels et al. (2008) reported that ultrasound treatment units are commercially available in a wide range of capacities (between 1 and 20 kW) and modular lay-
5. Ultrasound-assisted disintegration of sewage sludge as pre-treatment for anaerobic digestion
52
out. The capital costs today are roughtly € 20,000 /kW, with 1 kW capable of treating sludge from a wastewater treatment plant of 10,000 population equivalent (P.E.). Operating and maintance costs are minimal although the ultrasound probes need replacement avery 1.5–2 years. Using ultrasound treatment improved VS destruction by between 40% to 50%, enhancing biogas production by about 50%. The savings are approximately € 1.5–2/P.E./year. Since the degradation rate is accelerated, the dimension of the digesters can moreover be reduced for a given load, thus reducing the impact of high capital requirements. Khanal et al. (2007) summarized in their review article that published studies showed an improvement of as much as 40% in solubilization of WAS following ultrasonic pre-treatment. Both laboratory and full-scale studies showed that the integration of an ultrasonic system in the anaerobic digester improved anaerobic digestibility significantly.

6. Ultrasound-assisted remediation of contaminated soil
53
6. Ultrasound-assisted remediation of contaminated soil
6.1 Introduction
Mason (2007a,b) reported that for contaminated soil wastes the currently available options for management and disposal are principally:
• Permanent storage in a secure ladfill. This will result in a permanent retained liability by the waste generator.
• Incineration in a permitted waste incinerator. This is costly and entails the risk of atmospheric emissions.
• Soil washing to produce bulk soil with low-level contamination. However, the washing process itself will produce a volume of solvent that must be treated before disposal.
For many years ultrasound has been considered as a technology to promote the process of soil washing and if subsequent disposal of the washings was considered at all this was perhaps to be a separate treatment. An integrated system has been developed in Canada (by Sonic Environmental Solutions Inc.) for large-scale continuous processing using acoustic frequencies in the audible range that incorporates the clean-up of the washings and recycling of the solvent. There is also one commercial remediation technique where ultrasound has been used as an aiding technique. The vibrating tray (Advanced Sonic Processing Systems, USA) using 20 kHz magnetostrictive transducers most resemble the technique under development.
Collings et al. (2006) reported that high-power ultrasonic technology offers several advantages comparated to current soil remediation methods. These include high destruction rates, the lack of dangerous breakdown products, and
6. Ultrasound-assisted remediation of contaminated soil
54
the low energy demands, assuming that similar rates of destruction to those obtained in laboratory or pilot-scale studies can be obtained at an industrial scale. A further advantage is that the technology can be made quite compact and transportable, allowing on-site treatment and the convenience of hydraulic transport of soil in slurries of typically 40% by weight.
Hintikka et al. (1999, 2001, and 2002) reported that separation techniques used in the mining industry, such as screening, heavy medium separation, and flotation, have recently been successfully applied to the remediation of soils contaminated by heavy metal like bullets, broken parts thereof, and alteration products. Soil remediation using mineral processing methods aided by power ultrasound is a novel method, where the effects of power ultrasound are used to further improve the operation of these mineral processing techniques. The ultrasound, which was used instead of attrition conditioning, was expected to produce less fine material than traditional methods.
Power ultrasound can be used for the rehabilitation of industrial sites or the reclamation of polluted land by the removal of chemical and biological contamination from the soil. For example, Newman et al. (1997), Singh and Singh (1997), Farmer et al. (2000), Feng et al. (2001), Meegoda and Perera (2001), and Swamy and Narayana (2001) have successfully used ultrasound to clean organic or inorganic matter from various particle surfaces. There are two basic mechanisms through which this can occur: either via the removal of contaminated material from the surface of soil particles or the leaching-out of more deeply entrenched materials.
6.1.1 Surface cleaning of particles
Mason (1999) reported that many conventional soil washing processes are based on the principal that pollutants absorb into the very small particulate components of the soil such as silt, clay, and humic matter, which tend to be attached to coarser sand and gravel particles. These larger particles make up the majority of the soil content. A primary aim in soil washing is therefore to dislodge and separate these fine components from the bulk soil. If the pollutant materials can be detached from the bulk, possibly together with some other surface contamination, a concentrated volume of polluted soil can be produced. This can then be treated or disposed of, and a large volume of residual soil which requires relatively little treatment can be returned to the site as re-fill.
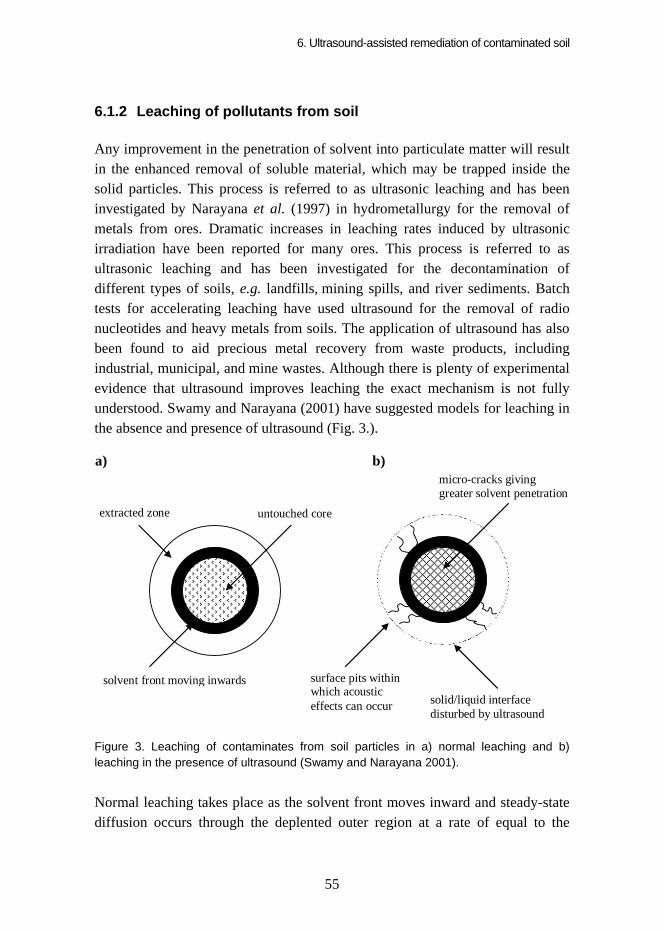
6. Ultrasound-assisted remediation of contaminated soil
55
6.1.2 Leaching of pollutants from soil
Any improvement in the penetration of solvent into particulate matter will result in the enhanced removal of soluble material, which may be trapped inside the solid particles. This process is referred to as ultrasonic leaching and has been investigated by Narayana et al. (1997) in hydrometallurgy for the removal of metals from ores. Dramatic increases in leaching rates induced by ultrasonic irradiation have been reported for many ores. This process is referred to as ultrasonic leaching and has been investigated for the decontamination of different types of soils, e.g. landfills, mining spills, and river sediments. Batch tests for accelerating leaching have used ultrasound for the removal of radio nucleotides and heavy metals from soils. The application of ultrasound has also been found to aid precious metal recovery from waste products, including industrial, municipal, and mine wastes. Although there is plenty of experimental evidence that ultrasound improves leaching the exact mechanism is not fully understood. Swamy and Narayana (2001) have suggested models for leaching in the absence and presence of ultrasound (Fig. 3.).
untouched core extracted zone
solvent front moving inwards surface pits within which acoustic effects can occur
b)micro-cracks giving greater solvent penetration
a)
solid/liquid interface disturbed by ultrasound
Figure 3. Leaching of contaminates from soil particles in a) normal leaching and b) leaching in the presence of ultrasound (Swamy and Narayana 2001).
Normal leaching takes place as the solvent front moves inward and steady-state diffusion occurs through the deplented outer region at a rate of equal to the

6. Ultrasound-assisted remediation of contaminated soil
56
reaction within the reaction zone itself (Fig. 3a). Under the influence of ultrasound normal leaching occurs but several additional factors contribute to improvements in its efficiency (Fig. 3b). These phenomena have also been summarized by Mason (2002):
1. Asymmetric cavitation bubble collapse in the vicinity of the solid surface leading to the formation of high-speed micro jets targeted at the solid surface. The micro jets can enhance transport rates and also increase surface area through surface pitting.
2. Particle fragmentation through collisions will increase surface area.
3. Cavitation collapse will generate shock waves, which can cause particle cracking through which the leaching agent can enter the interior of the particle by capillary action.
4. Acoustic streaming leading to the disturbance of the diffusion layer on the surface.
5. Diffusion through pores to the reaction zone will be enhanced by the ultrasonic capillary effect.
6.2 Ultrasound-assisted surface cleaning of particles, leaching of pollutants, and extraction of contaminated soil
Newman et al. (1997) compared the efficiency of conventional and ultrasonically assisted pollutant extraction procedures using model soil samples (granular pieces of brick) which had been deliberately contaminated with 51 ppm of copper (oxide). Analysis of the brick particles after 30 minutes’ sonication (washing by passing water across the substrate on an ultrasonically shaken tray) revealed that the average copper content had fallen to 31 ppm, a reduction of about 40%. Using a conventional mechanical shaking tray for the same time period, the residual contamination was 48 ppm, which represented a reduction of only 6%. The majority of the copper was removed as a result of the removal of surface materials which were more heavily contaminated with the copper oxide.
Mason (2000) reported that the disposal of drilling mud represents an environmental problem on offshore oil drilling rigs. This material is a complex mixture of components which is injected into the drill hole as a lubricant and flotation agent. After it has been used, the mud, together with earth from the drill hole, is contamined with oil which must be throughtly removed before the solids
6. Ultrasound-assisted remediation of contaminated soil
57
are dumped to the sea. Cleaning methods exist for this, but the cleaned material is then in the form of small agglomerates which, when dumped in the sea, sink to the sea bed and accumulate around the platform legs. This represents a problem for sea life and a hindrance to rig maintenance. An ultrasonic device has been built to de-agglomerate the cleaned mud on-site, i.e. on the rig. The equipment provides flow treatment of the drilling mud, which substantially reduces particle size. As a result, when the mud is jettisoned from the oil rig it disperses across the sea bed and does not accumulate around the platform legs.
The list of sites contamined with toxic metals grows longer every year, presenting a serious health problem and a formidable danger to the environment. Therefore, the determination of metals and their impact on the environment have been studied comprehensively in recent years. Marín et al. (2001) studied an ultrasonically assisted extraction method (probe sonicator) for zinc and arsenic using soil samples. They reported that it is possible to assist conventional extraction with mechanical shaking by sonication in order to simplify analytical procedures, which is very necessary when many samples have to be tested.
Kim and Wang (2003) reported the effectiveness of ultrasound enhancement in the insitu soil-flushing remediation method of soil contamined by non-aqueous phase liquid hydrocarbons. A range of conditions involving soil type, soil density, flushing rate, and sonication power were studied. The test results indicated that sonication can enhance pollutant removal considerably, and that the degree of enhancement depends on a number of factors such as sonication power, water flow rate, and soil type. For example, increasing sonication power will increase pollutant extraction only up to the level where cavitation occurs and the effeciveness of sonication decreases with flushing rate but eventually becomes constant under higher flow rates.
Nitrated polycyclic aromatic hydrocarbons are widespread environmental pollutants. A number of them have proved to be mutagenic and carcinogenic. Polynuclear aromatic hydrocarbons (PAH) can undergo atmospheric reactions with nitrogen oxides to form nitro derivates but nitrated polycyclic aromatic hydrocarbons can also be directly emitted by diesel and petrol engines. Priego-López and Luque de Castro (2003) performed studies using continuous ultrasound-assisted extraction (20 kHz; 100 W) of nitrated polycyclic aromatic hydrocarbons from soil prior to their individual separation and determination. The use of a dynamic approach allowed the extraction of the analytes in 10 min versus 24 h for the reference method and the use of less than 10 mL of axtractant versus 100 mL with the reference method. Moreover, similar extraction
6. Ultrasound-assisted remediation of contaminated soil
58
efficiency for all the analytes in natural contaminated soils was obtained by the proposed method in comparison to the reference method.
The ultrasound remediation process has proved to be particularly efficient for the removal and destruction of polychlorinated biphenyl (PCB) contaminants in soils (Mason et al. 2004). The process was also recently demonstrated in treatability-scale studies for the remediation of tar ponds (Mason 2007b). The tar ponds region is one of Canada’s most contamined sites and includes PCB and PAH contamination as a result of industrial waste being dumped into an estuary over many years. Initial trials appeared very promising in that soil samples mixed to provide a uniform sample of 160 mg/kg PCB and 9.7–470 mg/kg of 19 different PAH can be cleaned to acceptable environmental standards.
Mason et al. (2004) reported that Australia suffers from soil pollution as do many developed countries and a research group in New South Wales has run a project in which ultrasound is used to enhance the rate of clean-up of soils. Among the range of pollutants investigated were insecticides and polycyclic aromatic compounds. Laboratory studies have been conducted to remove various contaminants from soils. Most were carried out with slurries using a 12.5 mm tip diameter Misonix horn delivering approximately 170 W. Pure 4,4'-(2,2,2-trichloroethane-1,1-diyl)bis(chlorobenzene) (DDT) and PCB Aroclor 1260 were dissolved in acetone diluted with water and added to washed, fine sand (effectively pure SiO2). This was tumbled and allowed to dry to ensure even adsorption onto the sand surface. Fifty weight percent aqueous sand slurries were then made up. After sonication, the liquid was decanted and the soil was dried. The samples were then subjected to conventional extraction in order to determine the residual contaminant levels using a gas chromatograph combined with a mass spectrometer (GC-MS). The results showed that DDT reduction after 10 min ultrasound treatment was 70% and after 60 min about 75%. In the case of PCB the reduction after 10 min was about 50%, but after 60 min treatment even 85%. The study was extended to the decontamination of sediment at an industrial site polluted with PAH (containing at least 15 compounds). The sediment, with an original contamination of approximately 400 ppm, was made up to 44.4 wt% with distilled water and then sonicated as above. The results show that the reduction of industrial PAH compounds after 5 min ultrasound treatment was 75%.
Sanz et al. (2005) reported that nowadays it has become clear that the mobility, bioavailability, stability, retention, and toxicity of trace elements depend on both the chemical from which they enter the system and the final
6. Ultrasound-assisted remediation of contaminated soil
59
form in which they are present. Thus, the assessment of environmental impact and risk to human health must be based on the identification and quantification of the different chemical forms of the elements. For example, in the case of arsenic, the inorganic forms arsenite and arsenate have been related to an increased risk of cancer as well as to cardiovascular diseases, whereas methylated forms of arsenic are significantly less toxic. Arsenic speciation analysis suffers in general from the high sample handling time required by sample preparation. Sanz et al. (2005) reported a method of arsenic extraction from soil samples using a sonotrode-type ultrasonic homogenizer. They found that ultrasound sonication is a powerful tool for sample treatment allowing, in most cases, quantitative extraction in a very short time (from hours to a few minutes) compared to other methods, also simplifying sample handling.
Collings et al. (2006) reported processing contamined soils and sediments using high-power ultrasound on three scales: (i) a small laboratory scale (150 W); (ii) a larger scale (1–1.5 kW); and (iii) a 4 kW pilot plant. A significant improvement in the rate and completeness of destruction was achieved by ensuring that all the contaminated soil passes through the zone of most intense cavitation. Ninety precent of the PCB was reduced in 1–2 min and 99% in 7–10 min of sonication. Similar results were obtained for slurries contamined with hexachlorobenzene. In the larger-scale studies using contamined soil from an industrial site, where a mixture of organochlorine compounds, petroleum hudrocarbons, and PAH were present, ultrasound was effective in destroying the major contaminants: atrazine, simazine, and total petroleum hudrocarbons.
Richter et al. (2006) studied the efficiency of extraction of aliphatic diesel range organics and PAH from soil using ultrasound-assisted pressurized solvent extraction. They found that ultrasound improves extraction efficiency considerably. Under the conditions used (ultrasonic water bath at 70 °C; 35 kHz), the extraction time can be reduced by half compared with pressurized solvent extraction without ultrasound assistance.
Väisänen and Iljander (2006) optimized the method of ultrasound-assisted extraction followed by inductively coupled plasma optical emission spectrometry for the determination of trace element concentrations (arsenic, copper, lead, antimony, and zinc) in shooting range areas. Ultrasound extraction was performed using an ultrasonic water bath (35 kHz, 650 W). The optimized sonication procedure for a 500 mg soil sample lasted 9 min and was carried out at a temperature of about 50 °C. The sonication procedure was divided into three equal steps with the sample bottle being shaken by hand between each step. The
6. Ultrasound-assisted remediation of contaminated soil
60
shaking was used to prevent sedimentation. After ultrasound-assisted extraction the sample solution was filtered, washed, diluted, and analyzed.
Elik (2007) reported that the contamination of sediments, soils, and biota by heavy metals is of major concern in many industrialized countries because of their toxicity, persistence, and bio-accumulative nature. Elik (2007) studied the effect of ultrasound on the leaching of trace metals from sediments as a function of pH. He leached Cu, Pb, Ni, Zn, and Mn from sediments by ultrasound using phthalate buffers at pH values of 2.2–6.0. The ultrasonically assisted leaching method reduces the time required approximately from 12 h to 25 min compared to the conventional method. Depending on the metal and sample type, metal removal increased linearly or exponentially with decreasing pH. Elik (2007) summarized that it is clear that the ultrasonically assisted leaching method is a rapid, inexpensive, reproducible, and selective technique for the determination as a function of pH of Cu, Pb, Ni, Zn, and Mn in sediment samples which are important in monitoring environmental pollution. This technique is promising for the study of chemical and biological availability and uptake/release processes of metals in sediments and soil as a function of pH.
Song et al. (2007) also studied ultrasound-assisted extraction using soil samples. They reported that in recent years there has been a growing interest in the extraction of PAH from environmental soil samples due to risks of them causing adverse effects to human health. The conventional sample extraction methods have some drawbacks, such as long extraction time, large amount of organic solvents, labor-intensive procedures, and/or poor reproducibility. Therefore, some new extraction techniques like ultrasound-assisted extraction have been developed. Song et al. (2007) used an ultrasound cleaning bath in their ultrasound-assisted extractions. The soil sample was first irradiated then centrifuged, filtered, and analyzed using fluorescence analysis. Comparing the three extraction methods studied (ultrasound-assisted, microwave-assisted, and accelerated solvent extraction) the highest percentage recovery can be obtained using acclerated solvent extraction, but ultrasound-assisted extraction also gave better results than the conventional extraction methods.
Wang et al. (2008) performed experiments on the removal of organic matter and ammonia nitrogen from landfill leachate by ultrasound irradiation. The effects on COD reduction and ammonia removal of power input, initial concentration, initial pH, and aeration were studied. With increasing power input, the efficiency of COD removal was also increased. Initial COD concentration clearly affects the COD reduction efficiency. A lower initial COD
6. Ultrasound-assisted remediation of contaminated soil
61
concentration contributes to an increase in COD reduction efficiency. It is possible that organic matter with a lower initial COD concentration is more likely to enter the bubbles or encounter HO• radicals, while the gross COD reduction at a higher initial COD concentration is more than that with a lower initial COD concentration. COD reduction efficiency increased with increasing initial pH, but the effect of the initial pH was relatively small. Ultrasonic irradiation was shown to be an effective method for the removal of ammonia nitrogen from landfill leachate too. With increasing power input, the removal efficiency was increased and after 180 min ultrasound irradiation (20 kHz, 150 W), up to 96% ammonia-nitrogen removal efficiency can be achieved. The initial ammonia-nitrogen concentration has limited impact on removal efficiency, but increasing initial pH and aeration may enhance the sonochemical removal of ammonia-nitrogen in landfill leachate. Wang et al. (2008) concluded that the main mechanism of ammonia-nitrogen removal by ultrasound irradiation appears to be that the ammonia molecules in the leachate enter into the cavitation bubble and transform into nitrogen and hydrogen molecules via pyrolysis under instant high temperature and high pressure in the cavitation bubbles.
Much wastewater generated in agriculture, from chemical plants or in ground water leaching from fields is contamined with toxic and hazardous organic chloride compounds such as pesticides and herbicides. In Japan (4-chloro-2-methylphenoxy)acetic acid is one of the commonly used herbicides in rice fields. Compared to other pesticides and herbicides it is known to have higher toxicity and solubility in water. Ueno et al. (2009) reported an ultrasound-assisted extraction and decomposition method for (4-chloro-2-methylphenoxy)acetic acid in a model soil sample. In their studies the ultrasound frequency was 527 kHz and the ultrasound power 21 W. As a result, it was found that ultrasound irradiation significantly enhances (4-chloro-2-methylphenoxy)acetic acid extraction from model soil, which was attributed to various effects such as the formation of high-speed micro jets, particle fragmentation, and acoustic streaming on the disturbance of the diffusion layer on the surface.
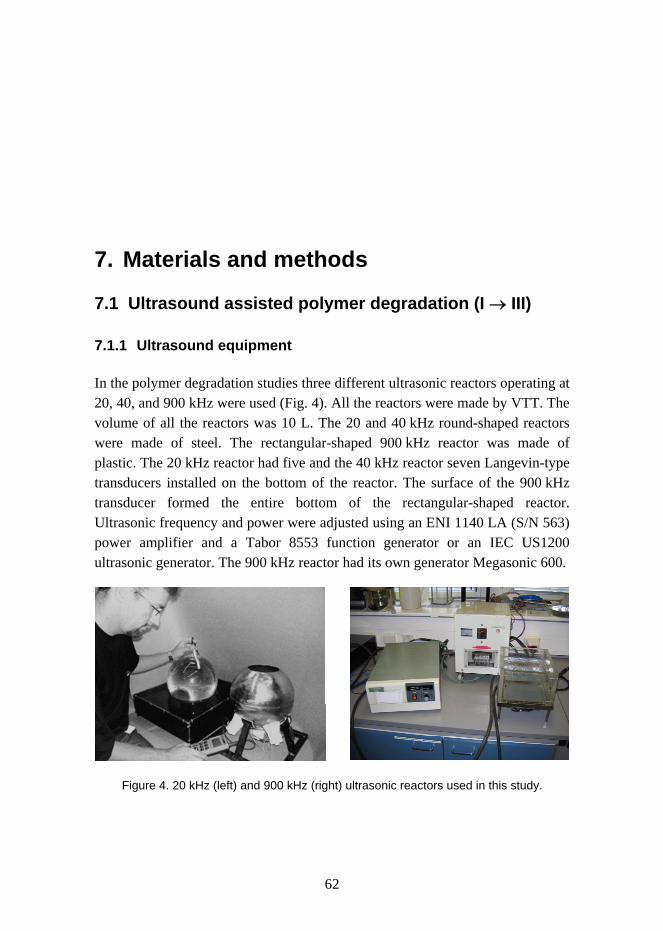
7. Materials and methods
62
7. Materials and methods
7.1 Ultrasound assisted polymer degradation (I → III)
7.1.1 Ultrasound equipment
In the polymer degradation studies three different ultrasonic reactors operating at 20, 40, and 900 kHz were used (Fig. 4). All the reactors were made by VTT. The volume of all the reactors was 10 L. The 20 and 40 kHz round-shaped reactors were made of steel. The rectangular-shaped 900 kHz reactor was made of plastic. The 20 kHz reactor had five and the 40 kHz reactor seven Langevin-type transducers installed on the bottom of the reactor. The surface of the 900 kHz transducer formed the entire bottom of the rectangular-shaped reactor. Ultrasonic frequency and power were adjusted using an ENI 1140 LA (S/N 563) power amplifier and a Tabor 8553 function generator or an IEC US1200 ultrasonic generator. The 900 kHz reactor had its own generator Megasonic 600.
Figure 4. 20 kHz (left) and 900 kHz (right) ultrasonic reactors used in this study.
7. Materials and methods
63
Calibration of the reactors was performed using hydrophone measurements. Hydrophone measurements also show the intensity of ultrasonic power.
7.1.2 Degradation methods
7.1.2.1 Polyvinyl alcohol
In the polyvinyl alcohol (PVA) studies, PVA obtained from BDH (British Drug House) laboratory supplies (average molecular mass 115,000 g/mol) was used to prepare PVA solutions at three concentrations (1%, 2%, and 3% (w/w)) with a mass of 5,000 g. No purification of the commercial PVA was performed and the ultrasonic treatments were performed at room temperature. Initially, the effect of ultrasonic input power on depolymerization, i.e. degradation of polymer was studied, and after that the depolymerization experiments were performed at two different ultrasonic input powers, one below and another above the cavitation threshold. It was quite difficult to measure the cavitation threshold but it was known that in water when the ultrasonic frequency is 20 kHz the threshold is in the range of 0.4–4.0 W/cm2 depending on the air content of the water (Mason and Lorimer 1988). The measured viscosities of the PVA were only slightly higher than the viscosity of water and thus the cavitation threshold of PVA should be approximately equal to that of water. The hydrophone measurements showed that when using ultrasonic input power of 10 W (2 W/L) the ultrasonic intensities in the middle of reactor were 0.0–3.2 W/cm2, and when using input power of 200 W (40 W/L) the ultrasonic intensities were 6.4–11.4 W/cm2 (calculated by means of equations (14)–(17)). For this reason, the input power below the cavitation threshold used at 20 and 40 kHz was 10 W and above cavitation threshold 200 W. At 900 kHz, 120 and 600 W were used respectively. Each solution was irradiated for 2 h and the samples were withdrawn for analysis at 30, 60, 90, and 120 min. The dynamic viscosity of the PVA solutions before and after sonication was measured using a Haake VT 501 viscometer at room temperature.
7.1.2.2 Carboxymethylcellulose
In the carboxymethylcellulose (CMC) studies, nine CMC (CMC 1-CMC 9) samples obtained from CP-Kelco Oy were used. The initial RMM of the samples is shown in Table 2.
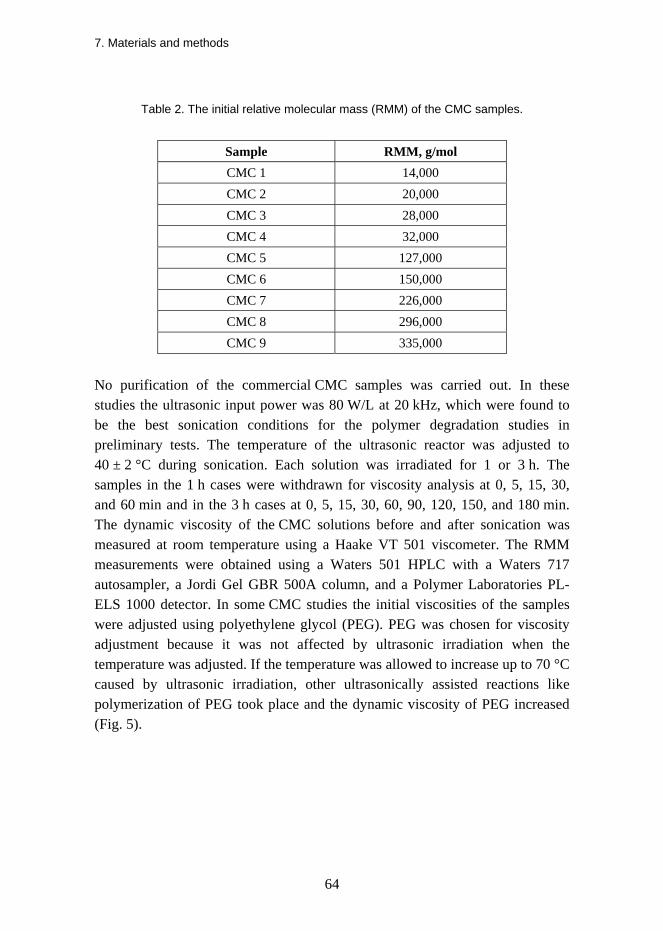
7. Materials and methods
64
Table 2. The initial relative molecular mass (RMM) of the CMC samples.
Sample RMM, g/mol CMC 1 14,000 CMC 2 20,000 CMC 3 28,000 CMC 4 32,000 CMC 5 127,000 CMC 6 150,000 CMC 7 226,000 CMC 8 296,000 CMC 9 335,000
No purification of the commercial CMC samples was carried out. In these studies the ultrasonic input power was 80 W/L at 20 kHz, which were found to be the best sonication conditions for the polymer degradation studies in preliminary tests. The temperature of the ultrasonic reactor was adjusted to 40 ± 2 °C during sonication. Each solution was irradiated for 1 or 3 h. The samples in the 1 h cases were withdrawn for viscosity analysis at 0, 5, 15, 30, and 60 min and in the 3 h cases at 0, 5, 15, 30, 60, 90, 120, 150, and 180 min. The dynamic viscosity of the CMC solutions before and after sonication was measured at room temperature using a Haake VT 501 viscometer. The RMM measurements were obtained using a Waters 501 HPLC with a Waters 717 autosampler, a Jordi Gel GBR 500A column, and a Polymer Laboratories PL-ELS 1000 detector. In some CMC studies the initial viscosities of the samples were adjusted using polyethylene glycol (PEG). PEG was chosen for viscosity adjustment because it was not affected by ultrasonic irradiation when the temperature was adjusted. If the temperature was allowed to increase up to 70 °C caused by ultrasonic irradiation, other ultrasonically assisted reactions like polymerization of PEG took place and the dynamic viscosity of PEG increased (Fig. 5).
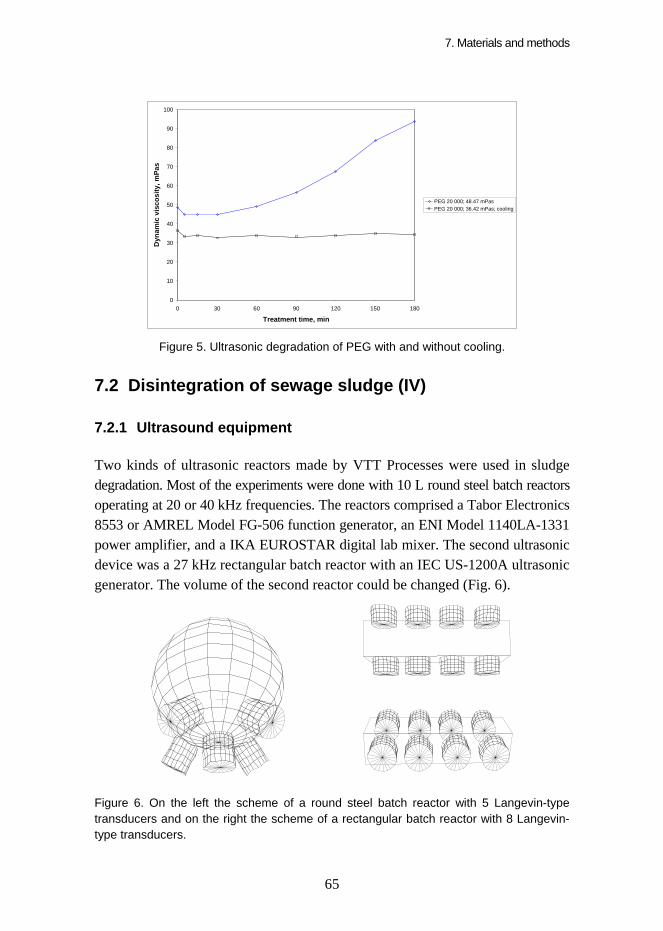
7. Materials and methods
65
0
10
20
30
40
50
60
70
80
90
100
0 30 60 90 120 150 180
Treatment time, min
Dyn
amic
vis
cosi
ty, m
Pas
PEG 20 000; 48.47 mPasPEG 20 000; 36.42 mPas; cooling
Figure 5. Ultrasonic degradation of PEG with and without cooling.
7.2 Disintegration of sewage sludge (IV)
7.2.1 Ultrasound equipment
Two kinds of ultrasonic reactors made by VTT Processes were used in sludge degradation. Most of the experiments were done with 10 L round steel batch reactors operating at 20 or 40 kHz frequencies. The reactors comprised a Tabor Electronics 8553 or AMREL Model FG-506 function generator, an ENI Model 1140LA-1331 power amplifier, and a IKA EUROSTAR digital lab mixer. The second ultrasonic device was a 27 kHz rectangular batch reactor with an IEC US-1200A ultrasonic generator. The volume of the second reactor could be changed (Fig. 6).
Figure 6. On the left the scheme of a round steel batch reactor with 5 Langevin-type transducers and on the right the scheme of a rectangular batch reactor with 8 Langevin-type transducers.
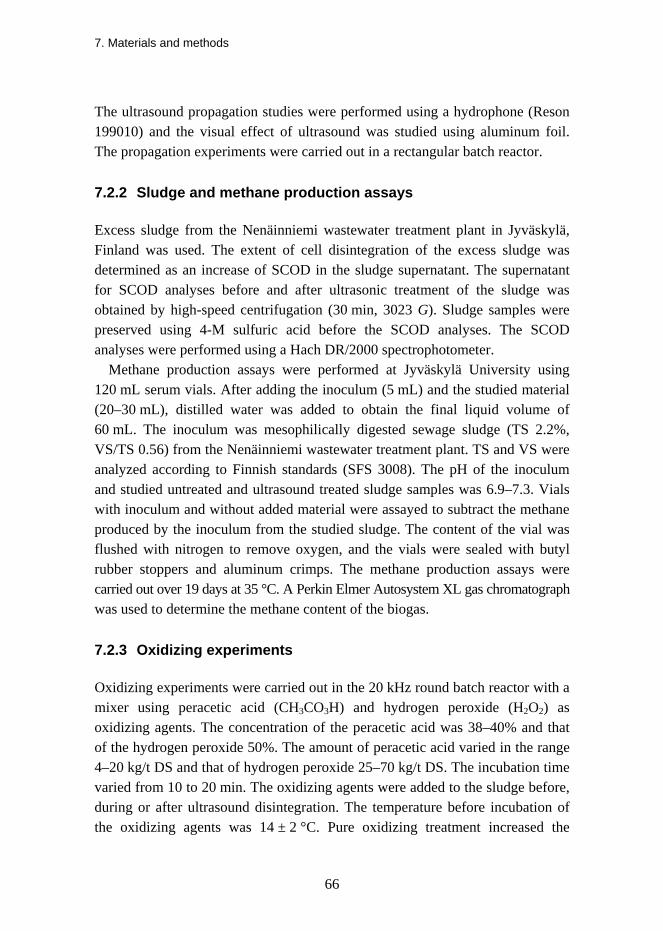
7. Materials and methods
66
The ultrasound propagation studies were performed using a hydrophone (Reson 199010) and the visual effect of ultrasound was studied using aluminum foil. The propagation experiments were carried out in a rectangular batch reactor.
7.2.2 Sludge and methane production assays
Excess sludge from the Nenäinniemi wastewater treatment plant in Jyväskylä, Finland was used. The extent of cell disintegration of the excess sludge was determined as an increase of SCOD in the sludge supernatant. The supernatant for SCOD analyses before and after ultrasonic treatment of the sludge was obtained by high-speed centrifugation (30 min, 3023 G). Sludge samples were preserved using 4-M sulfuric acid before the SCOD analyses. The SCOD analyses were performed using a Hach DR/2000 spectrophotometer.
Methane production assays were performed at Jyväskylä University using 120 mL serum vials. After adding the inoculum (5 mL) and the studied material (20–30 mL), distilled water was added to obtain the final liquid volume of 60 mL. The inoculum was mesophilically digested sewage sludge (TS 2.2%, VS/TS 0.56) from the Nenäinniemi wastewater treatment plant. TS and VS were analyzed according to Finnish standards (SFS 3008). The pH of the inoculum and studied untreated and ultrasound treated sludge samples was 6.9–7.3. Vials with inoculum and without added material were assayed to subtract the methane produced by the inoculum from the studied sludge. The content of the vial was flushed with nitrogen to remove oxygen, and the vials were sealed with butyl rubber stoppers and aluminum crimps. The methane production assays were carried out over 19 days at 35 °C. A Perkin Elmer Autosystem XL gas chromatograph was used to determine the methane content of the biogas.
7.2.3 Oxidizing experiments
Oxidizing experiments were carried out in the 20 kHz round batch reactor with a mixer using peracetic acid (CH3CO3H) and hydrogen peroxide (H2O2) as oxidizing agents. The concentration of the peracetic acid was 38–40% and that of the hydrogen peroxide 50%. The amount of peracetic acid varied in the range 4–20 kg/t DS and that of hydrogen peroxide 25–70 kg/t DS. The incubation time varied from 10 to 20 min. The oxidizing agents were added to the sludge before, during or after ultrasound disintegration. The temperature before incubation of the oxidizing agents was 14 ± 2 °C. Pure oxidizing treatment increased the
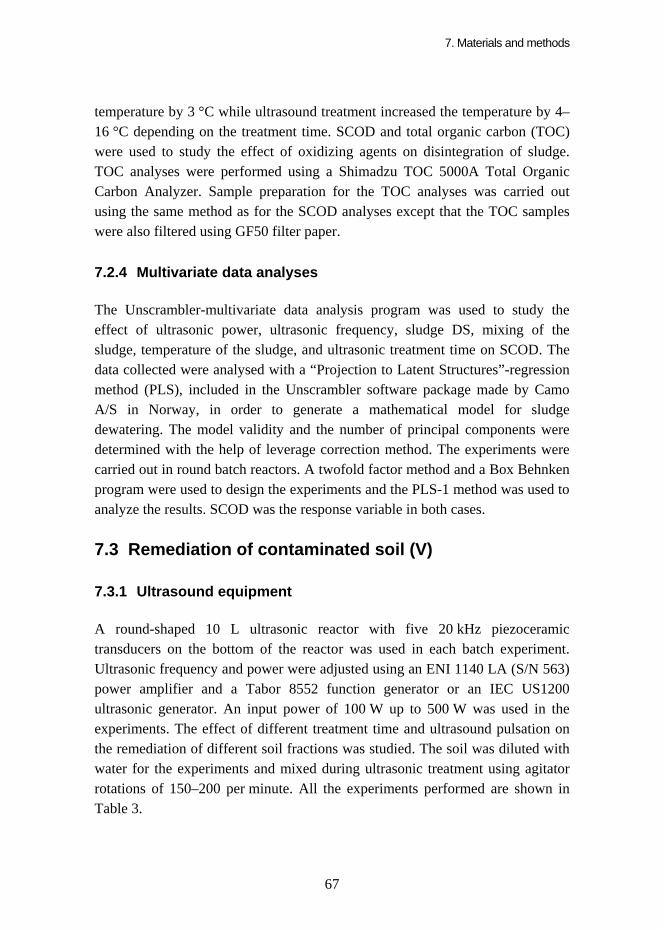
7. Materials and methods
67
temperature by 3 °C while ultrasound treatment increased the temperature by 4–16 °C depending on the treatment time. SCOD and total organic carbon (TOC) were used to study the effect of oxidizing agents on disintegration of sludge. TOC analyses were performed using a Shimadzu TOC 5000A Total Organic Carbon Analyzer. Sample preparation for the TOC analyses was carried out using the same method as for the SCOD analyses except that the TOC samples were also filtered using GF50 filter paper.
7.2.4 Multivariate data analyses
The Unscrambler-multivariate data analysis program was used to study the effect of ultrasonic power, ultrasonic frequency, sludge DS, mixing of the sludge, temperature of the sludge, and ultrasonic treatment time on SCOD. The data collected were analysed with a “Projection to Latent Structures”-regression method (PLS), included in the Unscrambler software package made by Camo A/S in Norway, in order to generate a mathematical model for sludge dewatering. The model validity and the number of principal components were determined with the help of leverage correction method. The experiments were carried out in round batch reactors. A twofold factor method and a Box Behnken program were used to design the experiments and the PLS-1 method was used to analyze the results. SCOD was the response variable in both cases.
7.3 Remediation of contaminated soil (V)
7.3.1 Ultrasound equipment
A round-shaped 10 L ultrasonic reactor with five 20 kHz piezoceramic transducers on the bottom of the reactor was used in each batch experiment. Ultrasonic frequency and power were adjusted using an ENI 1140 LA (S/N 563) power amplifier and a Tabor 8552 function generator or an IEC US1200 ultrasonic generator. An input power of 100 W up to 500 W was used in the experiments. The effect of different treatment time and ultrasound pulsation on the remediation of different soil fractions was studied. The soil was diluted with water for the experiments and mixed during ultrasonic treatment using agitator rotations of 150–200 per minute. All the experiments performed are shown in Table 3.
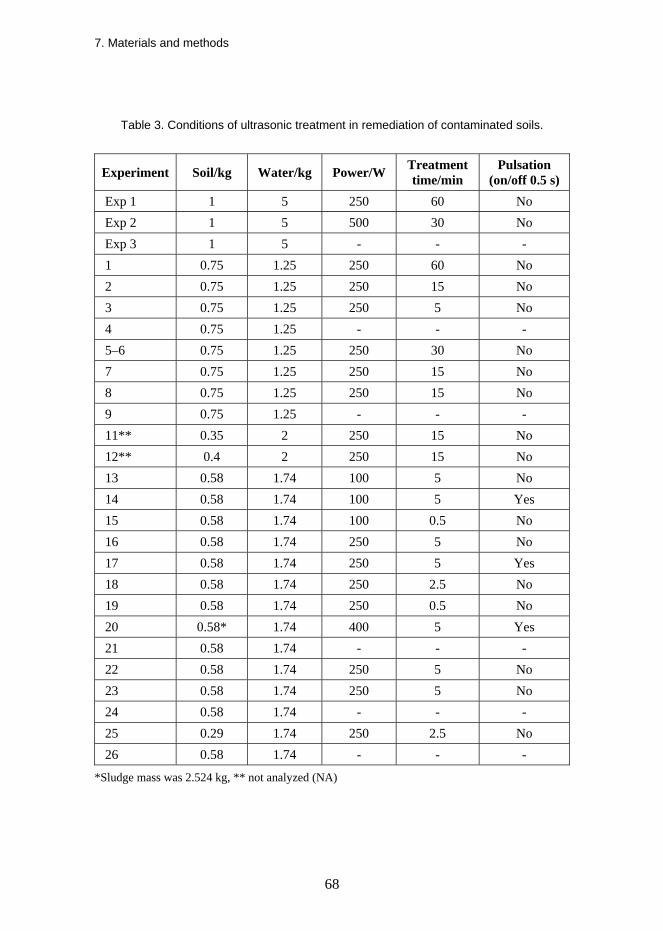
7. Materials and methods
68
Table 3. Conditions of ultrasonic treatment in remediation of contaminated soils.
Experiment Soil/kg Water/kg Power/W Treatment time/min
Pulsation (on/off 0.5 s)
Exp 1 1 5 250 60 No Exp 2 1 5 500 30 No Exp 3 1 5 - - - 1 0.75 1.25 250 60 No 2 0.75 1.25 250 15 No 3 0.75 1.25 250 5 No 4 0.75 1.25 - - - 5–6 0.75 1.25 250 30 No 7 0.75 1.25 250 15 No 8 0.75 1.25 250 15 No 9 0.75 1.25 - - - 11** 0.35 2 250 15 No 12** 0.4 2 250 15 No 13 0.58 1.74 100 5 No 14 0.58 1.74 100 5 Yes 15 0.58 1.74 100 0.5 No 16 0.58 1.74 250 5 No 17 0.58 1.74 250 5 Yes 18 0.58 1.74 250 2.5 No 19 0.58 1.74 250 0.5 No 20 0.58* 1.74 400 5 Yes 21 0.58 1.74 - - - 22 0.58 1.74 250 5 No 23 0.58 1.74 250 5 No 24 0.58 1.74 - - - 25 0.29 1.74 250 2.5 No 26 0.58 1.74 - - -
*Sludge mass was 2.524 kg, ** not analyzed (NA)
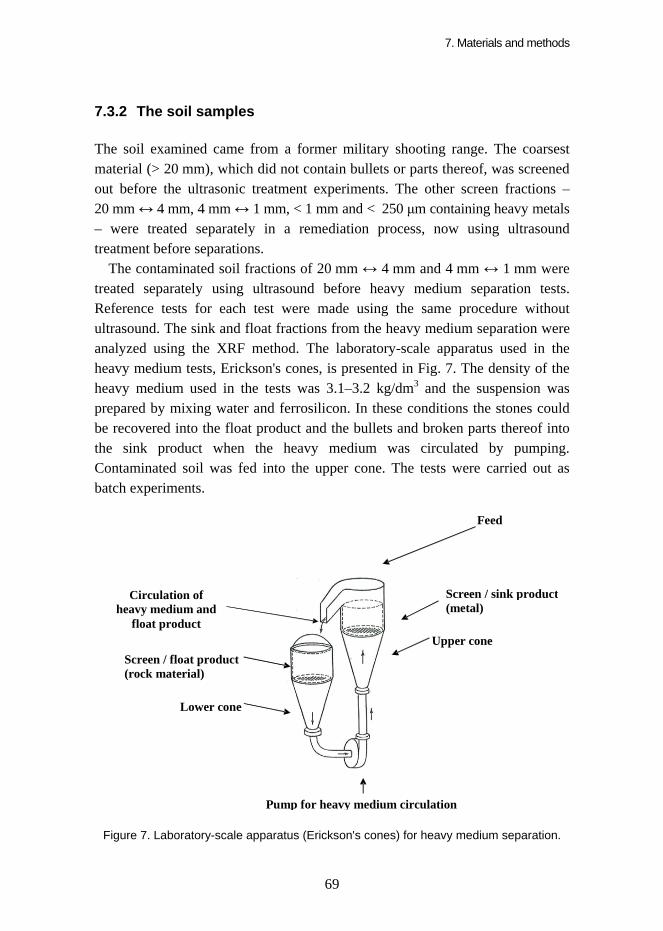
7. Materials and methods
69
7.3.2 The soil samples
The soil examined came from a former military shooting range. The coarsest material (> 20 mm), which did not contain bullets or parts thereof, was screened out before the ultrasonic treatment experiments. The other screen fractions – 20 mm ↔ 4 mm, 4 mm ↔ 1 mm, < 1 mm and < 250 μm containing heavy metals – were treated separately in a remediation process, now using ultrasound treatment before separations.
The contaminated soil fractions of 20 mm ↔ 4 mm and 4 mm ↔ 1 mm were treated separately using ultrasound before heavy medium separation tests. Reference tests for each test were made using the same procedure without ultrasound. The sink and float fractions from the heavy medium separation were analyzed using the XRF method. The laboratory-scale apparatus used in the heavy medium tests, Erickson's cones, is presented in Fig. 7. The density of the heavy medium used in the tests was 3.1–3.2 kg/dm3 and the suspension was prepared by mixing water and ferrosilicon. In these conditions the stones could be recovered into the float product and the bullets and broken parts thereof into the sink product when the heavy medium was circulated by pumping. Contaminated soil was fed into the upper cone. The tests were carried out as batch experiments.
Lower cone
Upper cone
Pump for heavy medium circulation
Circulation of heavy medium and
float product
Screen / float product (rock material)
Screen / sink product(metal)
Feed
Figure 7. Laboratory-scale apparatus (Erickson's cones) for heavy medium separation.
7. Materials and methods
70
The ultrasonically treated < 1 mm fraction was screened into eight smaller fractions and the metal content (lead and copper) in each fraction was analyzed using the XRF method.
The < 1 mm fraction was first screened into fractions of > 250 and < 250 μm before flotation and US treatment. Flotation experiments were performed only for the < 250 μm fraction because the flotation method used could not effectively operate with > 250 μm particles. This shortcoming will be avoided in the follow-up study by using SIF (flotation in froth) technology, which can operate with < 1 mm material. The < 250 μm soil fraction was first treated using ultrasound with different combinations of treatment time and pulsation, and then floated. The mineral concentrates and tailings from the flotation were filtrated and the metal contents (lead and copper) were analyzed using the XRF method on the filter cakes. The flotation experiments were mainly carried out using a turnip fatty acid-type collector (RaRa). Emulgator-type KOAL 10 was used to disperse the fatty acid collector in the water to improve the collection of hydrophobic particles. The sulfide collector potassium amyl xanthate (KAX) was used in some experiments alone or together with copper sulfate (CuSO4) activator. The purpose of this activator was to alter the particle surface properties by changing, for example, the original Pb compound to the corresponding Cu compound to improve collection of particles better. NaHS activator was also used in some experiments together with the sulfide collector sodium isopropylxanthate (NaIPX). The purpose of the NaHS treatment was to modify the surface of the particles to be flotated to the corresponding heavy metal sulfides since in the latter state they can be more easily flotated than in their original form of heavy metal carbonate or pure heavy metal. NaOH (fatty acid flotation) and H2SO4 (xanthate flotation) were used for pH regulation.
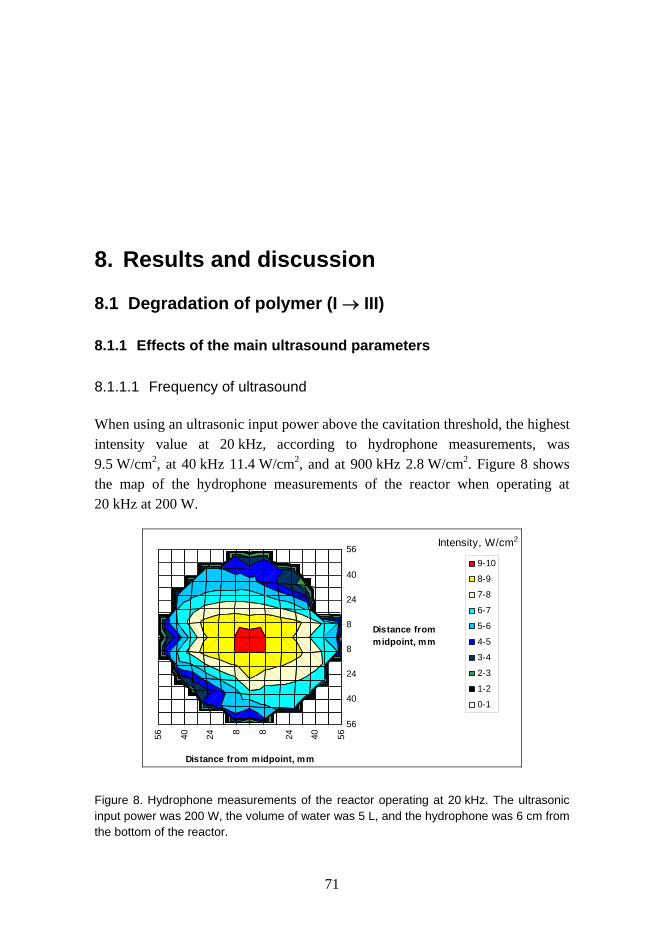
8. Results and discussion
71
8. Results and discussion
8.1 Degradation of polymer (I → III)
8.1.1 Effects of the main ultrasound parameters
8.1.1.1 Frequency of ultrasound
When using an ultrasonic input power above the cavitation threshold, the highest intensity value at 20 kHz, according to hydrophone measurements, was 9.5 W/cm2, at 40 kHz 11.4 W/cm2, and at 900 kHz 2.8 W/cm2. Figure 8 shows the map of the hydrophone measurements of the reactor when operating at 20 kHz at 200 W.
56 40 24 8 8 24 40 56
56
40
24
8
8
24
40
56
Distance from midpoint, mm
Distance from midpoint, mm
9-10
8-9
7-8
6-7
5-6
4-5
3-4
2-3
1-2
0-1
Intensity, W/cm2
Figure 8. Hydrophone measurements of the reactor operating at 20 kHz. The ultrasonic input power was 200 W, the volume of water was 5 L, and the hydrophone was 6 cm from the bottom of the reactor.
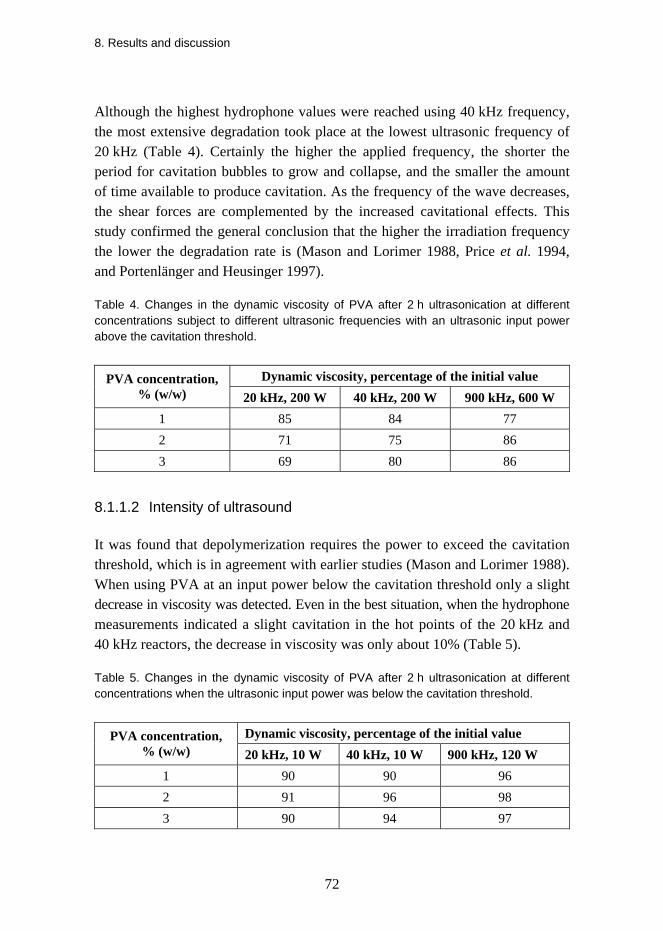
8. Results and discussion
72
Although the highest hydrophone values were reached using 40 kHz frequency, the most extensive degradation took place at the lowest ultrasonic frequency of 20 kHz (Table 4). Certainly the higher the applied frequency, the shorter the period for cavitation bubbles to grow and collapse, and the smaller the amount of time available to produce cavitation. As the frequency of the wave decreases, the shear forces are complemented by the increased cavitational effects. This study confirmed the general conclusion that the higher the irradiation frequency the lower the degradation rate is (Mason and Lorimer 1988, Price et al. 1994, and Portenlänger and Heusinger 1997).
Table 4. Changes in the dynamic viscosity of PVA after 2 h ultrasonication at different concentrations subject to different ultrasonic frequencies with an ultrasonic input power above the cavitation threshold.
Dynamic viscosity, percentage of the initial value PVA concentration, % (w/w) 20 kHz, 200 W 40 kHz, 200 W 900 kHz, 600 W
1 85 84 77 2 71 75 86 3 69 80 86
8.1.1.2 Intensity of ultrasound
It was found that depolymerization requires the power to exceed the cavitation threshold, which is in agreement with earlier studies (Mason and Lorimer 1988). When using PVA at an input power below the cavitation threshold only a slight decrease in viscosity was detected. Even in the best situation, when the hydrophone measurements indicated a slight cavitation in the hot points of the 20 kHz and 40 kHz reactors, the decrease in viscosity was only about 10% (Table 5).
Table 5. Changes in the dynamic viscosity of PVA after 2 h ultrasonication at different concentrations when the ultrasonic input power was below the cavitation threshold.
Dynamic viscosity, percentage of the initial value PVA concentration, % (w/w) 20 kHz, 10 W 40 kHz, 10 W 900 kHz, 120 W
1 90 90 96 2 91 96 98 3 90 94 97
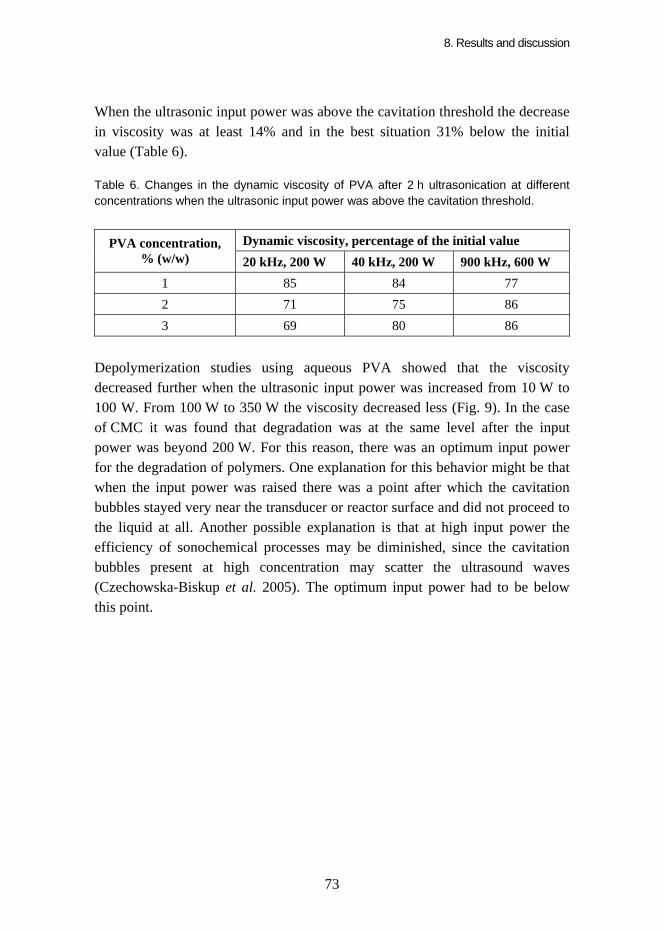
8. Results and discussion
73
When the ultrasonic input power was above the cavitation threshold the decrease in viscosity was at least 14% and in the best situation 31% below the initial value (Table 6).
Table 6. Changes in the dynamic viscosity of PVA after 2 h ultrasonication at different concentrations when the ultrasonic input power was above the cavitation threshold.
Dynamic viscosity, percentage of the initial value PVA concentration, % (w/w) 20 kHz, 200 W 40 kHz, 200 W 900 kHz, 600 W
1 85 84 77 2 71 75 86 3 69 80 86
Depolymerization studies using aqueous PVA showed that the viscosity decreased further when the ultrasonic input power was increased from 10 W to 100 W. From 100 W to 350 W the viscosity decreased less (Fig. 9). In the case of CMC it was found that degradation was at the same level after the input power was beyond 200 W. For this reason, there was an optimum input power for the degradation of polymers. One explanation for this behavior might be that when the input power was raised there was a point after which the cavitation bubbles stayed very near the transducer or reactor surface and did not proceed to the liquid at all. Another possible explanation is that at high input power the efficiency of sonochemical processes may be diminished, since the cavitation bubbles present at high concentration may scatter the ultrasound waves (Czechowska-Biskup et al. 2005). The optimum input power had to be below this point.
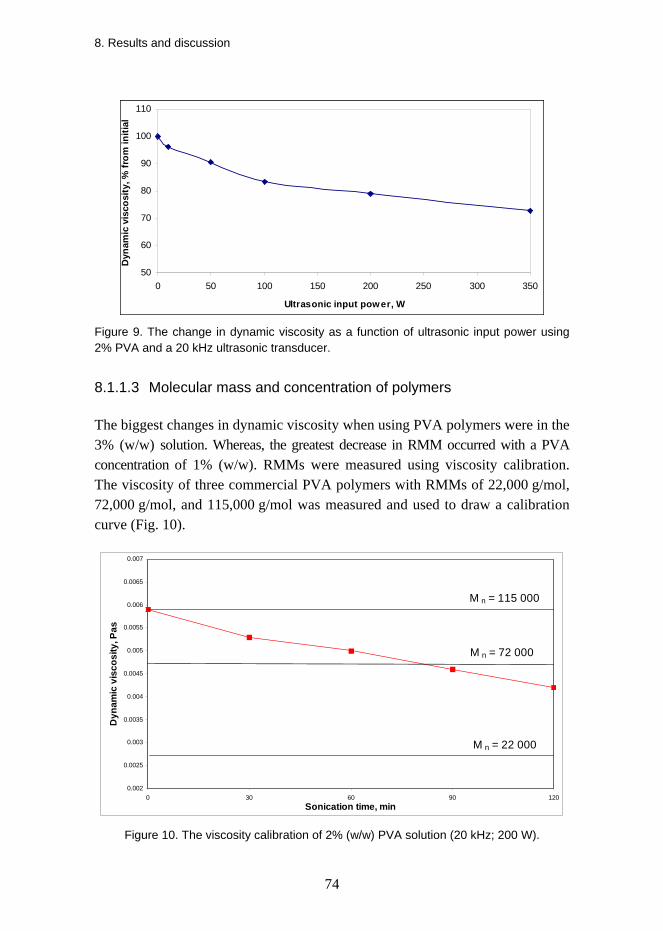
8. Results and discussion
74
50
60
70
80
90
100
110
0 50 100 150 200 250 300 350
Ultrasonic input power, W
Dyn
amic
vis
cosi
ty, %
from
initi
al
Figure 9. The change in dynamic viscosity as a function of ultrasonic input power using 2% PVA and a 20 kHz ultrasonic transducer.
8.1.1.3 Molecular mass and concentration of polymers
The biggest changes in dynamic viscosity when using PVA polymers were in the 3% (w/w) solution. Whereas, the greatest decrease in RMM occurred with a PVA concentration of 1% (w/w). RMMs were measured using viscosity calibration. The viscosity of three commercial PVA polymers with RMMs of 22,000 g/mol, 72,000 g/mol, and 115,000 g/mol was measured and used to draw a calibration curve (Fig. 10).
0.002
0.0025
0.003
0.0035
0.004
0.0045
0.005
0.0055
0.006
0.0065
0.007
0 30 60 90 120Sonication time, min
Dyn
amic
vis
cosi
ty, P
as
M n = 72 000
M n = 22 000
M n = 115 000
Figure 10. The viscosity calibration of 2% (w/w) PVA solution (20 kHz; 200 W).
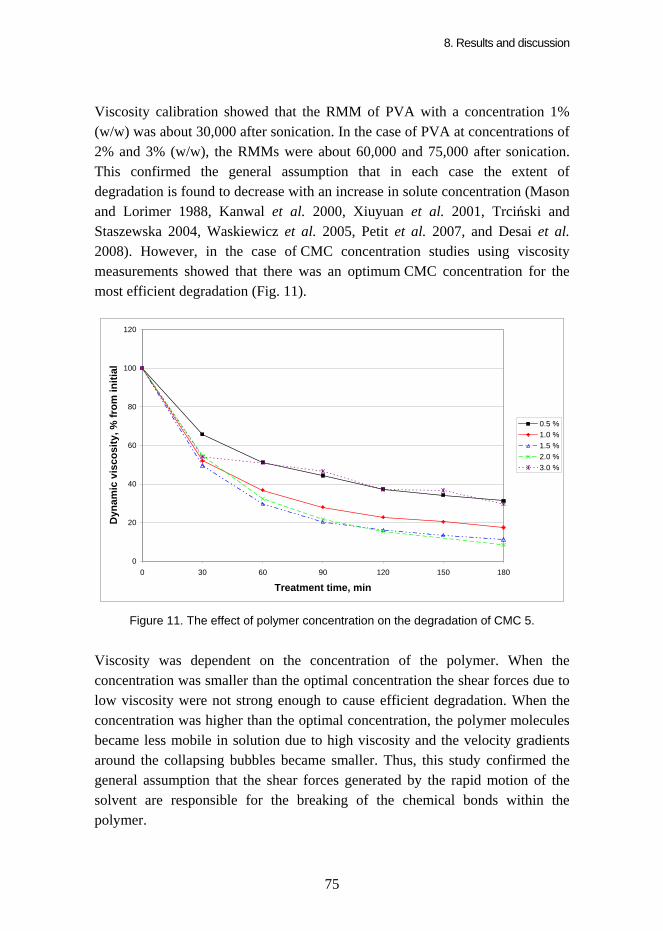
8. Results and discussion
75
Viscosity calibration showed that the RMM of PVA with a concentration 1% (w/w) was about 30,000 after sonication. In the case of PVA at concentrations of 2% and 3% (w/w), the RMMs were about 60,000 and 75,000 after sonication. This confirmed the general assumption that in each case the extent of degradation is found to decrease with an increase in solute concentration (Mason and Lorimer 1988, Kanwal et al. 2000, Xiuyuan et al. 2001, Trciński and Staszewska 2004, Waskiewicz et al. 2005, Petit et al. 2007, and Desai et al. 2008). However, in the case of CMC concentration studies using viscosity measurements showed that there was an optimum CMC concentration for the most efficient degradation (Fig. 11).
0
20
40
60
80
100
120
0 30 60 90 120 150 180
Treatment time, min
Dyn
amic
vis
cosi
ty, %
from
initi
al
0.5 %1.0 %1.5 %2.0 %3.0 %
Figure 11. The effect of polymer concentration on the degradation of CMC 5.
Viscosity was dependent on the concentration of the polymer. When the concentration was smaller than the optimal concentration the shear forces due to low viscosity were not strong enough to cause efficient degradation. When the concentration was higher than the optimal concentration, the polymer molecules became less mobile in solution due to high viscosity and the velocity gradients around the collapsing bubbles became smaller. Thus, this study confirmed the general assumption that the shear forces generated by the rapid motion of the solvent are responsible for the breaking of the chemical bonds within the polymer.
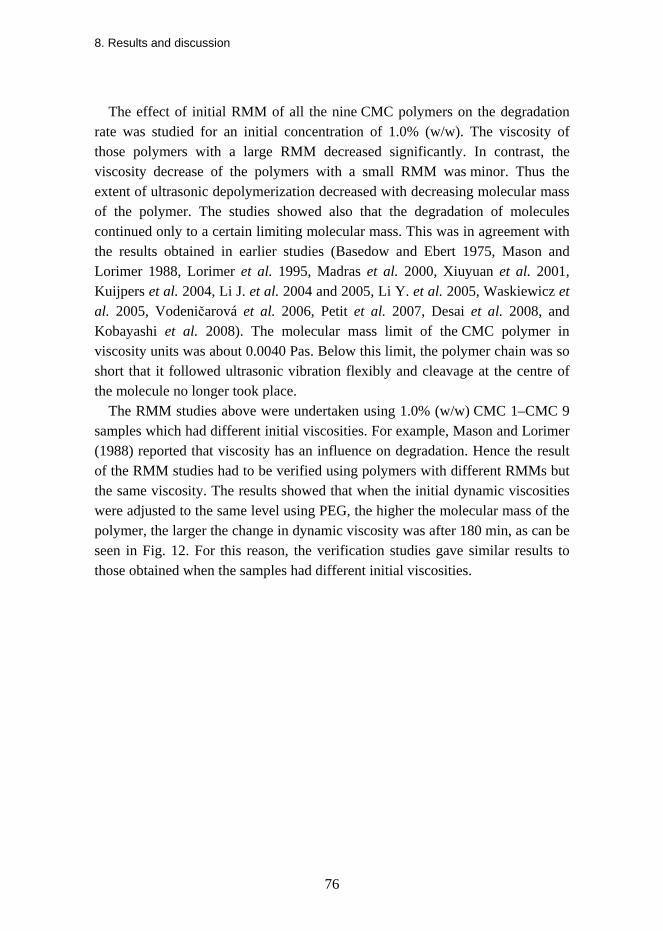
8. Results and discussion
76
The effect of initial RMM of all the nine CMC polymers on the degradation rate was studied for an initial concentration of 1.0% (w/w). The viscosity of those polymers with a large RMM decreased significantly. In contrast, the viscosity decrease of the polymers with a small RMM was minor. Thus the extent of ultrasonic depolymerization decreased with decreasing molecular mass of the polymer. The studies showed also that the degradation of molecules continued only to a certain limiting molecular mass. This was in agreement with the results obtained in earlier studies (Basedow and Ebert 1975, Mason and Lorimer 1988, Lorimer et al. 1995, Madras et al. 2000, Xiuyuan et al. 2001, Kuijpers et al. 2004, Li J. et al. 2004 and 2005, Li Y. et al. 2005, Waskiewicz et al. 2005, Vodeničarová et al. 2006, Petit et al. 2007, Desai et al. 2008, and Kobayashi et al. 2008). The molecular mass limit of the CMC polymer in viscosity units was about 0.0040 Pas. Below this limit, the polymer chain was so short that it followed ultrasonic vibration flexibly and cleavage at the centre of the molecule no longer took place.
The RMM studies above were undertaken using 1.0% (w/w) CMC 1–CMC 9 samples which had different initial viscosities. For example, Mason and Lorimer (1988) reported that viscosity has an influence on degradation. Hence the result of the RMM studies had to be verified using polymers with different RMMs but the same viscosity. The results showed that when the initial dynamic viscosities were adjusted to the same level using PEG, the higher the molecular mass of the polymer, the larger the change in dynamic viscosity was after 180 min, as can be seen in Fig. 12. For this reason, the verification studies gave similar results to those obtained when the samples had different initial viscosities.
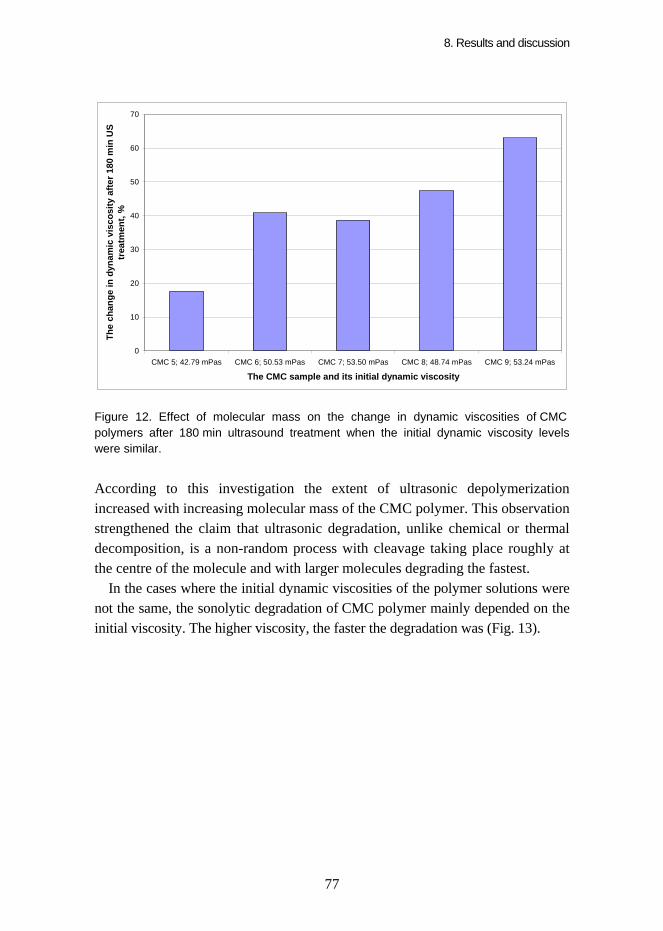
8. Results and discussion
77
0
10
20
30
40
50
60
70
CMC 5; 42.79 mPas CMC 6; 50.53 mPas CMC 7; 53.50 mPas CMC 8; 48.74 mPas CMC 9; 53.24 mPas
The CMC sample and its initial dynamic viscosity
The
chan
ge in
dyn
amic
vis
cosi
ty a
fter 1
80 m
in U
S tr
eatm
ent,
%
Figure 12. Effect of molecular mass on the change in dynamic viscosities of CMC polymers after 180 min ultrasound treatment when the initial dynamic viscosity levels were similar.
According to this investigation the extent of ultrasonic depolymerization increased with increasing molecular mass of the CMC polymer. This observation strengthened the claim that ultrasonic degradation, unlike chemical or thermal decomposition, is a non-random process with cleavage taking place roughly at the centre of the molecule and with larger molecules degrading the fastest.
In the cases where the initial dynamic viscosities of the polymer solutions were not the same, the sonolytic degradation of CMC polymer mainly depended on the initial viscosity. The higher viscosity, the faster the degradation was (Fig. 13).
8. Results and discussion
78
50
55
60
65
70
75
80
CMC 7/I;17.45 mPas
CMC 6/1;26.69 mPas
CMC 5;46.51 mPas
CMC 6/2;43.36 mPas
CMC 6/3;43.37 mPas
CMC 6/4;47.52 mPas
CMC 8/2;46.18 mPas
CMC 8/3;68.86 mPas
CMC 8/4;73.25 mPAs
The CMC sample and its initial dynamic viscosity
The
chan
ge in
dyn
amic
vis
cosi
ty a
fter 1
80 m
in U
S tr
eatm
ent,
%
Figure 13. The effect of initial dynamic viscosities on the change in dynamic viscosities after 180 min ultrasound treatment.
The study also showed that in cases where the initial dynamic viscosities of the polymer solutions were not adjusted but the initial viscosities were almost the same, the longer the CMC polymer chain length the faster the degradation (in Figure 13; CMC 5, CMC 6/2, CMC 6/3, CMC 6/4, and CMC 8/2). This finding was also in agreement with earlier studies, where it has been suggested that the larger the molecule the faster the degradation (Basedow and Ebert 1975, Mason and Lorimer 1988, Lorimer et al. 1995, Madras et al. 2000, Xiuyuan et al. 2001, Kuijpers et al. 2004, Li J. et al. 2004 and 2005, Li Y. et al. 2005, Waskiewicz et al. 2005, Vodeničarová et al. 2006, Petit et al. 2007, Desai et al. 2008, and Kobayashi et al. 2008).
The CMC concentration studies proved that the higher the polymer concentration the higher the degradation rates when the initial viscosity was adjusted using PEG (Fig. 14). The changes in dynamic viscosity in Fig. 14 in the area of 0.25–1.00% w/w differed from the area of 1.25–3.00% w/w because of the different initial dynamic viscosity levels. This result was in disagreement with earlier results where degradation decreased with an increase in solute concentration (Mason and Lorimer 1988, Kanwal et al. 2000, Xiuyuan et al. 2001, Trciński and Staszewska 2004, Waskiewicz et al. 2005, Petit et al. 2007, and Desai et al. (2008). However, the result was in agreement with the
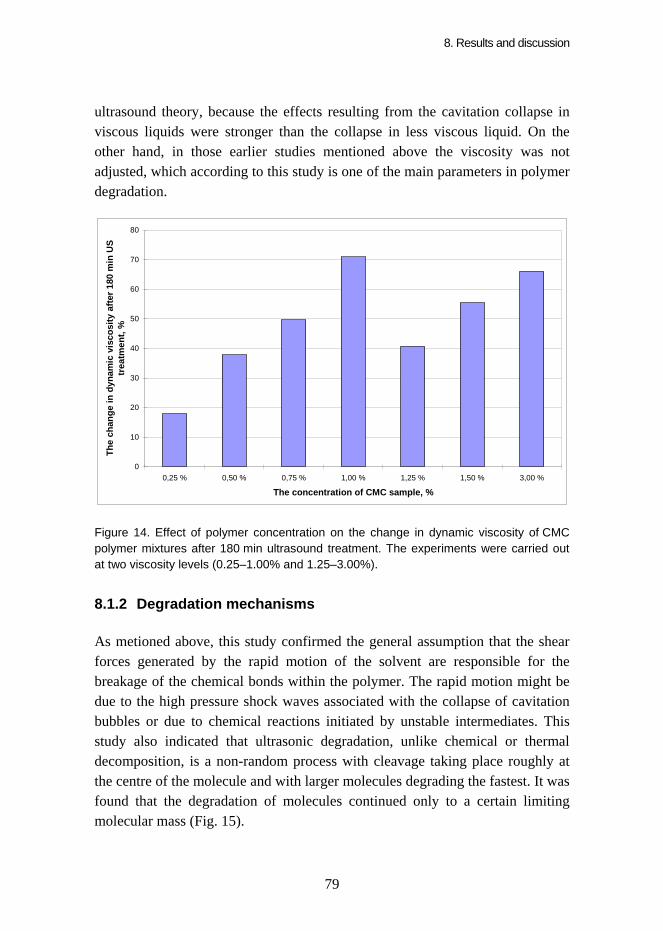
8. Results and discussion
79
ultrasound theory, because the effects resulting from the cavitation collapse in viscous liquids were stronger than the collapse in less viscous liquid. On the other hand, in those earlier studies mentioned above the viscosity was not adjusted, which according to this study is one of the main parameters in polymer degradation.
0
10
20
30
40
50
60
70
80
0,25 % 0,50 % 0,75 % 1,00 % 1,25 % 1,50 % 3,00 %
The concentration of CMC sample, %
The
chan
ge in
dyn
amic
vis
cosi
ty a
fter 1
80 m
in U
S tr
eatm
ent,
%
Figure 14. Effect of polymer concentration on the change in dynamic viscosity of CMC polymer mixtures after 180 min ultrasound treatment. The experiments were carried out at two viscosity levels (0.25–1.00% and 1.25–3.00%).
8.1.2 Degradation mechanisms
As metioned above, this study confirmed the general assumption that the shear forces generated by the rapid motion of the solvent are responsible for the breakage of the chemical bonds within the polymer. The rapid motion might be due to the high pressure shock waves associated with the collapse of cavitation bubbles or due to chemical reactions initiated by unstable intermediates. This study also indicated that ultrasonic degradation, unlike chemical or thermal decomposition, is a non-random process with cleavage taking place roughly at the centre of the molecule and with larger molecules degrading the fastest. It was found that the degradation of molecules continued only to a certain limiting molecular mass (Fig. 15).
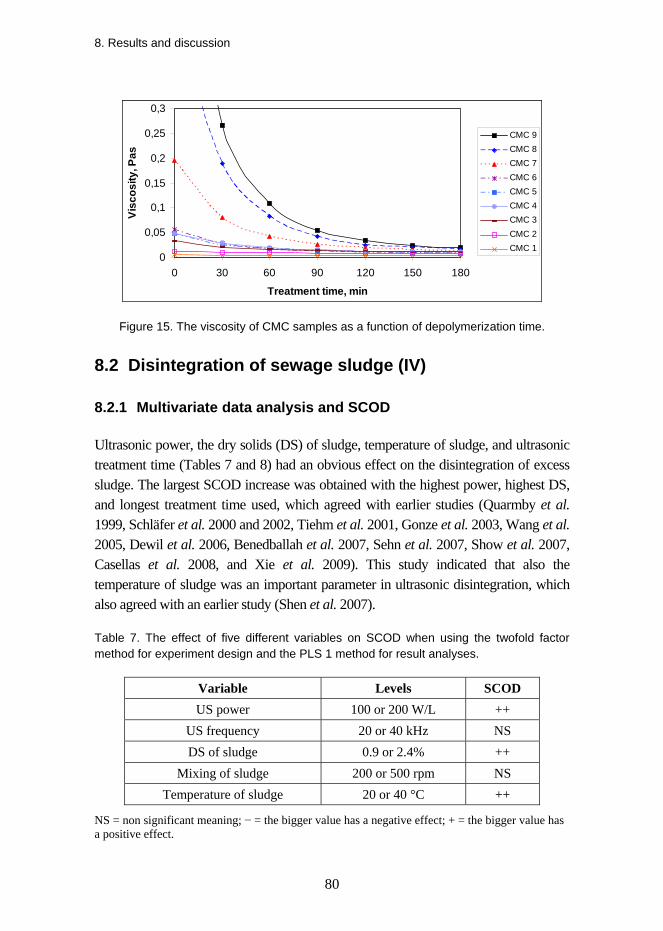
8. Results and discussion
80
0
0,05
0,1
0,15
0,2
0,25
0,3
0 30 60 90 120 150 180
Treatment time, min
Visc
osity
, Pas
CMC 9CMC 8CMC 7CMC 6CMC 5CMC 4CMC 3CMC 2CMC 1
Figure 15. The viscosity of CMC samples as a function of depolymerization time.
8.2 Disintegration of sewage sludge (IV)
8.2.1 Multivariate data analysis and SCOD
Ultrasonic power, the dry solids (DS) of sludge, temperature of sludge, and ultrasonic treatment time (Tables 7 and 8) had an obvious effect on the disintegration of excess sludge. The largest SCOD increase was obtained with the highest power, highest DS, and longest treatment time used, which agreed with earlier studies (Quarmby et al. 1999, Schläfer et al. 2000 and 2002, Tiehm et al. 2001, Gonze et al. 2003, Wang et al. 2005, Dewil et al. 2006, Benedballah et al. 2007, Sehn et al. 2007, Show et al. 2007, Casellas et al. 2008, and Xie et al. 2009). This study indicated that also the temperature of sludge was an important parameter in ultrasonic disintegration, which also agreed with an earlier study (Shen et al. 2007).
Table 7. The effect of five different variables on SCOD when using the twofold factor method for experiment design and the PLS 1 method for result analyses.
Variable Levels SCOD US power 100 or 200 W/L ++
US frequency 20 or 40 kHz NS DS of sludge 0.9 or 2.4% ++
Mixing of sludge 200 or 500 rpm NS Temperature of sludge 20 or 40 °C ++
NS = non significant meaning; − = the bigger value has a negative effect; + = the bigger value has a positive effect.
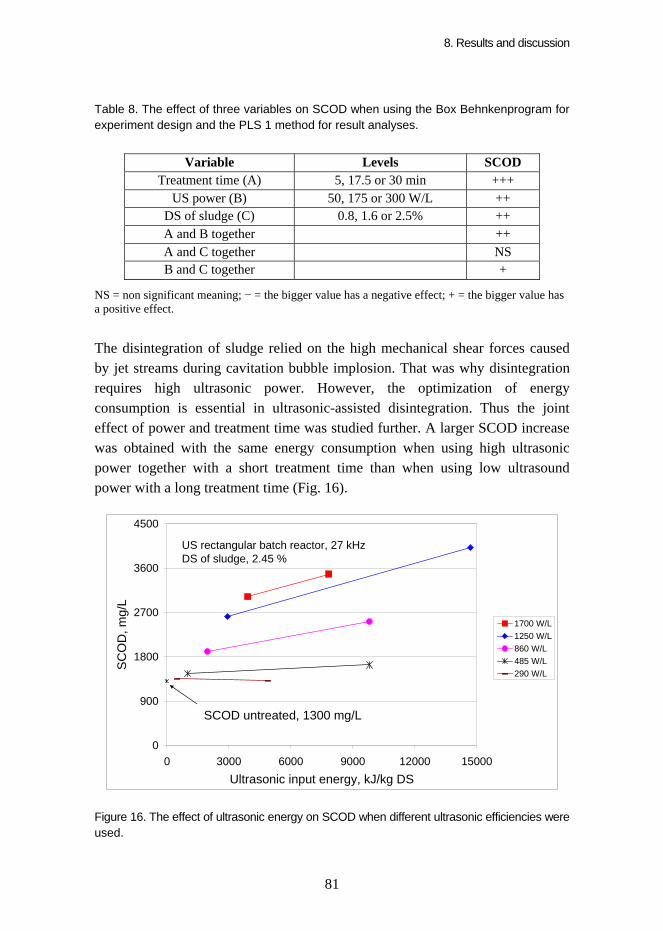
8. Results and discussion
81
Table 8. The effect of three variables on SCOD when using the Box Behnkenprogram for experiment design and the PLS 1 method for result analyses.
Variable Levels SCOD Treatment time (A) 5, 17.5 or 30 min +++
US power (B) 50, 175 or 300 W/L ++ DS of sludge (C) 0.8, 1.6 or 2.5% ++ A and B together ++ A and C together NS B and C together +
NS = non significant meaning; − = the bigger value has a negative effect; + = the bigger value has a positive effect.
The disintegration of sludge relied on the high mechanical shear forces caused by jet streams during cavitation bubble implosion. That was why disintegration requires high ultrasonic power. However, the optimization of energy consumption is essential in ultrasonic-assisted disintegration. Thus the joint effect of power and treatment time was studied further. A larger SCOD increase was obtained with the same energy consumption when using high ultrasonic power together with a short treatment time than when using low ultrasound power with a long treatment time (Fig. 16).
0
900
1800
2700
3600
4500
0 3000 6000 9000 12000 15000Ultrasonic input energy, kJ/kg DS
SC
OD
, mg/
L
1700 W/L1250 W/L860 W/L485 W/L290 W/L
US rectangular batch reactor, 27 kHzDS of sludge, 2.45 %
SCOD untreated, 1300 mg/L
Figure 16. The effect of ultrasonic energy on SCOD when different ultrasonic efficiencies were used.
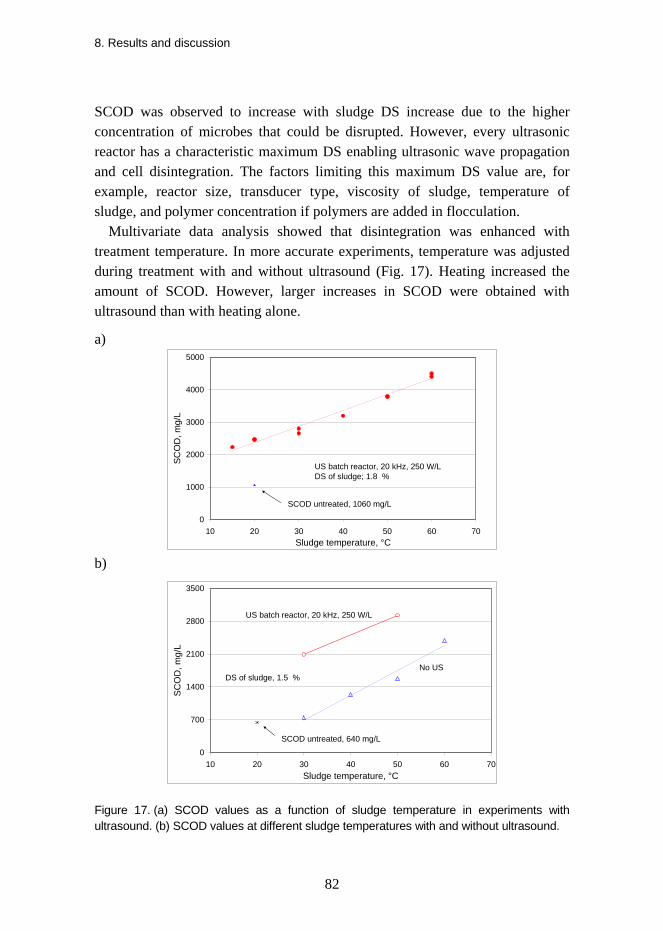
8. Results and discussion
82
SCOD was observed to increase with sludge DS increase due to the higher concentration of microbes that could be disrupted. However, every ultrasonic reactor has a characteristic maximum DS enabling ultrasonic wave propagation and cell disintegration. The factors limiting this maximum DS value are, for example, reactor size, transducer type, viscosity of sludge, temperature of sludge, and polymer concentration if polymers are added in flocculation.
Multivariate data analysis showed that disintegration was enhanced with treatment temperature. In more accurate experiments, temperature was adjusted during treatment with and without ultrasound (Fig. 17). Heating increased the amount of SCOD. However, larger increases in SCOD were obtained with ultrasound than with heating alone.
a)
0
1000
2000
3000
4000
5000
10 20 30 40 50 60 70Sludge temperature, °C
SCO
D, m
g/L
US batch reactor, 20 kHz, 250 W/L DS of sludge; 1.8 %
SCOD untreated, 1060 mg/L
b)
0
700
1400
2100
2800
3500
10 20 30 40 50 60 70Sludge temperature, °C
SCO
D, m
g/L
US batch reactor, 20 kHz, 250 W/L
No US
SCOD untreated, 640 mg/L
DS of sludge, 1.5 %
Figure 17. (a) SCOD values as a function of sludge temperature in experiments with ultrasound. (b) SCOD values at different sludge temperatures with and without ultrasound.
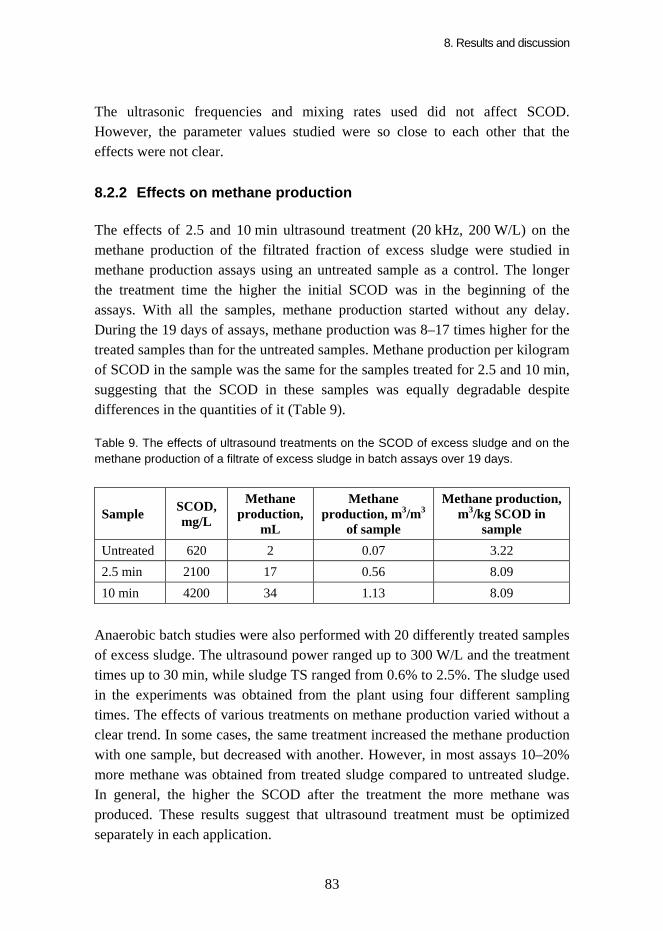
8. Results and discussion
83
The ultrasonic frequencies and mixing rates used did not affect SCOD. However, the parameter values studied were so close to each other that the effects were not clear.
8.2.2 Effects on methane production
The effects of 2.5 and 10 min ultrasound treatment (20 kHz, 200 W/L) on the methane production of the filtrated fraction of excess sludge were studied in methane production assays using an untreated sample as a control. The longer the treatment time the higher the initial SCOD was in the beginning of the assays. With all the samples, methane production started without any delay. During the 19 days of assays, methane production was 8–17 times higher for the treated samples than for the untreated samples. Methane production per kilogram of SCOD in the sample was the same for the samples treated for 2.5 and 10 min, suggesting that the SCOD in these samples was equally degradable despite differences in the quantities of it (Table 9).
Table 9. The effects of ultrasound treatments on the SCOD of excess sludge and on the methane production of a filtrate of excess sludge in batch assays over 19 days.
Sample SCOD, mg/L
Methane production,
mL
Methane production, m3/m3
of sample
Methane production, m3/kg SCOD in
sample Untreated 620 2 0.07 3.22 2.5 min 2100 17 0.56 8.09 10 min 4200 34 1.13 8.09
Anaerobic batch studies were also performed with 20 differently treated samples of excess sludge. The ultrasound power ranged up to 300 W/L and the treatment times up to 30 min, while sludge TS ranged from 0.6% to 2.5%. The sludge used in the experiments was obtained from the plant using four different sampling times. The effects of various treatments on methane production varied without a clear trend. In some cases, the same treatment increased the methane production with one sample, but decreased with another. However, in most assays 10–20% more methane was obtained from treated sludge compared to untreated sludge. In general, the higher the SCOD after the treatment the more methane was produced. These results suggest that ultrasound treatment must be optimized separately in each application.
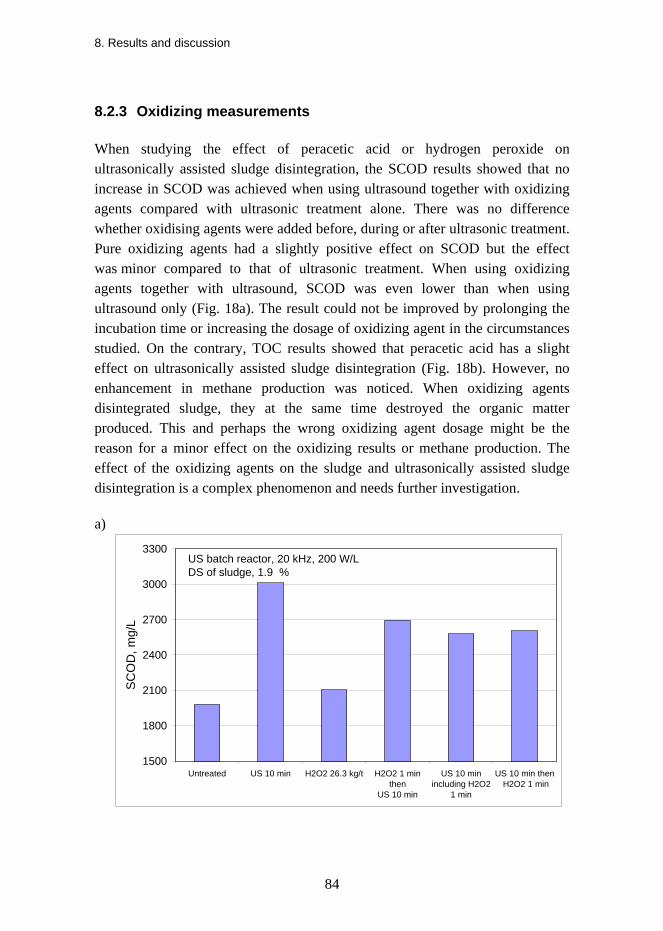
8. Results and discussion
84
8.2.3 Oxidizing measurements
When studying the effect of peracetic acid or hydrogen peroxide on ultrasonically assisted sludge disintegration, the SCOD results showed that no increase in SCOD was achieved when using ultrasound together with oxidizing agents compared with ultrasonic treatment alone. There was no difference whether oxidising agents were added before, during or after ultrasonic treatment. Pure oxidizing agents had a slightly positive effect on SCOD but the effect was minor compared to that of ultrasonic treatment. When using oxidizing agents together with ultrasound, SCOD was even lower than when using ultrasound only (Fig. 18a). The result could not be improved by prolonging the incubation time or increasing the dosage of oxidizing agent in the circumstances studied. On the contrary, TOC results showed that peracetic acid has a slight effect on ultrasonically assisted sludge disintegration (Fig. 18b). However, no enhancement in methane production was noticed. When oxidizing agents disintegrated sludge, they at the same time destroyed the organic matter produced. This and perhaps the wrong oxidizing agent dosage might be the reason for a minor effect on the oxidizing results or methane production. The effect of the oxidizing agents on the sludge and ultrasonically assisted sludge disintegration is a complex phenomenon and needs further investigation.
a)
1500
1800
2100
2400
2700
3000
3300
Untreated US 10 min H2O2 26.3 kg/t H2O2 1 minthen
US 10 min
US 10 minincluding H2O2
1 min
US 10 min then H2O2 1 min
SC
OD
, mg/
L
US batch reactor, 20 kHz, 200 W/L DS of sludge, 1.9 %
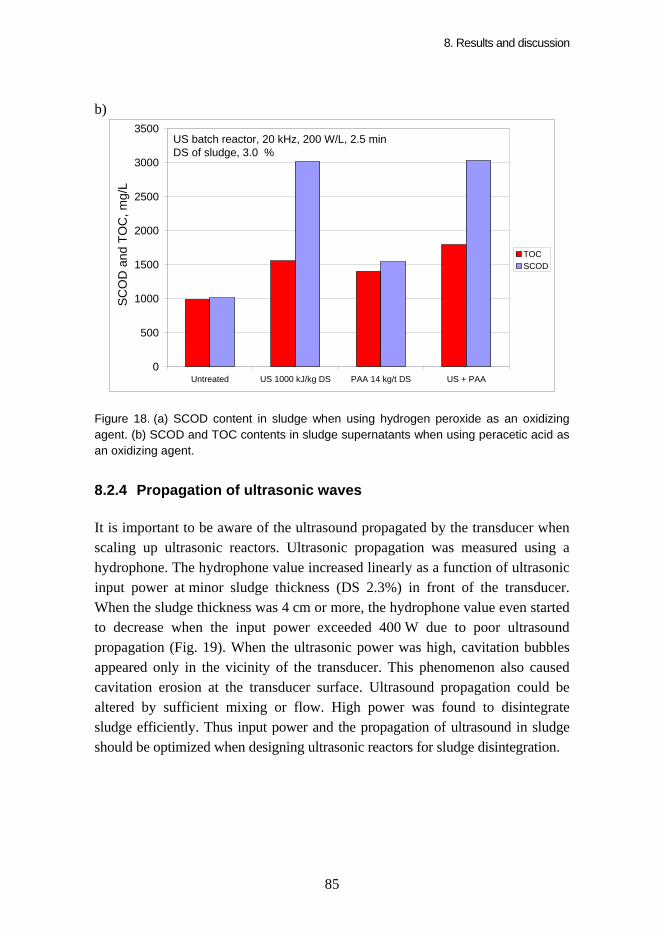
8. Results and discussion
85
b)
0
500
1000
1500
2000
2500
3000
3500
Untreated US 1000 kJ/kg DS PAA 14 kg/t DS US + PAA
SCO
D a
nd T
OC
, mg/
L
TOCSCOD
US batch reactor, 20 kHz, 200 W/L, 2.5 min DS of sludge, 3.0 %
Figure 18. (a) SCOD content in sludge when using hydrogen peroxide as an oxidizing agent. (b) SCOD and TOC contents in sludge supernatants when using peracetic acid as an oxidizing agent.
8.2.4 Propagation of ultrasonic waves
It is important to be aware of the ultrasound propagated by the transducer when scaling up ultrasonic reactors. Ultrasonic propagation was measured using a hydrophone. The hydrophone value increased linearly as a function of ultrasonic input power at minor sludge thickness (DS 2.3%) in front of the transducer. When the sludge thickness was 4 cm or more, the hydrophone value even started to decrease when the input power exceeded 400 W due to poor ultrasound propagation (Fig. 19). When the ultrasonic power was high, cavitation bubbles appeared only in the vicinity of the transducer. This phenomenon also caused cavitation erosion at the transducer surface. Ultrasound propagation could be altered by sufficient mixing or flow. High power was found to disintegrate sludge efficiently. Thus input power and the propagation of ultrasound in sludge should be optimized when designing ultrasonic reactors for sludge disintegration.
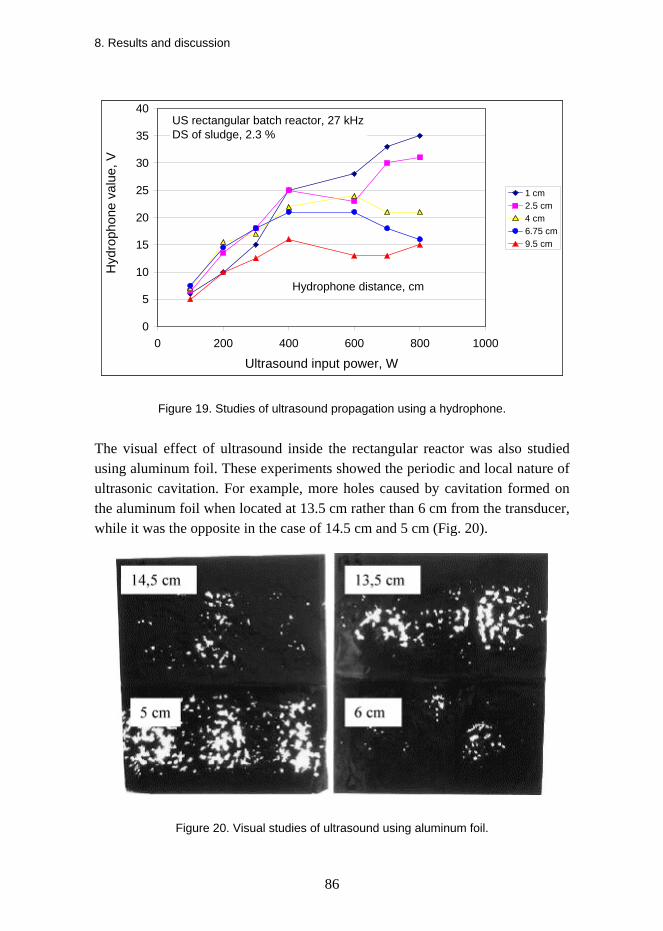
8. Results and discussion
86
0
5
10
15
20
25
30
35
40
0 200 400 600 800 1000
Ultrasound input power, W
Hyd
roph
one
valu
e, V
1 cm2.5 cm4 cm6.75 cm9.5 cm
US rectangular batch reactor, 27 kHzDS of sludge, 2.3 %
Hydrophone distance, cm
Figure 19. Studies of ultrasound propagation using a hydrophone.
The visual effect of ultrasound inside the rectangular reactor was also studied using aluminum foil. These experiments showed the periodic and local nature of ultrasonic cavitation. For example, more holes caused by cavitation formed on the aluminum foil when located at 13.5 cm rather than 6 cm from the transducer, while it was the opposite in the case of 14.5 cm and 5 cm (Fig. 20).
Figure 20. Visual studies of ultrasound using aluminum foil.
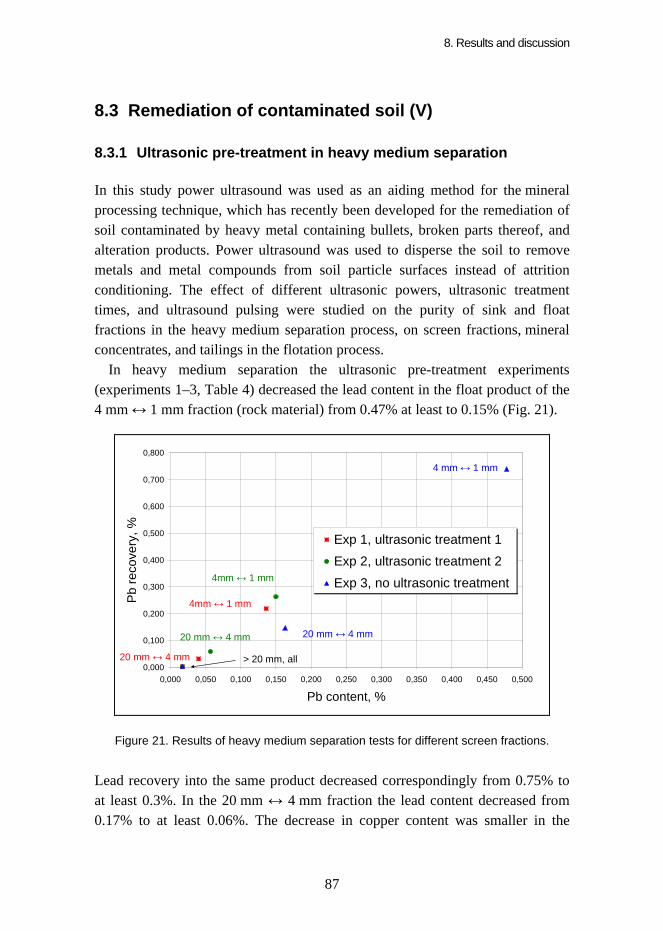
8. Results and discussion
87
8.3 Remediation of contaminated soil (V)
8.3.1 Ultrasonic pre-treatment in heavy medium separation
In this study power ultrasound was used as an aiding method for the mineral processing technique, which has recently been developed for the remediation of soil contaminated by heavy metal containing bullets, broken parts thereof, and alteration products. Power ultrasound was used to disperse the soil to remove metals and metal compounds from soil particle surfaces instead of attrition conditioning. The effect of different ultrasonic powers, ultrasonic treatment times, and ultrasound pulsing were studied on the purity of sink and float fractions in the heavy medium separation process, on screen fractions, mineral concentrates, and tailings in the flotation process.
In heavy medium separation the ultrasonic pre-treatment experiments (experiments 1–3, Table 4) decreased the lead content in the float product of the 4 mm ↔ 1 mm fraction (rock material) from 0.47% at least to 0.15% (Fig. 21).
0,000
0,100
0,200
0,300
0,400
0,500
0,600
0,700
0,800
0,000 0,050 0,100 0,150 0,200 0,250 0,300 0,350 0,400 0,450 0,500
Pb content, %
Pb
reco
very
, % Exp 1, ultrasonic treatment 1Exp 2, ultrasonic treatment 2Exp 3, no ultrasonic treatment
> 20 mm, all
20 mm ↔ 4 mm
4 mm ↔ 1 mm
4mm ↔ 1 mm
20 mm ↔ 4 mm
4mm ↔ 1 mm
20 mm ↔ 4 mm
Figure 21. Results of heavy medium separation tests for different screen fractions.
Lead recovery into the same product decreased correspondingly from 0.75% to at least 0.3%. In the 20 mm ↔ 4 mm fraction the lead content decreased from 0.17% to at least 0.06%. The decrease in copper content was smaller in the
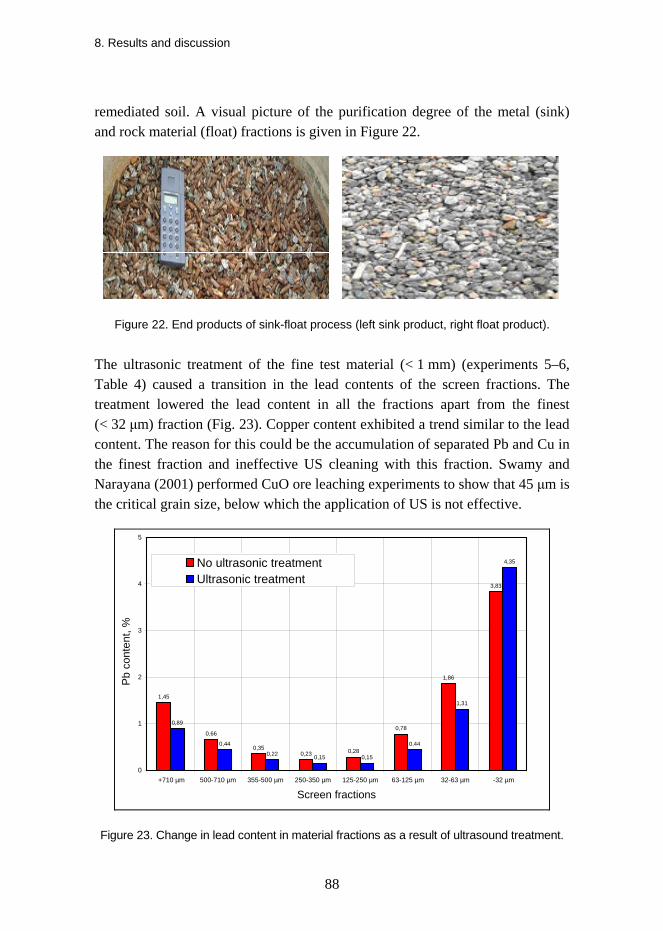
8. Results and discussion
88
remediated soil. A visual picture of the purification degree of the metal (sink) and rock material (float) fractions is given in Figure 22.
Figure 22. End products of sink-float process (left sink product, right float product).
The ultrasonic treatment of the fine test material (< 1 mm) (experiments 5–6, Table 4) caused a transition in the lead contents of the screen fractions. The treatment lowered the lead content in all the fractions apart from the finest (< 32 μm) fraction (Fig. 23). Copper content exhibited a trend similar to the lead content. The reason for this could be the accumulation of separated Pb and Cu in the finest fraction and ineffective US cleaning with this fraction. Swamy and Narayana (2001) performed CuO ore leaching experiments to show that 45 μm is the critical grain size, below which the application of US is not effective.
1,45
0,66
0,350,23 0,28
0,78
1,86
3,83
0,89
0,44
0,22 0,15 0,15
0,44
1,31
4,35
0
1
2
3
4
5
+710 µm 500-710 µm 355-500 µm 250-350 µm 125-250 µm 63-125 µm 32-63 µm -32 µm
Screen fractions
Pb c
onte
nt, %
No ultrasonic treatmentUltrasonic treatment
Figure 23. Change in lead content in material fractions as a result of ultrasound treatment.
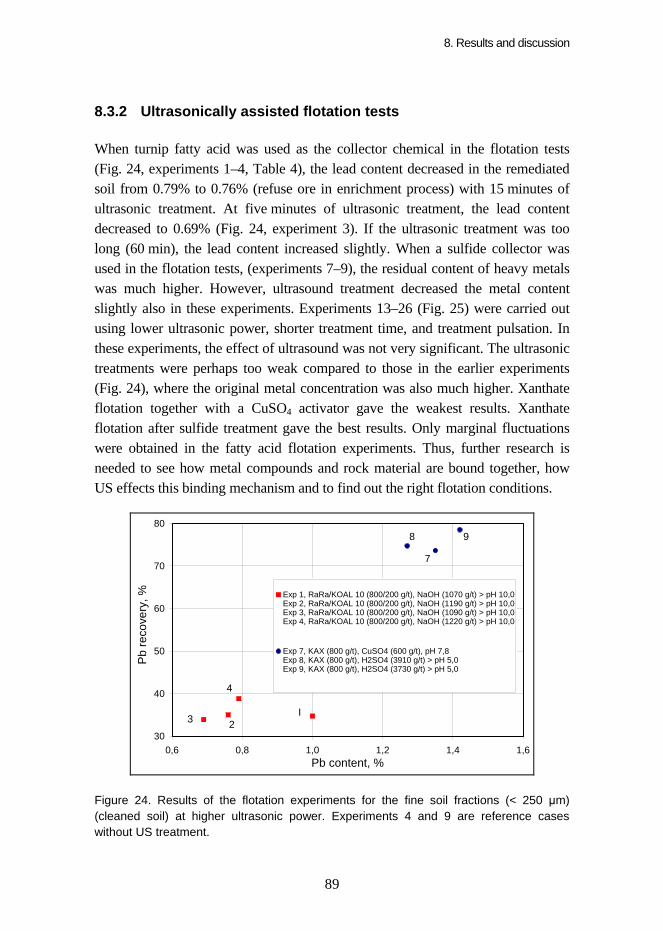
8. Results and discussion
89
8.3.2 Ultrasonically assisted flotation tests
When turnip fatty acid was used as the collector chemical in the flotation tests (Fig. 24, experiments 1–4, Table 4), the lead content decreased in the remediated soil from 0.79% to 0.76% (refuse ore in enrichment process) with 15 minutes of ultrasonic treatment. At five minutes of ultrasonic treatment, the lead content decreased to 0.69% (Fig. 24, experiment 3). If the ultrasonic treatment was too long (60 min), the lead content increased slightly. When a sulfide collector was used in the flotation tests, (experiments 7–9), the residual content of heavy metals was much higher. However, ultrasound treatment decreased the metal content slightly also in these experiments. Experiments 13–26 (Fig. 25) were carried out using lower ultrasonic power, shorter treatment time, and treatment pulsation. In these experiments, the effect of ultrasound was not very significant. The ultrasonic treatments were perhaps too weak compared to those in the earlier experiments (Fig. 24), where the original metal concentration was also much higher. Xanthate flotation together with a CuSO4 activator gave the weakest results. Xanthate flotation after sulfide treatment gave the best results. Only marginal fluctuations were obtained in the fatty acid flotation experiments. Thus, further research is needed to see how metal compounds and rock material are bound together, how US effects this binding mechanism and to find out the right flotation conditions.
30
40
50
60
70
80
0,6 0,8 1,0 1,2 1,4 1,6Pb content, %
Pb re
cove
ry, %
Exp 1, RaRa/KOAL 10 (800/200 g/t), NaOH (1070 g/t) > pH 10,0Exp 2, RaRa/KOAL 10 (800/200 g/t), NaOH (1190 g/t) > pH 10,0Exp 3, RaRa/KOAL 10 (800/200 g/t), NaOH (1090 g/t) > pH 10,0Exp 4, RaRa/KOAL 10 (800/200 g/t), NaOH (1220 g/t) > pH 10,0
Exp 7, KAX (800 g/t), CuSO4 (600 g/t), pH 7,8 Exp 8, KAX (800 g/t), H2SO4 (3910 g/t) > pH 5,0 Exp 9, KAX (800 g/t), H2SO4 (3730 g/t) > pH 5,0
I23
4
7
8 9
Figure 24. Results of the flotation experiments for the fine soil fractions (< 250 μm) (cleaned soil) at higher ultrasonic power. Experiments 4 and 9 are reference cases without US treatment.

8.
90
40,0
50,0
60,0
70,0
80,0
90,0
100,0
0,20 0,25 0,30 0,35 0,40 0,45 0,50
Pb content, %
Pb re
cove
ry, %
Exp 13, RaRa/KOAL 10 (800/200 g/t), NaOH (1050 g/t) > pH 10,0Exp 14, RaRa/KOAL 10 (800/200 g/t), NaOH (1050 g/t) > pH 10,0Exp 15, RaRa/KOAL 10 (800/200 g/t), NaOH (1050 g/t) > pH 10,0Exp 16, RaRa/KOAL 10 (800/200 g/t), NaOH (1050 g/t) > pH 10,0Exp 17, RaRa/KOAL 10 (800/200 g/t), NaOH (1050 g/t) > pH 10,0Exp 18, RaRa/KOAL 10 (800/200 g/t), NaOH (1050 g/t) > pH 10,0Exp 19, RaRa/KOAL 10 (800/200 g/t), NaOH (1050 g/t) > pH 10,0
Exp 20, RaRa/KOAL 10 (800/200 g/t), NaOH (1050 g/t) > pH 10,0Exp 21, RaRa/KOAL 10 (800/200 g/t), NaOH (1050 g/t) > pH 10,0Exp 25, RaRa/KOAL 10 (800/200 g/t), NaOH (1050 g/t) > pH 10,0
Exp 22, KAX (800 g/t), CuSO4 (600 g/t), pH 7,4 Exp 24, KAX (800 g/t), CuSO4 (600 g/t), pH 7,4
Exp 23, NaIPX (460 g/t), NaHS (115 g/t) Exp 26, NaIPX (460 g/t), NaHS (95 g/t)
I413 16
1526
23
2422
20
21
25 17
18 and 19
Figure 25. Results of the flotation experiments for the fine soil fractions (< 250 μm) (cleaned soil) at lower ultrasonic power. Experiments 21, 24, and 26 are reference cases without US treatment.
8. Results and discussion
9. Conclusions
91
9. Conclusions In this thesis it was shown that it is possible to use ultrasound on a semi-pilot scale to enhance the disintegration of three quite different samples: polymers, sludge, and contaminated soil.
The results show that PVA degradation occurs when the cavitation threshold is exceeded. When using an ultrasonic input power above the cavitation threshold, the highest intensity value at 20 kHz, according to hydrophone measurements, was 9.5 W/cm2 and at 40 kHz, 11.4 W/cm2. Nevertheless, the most extensive degradation of PVA took place at an ultrasonic frequency of 20 kHz. Certainly the higher the applied frequency the shorter the period for cavitation bubbles to grow and collapse, and the smaller the amount of time available to produce cavitation. For this reason, one possible explanation for the degradation was the shear forces created by ultrasonic waves. As the frequency, and hence attenuation, of the wave decreased, the shear forces were complemented by the increased cavitational effects.
Several authors have investigated the effect of solute concentration on degradation. In each case, the extent of degradation has been found to decrease with an increase in solute concentration. Such observations have been interpreted in terms of the increase in viscosity of the solution, i.e. the higher the viscosity, the more difficult it becomes to cavitate the solution at a given intensity and the smaller the degradation effect is. In this thesis, the biggest change in RMM was also observed when the concentration of PVA was the lowest, i.e. 1% (w/w). But in the case of CMC it was observed that, when viscosity was not adjusted, CMC has an optimal polymer concentration where degradation is the most efficient. The thesis showed that the extent of ultrasonic depolymerization decreases with decreasing molecular mass of the CMC polymer. The study also showed that ultrasonic irradiation causes a narrowing of the molecular mass distribution. The degradation of CMC polymer proceeded
9. Conclusions
92
linearly and the rate of ultrasonic depolymerization decreased with decreasing molecular mass.
In cases where the initial dynamic viscosities of the polymer solutions were not at the same level, the sonolytic degradation of CMC polymer mainly depended on the initial dynamic viscosity. The higher the initial dynamic viscosity, the faster degradation took place. This was in agreement with ultrasound theory, because the effects resulting from cavitation collapse in viscous liquids were found to be stronger than those caused by collapse in less viscous liquid. The study also showed that when PEG is used to adjust the initial dynamic viscosities, the higher the molecular mass of CMC polymer the faster degradation took place. This was also in agreement with earlier studies, where it has been found that the larger the molecule the faster the degradation. The CMC concentration studies indicated that the higher the polymer concentration the higher the degradation when the initial dynamic viscosity was adjusted using PEG. This was in disagreement with earlier studies where degradation decreased with an increase in solution concentration. However, in those earlier studies the viscosity was not adjusted, which according to this study is one of the main parameters in polymer degradation.
This thesis confirmed the general assumption that the shear forces generated by the rapid motion of the solvent following cavitational collapse are responsible for the breakage of the chemical bonds within the polymer. The effect of polymer concentration could be interpreted in terms of the increase in viscosity with concentration, causing the molecules to become less mobile in solution and the velocity gradients around therefore the collapsing bubbles to become smaller.
This thesis also suggested that ultrasonic disintegration of sludge increases the amount of SCOD and methane production. The multivariate data analysis showed that ultrasonic power, sludge DS, sludge temperature, and ultrasonic treatment time significantly affect sludge disintegration. It was also observed that high ultrasound power together with a short treatment time is more efficient than low ultrasound power with a long treatment time. The effects of ultrasound treatment (20 kHz, 200 W/L) on the methane production of the filtrated fraction of excess sludge were studied in methane production assays using an untreated sample as a control. The longer the treatment time the higher the initial SCOD was in the beginning of the assays. With all the samples, methane production started without any delay. During the 19 days of assays, methane production was 8–17 times higher for the treated samples than for the untreated samples. Methane production per kilogram of SCOD in the sample was the same for
9. Conclusions
93
samples treated for 2.5 and 10 min, suggesting that the SCOD in these samples was equally degradable despite differences in the quantities of it. Anaerobic batch studies were also performed with 20 differently treated samples of excess sludge. The ultrasound powers ranged up to 300 W/L and the treatment times up to 30 min, while sludge TS ranged from 0.6% to 2.5%. The sludge used in the experiments was obtained from the plant using four different sampling times. In most assays 10–20% more methane was obtained from treated sludge compared to untreated sludge. In general, the higher the SCOD after the treatment the more methane was produced. These results suggest that ultrasound treatment must be optimized separately in each application. When using oxidising agents together with ultrasonic disintegration there was no increase in SCOD and only a slight increase in TOC compared to ultrasonic treatment alone. However, when using oxidizing agents together with ultrasound, no enhancement in methane production was observed. Ultrasound propagation is an important factor in ultrasonic reactor scale-up. Ultrasound efficiency in sludge rose linearly when the input power was close to the transducer. By contrast, ultrasound efficiency even started to decrease when the input power was further away from the transducer.
In this thesis power ultrasound was used as an aiding method for the mineral processing technique, which has recently been developed for the remediation of soil contaminated by heavy metal containing bullets, broken parts thereof, and alteration products. Power ultrasound was used to disperse the soil to remove metals and metal compounds from the soil particle surfaces instead of attrition conditioning. The soil examined came from a former military shooting range. The coarsest material (> 20 mm), which did not contain bullets or parts thereof, was screened out before the ultrasonic treatment experiments. The other screen fractions – 20 mm ↔ 4 mm, 4 mm ↔ 1 mm, < 1 mm, and < 250 μm containing heavy metals – were treated separately in a remediation process, now using ultrasound treatment before separation.
In heavy medium separation, ultrasonic pre-treatment decreased the lead content of the float product of the 4 mm ↔ 1 mm fraction (rock material) from 0.47% to at least 0.15%. Lead recovery from the same product decreased correspondingly from 0.75% to at least 0.3%. In the 20 mm ↔ 4 mm fraction the lead content decreased from 0.17% to at least 0.06%. The decrease in copper content was smaller in the remediated soil. The ultrasonic treatment of the fine test material (< 1 mm) caused a transition in the lead content of the screen fractions. Treatment lowered the lead content in all the fractions except the finest (< 32 μm) fraction. Copper content exhibited a trend similar to the lead content.
9. Conclusions
94
The reason for this could be the accumulation of separated Pb and Cu in the finest fraction and ineffective US cleaning with this fraction.
In heavy medium separation, ultrasound improved the remediation results of both products (sink and float products). This was due to the fact that the amount of ultrafine metal fraction was diminished when attrition conditioning was replaced by ultrasound. The remediation process produced float product (cleaned soil) that could be left to its original place. This would reduce process costs and avoid the need to transport large amounts of soil material.
When fatty acid was used as the collector chemical in the flotation tests, the lead content decreased in the remediated soil from 0.79% to 0.76% (refuse ore in enrichment process) with fifteen minutes of ultrasonic treatment. With five minutes of ultrasonic treatment, the lead content decreased to 0.69%. If the ultrasonic treatment was too long (60 min), the lead content increased slightly. When sulfide collector was used in the flotation tests, the residual heavy metal content was much higher. However, ultrasound treatment decreased the metal content slightly also in these experiments. Xanthate flotation together with a CuSO4 activator gave the weakest results. Xanthate flotation after sulfide treatment gave the best results. Only marginal fluctuations were obtained in the fatty acid flotation experiments. Thu, further research is needed to see how metal compounds and rock material are bound together, how US effects this binding mechanism and to determine the right flotation conditions.
96
Ebringerová, A., Hromádková, Z., Hríbalová, V., and Mason, T. J., Ultrason. Sonochem., 1997, 4, 311.
Eder, B. and Günthert, F. W., Ultrasound in Environmental Engineering II, 2002, 35, 173.
Elik, A., Talanta, 2007, 71, 790.
Ensminger, D., Ultrasonics, Fundamentals, Technology, Applications, 2nd edition, Marcel Dekker, New York, USA, 1988.
Farmer, A. D., Collings, A. F., and Jameson, G. J., Int. J. miner. Process., 2000, 60, 101.
Feng, X., Lei, H., Deng, J., Yu, Q., and Li, H., Chem. Eng. Process., 2009, 48, 187.
Feng, D., Lorenzen, L., Aldrich, C., and Maré, P. W., miner. Eng., 2001, 14, 1093.
Forster, C. F. and Lafitte-Trouqué, S., Bioresour. Technol., 2002, 84, 113.
Gogate, P. R. and Kabadi, A. M., Biochem. Eng. J., 2009, 44, 60.
Gonze, E., Pillot, S., Valette, E., Gonthier, Y., and Bernis, A., Chem. Eng. Process., 2003, 42, 965.
Harkal, U. D., Gogate, P. R., Pandit, A. B., and Shenoy, M. A., Ultrason. Sonochem., 2006, 13, 423.
He, P.-J., Yu, G.-H., Shao, L.-M., and Zhu, Y.-S., Water Res., 2008, 42, 1925.
Hintikka, V., Parviainen, P., Sten, P., Laukkanen, J., Kalapudas, R., and Leppinen, J., Proc. of Recycling and Waste Treatment in mineral and Metal Processing, Luleå, Sweden, 2002, 295.
Hintikka, V., Parviainen, P., Sten, P., Laukkanen, J., and Leppinen, J., Geol. Surv. Finland, Spec. Paper, 2001, 32, 151.
Hintikka, V., Sten, P., Laukkanen, J., and Leppinen, J., Proc. of Symposium on Recycling, Waste Treatment and Clean Technology, San Sebastian, Spain, 1999, 3, 2519.
Kanwal, F., Liggat, J. J., and Pethrick, R. A., Polym. Degrad. Stab., 2000, 68, 445.
Kardos, N. and Luche, J.-L., Carbohydr. Res., 2001, 332, 115.
Keqiang, C., Ye, S., Huilin, L., and Xi, X., J. Macromol. Sci. Chem., 1985, A22, 455.
Keqiang, C., Ye, S., Huilin, L., and Xi, X., J. Macromol. Sci. Chem., 1986, A23, 1415.
97
Khanal, S. K., Grewell, D., Sung, S., and van Leeuwen, J. (Hans), Crit. Rev. Env. Sci. Technol., 2007, 37, 277.
Kim, Y. U. and Wang, M. C., Ultrasonics, 2003, 41, 539.
Kobayashi, D., Matsumoto, H., and Kuroda, C., Ultrason. Sonochem., 2008, 15, 251.
Kuijpers, M., Iedema, P., Kemmere, M., and Keurentjes, J., Polymer, 2004, 45, 6461.
van Leeuwen, J (Hans), Akin, B., Khanal, S. K., Sung, S., and Grewell, D., Water Sci. Technol. Water Supply, 2006, 6, 35.
Li, J., Guo, S., and Li, X., Polym. Degrad. Stab., 2005a, 89, 6.
Li, J., Liang, M., Guo, S., and Li, Y., Polym. Degrad. Stab., 2004, 86, 323.
Li, Y., Li, J., Guo, S., and Li, H., Ultrason. Sonochem., 2005, 12, 183.
Lorimer, J. P., Mason, T. J., Cuthbert, T. C., and Brookfield, E. A., Ultrason. Sonochem., 1995, 2, 55.
Lorimer, J. P., and Mason, T. J., Ultrason. Sonochem., 1995, 2, 79.
Madras, G. and Chattopadhyay, S., Polym. Degrad. Stab., 2001a, 71, 273.
Madras, G. and Chattopadhyay, S., Polym. Degrad. Stab., 2001b, 73, 33.
Madras, G., Kumar, S., and Chattopadhyay, S., Polym. Degrad. Stab., 2000, 69, 73.
Marín, A. López-Gonzálvez, A., and Barbas, C., Anal. Chim. Acta, 2001, 442, 305.
Mason, T. J., Practical Sonochemistry User’s Guide to Applications in Chemistry and Chemical Engineering, Ellis Horwood Limited, Chichester, Great Britain, 1991a.
Mason, T. J., Advances in Sonochemistry, A Research Annual, JAI Press Ltd., London, Great Britain, Vol 2, 1991b.
Mason, T. J., Ultrasound in Environmental Engineering (Eds. Tiehm, A. and Neis, U.), 1999, 25, 1.
Mason, T. J., Ultrason. Sonochem., 2000, 7, 145.
Mason, T. J., Ultrasound in Environmental Engineering II (Ed. Neis, U.), 2002, 35, 1.
Mason, T. J., Prog. Biophys. Mol. Biol., 2007a, 93, 166.
Mason, T. J., Ultrason. Sonochem., 2007b, 14, 476.
98
Mason, T. J., Collings, A., and Sumel, A., Ultrason. Sonochem., 2004, 11, 205.
Mason, T. J. and Lorimer, P. J., Sonochemistry: Theory, Applications and Use of Ultrasonic in Chemistry, Ellis Horwood Limited, Chichester, Great Britain, 1988.
Meegoda, J. N. and Perera, R., J. Hazard. Mater., 2001, 85, 73.
Narayana, K. L., Swamy, K. M., Sarveswara, R. K., and Murty, J. S., min. Proc. Ext. Met. Rev, 1997, 16, 239.
Neis, U., Nickel, K., and Tiehm, A., Advances in Sonochemistry, 6, Theme Issue – Ultrasound in Environmental Protection, (Eds. Mason, T. and Tiehm, A.), Elsevier, 2001.
Newman, A. P., Lorimer, J. P., Mason, T. J., and Hutt, K. R., Ultrason. Sonochem., 1997, 4, 153.
Nickel, K., Ultrasound in Environmental Engineering II (Ed. Neis, U.), 2002, 35, 189.
Nickel, K. and Neis, U., Ultrason. Sonochem., 2007, 14, 450.
Onyeche, T. I., Schläfer, O., Bormann, H., Schroder, C., and Sievers, M., Ultrasonics, 2002, 40, 31.
Petit, A.-C., Noiret, N., Guezennec, J., Gondrexon, N., and Colliec-Jouault, S., Ultrason. Sonochem., 2007, 14, 107.
Price, G. J., Ultrason. Sonochem., 1996, 3, 229.
Price, G. J., Duck, F. A., Digby, M., Holland, W., and Berryman, T., Ultrason. Sonochem., 1997, 4, 165.
Price, G. J., West, P. J., and Smith, P. F., Ultrason. Sonochem., 1994, 1, 51.
Priego-López, E. and and Luque de Castro, M. D., J. Chromatogr. A, 2003, 1018, 1.
Portenlänger, G. and Heusinger, H., Ultrason. Sonochem., 1997, 4, 127.
Quarmby, J., Scott, J. R., Mason, A. K., Davies, G., and Parsons, S. A., Environ. Technol., 1999, 20, 1155.
Ramsden, D. K. and McKay, K., Polym. Deg. Stab., 1986, 15, 15.
Richter, P., Jiménez, M., Salazar, R., and Maricán, A., J. Chromatogr. A, 2006, 1132, 15.
Sanz, E., Muñoz-Olivas, R., and Cámara, C., J. Chromatogr. A, 2005, 1097, 1.
99
Schläfer, O., Onyeche, T., Bormann, H., Schröder, C., and Sievers, M., Ultrasonics, 2002, 40, 25.
Schläfer, O., Sievers, M., Klotzbücher, H., and Onyeche, T. I., Ultrasonics, 2000, 38, 711.
Shen, J., Yin, X., Gu, H., and Lü, X., Front. Chem. Eng. Chin., 2007, 1, 395.
Show, K.-Y., Mao, T., and Lee, D.-J., Water Res., 2007, 41, 4741.
Singh, B. P. and Singh R., Sep. Sci. Technol., 1997, 32, 993.
Song, G., Lu, C., and Lin, J.-M., Anal. Chim. Acta, 2007, 596, 312.
Suslick, K. S., Ultrasound, its Chemical, Physical, and Biological Effects, VCH Publishers Inc., New York, USA, 1988.
Swamy, K. and Narayana, K., Advances in Sonochemistry, 6, Theme Issue – Ultrasound in Environmental Protection, (Eds. Mason, T. J. and Tiehm A.), Elsevier, 2001.
Tabata, M. and Sohma, J., Chem. Phys. Lett., 1980a, 73, 178.
Tabata, M. and Sohma, J., Eur. Polym. J., 1980b, 16, 589.
Taghizadeh, M. T. and Mehrdad, A., Ultrason. Sonochem., 2003, 10, 309.
Tiehm, A., Nickel, K., and Neis, U., Water Sci. Technol., 1997, 36, 121.
Tiehm, A., Nickel, K., Zellhorn, M., and Neis, U., Water Res., 2001, 35, 2003.
Trciński, S. and Staszewska, D., Carbohydr. Polym., 2004, 56, 489.
Ueno, S.-I., Fujita, T., Kuchar, D., Kubota, M., and Matsuda, H., Ultrason. Sonochem., 2009, 16, 169.
Vijayalakshmi, S. P. and Madras, G., Polym. Degrad. Stab., 2004, 84, 341.
Vijayalakshmi, S. P. and Madras, G., Polym. Degrad. Stab., 2005, 90, 116.
Vodeničarová, M., Dřímalová, G., Hromádková, Z., Malovíková, A., and Ebringerová, A., Ultrason. Sonochem., 2006, 13, 157.
Väisänen, A. and Iljander, A., Anal. Chim. Acta, 2006, 570, 93.
Wang, Q., Kuniobu, M., Kakimoto, K., I.-Ogawa, H., and Kato, Y., Bioresour. Technol., 1999, 68, 309.
Wang, F., Wang, Y., and Ji, M., J. Hazard. Mater., 2005, 123, 145.
100
Wang, S., Wu, X., Wang, Y., Li, Q., and Tao, M., Ultrason. Sonochem., 2008, 15, 933.
Waskiewicz, J., Yoshii, F., Nagasawa, N., Wach, R., and Mitomo, H., Radiat. Phys. Chem., 2005, 73, 287.
Xie, B., Liu, H., and Yan, Y., J. Environ. Manage., 2009, 90, 260.
Xie, R., Xing, Y., Ghani, Y. A., Ooi, K.-E., and Ng, S.-W., J. Environ. Eng. Sci., 2007, 6, 533.
Xiuyuan, N., Yuefang, H., Bailin, L., and Xi, X., Eur. Polym. J., 2001, 37, 201.
Yin, X., Lu, X., Han, P., and Wang, Y., Ultrasonics, 2006, 44, e397.
Yuntao, L., Jiang, L., Shaoyun, G., and Huilin, L., Ultrason. Sonochem., 2005, 12, 183.
Zhang, G., Yang, J., Liu, H., and Zhang, J., Bioresour. Technol., 2009, 100, 1505.
Zhang, P., Zhang, G., and Wang, W., Bioresour. Technol., 2007, 98, 207.

Article I
Ultrasonic depolymerization of aqueous polyvinyl alcohol
In: Ultrasonics Sonochemistry. Vol. 8 (3), 2001, pp. 259–264.
Reprinted with permission from the publisher.

�������� �� ����������� �� ������� ������� ������
�� ��������� �� �� �������� �� �������� �� ��������� �� �������� �� !���
��� ������ ��� �� ���� ��������� ����������� ������
��������
������������ ��� ����� �� "� � �#��� �������#���� ������ ��� �� ��������# ������������ "����� � ������ ����
�������� $�#�� �� �� "� � ����# ��� ���� ���� �"�� ����� "��� $����� ����# ��� ���#�� � ��� ����� ������ �� ���
������� ��� �� ��� �%��� ������� � ��������# �������� $�#�� �� "� ����"���� �� ��� ���#� ����� #������� ��� ���� $����
#�������� ������ ���� ��# ������� "�""���� �� #������� ��� ��� ������ ��#������� ����� �� "���� �� ��"�� �� ��������
� � �������� �� "� �"�� �� � ��� ��� ������� ������� $�� ���� �� � ������� ������� ����� ���� ����"����� &��
���������� ��� ����'���� �� ��� � �� ���� �������� �$��� ��� �������� ���������� ��� �������� ���� �����# ��
��� ������� �� ��� ����� ��� ������� ��������� $����� $��� � �� ����������� ��� � $�� ���"�� �� ��#���� ������� �������
������ (�)�* ������ $�� ����������� &�� ���� �+������ ��#������� ���� ��� �� ��� ��$��� �������� ���� � ��� ������ ��� ,-
���� $��� ��� � �� �$�� $�� �"��� ��� ������� ��������� ��� �� ��� ��$��� ���� ���������� �� �)�� ��� ./ ($0$*� &��� ���
����� ��'��� ��� #������ ����� ��� ���� ��� ����� ����� #�������� "� ��� �� � ����� �� ��� ������� �����$�# ���������
���� �� ��� ��� ���"�� ��� ��� "�����#� �� ��� ����� "���� $��� ��� ������� &�� �%�� �� ������ ���������� �� "�
���� ����� � ����� �� ��� ������ � ������ $�� ����������� ����# ��� �������� �� "���� ���� ��"�� � ������� ��� ���
������ #������� ������ ��� ���� ��# "�""��� �� ��������� "���� �������� � ,11. 2������ !��� 3�)� ��� �#��� ���������
!��"�� �# ��$�� ���������� �������4 5� �����������4 �)�
� ���� ������
��� ������ ��#��� ����������� �� � �����������$ "���� �� �������� ��$����� � ������ �� �$�� ���������� � ������ ���� ���� "�� �� ���.6-1� $��� ������� �� ���� ������� ������� $���������� �� ����� ������ 7.8� !���� ��� 9�����'��� �"������ ��� �������� ������� � ��� �������� � ������ ������� ��� ����"���� � �� ��� "�����#��� ������� "���� � ��� ������ ���� &��� ���� ��������� ��� ���� �� ����������� ���� ���$�� ��� ��� : �� �� ������ $��� ��� ����� �������� ���� $��� ������� &�� �+����� �� ��� ����# ��#��� �� ����������� ��������� ��� "��� �� ���� ��#��������������� 7,8������������� ��� ��"��������� ����� �� "� �
�#��� �������#���� ������ ��� �� ��������# ��:���������� "����� � ������ ���� �������� $�#���� �� "� � ����# ��� ���� ���� �"�� ����� "���$����� ����# ��� ���#�� � ��� ����� ������ ��
��� ������� �� � ��$ $��� ����"����� ���� �����#���+ ����� �� �������� �� ������������ �� �#�:����#��������� $���� ������ � �������� ������� �������� 2��� $��� ��� �������� ������� ��� ��:����� ��� ���������� ���� ������ ������ ��$ ��� ����� $�� ���� �� ���:�������� �������� 7-8� ��� �%��� � ����������� ���� ���� ��������
;��� ���� ���������� �� ���� ��� �� ����� ��:������ ��� ���� � ��� ���������� �� �������� ����+�� ��#� �� ��� �%���� $������ ���� ������� ����� ���� �� ������� �� ������ �����#��� � ������������ ������ �� ��� ������ ������ ��� �� ��� �%���������� � ��������# �������� $�#�� �� "� ����":���� �� ��� ���#� ����� #������� ��� ���� $���� #��:������ ������ ���� ��# ������� "�""��� 7.8�2����� ������ ���� ���$� ���� ��� ��#������� �
����� "�
.� ��� ���������� ����� �� �������� ��� ��� ����$��� ����#� �������� �� "�""�� � �����4
,� ��� ����� �������� �� ��� ������� �� ��� ������# "�":"���4
-� ��� �������� ������� ��� ������� ������� $������ "�""��� ���������� 7,8�
��������� !���������� < (,11.* ,=6>,?@
$$$�����������0�����0�������
�A����� ����# �������
��$��� � ����# �����#�������B����' (�� ���������*�
.-=1:@.CC01.0D : ��� ����� ������ � ,11. 2������ !��� 3�)� ��� �#��� ������������E !.-=1 :@.CC (1.*111<? :@
I/1
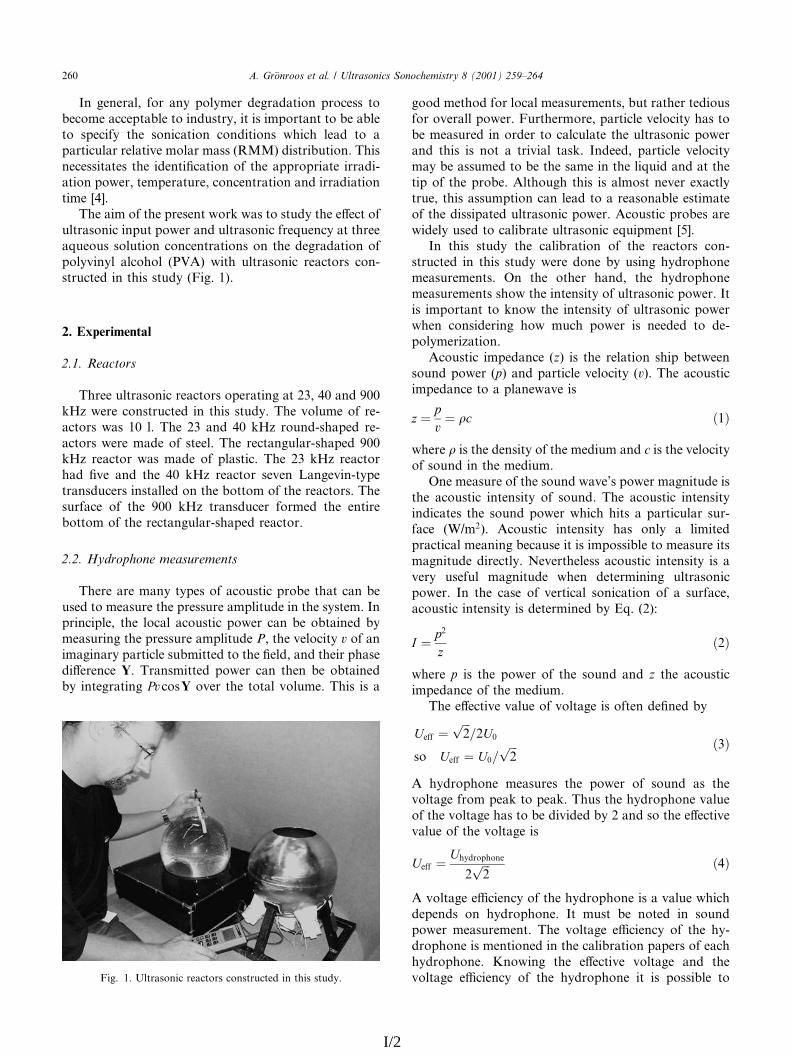
�� #������� ��� ��� ������ ��#������� ����� ��"���� �� ��"�� �� �������� � � � ������ �� "� �"���� � ��� ��� ������� ������� $�� ���� �� � ������� ������� ����� ���� (9 * ����"����� &������������ ��� ����'���� �� ��� � �� ���� ����:���� �$��� ��� �������� ���������� ��� ����������� 7@8�&�� �� �� ��� ������ $��� $�� �� ����� ��� �%�� ��
�������� � �� �$�� ��� �������� �������� �� ������������ ������� ����������� �� ��� ��#������� �� ������� ������ (�)�* $�� �������� ������� ��:������� � ��� ����� (F#� .*�
� ������������
%��� &��'(���
&���� �������� ������� � �����# �� ,-� @1 ��� 611��� $��� ��������� � ��� ������ &�� ������ �� ��:����� $�� .1 �� &�� ,- ��� @1 ��� �����:��� �� ��:����� $��� ���� �� ������ &�� �����#����:��� �� 611��� ������ $�� ���� �� ����� &�� ,- ��� ��������� '�� ��� ��� @1 ��� ������ ����� G��#���:�� ����������� �������� �� ��� "����� �� ��� �������� &�������� �� ��� 611 ��� ��������� ������ ��� �����"����� �� ��� �����#����:��� �� �������
%�%� )� ��*+��� $���,��$��(�
&���� ��� ���� �� �� �� ����� ��"� ���� �� "����� �� ������� ��� ������� �� ����� � ��� ������� �� �� ��� ��� ���� ����� �$�� �� "� �"����� "��������# ��� ������� �� ����� � ��� ������ � �� ����#���� ����� ��"����� �� ��� '���� ��� ���� �����%����� �� &��������� �$�� �� ���� "� �"�����"� ���#����# ����� ���� ��� ����� ������� &�� � �
#��� ������ ��� ���� ������������� "�� ������ ��������� ������� �$��� F����������� ����� ������ ��� ��"� �������� � ����� �� ������� ��� �������� �$����� ��� � ��� � ����� ����� ������� ����� ��������� "� ������� �� "� ��� ���� � ��� ���� ��� �� ���� �� ��� ��"�� ������#� ��� � ������ ����� �+��������� ��� ����� ��� �� ���� �� � �������"�� ��������� ��� ��� ���� �������� �$��� ����� ��"�� ���$���� ���� �� ��"���� �������� ��� ���� 7=8��� ��� ����� ��� ��"����� �� ��� ������� ��:
������� � ��� ����� $��� ���� "� ���# ����� ����������������� H� ��� ����� ����� ��� ����� ���������������� ���$ ��� ������� �� �������� �$��� ��� � ������ �� ���$ ��� ������� �� �������� �$��$��� �������# ��$ ��� �$�� � ������ �� ��: ����������������� � ����� (-* � ��� ������� �� "��$���
����� �$�� (** ��� ����� ������ (�*� &�� ������ ����� �� � ����$��� �
� � ��� �� �.�
$���� � � ��� ������ �� ��� ����� ��� ' � ��� �������� ����� � ��� ������H�� ������� �� ��� ����� $���I� �$�� ��#����� �
��� ����� ������� �� ������ &�� ����� ������������� ��� ����� �$�� $�� ��� � ������� ���:��� (;0�,*� ����� ������� ��� ���� � ����� ����� �����# "����� � � � ���"�� �� ������� ����#����� ������� J����������� ����� ������� � ����� ������ ��#����� $��� ��������# �������� �$��� �� ��� ��� �� ������ ������� �� � ������������ ������� � ��������� "� 2�� (,*E
� � �,
��,�
$���� * � ��� �$�� �� ��� ����� ��� - ��� ������ ����� �� ��� ������&�� �%���� ����� �� �����#� � ����� ��'��� "�
���� ����
,�
�,�1
�� ���� � �1����
,� �-�
� ����� ���� �������� ��� �$�� �� ����� �� ��������#� ���� ��� �� ���� &��� ��� ����� ���� ������� ��� �����#� ��� �� "� ����� "� , ��� �� ��� �%��������� �� ��� �����#� �
���� � ������ ����,
���
,� �@�
� �����#� �K��� �� ��� ����� ���� � � ����� $���� ���� �� ����� ����� �� ���� "� ����� � ����� �$�� ������������ &�� �����#� �K��� �� ��� ��:��� ���� � �������� � ��� ��"����� � ��� �� �������� ����� L��$�# ��� �%���� �����#� ��� ��������#� �K��� �� ��� ����� ���� � � ���"�� ��F#� .� �������� ������� ��������� � ��� ������
,?1 .� /������� �( ��� 0 1�(������'� 2���'+�$��(�� 3 4%���5 %678%��
I/2
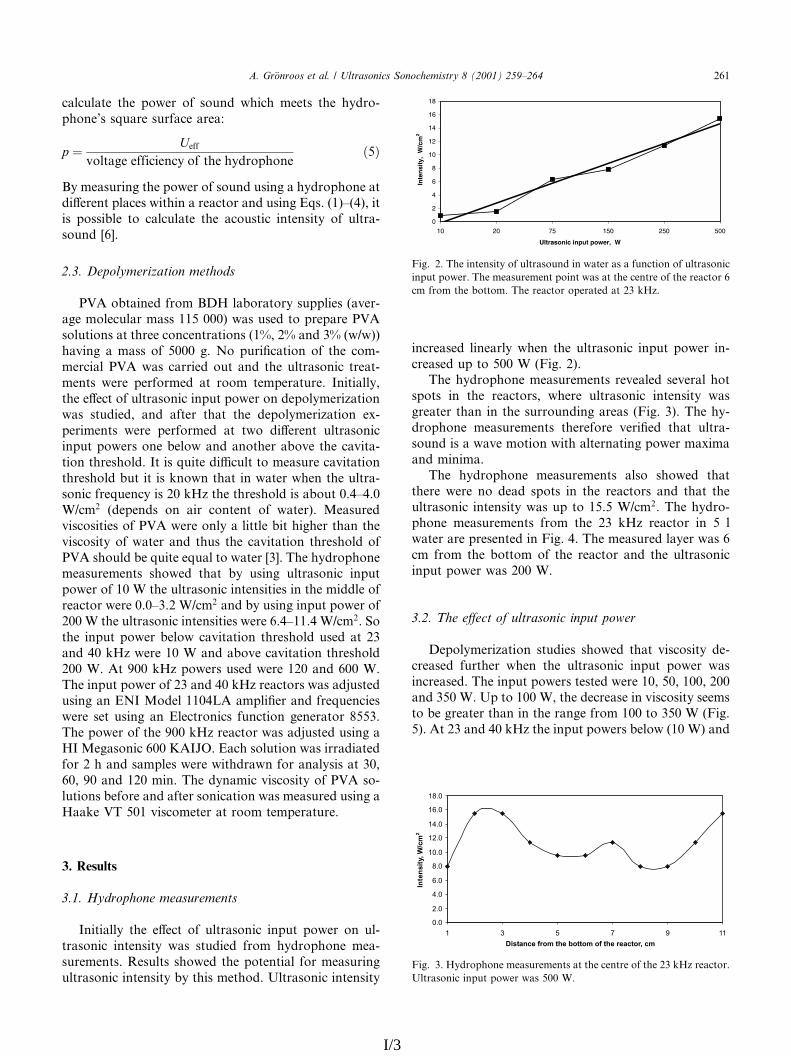
������� ��� �$�� �� ����� $�� ����� ��� �����: ����I� ������ ������ ����E
� � ���������#� ������ �� ��� ����� ����
�=�
3� �������# ��� �$�� �� ����� ���# � ����� ���� ���%����� ���� $��� � ������ ��� ���# 2��� (.*>(@*� �� ���"�� �� ������� ��� ����� ������� �� �����:����� 7?8�
%��� 9�*���$���-�(��� $�(+� �
�)� �"����� ���� 35� ��"������� �� ��� (����:�#� �������� ���� ..= 111* $�� ���� �� �� ��� �)��������� �� ����� ����������� (./� ,/ ��� -/ ($0$**����# � ���� �� =111 #� J� ��'���� �� ��� ��:����� �)� $�� ����� ��� ��� ��� �������� �����:����� $��� �������� �� ���� ��� �������� ����������� �%�� �� �������� � �� �$�� �� �� �����������$�� ������� ��� ����� ���� ��� �� ����������� �+: ������� $��� �������� �� �$� �%����� ��������� �� �$��� ��� "���$ ��� ������� �"��� ��� ����:��� ���������� �� � ���� �K��� �� ������� ���������������� "�� � � ���$� ���� � $���� $��� ��� �����:��� �������� � ,1 ��� ��� ��������� � �"��� 1�@>@�1;0�, (�� ���� �� �� ������ �� $����*� �������������� �� �)� $��� ���� � ����� "� �#��� ���� ��������� �� $���� ��� ���� ��� ������� ��������� ���)� ������ "� ���� ����� �� $���� 7-8� &�� ����� ���������������� ���$�� ���� "� ���# �������� � �� �$�� �� .1 ; ��� �������� �������� � ��� ����� �������� $��� 1�1>-�, ;0�, ��� "� ���# � �� �$�� ��,11 ; ��� �������� �������� $��� ?�@>..�@ ;0�,� !���� � �� �$�� "���$ ������� ��������� ���� �� ,-��� @1 ��� $��� .1 ; ��� �"��� ������� ���������,11 ;� �� 611 ��� �$��� ���� $��� .,1 ��� ?11 ;�&�� � �� �$�� �� ,- ��� @1 ��� ������� $�� ��M��������# �� 2J� ���� ..1@G� �� �'�� ��� ���������$��� ��� ���# �� 2������� ������ #�������� <==-�&�� �$�� �� ��� 611 ��� ������ $�� ��M����� ���# ��� �#���� ?11 L���H� 2�� ������� $�� ����������� , � ��� ��� ��� $��� $�����$� ��� ������� �� -1�?1� 61 ��� .,1 ��� &�� ����� ������ �� �)� ��:������ "����� ��� ����� ������� $�� �������� ���# ������ )& =1. �������� �� ���� ��� ��������
� �������
���� )� ��*+��� $���,��$��(�
������� ��� �%�� �� �������� � �� �$�� �� ��:������ ������� $�� ������ ���� ����� ���� ���:���������� 9������ ���$�� ��� ������� ��� �������#�������� ������� "� ��� ������� �������� �������
������� ������� $��� ��� �������� � �� �$�� �:������ � �� =11 ; (F#� ,*�&�� ����� ���� ������������ �������� ������� ���
� ��� � ��� �������� $���� �������� ������� $��#������ ���� � ��� ���������# ����� (F#� -*� &�� ��:��� ���� ������������ ��������� ���'�� ���� �����:����� � � $��� ����� $�� ���������# �$�� ��+����� �����&�� ����� ���� ������������ ���� ���$�� ����
����� $��� �� ���� � ��� � ��� ������� ��� ���� ����������� ������� $�� � �� .=�= ;0�,� &�� �����: ���� ������������ ���� ��� ,- ��� ������ � = �$���� ��� �������� � F#� @� &�� �������� ����� $�� ?� ���� ��� "����� �� ��� ������ ��� ��� ��������� �� �$�� $�� ,11 ;�
��%� �+� �:�'( �; ,�(������' ��*,( *�"��
5� ����������� ������ ���$�� ���� ������ ��:������ ������� $��� ��� �������� � �� �$�� $���������� &�� � �� �$��� ������ $��� .1� =1� .11� ,11��� -=1 ;� � �� .11 ;� ��� ������� � ������ ������� "� #������ ���� � ��� ���#� ���� .11 �� -=1 ; (F#�=*� �� ,- ��� @1 ��� ��� � �� �$��� "���$ (.1 ;* ���
F#� ,� &�� ������� �� ���������� � $���� �� � ������ �� ��������
� �� �$��� &�� ����������� ��� $�� �� ��� ����� �� ��� ������ ?
� ���� ��� "������ &�� ������ � ������ �� ,- ����
F#� -� ����� ���� ������������ �� ��� ����� �� ��� ,- ��� �������
�������� � �� �$�� $�� =11 ;�
.� /������� �( ��� 0 1�(������'� 2���'+�$��(�� 3 4%���5 %678%�� ,?.
I/3
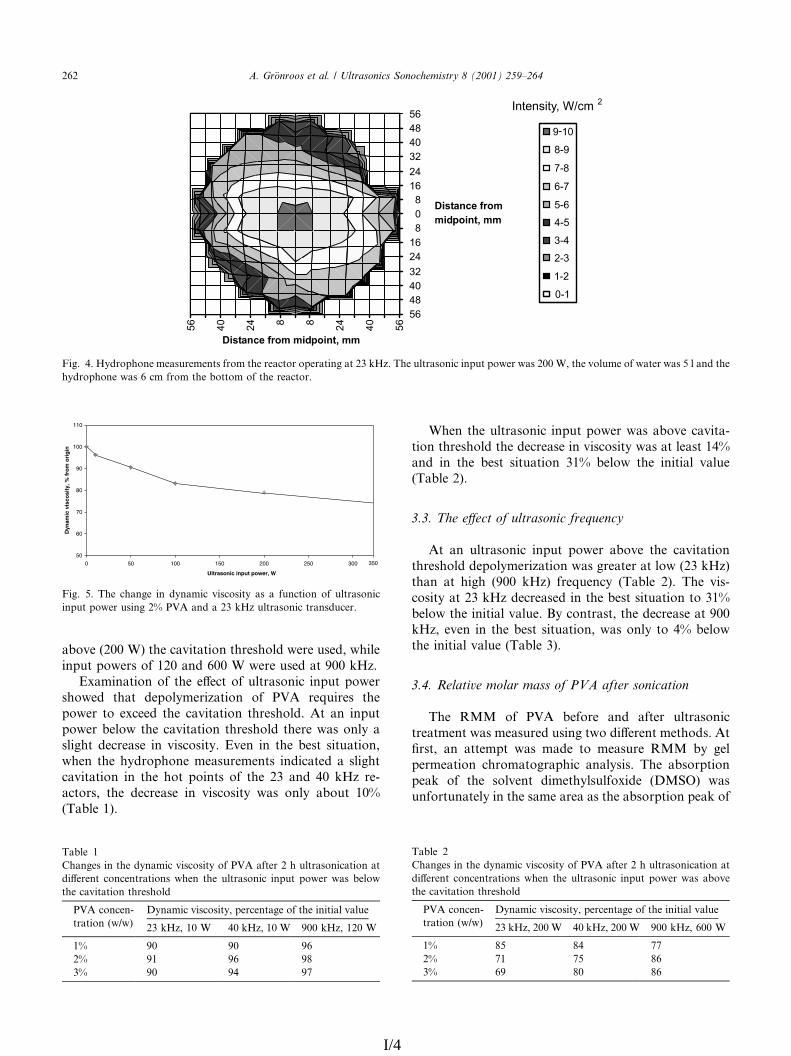
�"��� (,11 ;* ��� ������� ��������� $��� ����� $���� �� �$��� �� .,1 ��� ?11 ; $��� ���� �� 611 ����2+������� �� ��� �%�� �� �������� � �� �$��
���$�� ���� �� ����������� �� �)� ������� ��� �$�� �� �+��� ��� ������� ���������� �� �� � �� �$�� "���$ ��� ������� ��������� ����� $�� ���� ���#�� ������� � ������� 2��� � ��� "��� ��������$��� ��� ����� ���� ������������ ������ � ��#��������� � ��� ��� ���� �� ��� ,- ��� @1 ��� ��:������ ��� ������� � ������ $�� ���� �"��� .1/(&�"�� .*�
;��� ��� �������� � �� �$�� $�� �"��� ����:��� ��������� ��� ������� � ������ $�� �� ����� .@/��� � ��� "��� ������� -./ "���$ ��� ���� �����(&�"�� ,*�
���� �+� �:�'( �; ,�(������' ;��<,��'�
�� �� �������� � �� �$�� �"��� ��� ���������������� �� ����������� $�� #������ �� ��$ (,- ���*���� �� �#� (611 ���* �������� (&�"�� ,*� &�� ��:���� �� ,- ��� �������� � ��� "��� ������� �� -./"���$ ��� ���� ������ 3� �������� ��� ������� �� 611���� ���� � ��� "��� �������� $�� ���� �� @/ "���$��� ���� ����� (&�"�� -*�
���� &���(��� $���� $��� �; �. �;(�� ����'�(���
&�� 9 �� �)� "����� ��� ����� ����������������� $�� �������� ���# �$� �%����� �������� ��'���� �� ����� � $�� ���� �� ������� 9 "� #�� �������� �������#�� � �������� &�� �"��� ��� ��� �� ��� ������� ������������+�� (5 !H* $��������������� � ��� ���� ���� �� ��� �"��� ��� ��� ��
F#� @� ����� ���� ������������ ���� ��� ������ � �����# �� ,- ���� &�� �������� � �� �$�� $�� ,11 ;� ��� ������ �� $���� $�� = � ��� ���
����� ���� $�� ? � ���� ��� "����� �� ��� �������
F#� =� &�� ���#� � ����� ������ �� � ������ �� ��������
� �� �$�� ���# ,/ �)� ��� � ,- ��� �������� ����������
&�"�� .
A���#�� � ��� ����� ������ �� �)� ����� , � ������������ ��
�%����� ����������� $��� ��� �������� � �� �$�� $�� "���$
��� ������� ���������
�)� ����:
������ ($0$*
5���� ������� ������#� �� ��� ���� �����
,- ���� .1 ; @1 ���� .1 ; 611 ���� .,1 ;
./ 61 61 6?
,/ 6. 6? 6<
-/ 61 6@ 6C
&�"�� ,
A���#�� � ��� ����� ������ �� �)� ����� , � ������������ ��
�%����� ����������� $��� ��� �������� � �� �$�� $�� �"���
��� ������� ���������
�)� ����:
������ ($0$*
5���� ������� ������#� �� ��� ���� �����
,- ���� ,11 ; @1 ���� ,11 ; 611 ���� ?11 ;
./ <= <@ CC
,/ C. C= <?
-/ ?6 <1 <?
,?, .� /������� �( ��� 0 1�(������'� 2���'+�$��(�� 3 4%���5 %678%��
I/4
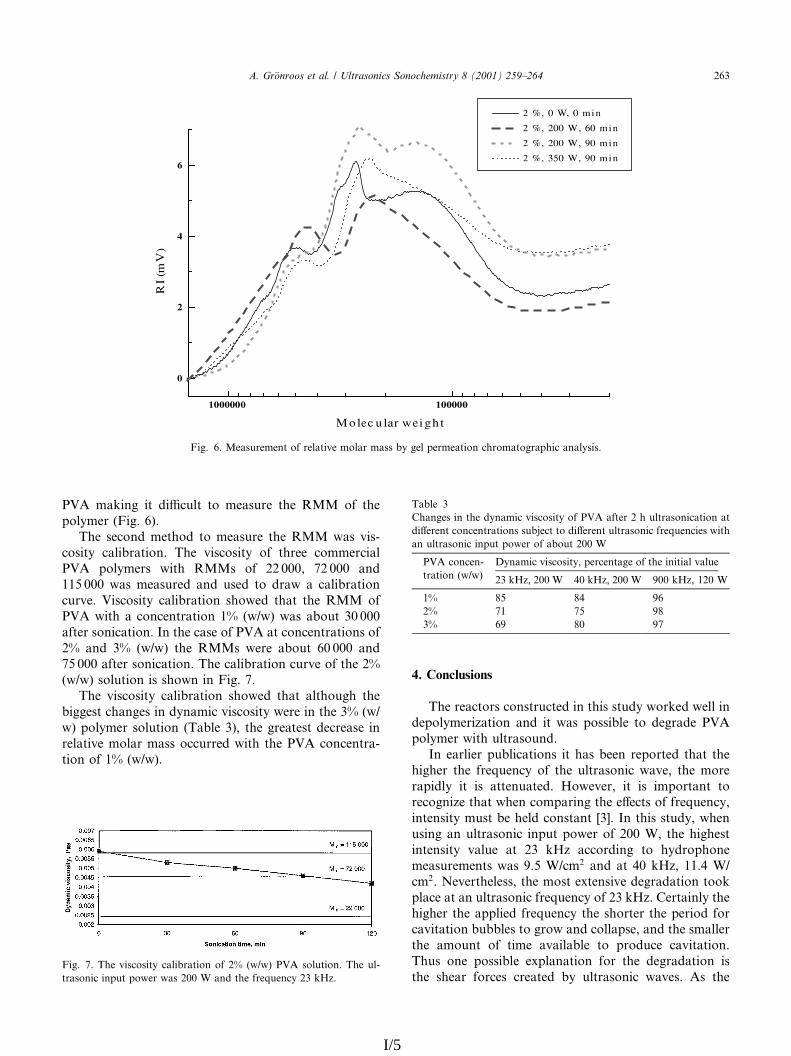
�)� ����# � �K��� �� ������� ��� 9 �� ��� ������ (F#� ?*�&�� ����� ������ �� ������� ��� 9 $�� ��:
���� ��"������ &�� ������ �� ����� ��������)� ������� $�� 9 � �� ,, 111� C, 111 ���..= 111 $�� �������� ��� ���� �� ���$ � ��"���������� )����� ��"����� ���$�� ���� ��� 9 ���)� $�� � ���������� ./ ($0$* $�� �"��� -1 111����� �������� �� ��� ��� �� �)� �� ����������� ��,/ ��� -/ ($0$* ��� 9 � $��� �"��� ?1 111 ���C= 111 ����� �������� &�� ��"����� ���� �� ��� ,/($0$* ������� � ���$� � F#� C�&�� ������ ��"����� ���$�� ���� ������#� ���
"##��� ���#�� � ����� ������ $��� � ��� -/ ($0$* ������ ������� (&�"�� -*� ��� #������� ������� �������� ����� ���� ������ $�� ��� �)� �������:��� �� ./ ($0$*�
� �����������
&�� ������� ��������� � ��� ����� $����� $��� ��� ����������� ��� � $�� ���"�� �� ��#���� �)� ������ $�� ������������� ������ �"������ � ��� "��� �� ����� ���� ���
�#��� ��� �������� �� ��� �������� $���� ��� ������ ��� � � ����������� ��$����� � � � ������ �����#��� ���� $��� �� ���# ��� �%��� �� ���������������� ���� "� ���� ������� 7-8� �� ��� ������ $������# �� �������� � �� �$�� �� ,11 ;� ��� �#����������� ����� �� ,- ��� �����# �� ����� ���������������� $�� 6�= ;0�, ��� �� @1 ���� ..�@ ;0�,� J������������ ��� ���� �+������ ��#������� ���� ��� �� �� �������� �������� �� ,- ���� A������� ����#��� ��� � ��� �������� ��� ������� ��� ���� ���������� "�""��� �� #��$ ��� ���� ��� ��� ��� ���������� ������ �� ��� �����"�� �� ����� ��������&��� ��� ���"�� �+ ������� ��� ��� ��#������� ���� ����� ����� ������ "� �������� $����� �� ���
F#� ?� ���������� �� ������� ����� ���� "� #�� �������� �������#�� � ��������
F#� C� &�� ������ ��"����� �� ,/ ($0$* �)� �������� &�� ��:
������ � �� �$�� $�� ,11 ; ��� ��� �������� ,- ����
&�"�� -
A���#�� � ��� ����� ������ �� �)� ����� , � ������������ ��
�%����� ����������� ��"M�� �� �%����� �������� ��������� $��
�� �������� � �� �$�� �� �"��� ,11 ;
�)� ����:
������ ($0$*
5���� ������� ������#� �� ��� ���� �����
,- ���� ,11 ; @1 ���� ,11 ; 611 ���� .,1 ;
./ <= <@ 6?
,/ C. C= 6<
-/ ?6 <1 6C
.� /������� �( ��� 0 1�(������'� 2���'+�$��(�� 3 4%���5 %678%�� ,?-
I/5
��������� ��� ���� ����������� �� ��� $��� ������������ ����� ����� $�� "� �� �������� "� ��� ���������������� �%��� 7-8� ���� ��� G����� ���� ����� ��� �+����� ��
������� ���������� ��� � ��� �� ����� ������� "���$$�� ������� ���� ��� "� ������ � � ����� &�����##����� ���� ���� $��� ��� � ��� ����� �� ������� ��� �������� $��� $�� ��K����� ���#� �� ���������� ������ ����� $��� ��� ���� ���� ��� ���� "����� � ��� �� ����� ������� "�""���� �� ��#�������� ��� �� ������� ���� � � �� "� �+ ���� ���� ��:#������� $�� ���� ��� $��� ��� ������� ���������� �+������ &�� � ��'����� ��#�� "� ;������� $�������#���� ��� ��#������� �� �����+��������� ����"������ ���� ��� ����� �� ��#������� ����� $�� �������� �� ������� 7-8� &�� ��#������� �� �)� � �������� $�� ���� ���� �"������ $��� ��� � �� �$�� $���"��� ������� ���������� �� � ���� �K��� �� ���:���� ������� ��������� "�� � � ���$� ���� � $����$��� ��� �������� �������� � ,1 ��� ��� ��������� ��"��� 1�@>@�1 ;0�, (�� ���� �� �� ������ �� $����*� ������� ������� �� �)� $��� ���� � ����� "� �#������� ��� ������ �� $���� ��� ���� ��� ���������������� �� �)� ������ "� ���� ����� �� $���� 7-8������# �� ��� ����� ��� ��#������� �� �)� $����������� ��� $��� ��� ������� ��������� � �+:������!������ ������� ���� �����#���� ��� �%�� �� ������
���������� �� ��#�������� �� ��� ��� ��� �+���� ����#������� ��� "��� ����� �� ������� $�� �� ������� ������ ����������� !�� �"��������� ���� "������� ����� � ����� �� ��� ������ � ������ �� ����������� ��� ��� �#��� ��� ������� ��� ���� �K��� �"����� �� ������ ��� ������� �� � #��� ������� ������ ������� � ��� ��#������� �%�� 7-8� �� ��� ����� ���
"##��� ���#� � 9 $�� ���� �"������ $��� ������������� �� �)� $�� ��� ��$���� ��� ./ ($0$*�&�� ����� ��'��� ��� #������ ����� ��� ���� ���
����� ����� #�������� "� ��� �� � ����� �� ��� ���:���� �����$�# ��������� ���� �� ��� ��� ���"�� ������ "�����#� �� ��� ����� "���� $��� ��� �������&�� �%�� �� ������ ���������� �� "� ���� ������ ����� �� ��� ������ � ������ $�� ���������������# ��� �������� �� "���� ���� ��"�� � ���������� ��� ������ #������� ������ ��� ���� ��# "�""����� ��������� "���� ������� 7.8�
�������� �������
&�� ������� ����� &2L2!� ��� J������ &������#��#��� �� F������ ��� )&& 2���#�� ��� &�����9������ A����� �� F������ ��� ���� '����� �� ����
����������
7.8 ���� ���� ���� ;���� ��F� !���� A������ �� ������ ��������
���# �$�� ����������� ��������� !������� . (.* (.66@* =.>=C�
7,8 ���� G������ &��� ����� &�A� A���"���� 2��� 3����'���� 2%�� ��
���������� �� ��� ��#������� �� ������� ����� ��+����� �����:
���� !������� , (.* (.66=* ==>=C�
7-8 &��� ����� ���� G������ !����������E &������ � ������
��� ��� �� ���������� � A�������� ;���� J�$ N���� .6<<�
7@8 ���� G������ &��� ����� !��� ����� ������ �� A�������
�������� !���������� A������ ��������� !������� , (,*
(.66=* C6><?�
7=8 �� 3������ &��� ����� 5������� ��� �$�� ���������� ���
������������ �E &��� ���� (2��*� ������� � !�����������
)��� @� ��� ������ �L� .66?� � .>C-�
7?8 �� 3������� 2� G�� �� L� �������� &� ��������� �� J�����
�� �������� �������� ��������� ������������� H�� F������
.6<.�
,?@ .� /������� �( ��� 0 1�(������'� 2���'+�$��(�� 3 4%���5 %678%��
I/6
Article II
Ultrasonic depolymerization of aqueous carboxymethylcellulose
In: Ultrasonics Sonochemistry. Vol. 11 (1), 2004, pp. 9–12.
Reprinted with permission from the publisher.

stry 11 (2004) 9–12
Ultrasonics SonochemiUltrasonic depolymerization of aqueous carboxymethylcellulose q
www.elsevier.com/locate/ultsonch
A. Gr€oonroos a,*, P. Pirkonen a, O. Ruppert b
a VTT Processes, P.O. Box 1603, FIN-40101 Jyv€aaskyl€aa, Finlandb Noviant Group, P.O. Box 500, FIN-44101 €AA€aanekoski, Finland
Accepted 3 April 2003
Abstract
Prolonged exposure of solutions of macromolecules to high-energy ultrasonic waves produces a permanent reduction in viscosity.
However, the exact mechanism by which degradation occurs is still open to discussion. According to this study hydrodynamic forces
played the primary role in degradation process. This study showed that there is an optimal carboxymethylcellulose (CMC) con-
centration to the most efficient degradation. Ultrasound degraded preferentially large CMC molecules and cleavage took place
roughly at the centre of the CMC molecules. Degradation of CMC did not proceed below a certain molecular mass. During
ultrasonic degradation the molecular mass distribution narrowed. For any polymer degradation process to become acceptable to
industry, it is important to be able to specify the sonication conditions to produce a particular relative molecular mass distribution.
� 2003 Elsevier B.V. All rights reserved.
Keywords: Ultrasonic depolymerization; Carboxymethylcellulose; Power ultrasound; Degradation; Polymer concentration; Relative molecular mass
1. Introduction of the molecule and with larger molecules degrading thefastest. It is also known, that there is a certain molecular
It is well established that prolonged exposure of so-
lutions of macromolecules to high-energy ultrasonic
waves produces a permanent reduction in viscosity.
Even when the irradiated polymers are isolated and re-
dissolved their viscosity remains low in comparison with
the non-irradiated solutions [1].
The exact mechanism by which degradation occurs isstill open to discussion. It is generally agreed that the
hydrodynamic forces have the primary importance.
Hydrodynamic forces may originate as a result of in-
creased frictional forces between the ultrasonically ac-
celerated faster moving solvent molecules and the larger,
less mobile, macromolecules. Hydrodynamic forces may
also be due to the high pressure associated with the
collapse of cavitation bubbles [2,3].It is believed, that ultrasonic degradation, unlike
chemical or thermal decomposition, is a non-random
process, with cleavage taking place roughly at the centre
q
This paper was originally presented at Applications of PowerUltrasound in Physical and Chemical Processing (Usound3), Paris,
December 2001.* Corresponding author.
E-mail address: [email protected] (A. Gr€oonroos).
1350-4177/$ - see front matter � 2003 Elsevier B.V. All rights reserved.
doi:10.1016/S1350-4177(03)00129-9
II/1
weight below which degradation does not take place.
Price et al. claims that this limiting molecular weight has
the added effect of narrowing the molecular weight
distribution [2]. In earlier studies it has been noticed that
the rate of ultrasonic depolymerization decreases with
decreasing molecular weight of the polymer, and that
the initial structure of the molecule, rather than its size,determines whether it will be broken by this means. The
rate and the extent of degradation depends on the
duration of irradiation, concentration of solution, na-
ture of polymer and solvent, and the intensity of the
ultrasound, in accord with the effect of experimental
parameters on cavitation [2,4,5]. Several authors have
investigated for example the effect of solution concen-
tration on degradation and in every case the rate and theextent of degradation have been found to decrease with
an increase in concentration [1]. However, cavitation is
difficult to achieve in viscous materials corresponding to
high-molecular-weight polymers. For this reason, dilute
solutions of the polymers have been used for the study
of ultrasonic depolymerization [6].
Several authors have investigated the effect of solute
concentration on degradation. In each case the extent ofdegradation has been found to decrease with an increase
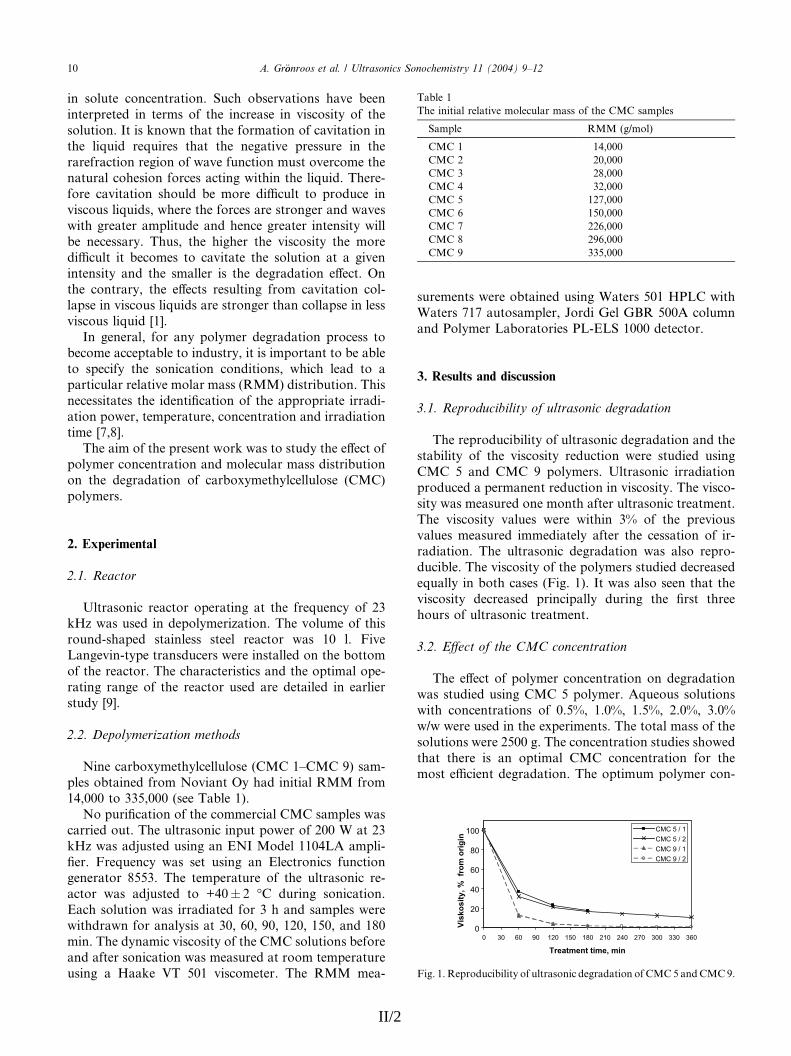
Table 1
The initial relative molecular mass of the CMC samples
Sample RMM (g/mol)
CMC 1 14,000
CMC 2 20,000
CMC 3 28,000
CMC 4 32,000
CMC 5 127,000
CMC 6 150,000
CMC 7 226,000
CMC 8 296,000
CMC 9 335,000
10 A. Gr€oonroos et al. / Ultrasonics Sonochemistry 11 (2004) 9–12
in solute concentration. Such observations have been
interpreted in terms of the increase in viscosity of the
solution. It is known that the formation of cavitation in
the liquid requires that the negative pressure in the
rarefraction region of wave function must overcome thenatural cohesion forces acting within the liquid. There-
fore cavitation should be more difficult to produce in
viscous liquids, where the forces are stronger and waves
with greater amplitude and hence greater intensity will
be necessary. Thus, the higher the viscosity the more
difficult it becomes to cavitate the solution at a given
intensity and the smaller is the degradation effect. On
the contrary, the effects resulting from cavitation col-lapse in viscous liquids are stronger than collapse in less
viscous liquid [1].
In general, for any polymer degradation process to
become acceptable to industry, it is important to be able
to specify the sonication conditions, which lead to a
particular relative molar mass (RMM) distribution. This
necessitates the identification of the appropriate irradi-
ation power, temperature, concentration and irradiationtime [7,8].
The aim of the present work was to study the effect of
polymer concentration and molecular mass distribution
on the degradation of carboxymethylcellulose (CMC)
polymers.
0
20
40
60
80
100
0 30 60 90 120 150 180 210 240 270 300 330 360
Treatment time, min
Visk
osity
, % f
rom
orig
in
CMC 5 / 1CMC 5 / 2CMC 9 / 1CMC 9 / 2
Fig. 1. Reproducibility of ultrasonic degradation of CMC 5 and CMC 9.
2. Experimental
2.1. Reactor
Ultrasonic reactor operating at the frequency of 23kHz was used in depolymerization. The volume of this
round-shaped stainless steel reactor was 10 l. Five
Langevin-type transducers were installed on the bottom
of the reactor. The characteristics and the optimal ope-
rating range of the reactor used are detailed in earlier
study [9].
2.2. Depolymerization methods
Nine carboxymethylcellulose (CMC 1–CMC 9) sam-
ples obtained from Noviant Oy had initial RMM from
14,000 to 335,000 (see Table 1).
No purification of the commercial CMC samples was
carried out. The ultrasonic input power of 200 W at 23
kHz was adjusted using an ENI Model 1104LA ampli-
fier. Frequency was set using an Electronics functiongenerator 8553. The temperature of the ultrasonic re-
actor was adjusted to +40� 2 �C during sonication.
Each solution was irradiated for 3 h and samples were
withdrawn for analysis at 30, 60, 90, 120, 150, and 180
min. The dynamic viscosity of the CMC solutions before
and after sonication was measured at room temperature
using a Haake VT 501 viscometer. The RMM mea-
II/2
surements were obtained using Waters 501 HPLC with
Waters 717 autosampler, Jordi Gel GBR 500A column
and Polymer Laboratories PL-ELS 1000 detector.
3. Results and discussion
3.1. Reproducibility of ultrasonic degradation
The reproducibility of ultrasonic degradation and the
stability of the viscosity reduction were studied using
CMC 5 and CMC 9 polymers. Ultrasonic irradiation
produced a permanent reduction in viscosity. The visco-
sity was measured one month after ultrasonic treatment.
The viscosity values were within 3% of the previous
values measured immediately after the cessation of ir-radiation. The ultrasonic degradation was also repro-
ducible. The viscosity of the polymers studied decreased
equally in both cases (Fig. 1). It was also seen that the
viscosity decreased principally during the first three
hours of ultrasonic treatment.
3.2. Effect of the CMC concentration
The effect of polymer concentration on degradation
was studied using CMC 5 polymer. Aqueous solutions
with concentrations of 0.5%, 1.0%, 1.5%, 2.0%, 3.0%
w/w were used in the experiments. The total mass of the
solutions were 2500 g. The concentration studies showed
that there is an optimal CMC concentration for the
most efficient degradation. The optimum polymer con-
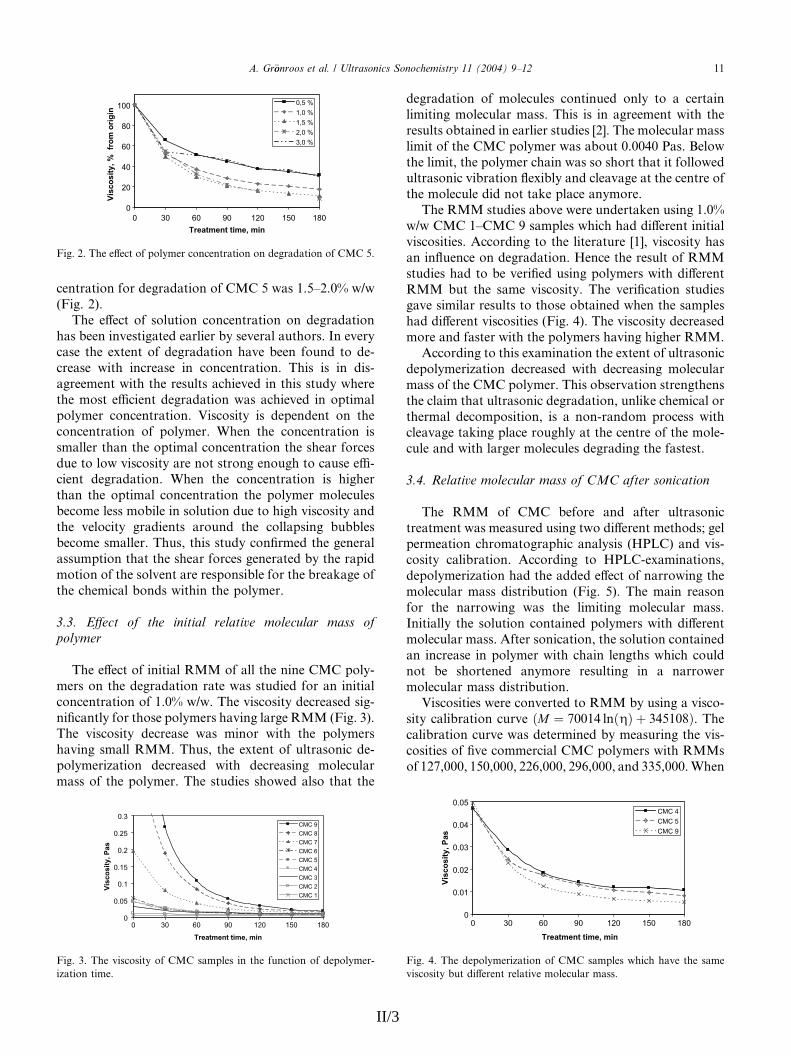
0
20
40
60
80
100
0 30 60 90 120 150 180Treatment time, min
Visc
osity
, % f
rom
orig
in0,5 %1,0 %1,5 %2,0 %3,0 %
Fig. 2. The effect of polymer concentration on degradation of CMC 5.
A. Gr€oonroos et al. / Ultrasonics Sonochemistry 11 (2004) 9–12 11
centration for degradation of CMC 5 was 1.5–2.0% w/w
(Fig. 2).
The effect of solution concentration on degradation
has been investigated earlier by several authors. In everycase the extent of degradation have been found to de-
crease with increase in concentration. This is in dis-
agreement with the results achieved in this study where
the most efficient degradation was achieved in optimal
polymer concentration. Viscosity is dependent on the
concentration of polymer. When the concentration is
smaller than the optimal concentration the shear forces
due to low viscosity are not strong enough to cause effi-cient degradation. When the concentration is higher
than the optimal concentration the polymer molecules
become less mobile in solution due to high viscosity and
the velocity gradients around the collapsing bubbles
become smaller. Thus, this study confirmed the general
assumption that the shear forces generated by the rapid
motion of the solvent are responsible for the breakage of
the chemical bonds within the polymer.
3.3. Effect of the initial relative molecular mass of
polymer
The effect of initial RMM of all the nine CMC poly-
mers on the degradation rate was studied for an initial
concentration of 1.0% w/w. The viscosity decreased sig-
nificantly for those polymers having large RMM (Fig. 3).The viscosity decrease was minor with the polymers
having small RMM. Thus, the extent of ultrasonic de-
polymerization decreased with decreasing molecular
mass of the polymer. The studies showed also that the
0
0.05
0.1
0.15
0.2
0.25
0.3
0 30 60 90 120 150 180
Treatment time, min
Visc
osity
, Pas
CMC 9CMC 8CMC 7CMC 6CMC 5CMC 4CMC 3CMC 2CMC 1
Fig. 3. The viscosity of CMC samples in the function of depolymer-
ization time.
II/3
degradation of molecules continued only to a certain
limiting molecular mass. This is in agreement with the
results obtained in earlier studies [2]. The molecular mass
limit of the CMC polymer was about 0.0040 Pas. Below
the limit, the polymer chain was so short that it followedultrasonic vibration flexibly and cleavage at the centre of
the molecule did not take place anymore.
The RMM studies above were undertaken using 1.0%
w/w CMC 1–CMC 9 samples which had different initial
viscosities. According to the literature [1], viscosity has
an influence on degradation. Hence the result of RMM
studies had to be verified using polymers with different
RMM but the same viscosity. The verification studiesgave similar results to those obtained when the samples
had different viscosities (Fig. 4). The viscosity decreased
more and faster with the polymers having higher RMM.
According to this examination the extent of ultrasonic
depolymerization decreased with decreasing molecular
mass of the CMC polymer. This observation strengthens
the claim that ultrasonic degradation, unlike chemical or
thermal decomposition, is a non-random process withcleavage taking place roughly at the centre of the mole-
cule and with larger molecules degrading the fastest.
3.4. Relative molecular mass of CMC after sonication
The RMM of CMC before and after ultrasonic
treatment was measured using two different methods; gel
permeation chromatographic analysis (HPLC) and vis-cosity calibration. According to HPLC-examinations,
depolymerization had the added effect of narrowing the
molecular mass distribution (Fig. 5). The main reason
for the narrowing was the limiting molecular mass.
Initially the solution contained polymers with different
molecular mass. After sonication, the solution contained
an increase in polymer with chain lengths which could
not be shortened anymore resulting in a narrowermolecular mass distribution.
Viscosities were converted to RMM by using a visco-
sity calibration curve ðM ¼ 70014 lnðgÞ þ 345108Þ. The
calibration curve was determined by measuring the vis-
cosities of five commercial CMC polymers with RMMs
of 127,000, 150,000, 226,000, 296,000, and 335,000. When
0
0.01
0.02
0.03
0.04
0.05
0 30 60 90 120 150 180
Treatment time, min
Visc
osity
, Pas
CMC 4CMC 5CMC 9
Fig. 4. The depolymerization of CMC samples which have the same
viscosity but different relative molecular mass.
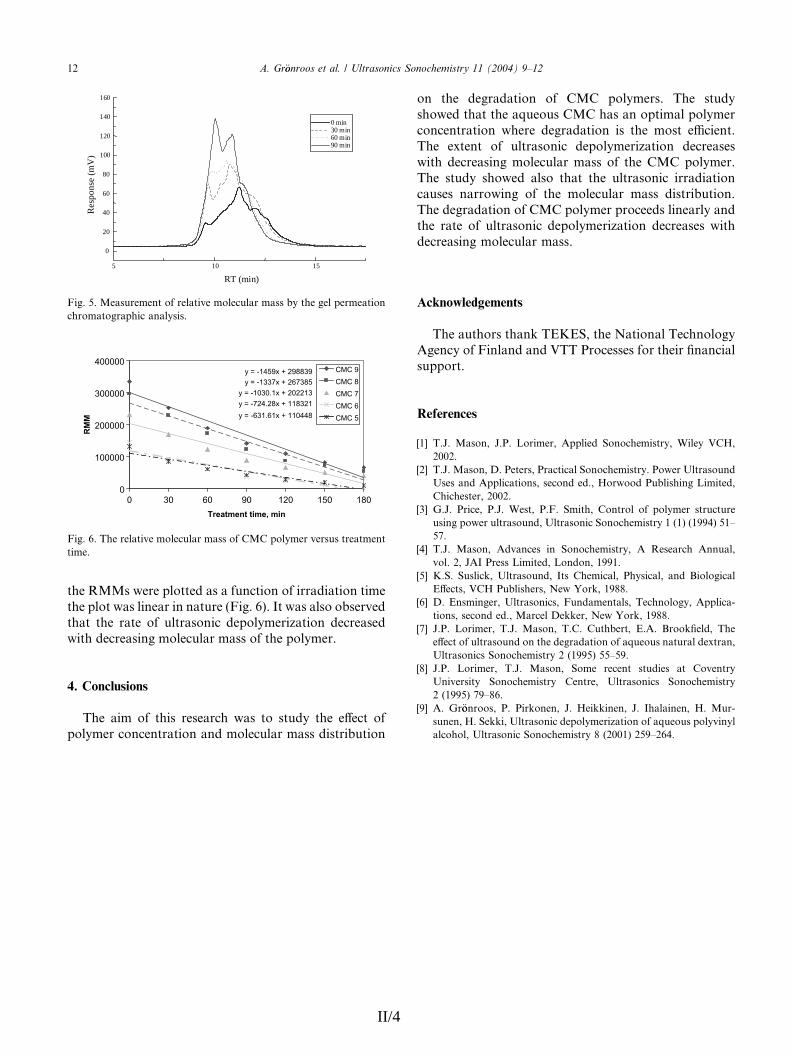
5 10 15
0
20
40
60
80
100
120
140
160
0 min 30 min 60 min 90 min
Res
pons
e (m
V)
RT (min)
Fig. 5. Measurement of relative molecular mass by the gel permeation
chromatographic analysis.
y = -1030.1x + 202213
y = -1459x + 298839y = -1337x + 267385
y = -724.28x + 118321y = -631.61x + 110448
0
100000
200000
300000
400000
0 30 60 90 120 150 180Treatment time, min
RM
M
CMC 9CMC 8CMC 7CMC 6CMC 5
Fig. 6. The relative molecular mass of CMC polymer versus treatment
time.
12 A. Gr€oonroos et al. / Ultrasonics Sonochemistry 11 (2004) 9–12
the RMMs were plotted as a function of irradiation time
the plot was linear in nature (Fig. 6). It was also observed
that the rate of ultrasonic depolymerization decreased
with decreasing molecular mass of the polymer.
4. Conclusions
The aim of this research was to study the effect of
polymer concentration and molecular mass distribution
II/4
on the degradation of CMC polymers. The study
showed that the aqueous CMC has an optimal polymer
concentration where degradation is the most efficient.
The extent of ultrasonic depolymerization decreases
with decreasing molecular mass of the CMC polymer.The study showed also that the ultrasonic irradiation
causes narrowing of the molecular mass distribution.
The degradation of CMC polymer proceeds linearly and
the rate of ultrasonic depolymerization decreases with
decreasing molecular mass.
Acknowledgements
The authors thank TEKES, the National TechnologyAgency of Finland and VTT Processes for their financial
support.
References
[1] T.J. Mason, J.P. Lorimer, Applied Sonochemistry, Wiley VCH,
2002.
[2] T.J. Mason, D. Peters, Practical Sonochemistry. Power Ultrasound
Uses and Applications, second ed., Horwood Publishing Limited,
Chichester, 2002.
[3] G.J. Price, P.J. West, P.F. Smith, Control of polymer structure
using power ultrasound, Ultrasonic Sonochemistry 1 (1) (1994) 51–
57.
[4] T.J. Mason, Advances in Sonochemistry, A Research Annual,
vol. 2, JAI Press Limited, London, 1991.
[5] K.S. Suslick, Ultrasound, Its Chemical, Physical, and Biological
Effects, VCH Publishers, New York, 1988.
[6] D. Ensminger, Ultrasonics, Fundamentals, Technology, Applica-
tions, second ed., Marcel Dekker, New York, 1988.
[7] J.P. Lorimer, T.J. Mason, T.C. Cuthbert, E.A. Brookfield, The
effect of ultrasound on the degradation of aqueous natural dextran,
Ultrasonics Sonochemistry 2 (1995) 55–59.
[8] J.P. Lorimer, T.J. Mason, Some recent studies at Coventry
University Sonochemistry Centre, Ultrasonics Sonochemistry
2 (1995) 79–86.
[9] A. Gr€oonroos, P. Pirkonen, J. Heikkinen, J. Ihalainen, H. Mur-
sunen, H. Sekki, Ultrasonic depolymerization of aqueous polyvinyl
alcohol, Ultrasonic Sonochemistry 8 (2001) 259–264.
Article III
Ultrasonic degradation of aqueous carboxymethylcellulose: Effect
of viscosity, molecular mass, and concentration
In: Ultrasonics Sonochemistry. Vol. 15 (4), 2008, pp. 644–648.
Reprinted with permission from the publisher.

Available online at www.sciencedirect.com
Ultrasonic degradation of aqueous carboxymethylcellulose: Effect
www.elsevier.com/locate/ultsonch
Ultrasonics Sonochemistry 15 (2008) 644–648
of viscosity, molecular mass, and concentration q
Antti Gronroos *, Pirkonen Pentti, Kyllonen Hanna
VTT, P.O. Box 1603, FIN-40101 Jyvaskyla, Finland
Received 31 December 2006; received in revised form 23 June 2007; accepted 11 September 2007Available online 20 September 2007
Abstract
It is well established that prolonged exposure of solutions of macromolecules to high-energy ultrasonic waves produces a permanentreduction in viscosity. It is generally agreed as well and also this study proved the hydrodynamic forces to have the primary importancein degradation. According to this study the sonolytic degradation of aqueous carboxymethylcellulose polymer or polymer mixtures ismainly depended on the initial dynamic viscosity of the polymer solution when the dynamic viscosity values are in the area rangeenabling intense cavitation. The higher was the initial dynamic viscosity the faster was the degradation. When the initial dynamic vis-cosities of the polymer solutions were similar the sonolytic degradation was dependent on the molecular mass and on the concentrationof the polymer. The polymers with high molecular mass or high polymer concentration degraded faster than the polymers having lowmolecular mass or low polymer concentration. The initial dynamic viscosities were adjusted using polyethyleneglycol.� 2007 Elsevier B.V. All rights reserved.
Keywords: Ultrasound; Degradation; Carboxymethylcellulose; Cavitation; Viscosity; Molecular mass; Concentration; Polyethyleneglycol
1. Introduction high pressure associated with the collapse of cavitation
It is well established that prolonged exposure of solu-tions of macromolecules to high-energy ultrasonic wavesproduces a permanent reduction in viscosity. Even whenthe irradiated polymers are isolated and redissolved theirviscosity remains low in comparison with the non-irradi-ated solutions [1, p. 99].
The exact mechanism by which degradation occurs isstill open to discussion. It is generally agreed that thehydrodynamic forces have the primary importance. Hydro-dynamic forces may originate as a result of increased fric-tional forces between the ultrasonically accelerated fastermoving solvent molecules and the larger, less mobile, mac-romolecules. Hydrodynamic forces may also be due to the
1350-4177/$ - see front matter � 2007 Elsevier B.V. All rights reserved.
doi:10.1016/j.ultsonch.2007.09.005
q This paper has been presented as a poster at ESS10 Conference,Hamburg, June 2006.
* Corresponding author.E-mail address: [email protected] (A. Gronroos).
III/1
bubbles [2, p. 156,3,4, p. 151].It is believed, that ultrasonic degradation, unlike chem-
ical or thermal decomposition, is a non-random process,with cleavage taking place roughly at the centre of the mol-ecule and with larger molecules degrading the fastest. Inaddition it is known, that below a certain molecular weightdegradation does not take place. Price et al. claims that thislimiting molecular weight has the added effect of narrowingthe molecular weight distribution [3]. In earlier studies ithas been noticed that the rate of ultrasonic depolymeriza-tion decreases with decreasing molecular mass of the poly-mer, and that the initial structure of the molecule, ratherthan its size, determines whether it will be broken by thismeans. The rate and the extent of degradation depend onthe duration of irradiation, nature of polymer and solvent,and the intensity of the ultrasound, in accord with the effectof experimental parameters on cavitation [2, pp. 99–126,4,p. 151,5, pp. 125–129,6, p. 403,7–18].
The effect of concentration on ultrasonic degradationhas also been under investigations. It has been found that
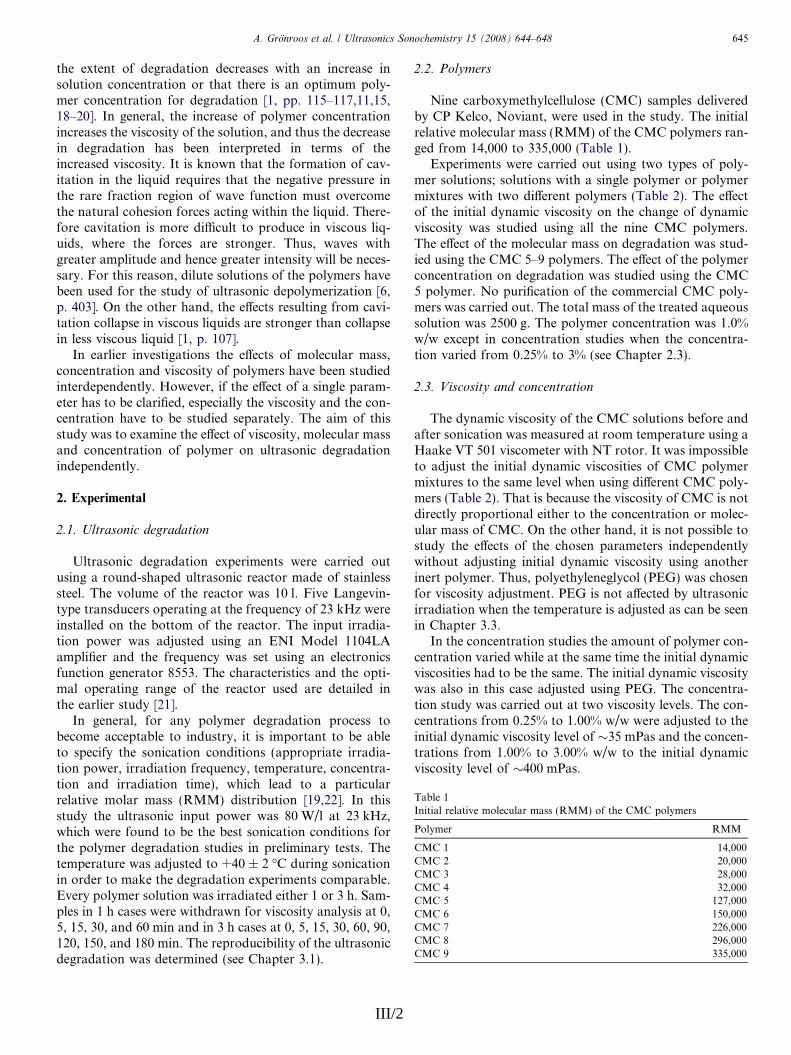
the extent of degradation decreases with an increase in 2.2. Polymers
Initial relative molecular mass (RMM) of the CMC polymers
Polymer RMM
CMC 1 14,000CMC 2 20,000CMC 3 28,000CMC 4 32,000CMC 5 127,000CMC 6 150,000CMC 7 226,000CMC 8 296,000CMC 9 335,000
A. Gronroos et al. / Ultrasonics Sonochemistry 15 (2008) 644–648 645
solution concentration or that there is an optimum poly-mer concentration for degradation [1, pp. 115–117,11,15,18–20]. In general, the increase of polymer concentrationincreases the viscosity of the solution, and thus the decreasein degradation has been interpreted in terms of theincreased viscosity. It is known that the formation of cav-itation in the liquid requires that the negative pressure inthe rare fraction region of wave function must overcomethe natural cohesion forces acting within the liquid. There-fore cavitation is more difficult to produce in viscous liq-uids, where the forces are stronger. Thus, waves withgreater amplitude and hence greater intensity will be neces-sary. For this reason, dilute solutions of the polymers havebeen used for the study of ultrasonic depolymerization [6,p. 403]. On the other hand, the effects resulting from cavi-tation collapse in viscous liquids are stronger than collapsein less viscous liquid [1, p. 107].
In earlier investigations the effects of molecular mass,concentration and viscosity of polymers have been studiedinterdependently. However, if the effect of a single param-eter has to be clarified, especially the viscosity and the con-centration have to be studied separately. The aim of thisstudy was to examine the effect of viscosity, molecular massand concentration of polymer on ultrasonic degradationindependently.
2. Experimental
2.1. Ultrasonic degradation
Ultrasonic degradation experiments were carried outusing a round-shaped ultrasonic reactor made of stainlesssteel. The volume of the reactor was 10 l. Five Langevin-type transducers operating at the frequency of 23 kHz wereinstalled on the bottom of the reactor. The input irradia-tion power was adjusted using an ENI Model 1104LAamplifier and the frequency was set using an electronicsfunction generator 8553. The characteristics and the opti-mal operating range of the reactor used are detailed inthe earlier study [21].
In general, for any polymer degradation process tobecome acceptable to industry, it is important to be ableto specify the sonication conditions (appropriate irradia-tion power, irradiation frequency, temperature, concentra-tion and irradiation time), which lead to a particularrelative molar mass (RMM) distribution [19,22]. In thisstudy the ultrasonic input power was 80 W/l at 23 kHz,which were found to be the best sonication conditions forthe polymer degradation studies in preliminary tests. Thetemperature was adjusted to +40 ± 2 �C during sonicationin order to make the degradation experiments comparable.Every polymer solution was irradiated either 1 or 3 h. Sam-ples in 1 h cases were withdrawn for viscosity analysis at 0,5, 15, 30, and 60 min and in 3 h cases at 0, 5, 15, 30, 60, 90,120, 150, and 180 min. The reproducibility of the ultrasonicdegradation was determined (see Chapter 3.1).
III/2
Nine carboxymethylcellulose (CMC) samples deliveredby CP Kelco, Noviant, were used in the study. The initialrelative molecular mass (RMM) of the CMC polymers ran-ged from 14,000 to 335,000 (Table 1).
Experiments were carried out using two types of poly-mer solutions; solutions with a single polymer or polymermixtures with two different polymers (Table 2). The effectof the initial dynamic viscosity on the change of dynamicviscosity was studied using all the nine CMC polymers.The effect of the molecular mass on degradation was stud-ied using the CMC 5–9 polymers. The effect of the polymerconcentration on degradation was studied using the CMC5 polymer. No purification of the commercial CMC poly-mers was carried out. The total mass of the treated aqueoussolution was 2500 g. The polymer concentration was 1.0%w/w except in concentration studies when the concentra-tion varied from 0.25% to 3% (see Chapter 2.3).
2.3. Viscosity and concentration
The dynamic viscosity of the CMC solutions before andafter sonication was measured at room temperature using aHaake VT 501 viscometer with NT rotor. It was impossibleto adjust the initial dynamic viscosities of CMC polymermixtures to the same level when using different CMC poly-mers (Table 2). That is because the viscosity of CMC is notdirectly proportional either to the concentration or molec-ular mass of CMC. On the other hand, it is not possible tostudy the effects of the chosen parameters independentlywithout adjusting initial dynamic viscosity using anotherinert polymer. Thus, polyethyleneglycol (PEG) was chosenfor viscosity adjustment. PEG is not affected by ultrasonicirradiation when the temperature is adjusted as can be seenin Chapter 3.3.
In the concentration studies the amount of polymer con-centration varied while at the same time the initial dynamicviscosities had to be the same. The initial dynamic viscositywas also in this case adjusted using PEG. The concentra-tion study was carried out at two viscosity levels. The con-centrations from 0.25% to 1.00% w/w were adjusted to theinitial dynamic viscosity level of �35 mPas and the concen-trations from 1.00% to 3.00% w/w to the initial dynamicviscosity level of �400 mPas.
Table 1
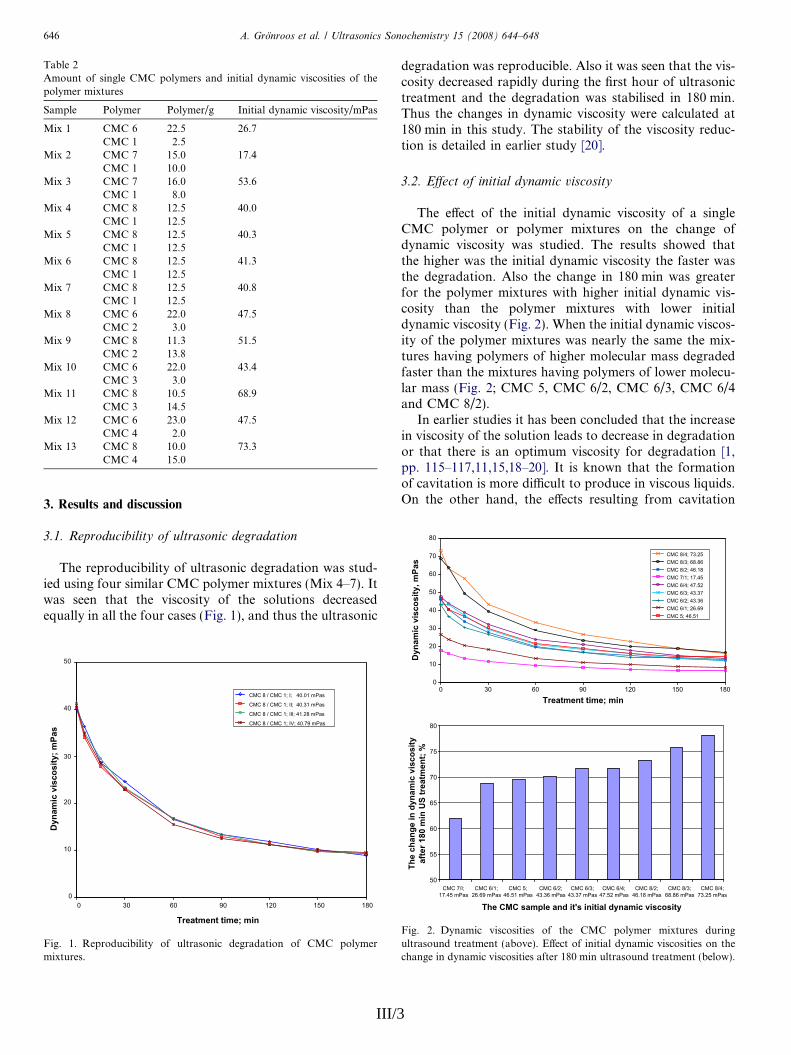
3. Results and discussion
degradation was reproducible. Also it was seen that the vis-Table 2Amount of single CMC polymers and initial dynamic viscosities of thepolymer mixtures
Sample Polymer Polymer/g Initial dynamic viscosity/mPas
Mix 1 CMC 6 22.5 26.7CMC 1 2.5
Mix 2 CMC 7 15.0 17.4CMC 1 10.0
Mix 3 CMC 7 16.0 53.6CMC 1 8.0
Mix 4 CMC 8 12.5 40.0CMC 1 12.5
Mix 5 CMC 8 12.5 40.3CMC 1 12.5
Mix 6 CMC 8 12.5 41.3CMC 1 12.5
Mix 7 CMC 8 12.5 40.8CMC 1 12.5
Mix 8 CMC 6 22.0 47.5CMC 2 3.0
Mix 9 CMC 8 11.3 51.5CMC 2 13.8
Mix 10 CMC 6 22.0 43.4CMC 3 3.0
Mix 11 CMC 8 10.5 68.9CMC 3 14.5
Mix 12 CMC 6 23.0 47.5CMC 4 2.0
Mix 13 CMC 8 10.0 73.3CMC 4 15.0
20
30
40
50
60
70
ynam
ic v
isco
sity
, mPa
s
CMC 8/4; 73.25CMC 8/3; 68.86CMC 8/2; 46.18CMC 7/1; 17.45CMC 6/4; 47.52CMC 6/3; 43.37CMC 6/2; 43.36CMC 6/1; 26.69CMC 5; 46.51
646 A. Gronroos et al. / Ultrasonics Sonochemistry 15 (2008) 644–648
3.1. Reproducibility of ultrasonic degradation
The reproducibility of ultrasonic degradation was stud-ied using four similar CMC polymer mixtures (Mix 4–7). Itwas seen that the viscosity of the solutions decreasedequally in all the four cases (Fig. 1), and thus the ultrasonic
0
10
20
30
40
50
0 30 60 90 120 150 180
Treatment time; min
Dyn
amic
vis
cosi
ty; m
Pas
CMC 8 / CMC 1; I; 40.01 mPas
CMC 8 / CMC 1; II; 40.31 mPas
CMC 8 / CMC 1; III; 41.28 mPas
CMC 8 / CMC 1; IV; 40.79 mPas
Fig. 1. Reproducibility of ultrasonic degradation of CMC polymermixtures.
III/3
cosity decreased rapidly during the first hour of ultrasonictreatment and the degradation was stabilised in 180 min.Thus the changes in dynamic viscosity were calculated at180 min in this study. The stability of the viscosity reduc-tion is detailed in earlier study [20].
3.2. Effect of initial dynamic viscosity
The effect of the initial dynamic viscosity of a singleCMC polymer or polymer mixtures on the change ofdynamic viscosity was studied. The results showed thatthe higher was the initial dynamic viscosity the faster wasthe degradation. Also the change in 180 min was greaterfor the polymer mixtures with higher initial dynamic vis-cosity than the polymer mixtures with lower initialdynamic viscosity (Fig. 2). When the initial dynamic viscos-ity of the polymer mixtures was nearly the same the mix-tures having polymers of higher molecular mass degradedfaster than the mixtures having polymers of lower molecu-lar mass (Fig. 2; CMC 5, CMC 6/2, CMC 6/3, CMC 6/4and CMC 8/2).
In earlier studies it has been concluded that the increasein viscosity of the solution leads to decrease in degradationor that there is an optimum viscosity for degradation [1,pp. 115–117,11,15,18–20]. It is known that the formationof cavitation is more difficult to produce in viscous liquids.On the other hand, the effects resulting from cavitation
80
0
10
0 30 60 90 120 150 180
Treatment time; min
D
50
55
60
65
70
75
80
CMC 7/I;17.45 mPas
CMC 6/1;26.69 mPas
CMC 5;46.51 mPas
CMC 6/2;43.36 mPas
CMC 6/3;43.37 mPas
CMC 6/4;47.52 mPas
CMC 8/2;46.18 mPas
CMC 8/3;68.86 mPas
CMC 8/4;73.25 mPas
The CMC sample and it's initial dynamic viscosity
The
chan
ge in
dyn
amic
vis
cosi
ty
afte
r 180
min
US
trea
tmen
t; %
Fig. 2. Dynamic viscosities of the CMC polymer mixtures duringultrasound treatment (above). Effect of initial dynamic viscosities on thechange in dynamic viscosities after 180 min ultrasound treatment (below).
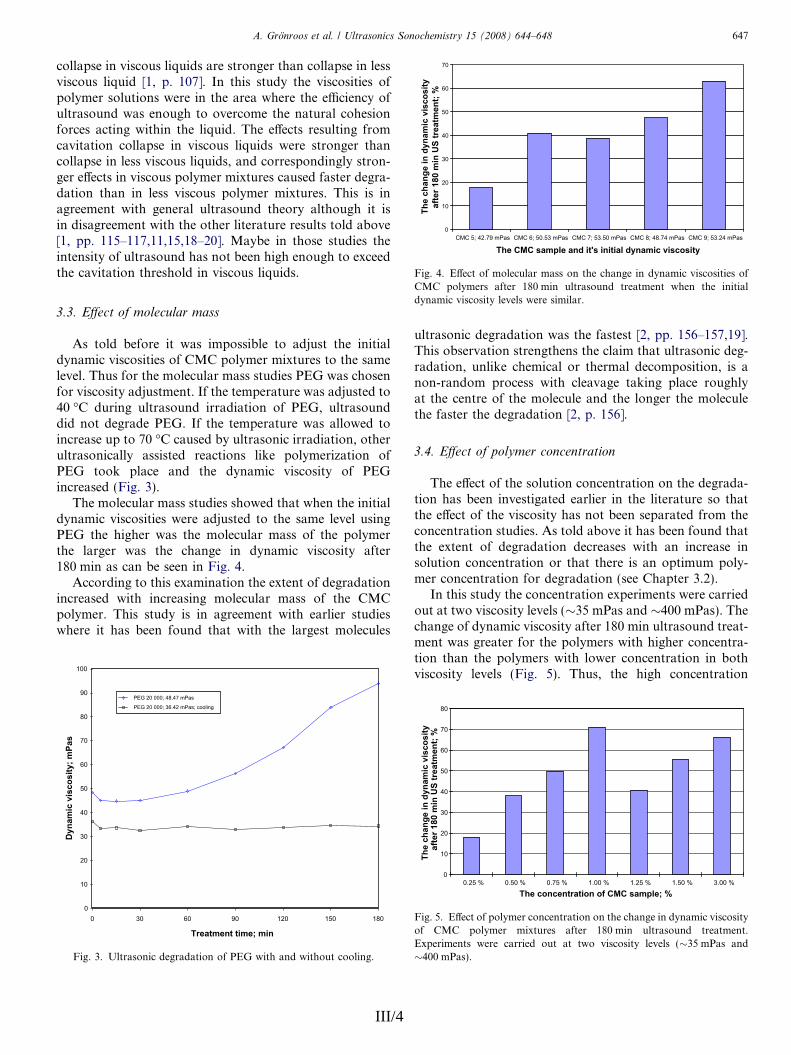
collapse in viscous liquids are stronger than collapse in less
0
10
20
30
40
50
60
70
CMC 5; 42.79 mPas CMC 6; 50.53 mPas CMC 7; 53.50 mPas CMC 8; 48.74 mPas CMC 9; 53.24 mPas
The CMC sample and it's initial dynamic viscosity
The
chan
ge in
dyn
amic
vis
cosi
ty
afte
r 180
min
US
trea
tmen
t; %
Fig. 4. Effect of molecular mass on the change in dynamic viscosities ofCMC polymers after 180 min ultrasound treatment when the initialdynamic viscosity levels were similar.
A. Gronroos et al. / Ultrasonics Sonochemistry 15 (2008) 644–648 647
viscous liquid [1, p. 107]. In this study the viscosities ofpolymer solutions were in the area where the efficiency ofultrasound was enough to overcome the natural cohesionforces acting within the liquid. The effects resulting fromcavitation collapse in viscous liquids were stronger thancollapse in less viscous liquids, and correspondingly stron-ger effects in viscous polymer mixtures caused faster degra-dation than in less viscous polymer mixtures. This is inagreement with general ultrasound theory although it isin disagreement with the other literature results told above[1, pp. 115–117,11,15,18–20]. Maybe in those studies theintensity of ultrasound has not been high enough to exceedthe cavitation threshold in viscous liquids.
3.3. Effect of molecular mass
ultrasonic degradation was the fastest [2, pp. 156–157,19].
As told before it was impossible to adjust the initialdynamic viscosities of CMC polymer mixtures to the samelevel. Thus for the molecular mass studies PEG was chosenfor viscosity adjustment. If the temperature was adjusted to40 �C during ultrasound irradiation of PEG, ultrasounddid not degrade PEG. If the temperature was allowed toincrease up to 70 �C caused by ultrasonic irradiation, otherultrasonically assisted reactions like polymerization ofPEG took place and the dynamic viscosity of PEGincreased (Fig. 3).
The molecular mass studies showed that when the initialdynamic viscosities were adjusted to the same level usingPEG the higher was the molecular mass of the polymerthe larger was the change in dynamic viscosity after180 min as can be seen in Fig. 4.
According to this examination the extent of degradationincreased with increasing molecular mass of the CMCpolymer. This study is in agreement with earlier studieswhere it has been found that with the largest molecules
100
0
10
20
30
40
50
60
70
80
90
0 30 60 90 120 150 180
Treatment time; min
Dyn
amic
vis
cosi
ty; m
Pas
PEG 20 000; 48.47 mPas
PEG 20 000; 36.42 mPas; cooling
Fig. 3. Ultrasonic degradation of PEG with and without cooling.
III/4
This observation strengthens the claim that ultrasonic deg-radation, unlike chemical or thermal decomposition, is anon-random process with cleavage taking place roughlyat the centre of the molecule and the longer the moleculethe faster the degradation [2, p. 156].
3.4. Effect of polymer concentration
The effect of the solution concentration on the degrada-tion has been investigated earlier in the literature so thatthe effect of the viscosity has not been separated from theconcentration studies. As told above it has been found thatthe extent of degradation decreases with an increase insolution concentration or that there is an optimum poly-mer concentration for degradation (see Chapter 3.2).
In this study the concentration experiments were carriedout at two viscosity levels (�35 mPas and �400 mPas). Thechange of dynamic viscosity after 180 min ultrasound treat-ment was greater for the polymers with higher concentra-tion than the polymers with lower concentration in bothviscosity levels (Fig. 5). Thus, the high concentration
80
0
10
20
30
40
50
60
70
0.25 % 0.50 % 0.75 % 1.00 % 1.25 % 1.50 % 3.00 %
The concentration of CMC sample; %
The
chan
ge in
dyn
amic
vis
cosi
ty
afte
r 180
min
US
trea
tmen
t; %
Fig. 5. Effect of polymer concentration on the change in dynamic viscosityof CMC polymer mixtures after 180 min ultrasound treatment.Experiments were carried out at two viscosity levels (�35 mPas and�400 mPas).
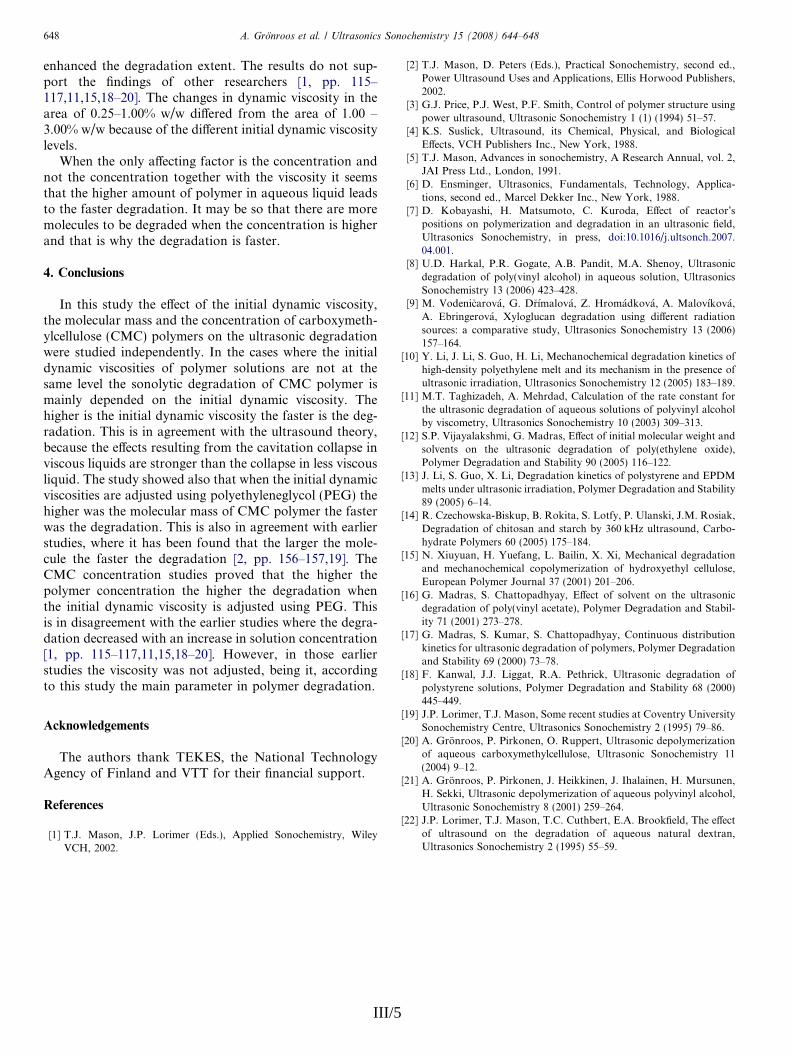
enhanced the degradation extent. The results do not sup- [2] T.J. Mason, D. Peters (Eds.), Practical Sonochemistry, second ed.,Power Ultrasound Uses and Applications, Ellis Horwood Publishers,
648 A. Gronroos et al. / Ultrasonics Sonochemistry 15 (2008) 644–648
port the findings of other researchers [1, pp. 115–117,11,15,18–20]. The changes in dynamic viscosity in thearea of 0.25–1.00% w/w differed from the area of 1.00 –3.00% w/w because of the different initial dynamic viscositylevels.
When the only affecting factor is the concentration andnot the concentration together with the viscosity it seemsthat the higher amount of polymer in aqueous liquid leadsto the faster degradation. It may be so that there are moremolecules to be degraded when the concentration is higherand that is why the degradation is faster.
4. Conclusions
In this study the effect of the initial dynamic viscosity,the molecular mass and the concentration of carboxymeth-ylcellulose (CMC) polymers on the ultrasonic degradationwere studied independently. In the cases where the initialdynamic viscosities of polymer solutions are not at thesame level the sonolytic degradation of CMC polymer ismainly depended on the initial dynamic viscosity. Thehigher is the initial dynamic viscosity the faster is the deg-radation. This is in agreement with the ultrasound theory,because the effects resulting from the cavitation collapse inviscous liquids are stronger than the collapse in less viscousliquid. The study showed also that when the initial dynamicviscosities are adjusted using polyethyleneglycol (PEG) thehigher was the molecular mass of CMC polymer the fasterwas the degradation. This is also in agreement with earlierstudies, where it has been found that the larger the mole-cule the faster the degradation [2, pp. 156–157,19]. TheCMC concentration studies proved that the higher thepolymer concentration the higher the degradation whenthe initial dynamic viscosity is adjusted using PEG. Thisis in disagreement with the earlier studies where the degra-dation decreased with an increase in solution concentration[1, pp. 115–117,11,15,18–20]. However, in those earlierstudies the viscosity was not adjusted, being it, accordingto this study the main parameter in polymer degradation.
Acknowledgements
The authors thank TEKES, the National TechnologyAgency of Finland and VTT for their financial support.
References
[1] T.J. Mason, J.P. Lorimer (Eds.), Applied Sonochemistry, WileyVCH, 2002.
III/5
2002.[3] G.J. Price, P.J. West, P.F. Smith, Control of polymer structure using
power ultrasound, Ultrasonic Sonochemistry 1 (1) (1994) 51–57.[4] K.S. Suslick, Ultrasound, its Chemical, Physical, and Biological
Effects, VCH Publishers Inc., New York, 1988.[5] T.J. Mason, Advances in sonochemistry, A Research Annual, vol. 2,
JAI Press Ltd., London, 1991.[6] D. Ensminger, Ultrasonics, Fundamentals, Technology, Applica-
tions, second ed., Marcel Dekker Inc., New York, 1988.[7] D. Kobayashi, H. Matsumoto, C. Kuroda, Effect of reactor’s
positions on polymerization and degradation in an ultrasonic field,Ultrasonics Sonochemistry, in press, doi:10.1016/j.ultsonch.2007.04.001.
[8] U.D. Harkal, P.R. Gogate, A.B. Pandit, M.A. Shenoy, Ultrasonicdegradation of poly(vinyl alcohol) in aqueous solution, UltrasonicsSonochemistry 13 (2006) 423–428.
[9] M. Vodenicarova, G. Drımalova, Z. Hromadkova, A. Malovıkova,A. Ebringerova, Xyloglucan degradation using different radiationsources: a comparative study, Ultrasonics Sonochemistry 13 (2006)157–164.
[10] Y. Li, J. Li, S. Guo, H. Li, Mechanochemical degradation kinetics ofhigh-density polyethylene melt and its mechanism in the presence ofultrasonic irradiation, Ultrasonics Sonochemistry 12 (2005) 183–189.
[11] M.T. Taghizadeh, A. Mehrdad, Calculation of the rate constant forthe ultrasonic degradation of aqueous solutions of polyvinyl alcoholby viscometry, Ultrasonics Sonochemistry 10 (2003) 309–313.
[12] S.P. Vijayalakshmi, G. Madras, Effect of initial molecular weight andsolvents on the ultrasonic degradation of poly(ethylene oxide),Polymer Degradation and Stability 90 (2005) 116–122.
[13] J. Li, S. Guo, X. Li, Degradation kinetics of polystyrene and EPDMmelts under ultrasonic irradiation, Polymer Degradation and Stability89 (2005) 6–14.
[14] R. Czechowska-Biskup, B. Rokita, S. Lotfy, P. Ulanski, J.M. Rosiak,Degradation of chitosan and starch by 360 kHz ultrasound, Carbo-hydrate Polymers 60 (2005) 175–184.
[15] N. Xiuyuan, H. Yuefang, L. Bailin, X. Xi, Mechanical degradationand mechanochemical copolymerization of hydroxyethyl cellulose,European Polymer Journal 37 (2001) 201–206.
[16] G. Madras, S. Chattopadhyay, Effect of solvent on the ultrasonicdegradation of poly(vinyl acetate), Polymer Degradation and Stabil-ity 71 (2001) 273–278.
[17] G. Madras, S. Kumar, S. Chattopadhyay, Continuous distributionkinetics for ultrasonic degradation of polymers, Polymer Degradationand Stability 69 (2000) 73–78.
[18] F. Kanwal, J.J. Liggat, R.A. Pethrick, Ultrasonic degradation ofpolystyrene solutions, Polymer Degradation and Stability 68 (2000)445–449.
[19] J.P. Lorimer, T.J. Mason, Some recent studies at Coventry UniversitySonochemistry Centre, Ultrasonics Sonochemistry 2 (1995) 79–86.
[20] A. Gronroos, P. Pirkonen, O. Ruppert, Ultrasonic depolymerizationof aqueous carboxymethylcellulose, Ultrasonic Sonochemistry 11(2004) 9–12.
[21] A. Gronroos, P. Pirkonen, J. Heikkinen, J. Ihalainen, H. Mursunen,H. Sekki, Ultrasonic depolymerization of aqueous polyvinyl alcohol,Ultrasonic Sonochemistry 8 (2001) 259–264.
[22] J.P. Lorimer, T.J. Mason, T.C. Cuthbert, E.A. Brookfield, The effectof ultrasound on the degradation of aqueous natural dextran,Ultrasonics Sonochemistry 2 (1995) 55–59.

Article IV
Ultrasound assisted method to increase soluble chemical oxygen demand (SCOD) of sewage sludge for digestion
In: Ultrasonics Sonochemistry. Vol. 12 (1–2), 2005, pp. 115–120.
Reprinted with permission from the publisher.

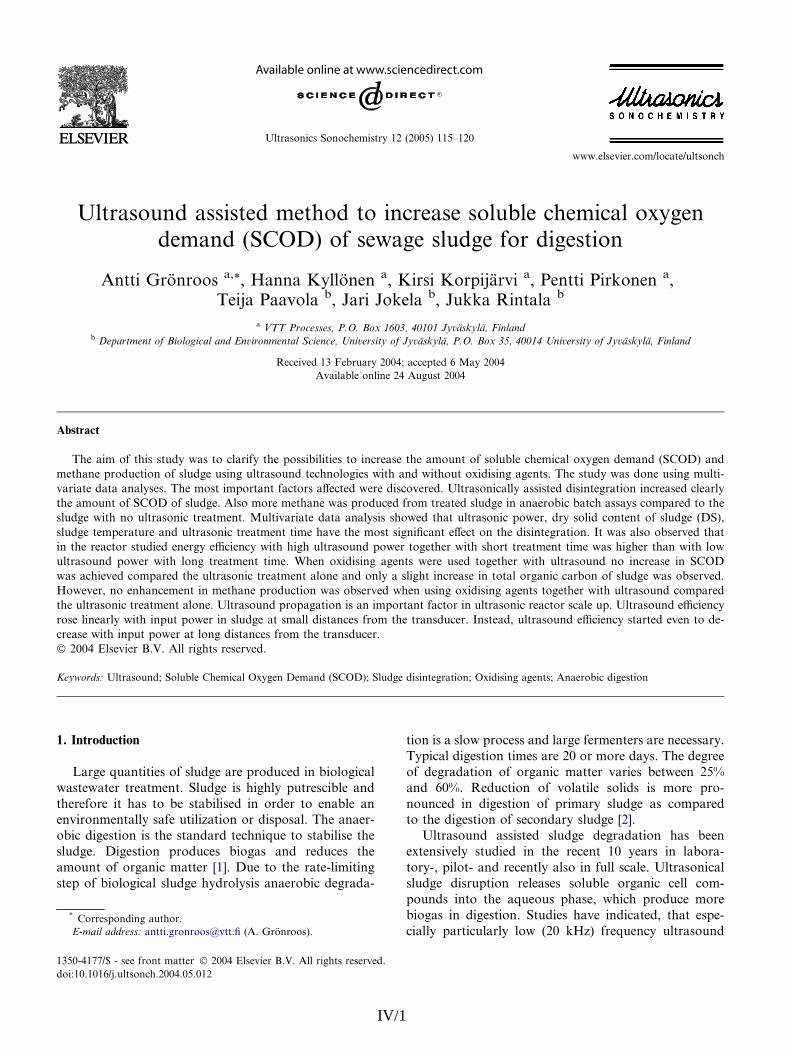
www.elsevier.com/locate/ultsonch
Ultrasonics Sonochemistry 12 (2005) 115–120
Ultrasound assisted method to increase soluble chemical oxygendemand (SCOD) of sewage sludge for digestion
Antti Gronroos a,*, Hanna Kyllonen a, Kirsi Korpijarvi a, Pentti Pirkonen a,Teija Paavola b, Jari Jokela b, Jukka Rintala b
a VTT Processes, P.O. Box 1603, 40101 Jyvaskyla, Finlandb Department of Biological and Environmental Science, University of Jyvaskyla, P.O. Box 35, 40014 University of Jyvaskyla, Finland
Received 13 February 2004; accepted 6 May 2004
Available online 24 August 2004
Abstract
The aim of this study was to clarify the possibilities to increase the amount of soluble chemical oxygen demand (SCOD) and
methane production of sludge using ultrasound technologies with and without oxidising agents. The study was done using multi-
variate data analyses. The most important factors affected were discovered. Ultrasonically assisted disintegration increased clearly
the amount of SCOD of sludge. Also more methane was produced from treated sludge in anaerobic batch assays compared to the
sludge with no ultrasonic treatment. Multivariate data analysis showed that ultrasonic power, dry solid content of sludge (DS),
sludge temperature and ultrasonic treatment time have the most significant effect on the disintegration. It was also observed that
in the reactor studied energy efficiency with high ultrasound power together with short treatment time was higher than with low
ultrasound power with long treatment time. When oxidising agents were used together with ultrasound no increase in SCOD
was achieved compared the ultrasonic treatment alone and only a slight increase in total organic carbon of sludge was observed.
However, no enhancement in methane production was observed when using oxidising agents together with ultrasound compared
the ultrasonic treatment alone. Ultrasound propagation is an important factor in ultrasonic reactor scale up. Ultrasound efficiency
rose linearly with input power in sludge at small distances from the transducer. Instead, ultrasound efficiency started even to de-
crease with input power at long distances from the transducer.
� 2004 Elsevier B.V. All rights reserved.
Keywords: Ultrasound; Soluble Chemical Oxygen Demand (SCOD); Sludge disintegration; Oxidising agents; Anaerobic digestion
1. Introduction
Large quantities of sludge are produced in biological
wastewater treatment. Sludge is highly putrescible and
therefore it has to be stabilised in order to enable anenvironmentally safe utilization or disposal. The anaer-
obic digestion is the standard technique to stabilise the
sludge. Digestion produces biogas and reduces the
amount of organic matter [1]. Due to the rate-limiting
step of biological sludge hydrolysis anaerobic degrada-
1350-4177/$ - see front matter � 2004 Elsevier B.V. All rights reserved.
doi:10.1016/j.ultsonch.2004.05.012
* Corresponding author.
E-mail address: [email protected] (A. Gronroos).
IV/1
tion is a slow process and large fermenters are necessary.
Typical digestion times are 20 or more days. The degree
of degradation of organic matter varies between 25%
and 60%. Reduction of volatile solids is more pro-
nounced in digestion of primary sludge as comparedto the digestion of secondary sludge [2].
Ultrasound assisted sludge degradation has been
extensively studied in the recent 10 years in labora-
tory-, pilot- and recently also in full scale. Ultrasonical
sludge disruption releases soluble organic cell com-
pounds into the aqueous phase, which produce more
biogas in digestion. Studies have indicated, that espe-
cially particularly low (20 kHz) frequency ultrasound
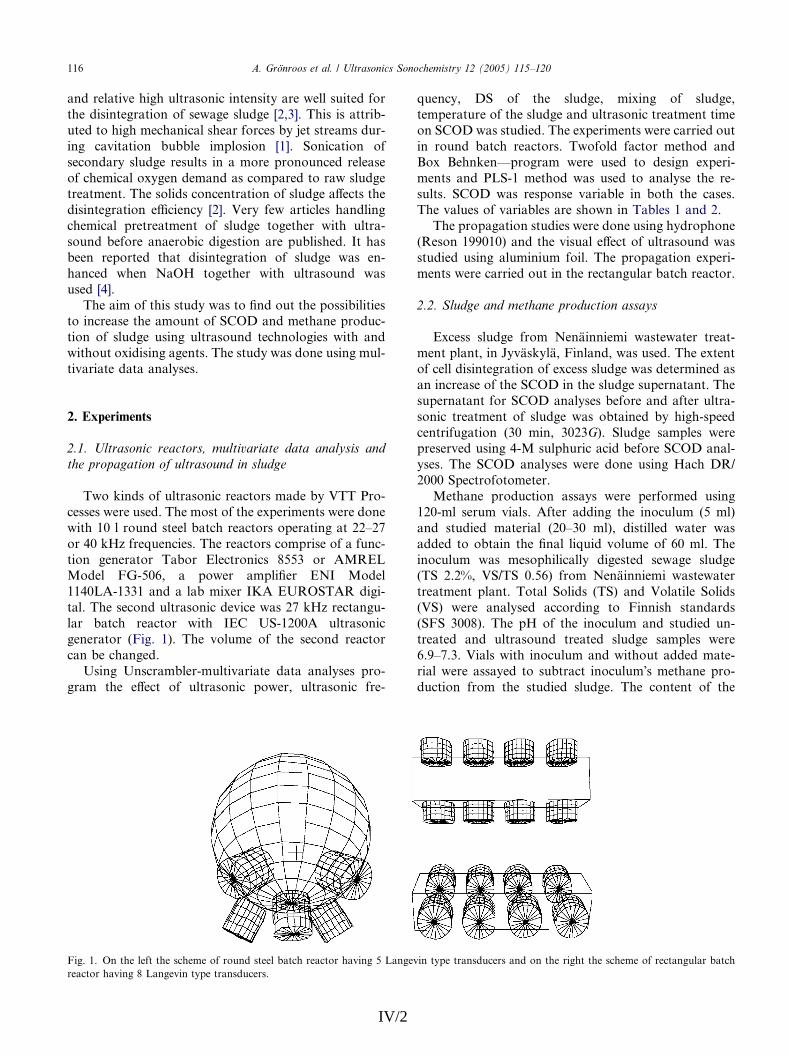
116 A. Gronroos et al. / Ultrasonics Sonochemistry 12 (2005) 115–120
and relative high ultrasonic intensity are well suited for
the disintegration of sewage sludge [2,3]. This is attrib-
uted to high mechanical shear forces by jet streams dur-
ing cavitation bubble implosion [1]. Sonication of
secondary sludge results in a more pronounced release
of chemical oxygen demand as compared to raw sludgetreatment. The solids concentration of sludge affects the
disintegration efficiency [2]. Very few articles handling
chemical pretreatment of sludge together with ultra-
sound before anaerobic digestion are published. It has
been reported that disintegration of sludge was en-
hanced when NaOH together with ultrasound was
used [4].
The aim of this study was to find out the possibilitiesto increase the amount of SCOD and methane produc-
tion of sludge using ultrasound technologies with and
without oxidising agents. The study was done using mul-
tivariate data analyses.
2. Experiments
2.1. Ultrasonic reactors, multivariate data analysis and
the propagation of ultrasound in sludge
Two kinds of ultrasonic reactors made by VTT Pro-
cesses were used. The most of the experiments were done
with 10 l round steel batch reactors operating at 22–27
or 40 kHz frequencies. The reactors comprise of a func-
tion generator Tabor Electronics 8553 or AMRELModel FG-506, a power amplifier ENI Model
1140LA-1331 and a lab mixer IKA EUROSTAR digi-
tal. The second ultrasonic device was 27 kHz rectangu-
lar batch reactor with IEC US-1200A ultrasonic
generator (Fig. 1). The volume of the second reactor
can be changed.
Using Unscrambler-multivariate data analyses pro-
gram the effect of ultrasonic power, ultrasonic fre-
Fig. 1. On the left the scheme of round steel batch reactor having 5 Langev
reactor having 8 Langevin type transducers.
IV/2
quency, DS of the sludge, mixing of sludge,
temperature of the sludge and ultrasonic treatment time
on SCOD was studied. The experiments were carried out
in round batch reactors. Twofold factor method and
Box Behnken––program were used to design experi-
ments and PLS-1 method was used to analyse the re-sults. SCOD was response variable in both the cases.
The values of variables are shown in Tables 1 and 2.
The propagation studies were done using hydrophone
(Reson 199010) and the visual effect of ultrasound was
studied using aluminium foil. The propagation experi-
ments were carried out in the rectangular batch reactor.
2.2. Sludge and methane production assays
Excess sludge from Nenainniemi wastewater treat-
ment plant, in Jyvaskyla, Finland, was used. The extent
of cell disintegration of excess sludge was determined as
an increase of the SCOD in the sludge supernatant. The
supernatant for SCOD analyses before and after ultra-
sonic treatment of sludge was obtained by high-speed
centrifugation (30 min, 3023G). Sludge samples werepreserved using 4-M sulphuric acid before SCOD anal-
yses. The SCOD analyses were done using Hach DR/
2000 Spectrofotometer.
Methane production assays were performed using
120-ml serum vials. After adding the inoculum (5 ml)
and studied material (20–30 ml), distilled water was
added to obtain the final liquid volume of 60 ml. The
inoculum was mesophilically digested sewage sludge(TS 2.2%, VS/TS 0.56) from Nenainniemi wastewater
treatment plant. Total Solids (TS) and Volatile Solids
(VS) were analysed according to Finnish standards
(SFS 3008). The pH of the inoculum and studied un-
treated and ultrasound treated sludge samples were
6.9–7.3. Vials with inoculum and without added mate-
rial were assayed to subtract inoculum�s methane pro-
duction from the studied sludge. The content of the
in type transducers and on the right the scheme of rectangular batch
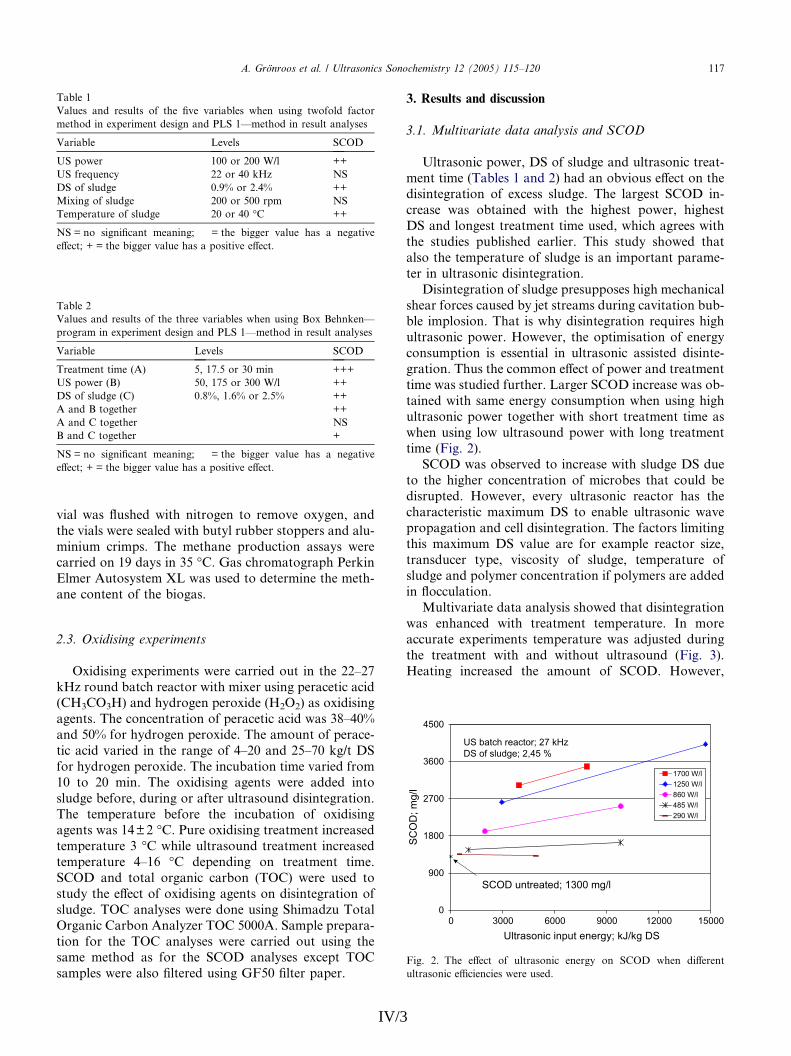
Table 2
Values and results of the three variables when using Box Behnken––
program in experiment design and PLS 1––method in result analyses
Variable Levels SCOD
Treatment time (A) 5, 17.5 or 30 min +++
US power (B) 50, 175 or 300 W/l ++
DS of sludge (C) 0.8%, 1.6% or 2.5% ++
A and B together ++
A and C together NS
B and C together +
NS = no significant meaning; � = the bigger value has a negative
effect; + = the bigger value has a positive effect.
Table 1
Values and results of the five variables when using twofold factor
method in experiment design and PLS 1––method in result analyses
Variable Levels SCOD
US power 100 or 200 W/l ++
US frequency 22 or 40 kHz NS
DS of sludge 0.9% or 2.4% ++
Mixing of sludge 200 or 500 rpm NS
Temperature of sludge 20 or 40 �C ++
NS = no significant meaning; � = the bigger value has a negative
effect; + = the bigger value has a positive effect.
A. Gronroos et al. / Ultrasonics Sonochemistry 12 (2005) 115–120 117
vial was flushed with nitrogen to remove oxygen, and
the vials were sealed with butyl rubber stoppers and alu-
minium crimps. The methane production assays werecarried on 19 days in 35 �C. Gas chromatograph Perkin
Elmer Autosystem XL was used to determine the meth-
ane content of the biogas.
0
900
1800
2700
3600
4500
0 3000 6000 9000 12000 15000Ultrasonic input energy; kJ/kg DS
CSO
D;
gm
/l
1700 W/l1250 W/l860 W/l485 W/l290 W/l
US batch reactor; 27 kHzDS of sludge; 2,45 %
SCOD untreated; 1300 mg/l
Fig. 2. The effect of ultrasonic energy on SCOD when different
ultrasonic efficiencies were used.
2.3. Oxidising experiments
Oxidising experiments were carried out in the 22–27
kHz round batch reactor with mixer using peracetic acid(CH3CO3H) and hydrogen peroxide (H2O2) as oxidising
agents. The concentration of peracetic acid was 38–40%
and 50% for hydrogen peroxide. The amount of perace-
tic acid varied in the range of 4–20 and 25–70 kg/t DS
for hydrogen peroxide. The incubation time varied from
10 to 20 min. The oxidising agents were added into
sludge before, during or after ultrasound disintegration.
The temperature before the incubation of oxidisingagents was 14±2 �C. Pure oxidising treatment increased
temperature 3 �C while ultrasound treatment increased
temperature 4–16 �C depending on treatment time.
SCOD and total organic carbon (TOC) were used to
study the effect of oxidising agents on disintegration of
sludge. TOC analyses were done using Shimadzu Total
Organic Carbon Analyzer TOC 5000A. Sample prepara-
tion for the TOC analyses were carried out using thesame method as for the SCOD analyses except TOC
samples were also filtered using GF50 filter paper.
IV/3
3. Results and discussion
3.1. Multivariate data analysis and SCOD
Ultrasonic power, DS of sludge and ultrasonic treat-
ment time (Tables 1 and 2) had an obvious effect on thedisintegration of excess sludge. The largest SCOD in-
crease was obtained with the highest power, highest
DS and longest treatment time used, which agrees with
the studies published earlier. This study showed that
also the temperature of sludge is an important parame-
ter in ultrasonic disintegration.
Disintegration of sludge presupposes high mechanical
shear forces caused by jet streams during cavitation bub-ble implosion. That is why disintegration requires high
ultrasonic power. However, the optimisation of energy
consumption is essential in ultrasonic assisted disinte-
gration. Thus the common effect of power and treatment
time was studied further. Larger SCOD increase was ob-
tained with same energy consumption when using high
ultrasonic power together with short treatment time as
when using low ultrasound power with long treatmenttime (Fig. 2).
SCOD was observed to increase with sludge DS due
to the higher concentration of microbes that could be
disrupted. However, every ultrasonic reactor has the
characteristic maximum DS to enable ultrasonic wave
propagation and cell disintegration. The factors limiting
this maximum DS value are for example reactor size,
transducer type, viscosity of sludge, temperature ofsludge and polymer concentration if polymers are added
in flocculation.
Multivariate data analysis showed that disintegration
was enhanced with treatment temperature. In more
accurate experiments temperature was adjusted during
the treatment with and without ultrasound (Fig. 3).
Heating increased the amount of SCOD. However,
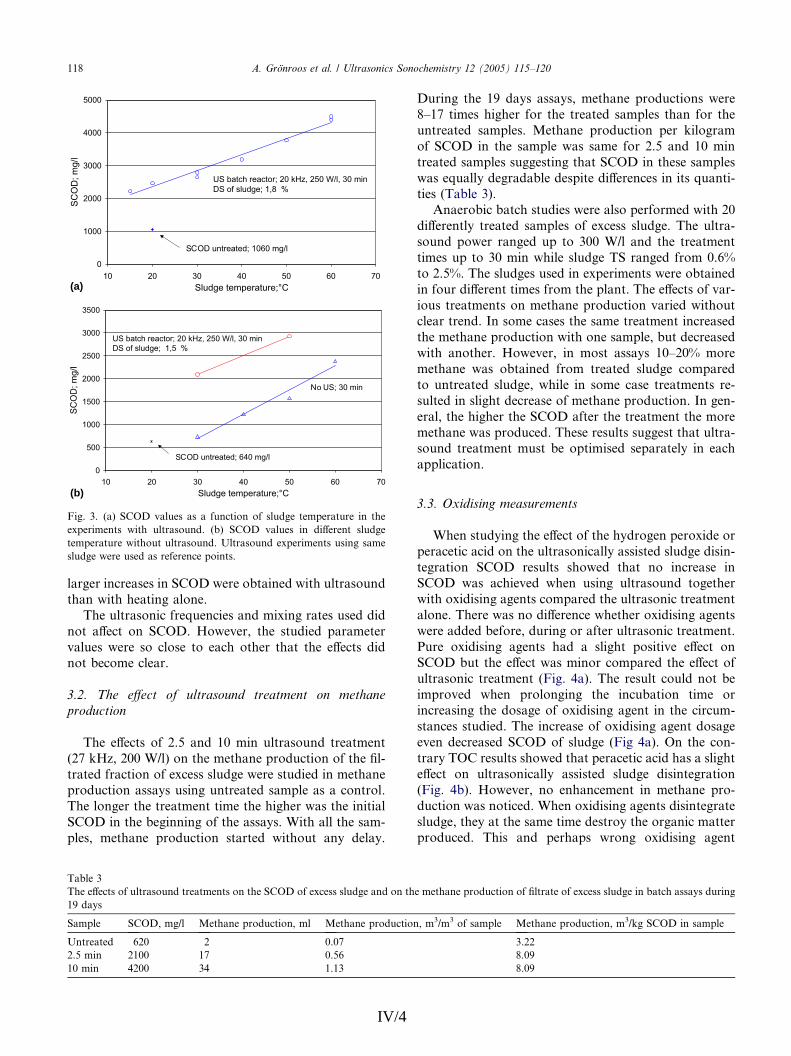
0
1000
2000
3000
4000
5000
10 20 30 40 50 60 70Sludge temperature;°C
CSO
D;
gm
/l
US batch reactor; 20 kHz, 250 W/l, 30 min DS of sludge; 1,8 %
SCOD untreated; 1060 mg/l
0
500
1000
1500
2000
2500
3000
3500
10 20 30 40 50 60 70Sludge temperature;°C
CSO
D;
gm
/l
US batch reactor; 20 kHz, 250 W/l, 30 minDS of sludge; 1,5 %
No US; 30 min
SCOD untreated; 640 mg/l
(a)
(b)
Fig. 3. (a) SCOD values as a function of sludge temperature in the
experiments with ultrasound. (b) SCOD values in different sludge
temperature without ultrasound. Ultrasound experiments using same
sludge were used as reference points.
118 A. Gronroos et al. / Ultrasonics Sonochemistry 12 (2005) 115–120
larger increases in SCOD were obtained with ultrasound
than with heating alone.
The ultrasonic frequencies and mixing rates used did
not affect on SCOD. However, the studied parameter
values were so close to each other that the effects didnot become clear.
3.2. The effect of ultrasound treatment on methane
production
The effects of 2.5 and 10 min ultrasound treatment
(27 kHz, 200 W/l) on the methane production of the fil-
trated fraction of excess sludge were studied in methaneproduction assays using untreated sample as a control.
The longer the treatment time the higher was the initial
SCOD in the beginning of the assays. With all the sam-
ples, methane production started without any delay.
Table 3
The effects of ultrasound treatments on the SCOD of excess sludge and on th
19 days
Sample SCOD, mg/l Methane production, ml Methane production
Untreated 620 2 0.07
2.5 min 2100 17 0.56
10 min 4200 34 1.13
IV/4
During the 19 days assays, methane productions were
8–17 times higher for the treated samples than for the
untreated samples. Methane production per kilogram
of SCOD in the sample was same for 2.5 and 10 min
treated samples suggesting that SCOD in these samples
was equally degradable despite differences in its quanti-ties (Table 3).
Anaerobic batch studies were also performed with 20
differently treated samples of excess sludge. The ultra-
sound power ranged up to 300 W/l and the treatment
times up to 30 min while sludge TS ranged from 0.6%
to 2.5%. The sludges used in experiments were obtained
in four different times from the plant. The effects of var-
ious treatments on methane production varied withoutclear trend. In some cases the same treatment increased
the methane production with one sample, but decreased
with another. However, in most assays 10–20% more
methane was obtained from treated sludge compared
to untreated sludge, while in some case treatments re-
sulted in slight decrease of methane production. In gen-
eral, the higher the SCOD after the treatment the more
methane was produced. These results suggest that ultra-sound treatment must be optimised separately in each
application.
3.3. Oxidising measurements
When studying the effect of the hydrogen peroxide or
peracetic acid on the ultrasonically assisted sludge disin-
tegration SCOD results showed that no increase inSCOD was achieved when using ultrasound together
with oxidising agents compared the ultrasonic treatment
alone. There was no difference whether oxidising agents
were added before, during or after ultrasonic treatment.
Pure oxidising agents had a slight positive effect on
SCOD but the effect was minor compared the effect of
ultrasonic treatment (Fig. 4a). The result could not be
improved when prolonging the incubation time orincreasing the dosage of oxidising agent in the circum-
stances studied. The increase of oxidising agent dosage
even decreased SCOD of sludge (Fig 4a). On the con-
trary TOC results showed that peracetic acid has a slight
effect on ultrasonically assisted sludge disintegration
(Fig. 4b). However, no enhancement in methane pro-
duction was noticed. When oxidising agents disintegrate
sludge, they at the same time destroy the organic matterproduced. This and perhaps wrong oxidising agent
e methane production of filtrate of excess sludge in batch assays during
, m3/m3 of sample Methane production, m3/kg SCOD in sample
3.22
8.09
8.09
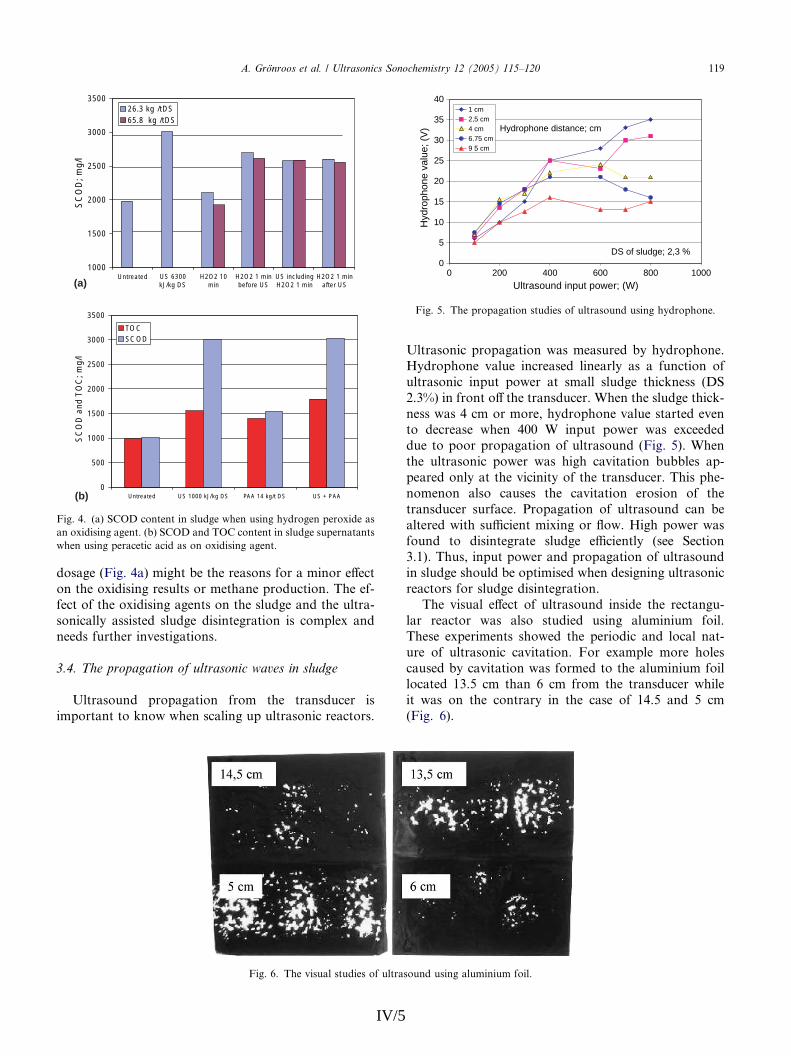
1000
1500
2000
2500
3000
3500
Untreated US 6300kJ/kg DS
H2O2 10min
H2O2 1 minbefore US
US includingH2O2 1 min
H2O2 1 minafter US
CS
OD
;g
m /l
26.3 kg /t DS65.8 kg /t DS
0
500
1000
1500
2000
2500
3000
3500
Untreated US 1000 kJ/kg DS PAA 14 kg/t DS US + PAA
CS
OD
a nd
OT
C;
gm
/l
TOCSCOD
(a)
(b)
Fig. 4. (a) SCOD content in sludge when using hydrogen peroxide as
an oxidising agent. (b) SCOD and TOC content in sludge supernatants
when using peracetic acid as on oxidising agent.
0
5
10
15
20
25
30
35
40
0 200 400 600 800 1000
Ultrasound input power; (W)
Hyd
rpoh
av enol
eu;
V( )
1 cm2,5 cm4 cm6.75 cm9 .5 cm
DS of sludge; 2,3 %
Hydrophone distance; cm
Fig. 5. The propagation studies of ultrasound using hydrophone.
A. Gronroos et al. / Ultrasonics Sonochemistry 12 (2005) 115–120 119
dosage (Fig. 4a) might be the reasons for a minor effect
on the oxidising results or methane production. The ef-
fect of the oxidising agents on the sludge and the ultra-
sonically assisted sludge disintegration is complex andneeds further investigations.
3.4. The propagation of ultrasonic waves in sludge
Ultrasound propagation from the transducer is
important to know when scaling up ultrasonic reactors.
Fig. 6. The visual studies of ultra
IV/5
Ultrasonic propagation was measured by hydrophone.
Hydrophone value increased linearly as a function of
ultrasonic input power at small sludge thickness (DS
2.3%) in front off the transducer. When the sludge thick-
ness was 4 cm or more, hydrophone value started evento decrease when 400 W input power was exceeded
due to poor propagation of ultrasound (Fig. 5). When
the ultrasonic power was high cavitation bubbles ap-
peared only at the vicinity of the transducer. This phe-
nomenon also causes the cavitation erosion of the
transducer surface. Propagation of ultrasound can be
altered with sufficient mixing or flow. High power was
found to disintegrate sludge efficiently (see Section3.1). Thus, input power and propagation of ultrasound
in sludge should be optimised when designing ultrasonic
reactors for sludge disintegration.
The visual effect of ultrasound inside the rectangu-
lar reactor was also studied using aluminium foil.
These experiments showed the periodic and local nat-
ure of ultrasonic cavitation. For example more holes
caused by cavitation was formed to the aluminium foillocated 13.5 cm than 6 cm from the transducer while
it was on the contrary in the case of 14.5 and 5 cm
(Fig. 6).
sound using aluminium foil.
120 A. Gronroos et al. / Ultrasonics Sonochemistry 12 (2005) 115–120
4. Conclusions
Ultrasonic disintegration of sludge increased the
amount of SCOD and methane production. The multi-
variate data analysis showed that ultrasonic power, DS
of sludge, sludge temperature and ultrasonic treatmenttime affect significantly on the sludge disintegration. It
was also observed that high ultrasound power together
with short treatment time is more efficient than low
ultrasound power with long treatment time. When using
oxidising agents together with ultrasonic disintegration
there was no increase in SCOD and only a slight in-
crease in TOC compared the ultrasonic treatment alone.
However when using oxidising agents together withultrasound, no enhancement in methane production
was observed. Ultrasound propagation is an important
factor in ultrasonic reactor scale up. Ultrasound effi-
ciency rose linearly with input power in sludge at small
distances from the transducer. Instead, ultrasound effi-
ciency started even to decrease with input power at long
distances from the transducer.
IV/6
Acknowledgment
The authors thank TEKES, the National Technology
Agency of Finland, companies and VTT Processes for
their financial support.
References
[1] U. Neis, K. Nickel, A. Tiehm, in: T.J. Mason, A. Tiehm (Eds.),
Ultrasound in Environmental Protection, vol. 6, Jai Press Inc.,
2001, pp. 59–90.
[2] K. Nickel, in: A. Tiehm, U. Neis (Eds.), Ultrasound in Environ-
mental Engineering, TUHH Reports on Sanitary Engineering, vol.
25, 1999, pp. 217–232.
[3] G. Lehne, J. Muller, in: A. Tiehm, U. Neis (Eds.), Ultrasound in
Environmental Engineering, TUHH Reports on Sanitary Engi-
neering, vol. 25, 1999, pp. 205–216.
[4] Y.-C. Chiu, C.-N. Chang, J.-G. Lin, S.-J. Huang, Water Sci. Tech.
11 (1997) 155–16211 155–162.

Article V
Ultrasonically aided mineral processing technique for remediation of soil contaminated by heavy metals
In: Ultrasonics Sonochemistry. Vol. 11 (3–4), 2004, pp. 211–216.
Reprinted with permission from the publisher.

ry 11 (2004) 211–216
Ultrasonics SonochemistUltrasonically aided mineral processing technique for remediation
www.elsevier.com/locate/ultsonch
of soil contaminated by heavy metals
Hanna Kyll€onen a, Pentti Pirkonen a,*, V€ain€o Hintikka b, Pekka Parvinen b,Antti Gr€onroos a, Hannu Sekki a
a VTT Processes, P.O. Box 1603, 40101 Jyv€askyl€a, Finlandb VTT Processes, P.O. Box 1605, 83501 Outokumpu, Finland
Abstract
In this study, power ultrasound was used as aiding method for the mineral processing technique, which have recently been
developed for the remediation of soil contaminated by heavy metal containing bullets, their broken parts and alteration products.
Power ultrasound was used to disperse the soil to remove metals and metal compounds from soil particle surfaces instead of attrition
conditioning. The soil diluted with water was treated using 22 kHz ultrasound power of 100 W up to 500 W. The effect of different
ultrasonic treatment time and pulsation of ultrasound were studied on the purity of sink and float fractions in heavy medium
separation process, screen fractions, and mineral concentrates and tailings from flotation process. Ultrasound enhanced the
remediation of soil fractions in all the studied cases. Optimisation of the ultrasonic power will be done in the continuation study.
� 2004 Elsevier B.V. All rights reserved.
Keywords: Ultrasound; Remediation; Soil; Heavy metals; Mineral processing
1. Background ultrasound has been used as aiding technique. Thevibrating tray (Advanced Sonic Processing Systems,
2. Experimental
Separation techniques used in mining industry, such
as screening, heavy medium separation and flotation,
have recently been successfully applied in the remedia-
tion of soils contaminated by heavy metal like bullets,
their broken parts and alteration products [3–5]. Soil
remediation using mineral processing methods aided by
power ultrasound is a novel method, where the effects ofpower ultrasound were used to further improve the
operation of these mineral processing techniques. The
ultrasound was used instead of attrition conditioning, it
was expected to produce less fine material than the
traditional methods. The power ultrasonic effects are
based mainly on liquid cavitation, which creates ex-
tremely strong liquid jets against particle surfaces [6].
There are some studies where power ultrasound is suc-cessfully used for cleaning of different particle surfaces
from organic or inorganic matter [1,2,7–10]. There is
also one commercial remediation technique, where
*
Corresponding author.E-mail address: [email protected] (P. Pirkonen).
URL: http://www.vtt.fi.
1350-4177/$ - see front matter � 2004 Elsevier B.V. All rights reserved.
doi:10.1016/j.ultsonch.2004.01.024
V/1
USA) using 20 kHz magnetostrictive transducers
resembles most the technique under developing. The aim
is to clean particle surfaces, like ore, ash or soil, from
agents in order to make the sludge more reactive for
chemicals.
In the technique studied power ultrasound was
mainly used to aid removing metals and metal com-pounds from soil particle surfaces. The aim was to de-
crease the heavy metal content of remediated soil under
limit values for problem waste (Table 1) using the new
remediation process. So the remediated soil could be left
to their original place. The remediation process is more
competitive without transportation of large amounts of
material.
The soil examined was brought from former military
shooting range. The coarsest material (+20 mm), which
did not contain bullets or their parts, was screened out
before ultrasonic treatment experiments. The other
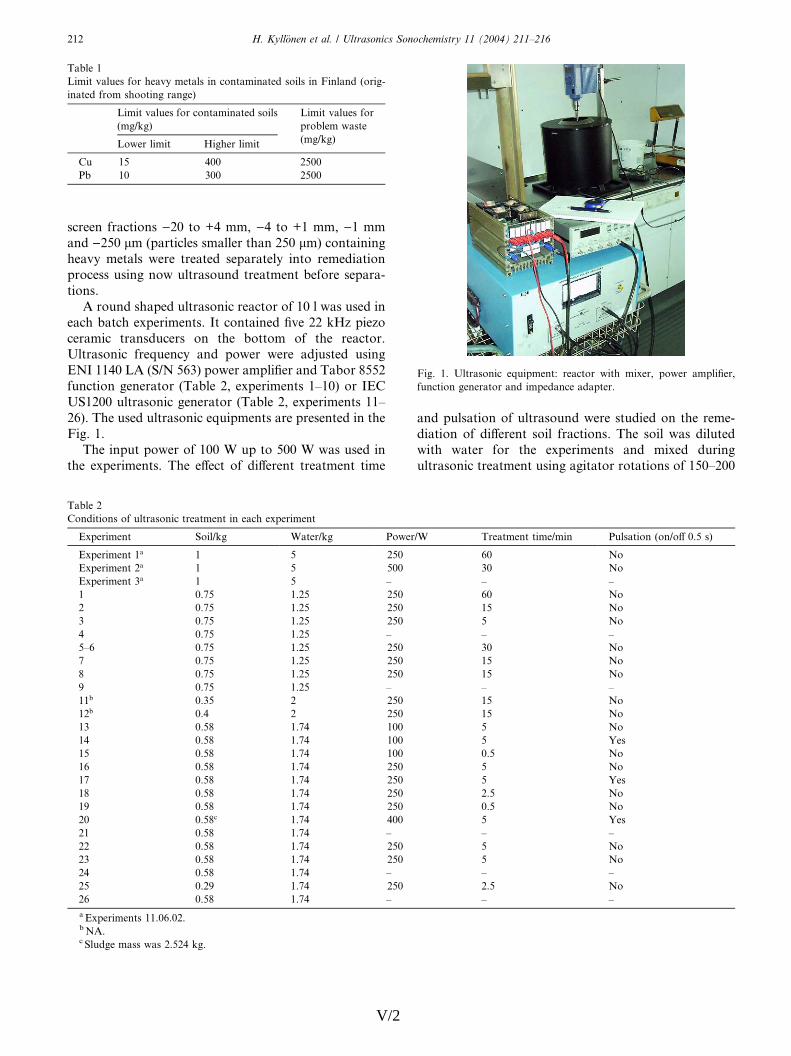
screen fractions )20 to +4 mm, )4 to +1 mm, )1 mm
and pulsation of ultrasound were studied on the reme-
Fig. 1. Ultrasonic equipment: reactor with mixer, power amplifier,
function generator and impedance adapter.
Table 1
Limit values for heavy metals in contaminated soils in Finland (orig-
inated from shooting range)
Limit values for contaminated soils
(mg/kg)
Limit values for
problem waste
(mg/kg)Lower limit Higher limit
Cu 15 400 2500
Pb 10 300 2500
212 H. Kyll€onen et al. / Ultrasonics Sonochemistry 11 (2004) 211–216
and )250 lm (particles smaller than 250 lm) containing
heavy metals were treated separately into remediation
process using now ultrasound treatment before separa-
tions.
A round shaped ultrasonic reactor of 10 l was used in
each batch experiments. It contained five 22 kHz piezo
ceramic transducers on the bottom of the reactor.Ultrasonic frequency and power were adjusted using
ENI 1140 LA (S/N 563) power amplifier and Tabor 8552
function generator (Table 2, experiments 1–10) or IEC
US1200 ultrasonic generator (Table 2, experiments 11–
26). The used ultrasonic equipments are presented in the
Fig. 1.
The input power of 100 W up to 500 W was used in
the experiments. The effect of different treatment time
Table 2
Conditions of ultrasonic treatment in each experiment
Experiment Soil/kg Water/kg Power
Experiment 1a 1 5 250
Experiment 2a 1 5 500
Experiment 3a 1 5 –
1 0.75 1.25 250
2 0.75 1.25 250
3 0.75 1.25 250
4 0.75 1.25 –
5–6 0.75 1.25 250
7 0.75 1.25 250
8 0.75 1.25 250
9 0.75 1.25 –
11b 0.35 2 250
12b 0.4 2 250
13 0.58 1.74 100
14 0.58 1.74 100
15 0.58 1.74 100
16 0.58 1.74 250
17 0.58 1.74 250
18 0.58 1.74 250
19 0.58 1.74 250
20 0.58c 1.74 400
21 0.58 1.74 –
22 0.58 1.74 250
23 0.58 1.74 250
24 0.58 1.74 –
25 0.29 1.74 250
26 0.58 1.74 –
a Experiments 11.06.02.b NA.c Sludge mass was 2.524 kg.
V/2
diation of different soil fractions. The soil was diluted
with water for the experiments and mixed during
ultrasonic treatment using agitator rotations of 150–200
/W Treatment time/min Pulsation (on/off 0.5 s)
60 No
30 No
– –
60 No
15 No
5 No
– –
30 No
15 No
15 No
– –
15 No
15 No
5 No
5 Yes
0.5 No
5 No
5 Yes
2.5 No
0.5 No
5 Yes
– –
5 No
5 No
– –
2.5 No
– –
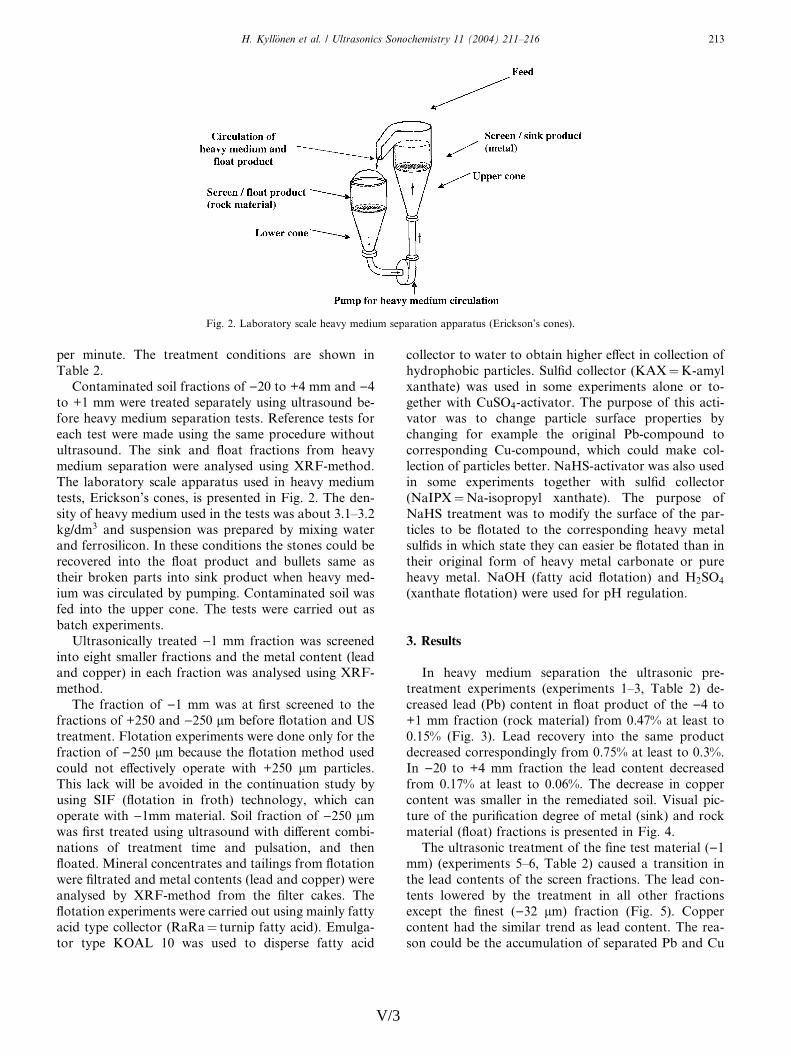
per minute. The treatment conditions are shown in collector to water to obtain higher effect in collection of
3. Results
Fig. 2. Laboratory scale heavy medium separation apparatus (Erickson’s cones).
H. Kyll€onen et al. / Ultrasonics Sonochemistry 11 (2004) 211–216 213
Table 2.
Contaminated soil fractions of )20 to +4 mm and )4
to +1 mm were treated separately using ultrasound be-fore heavy medium separation tests. Reference tests for
each test were made using the same procedure without
ultrasound. The sink and float fractions from heavy
medium separation were analysed using XRF-method.
The laboratory scale apparatus used in heavy medium
tests, Erickson’s cones, is presented in Fig. 2. The den-
sity of heavy medium used in the tests was about 3.1–3.2
kg/dm3 and suspension was prepared by mixing waterand ferrosilicon. In these conditions the stones could be
recovered into the float product and bullets same as
their broken parts into sink product when heavy med-
ium was circulated by pumping. Contaminated soil was
fed into the upper cone. The tests were carried out as
batch experiments.
Ultrasonically treated )1 mm fraction was screened
into eight smaller fractions and the metal content (leadand copper) in each fraction was analysed using XRF-
method.
The fraction of )1 mm was at first screened to the
fractions of +250 and )250 lm before flotation and US
treatment. Flotation experiments were done only for the
fraction of )250 lm because the flotation method used
could not effectively operate with +250 lm particles.
This lack will be avoided in the continuation study byusing SIF (flotation in froth) technology, which can
operate with )1mm material. Soil fraction of )250 lm
was first treated using ultrasound with different combi-
nations of treatment time and pulsation, and then
floated. Mineral concentrates and tailings from flotation
were filtrated and metal contents (lead and copper) were
analysed by XRF-method from the filter cakes. The
flotation experiments were carried out using mainly fattyacid type collector (RaRa¼ turnip fatty acid). Emulga-
tor type KOAL 10 was used to disperse fatty acid
V/3
hydrophobic particles. Sulfid collector (KAX¼K-amyl
xanthate) was used in some experiments alone or to-
gether with CuSO4-activator. The purpose of this acti-vator was to change particle surface properties by
changing for example the original Pb-compound to
corresponding Cu-compound, which could make col-
lection of particles better. NaHS-activator was also used
in some experiments together with sulfid collector
(NaIPX¼Na-isopropyl xanthate). The purpose of
NaHS treatment was to modify the surface of the par-
ticles to be flotated to the corresponding heavy metalsulfids in which state they can easier be flotated than in
their original form of heavy metal carbonate or pure
heavy metal. NaOH (fatty acid flotation) and H2SO4
(xanthate flotation) were used for pH regulation.
In heavy medium separation the ultrasonic pre-
treatment experiments (experiments 1–3, Table 2) de-
creased lead (Pb) content in float product of the )4 to
+1 mm fraction (rock material) from 0.47% at least to
0.15% (Fig. 3). Lead recovery into the same product
decreased correspondingly from 0.75% at least to 0.3%.
In )20 to +4 mm fraction the lead content decreased
from 0.17% at least to 0.06%. The decrease in coppercontent was smaller in the remediated soil. Visual pic-
ture of the purification degree of metal (sink) and rock
material (float) fractions is presented in Fig. 4.
The ultrasonic treatment of the fine test material ()1
mm) (experiments 5–6, Table 2) caused a transition in
the lead contents of the screen fractions. The lead con-
tents lowered by the treatment in all other fractions
except the finest ()32 lm) fraction (Fig. 5). Coppercontent had the similar trend as lead content. The rea-
son could be the accumulation of separated Pb and Cu
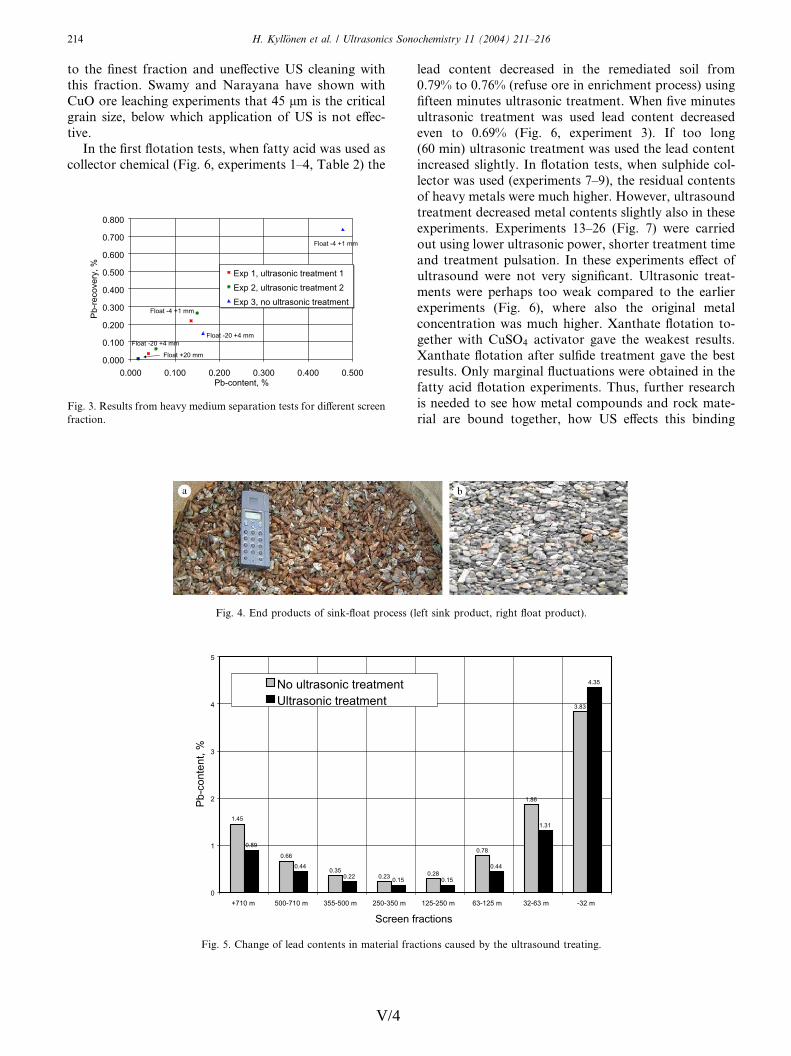
to the finest fraction and uneffective US cleaning with lead content decreased in the remediated soil from
214 H. Kyll€onen et al. / Ultrasonics Sonochemistry 11 (2004) 211–216
this fraction. Swamy and Narayana have shown with
CuO ore leaching experiments that 45 lm is the critical
grain size, below which application of US is not effec-
tive.In the first flotation tests, when fatty acid was used as
collector chemical (Fig. 6, experiments 1–4, Table 2) the
0.000
0.100
0.200
0.300
0.400
0.500
0.600
0.700
0.800
0.000 0.100 0.200 0.300 0.400 0.500Pb-content, %
Pb-re
cove
ry, % Exp 1, ultrasonic treatment 1
Exp 2, ultrasonic treatment 2Exp 3, no ultrasonic treatment
Float +20 mm
Float -20 +4 mm
Float -4 +1 mm
Float -4 +1 mm
Float -20 +4 mm
Fig. 3. Results from heavy medium separation tests for different screen
fraction.
Fig. 4. End products of sink-float process (l
1.45
0.66
0.350.23
0.89
0.440.22 0.15
0
1
2
3
4
5
+710 m 500-710 m 355-500 m 250-350 m
Screen f
Pb-c
onte
nt, %
No ultrasonic treatmentUltrasonic treatment
Fig. 5. Change of lead contents in material fra
V/4
0.79% to 0.76% (refuse ore in enrichment process) using
fifteen minutes ultrasonic treatment. When five minutes
ultrasonic treatment was used lead content decreased
even to 0.69% (Fig. 6, experiment 3). If too long(60 min) ultrasonic treatment was used the lead content
increased slightly. In flotation tests, when sulphide col-
lector was used (experiments 7–9), the residual contents
of heavy metals were much higher. However, ultrasound
treatment decreased metal contents slightly also in these
experiments. Experiments 13–26 (Fig. 7) were carried
out using lower ultrasonic power, shorter treatment time
and treatment pulsation. In these experiments effect ofultrasound were not very significant. Ultrasonic treat-
ments were perhaps too weak compared to the earlier
experiments (Fig. 6), where also the original metal
concentration was much higher. Xanthate flotation to-
gether with CuSO4 activator gave the weakest results.
Xanthate flotation after sulfide treatment gave the best
results. Only marginal fluctuations were obtained in the
fatty acid flotation experiments. Thus, further researchis needed to see how metal compounds and rock mate-
rial are bound together, how US effects this binding
eft sink product, right float product).
0.28
0.78
1.86
3.83
0.15
0.44
1.31
4.35
125-250 m 63-125 m 32-63 m -32 m
ractions
ctions caused by the ultrasound treating.
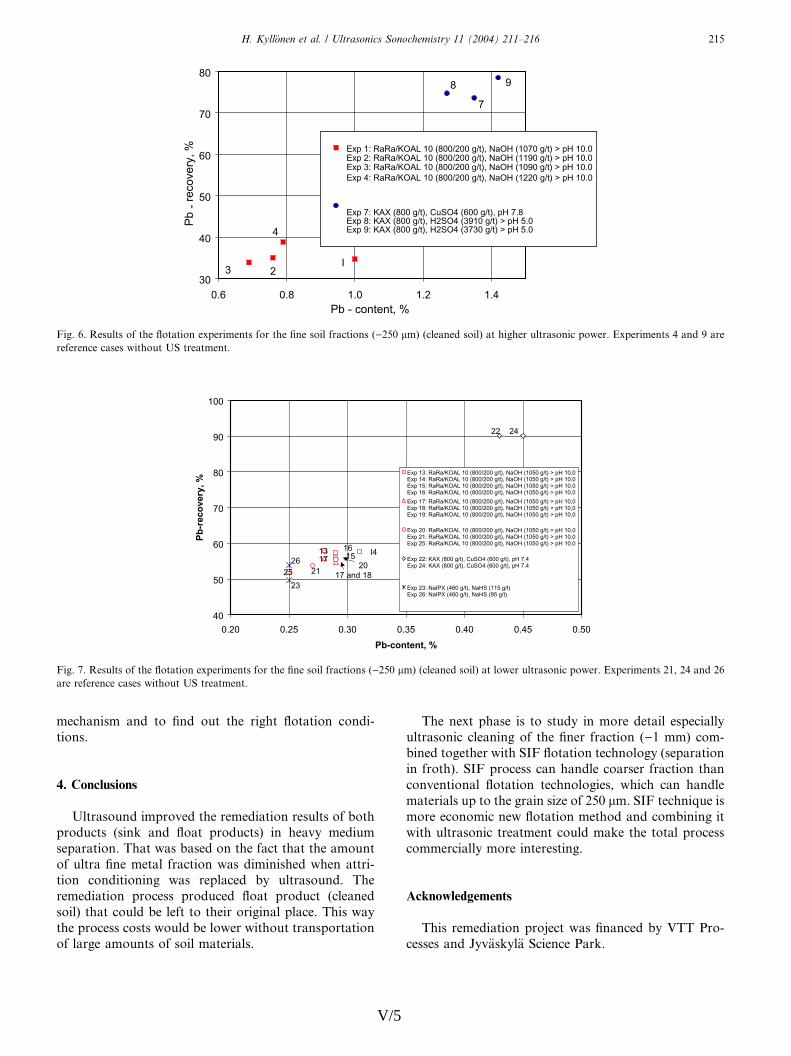
mechanism and to find out the right flotation condi- The next phase is to study in more detail especially
30
40
50
60
70
80
0.6 0.8 1.0 1.2 1.4 Pb - content, %
Pb -
reco
very
, %
Exp 1: RaRa/KOAL 10 (800/200 g/t), NaOH (1070 g/t) > pH 10.0 Exp 2: RaRa/KOAL 10 (800/200 g/t), NaOH (1190 g/t) > pH 10.0 Exp 3: RaRa/KOAL 10 (800/200 g/t), NaOH (1090 g/t) > pH 10.0 Exp 4: RaRa/KOAL 10 (800/200 g/t), NaOH (1220 g/t) > pH 10.0
Exp 7: KAX (800 g/t), CuSO4 (600 g/t), pH 7.8 Exp 8: KAX (800 g/t), H2SO4 (3910 g/t) > pH 5.0 Exp 9: KAX (800 g/t), H2SO4 (3730 g/t) > pH 5.0
I 2 3
4
7
8 9
Fig. 6. Results of the flotation experiments for the fine soil fractions ()250 lm) (cleaned soil) at higher ultrasonic power. Experiments 4 and 9 are
reference cases without US treatment.
40
50
60
70
80
90
100
0.20 0.25 0.30 0.35 0.40 0.45 0.50Pb-content, %
Pb-r
ecov
ery,
% Exp 13: RaRa/KOAL 10 (800/200 g/t), NaOH (1050 g/t) > pH 10,0
Exp 14: RaRa/KOAL 10 (800/200 g/t), NaOH (1050 g/t) > pH 10,0Exp 15: RaRa/KOAL 10 (800/200 g/t), NaOH (1050 g/t) > pH 10,0Exp 16: RaRa/KOAL 10 (800/200 g/t), NaOH (1050 g/t) > pH 10,0Exp 17: RaRa/KOAL 10 (800/200 g/t), NaOH (1050 g/t) > pH 10,0Exp 18: RaRa/KOAL 10 (800/200 g/t), NaOH (1050 g/t) > pH 10,0Exp 19: RaRa/KOAL 10 (800/200 g/t), NaOH (1050 g/t) > pH 10,0
Exp 20: RaRa/KOAL 10 (800/200 g/t), NaOH (1050 g/t) > pH 10,0Exp 21: RaRa/KOAL 10 (800/200 g/t), NaOH (1050 g/t) > pH 10,0Exp 25: RaRa/KOAL 10 (800/200 g/t), NaOH (1050 g/t) > pH 10,0
Exp 22: KAX (800 g/t), CuSO4 (600 g/t), pH 7,4 Exp 24: KAX (800 g/t), CuSO4 (600 g/t), pH 7,4
Exp 23: NaIPX (460 g/t), NaHS (115 g/t) Exp 26: NaIPX (460 g/t), NaHS (95 g/t)
I4 13 16 15 26
23
24 22
20 21 25 17
17 and 18
Fig. 7. Results of the flotation experiments for the fine soil fractions ()250 lm) (cleaned soil) at lower ultrasonic power. Experiments 21, 24 and 26
are reference cases without US treatment.
H. Kyll€onen et al. / Ultrasonics Sonochemistry 11 (2004) 211–216 215
tions.
4. Conclusions
Acknowledgements
Ultrasound improved the remediation results of both
products (sink and float products) in heavy medium
separation. That was based on the fact that the amount
of ultra fine metal fraction was diminished when attri-tion conditioning was replaced by ultrasound. The
remediation process produced float product (cleaned
soil) that could be left to their original place. This way
the process costs would be lower without transportation
of large amounts of soil materials.
V/5
ultrasonic cleaning of the finer fraction ()1 mm) com-bined together with SIF flotation technology (separation
in froth). SIF process can handle coarser fraction than
conventional flotation technologies, which can handle
materials up to the grain size of 250 lm. SIF technique is
more economic new flotation method and combining it
with ultrasonic treatment could make the total process
commercially more interesting.
This remediation project was financed by VTT Pro-
cesses and Jyv€askyl€a Science Park.
References range soils, in: Proc. of Recycling and Waste Treatment in
Mineral and metal Processing: Technical and Economic Aspects,
216 H. Kyll€onen et al. / Ultrasonics Sonochemistry 11 (2004) 211–216
[1] A.D. Farmer, A.F. Collings, G.J. Jameson, Effect of ultrasound
on surface cleaning of silica particles, International Journal of
Mineral Processing 60 (2) (2000) 101–113.
[2] D. Feng, L. Lorenzen, C. Aldrich, P.W. Mar�e, Ex situ diesel
contaminated soil washing with mechanical methods, Minerals
Engineering 14 (9) (2001) 1093–1100.
[3] V. Hintikka, P. Sten, P, J. Laukkanen, J. Leppinen, Remediation
of soils contaminated by lead-containing shotgun pellets, in: Proc.
of Symposium on Recycling, Waste Treatment and Clean Tech-
nology, vol. III, San Sebastian, Spain, September 5–9, 1999,
pp. 2519–2528.
[4] V. Hintikka, P. Parviainen, P. Sten, J. Laukkanen, J. Leppinen,
Remediation of soils contaminated by lead- and copper-contain-
ing rifle bullets, Geological Survey of Finland, Special Paper 32,
2001, pp. 151–157.
[5] V. Hintikka, P. Parviainen, P. Sten, J. Laukkanen, R. Kalapudas,
J. Leppinen, Recovery of metals from contaminated shooting
V/6
Lule�a, Sweden, 16–20 June 2002, pp. 295–303.
[6] T. Mason, P. Lorimer, Sonochemistry: Theory, Applications and
use of ultrasound in Chemistry, Ellis Horwood Limited, Chich-
ester, England, 1988.
[7] J.N. Meegoda, R. Perera, Ultrasound to decontaminate heavy
metals in dredged sediments, Journal of Hazardous Materials 85
(1–2) (2001) 73–89.
[8] A.P. Newman, J.P. Lorimer, T.J. Mason, K.R. Hutt, An
investigation into the ultrasonic treatment of polluted solids,
Ultrasonics Sonochemistry 4 (2) (1997) 153–156.
[9] B.P. Singh, R. Singh, Investigation on the effect of ultrasonic
pretreatment on selective separation of iron values from iron ore
tailings by flocculation, Separation Science and Technology 32 (5)
(1997) 993–1002.
[10] K. Swamy, K. Narayana, Ultrasonically assisted leaching, in: T.
Mason, A. Tiehm (Eds.), Advances in Sonochemistry, vol. 6,
Elsevier Science, 2001, pp. 141–179.
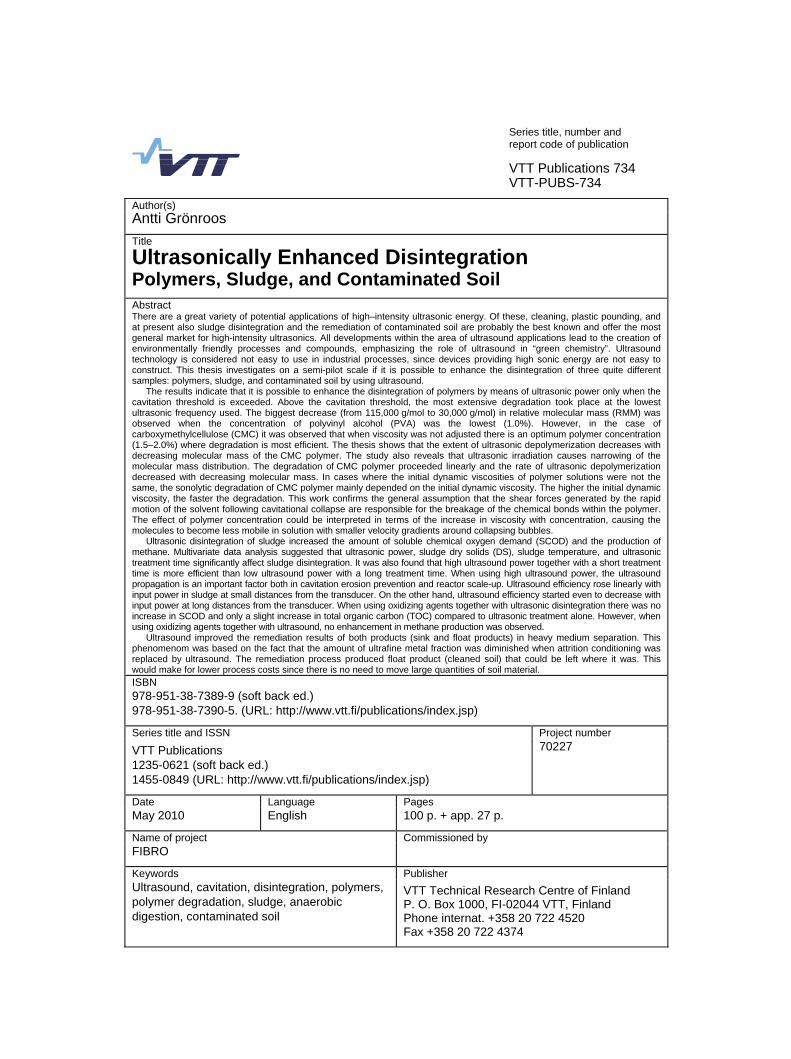
Series title, number and report code of publication
VTT Publications 734 VTT-PUBS-734
Author(s) Antti Grönroos Title
Ultrasonically Enhanced Disintegration Polymers, Sludge, and Contaminated Soil Abstract There are a great variety of potential applications of high–intensity ultrasonic energy. Of these, cleaning, plastic pounding, and at present also sludge disintegration and the remediation of contaminated soil are probably the best known and offer the most general market for high-intensity ultrasonics. All developments within the area of ultrasound applications lead to the creation of environmentally friendly processes and compounds, emphasizing the role of ultrasound in “green chemistry”. Ultrasound technology is considered not easy to use in industrial processes, since devices providing high sonic energy are not easy to construct. This thesis investigates on a semi-pilot scale if it is possible to enhance the disintegration of three quite different samples: polymers, sludge, and contaminated soil by using ultrasound.
The results indicate that it is possible to enhance the disintegration of polymers by means of ultrasonic power only when the cavitation threshold is exceeded. Above the cavitation threshold, the most extensive degradation took place at the lowest ultrasonic frequency used. The biggest decrease (from 115,000 g/mol to 30,000 g/mol) in relative molecular mass (RMM) was observed when the concentration of polyvinyl alcohol (PVA) was the lowest (1.0%). However, in the case of carboxymethylcellulose (CMC) it was observed that when viscosity was not adjusted there is an optimum polymer concentration (1.5–2.0%) where degradation is most efficient. The thesis shows that the extent of ultrasonic depolymerization decreases with decreasing molecular mass of the CMC polymer. The study also reveals that ultrasonic irradiation causes narrowing of the molecular mass distribution. The degradation of CMC polymer proceeded linearly and the rate of ultrasonic depolymerization decreased with decreasing molecular mass. In cases where the initial dynamic viscosities of polymer solutions were not the same, the sonolytic degradation of CMC polymer mainly depended on the initial dynamic viscosity. The higher the initial dynamic viscosity, the faster the degradation. This work confirms the general assumption that the shear forces generated by the rapid motion of the solvent following cavitational collapse are responsible for the breakage of the chemical bonds within the polymer. The effect of polymer concentration could be interpreted in terms of the increase in viscosity with concentration, causing the molecules to become less mobile in solution with smaller velocity gradients around collapsing bubbles.
Ultrasonic disintegration of sludge increased the amount of soluble chemical oxygen demand (SCOD) and the production of methane. Multivariate data analysis suggested that ultrasonic power, sludge dry solids (DS), sludge temperature, and ultrasonic treatment time significantly affect sludge disintegration. It was also found that high ultrasound power together with a short treatment time is more efficient than low ultrasound power with a long treatment time. When using high ultrasound power, the ultrasound propagation is an important factor both in cavitation erosion prevention and reactor scale-up. Ultrasound efficiency rose linearly with input power in sludge at small distances from the transducer. On the other hand, ultrasound efficiency started even to decrease with input power at long distances from the transducer. When using oxidizing agents together with ultrasonic disintegration there was no increase in SCOD and only a slight increase in total organic carbon (TOC) compared to ultrasonic treatment alone. However, when using oxidizing agents together with ultrasound, no enhancement in methane production was observed.
Ultrasound improved the remediation results of both products (sink and float products) in heavy medium separation. This phenomenom was based on the fact that the amount of ultrafine metal fraction was diminished when attrition conditioning was replaced by ultrasound. The remediation process produced float product (cleaned soil) that could be left where it was. This would make for lower process costs since there is no need to move large quantities of soil material. ISBN 978-951-38-7389-9 (soft back ed.) 978-951-38-7390-5. (URL: http://www.vtt.fi/publications/index.jsp)
Series title and ISSN Project number
VTT Publications 1235-0621 (soft back ed.) 1455-0849 (URL: http://www.vtt.fi/publications/index.jsp)
70227
Date Language Pages May 2010 English 100 p. + app. 27 p.
Name of project Commissioned by FIBRO
Keywords Publisher Ultrasound, cavitation, disintegration, polymers, polymer degradation, sludge, anaerobic digestion, contaminated soil
VTT Technical Research Centre of Finland P. O. Box 1000, FI-02044 VTT, Finland Phone internat. +358 20 722 4520 Fax +358 20 722 4374
VTT CREATES BUSINESS FROM TECHNOLOGY�Technology�and�market�foresight�•�Strategic�research�•�Product�and�service�development�•�IPR�and�licensing�•�Assessments,�testing,�inspection,�certification�•�Technology�and�innovation�management�•�Technology�partnership
•�•�•��VTT�PUB
LICA
TION
S�734�ULTR
ASO
NIC
ALLY�EN
HA
NC
ED�D
ISINTEG
RA
TION
ISBN 978-951-38-7389-9 (soft back ed.) ISBN 978-951-38-7390-5 (URL: http://www.vtt.fi/publications/index.jsp)ISSN 1235-0621 (soft back ed.) ISSN 1455-0849 (URL: http://www.vtt.fi/publications/index.jsp)
Ultrasound means vibrations which are similar to sound waves, but with frequen-cies too high to be detected by human ear. All developments within the area of power ultrasound applications lead to the creation of environmentally friendly processes and compounds, emphasizing the role of ultrasound in “green chemis-try”. Ultrasound technology is considered not easy to use in industrial processes, since devices providing high sonic energy are not easy to construct. This thesis investigated on a semi-pilot scale if it is possible to enhance the disintegration of three quite different samples: polymers, sludge, and contaminated soil by using ultrasound. The thesis indicated that it is possible to enhance the disintegration of polymers by means of ultrasonic power only when the cavitation threshold was exceeded. Above the cavitation threshold, the most extensive degradation took place at the lowest ultrasonic frequency used. The thesis showed that the extent of ultrasonic depolymerization decreased with decreasing molecular mass. Also it was found that ultrasonic irradiation caused narrowing of the molecular mass distribution. In the cases where the initial dynamic viscosities of polymer solutions were not the same the higher was the initial dynamic viscosity the faster was the degradation. Ultrasonic disintegration of sludge increased the soluble chemical oxygen demand and therefore the production of methane in anaerobic digestion. Multivariate data analysis suggested that ultrasonic power, sludge dry solids, sludge temperature, and ultrasonic treatment time significantly affected the sludge disintegration. It was also found that high ultrasound power together with a short treatment time was more efficient than low ultrasound power with a long treatment time. Ultrasound improved the soil remediation results in heavy medium separation. This phenom-enom was based on the fact that the amount of ultrafine metal fraction was di-minished when attrition conditioning was replaced by ultrasound. The remediation process produced cleaned soil that could be left where it was. This would reduce process costs and avoid the need to transport large amounts of soil material. In this thesis it was shown that it is possible to use ultrasound on a semi-pilot scale to enhance the disintegration of three quite different samples: polymers, sludge, and contaminated soil.