ultrasonic relanation studies in aqueous amino acids
TRANSCRIPT

Ultrasonic relanation studies in aqueous amino acids

4.1. INTRODUCTION:
Amino acids are cornmon conlponenis of all orgairi$rm~s. I+mtein oi ail byecies,
from bacteria to humans, is made from the same set of 20 stitniinrd amino acids.
i2roteins play many different biological roles in [;\ring s!.stern5. They are the molecular
instruments through whch the genetic information is expressed. Ail proteins are
constructed from the basic set of 20 amino acids, covalently linked in ~h~~racteristic
sequences. Because each of these amino acids has a distincti1.e side chain ~vhich , fends
it chemical individuality. The group of 20 amino acids .i.vfiich form the basic building
blocks of proteins may be regarded as the alphabets of protein structure. The most
remarkabie thing is that the cells can join these 20 amino acids in many different
combinations and sequences, yielding the peptides and proteins with strikingly
different properties and activities. Amino acids in aqueous solution are icnized and can
act as acids or bases. Knowledge of the acid - base properties of amino acids is
extremely important in understanding many properties of proteins [l]. Besides, the
biological systems consist 70% of water; the study of interaction of these amino acids in
water has become prime important.
Ultrasonics has become an important and widely accepted method for non-
invasive imaging of human body and thus offers greater potential for further
development in diagnostic medicine. Ultrasonic energy has the ability to propagate
through soft biological tissues suffering only moderate attenuation in its passage. For
this reason, it has been widely used for measurement and imaging in the medical
context. The propagation of an acoustical signal in biological media is characterized by
variation in physical parameters which describe the state of the tissues. The ultrasonic
propagation properties of the tissues are governed to some extent, by their biochemical
composition [2]. Thus characterization of the materials by the determination of
ultrasonic wave propagation parameters is encouraged.

Lniierstar~ding the stabllitv oi ihc native sirucitjre 0 1 prtrtcii~s a:ld iur~f~rn-isiion
of (??her biopolyrners in aipeocis sol~itioa~ are of i u n d a n w ~ ~ t , ~ i ~n~porta:>ce A~l'jny
bioivg~cal phenomena have been ii?e subject ot great ci~,lilengc ;lnd extensive
in\.est~gatio~~s 13-61. The state of- ionization of the surfate ot bro rnoiecules and reiated
hydration and proton transfer or these sites are sigiuticant parts of ihe interactions of
these rnoiecules with their environment. Research work on ultrason~c studies 17-?5J,
partial molar volume studies jl6-IS] and heat capacnty studies 119-211 of aqueous
soiut~ons ot amino acids have been carried out to understand their heha\.ior in an
aqueous env~ronment.
Ultrasonic techniques have already been ernployed successfully to observe the
dynamic equilibrium between multiple ~someric forms of moiecules and to arnve at
more complete kinetic descriptions of chemical and structural reactions whose
relaxation times are comparable to the period of the ultrasonic wave 1221. The adiabatic
propagation of a longitudinal acoustic wave through a fluid medium result in time -
dependent, localized changes in pressure, density and temperature. Thus, the brave
motion may perturb molecular equilibrium at rates which depend upon the sound
frequency. For a non-ideal fluid, this lead to a time lag between an applied pressure
and the ensuing changes in the density. Consequently, molecular energy level
populations are perturbed at the expense of acoustic wave energy, and the process is
referred to as absorption.
Ultrasonic absorption spectroscopy has long played a leading role in research
involving the kinetics and thermodynamics of proton transfer reactions since the
relaxation times of these processes lie in the region of time covered by this experimental
technique.
Only a few biologically important macromolecules have been subjected to
thorough examination. The acoustical investigation of Casrtensen et a1 (231 on aqueous
hemoglobin solution indicates that the interaction between the solvent and the solute is

the prjnc~pal mechanism ot acorrst:~ i ~ l ? s ~ r p t ~ ~ i i ttl ii.~t>se s;,.h,terns., the
pp*btrre vanation assoc!ntrd !tV!th !he sound iv'3t.e perliirbi the eqi~~libr~inm
Jlstnbutlon of soi1,ent n-ioiecuies that are izeakly bonded to the solute, ,~r-id since
rearrangement of the solvent molecules does not occur ~rrsi;antane~usiy, absorption
results A slrniiar situation of excess uttrasonlc absorpt~on due to the interaction
bet~veen the solute and solvent rnolecuies is reported in aqueous detrar l soiutlons by
Hatviey et al 1241
'I'he acoustical studies carrled oiit by Kessier and Dtlrara 1251 on aqueous bo\.lne
serum albumin (HSA) as a function of frequency ha1.e sho1z.n that there is a sharp
increase In the excess absorption as the pH of the aqueous BSA solutlor~s are reduced
below pH 4.3. A similar increase in excess absorpt~on 1s also observed when the pH of
aqueous BAS is raised above pH 10.5. The increase in excess absorption as the pH of
aqueous KSA solutions are reduced below pH 4.3 and increased above pH 10.5 is found
to be reversible in nature in this range. This effect is found to be more pronounced at
low frequencies. The increase in absorption below pH 4.3 is attributed to the
intermediate N-F' transition and the increase in excess absorption above pH 10.5 are
described as due to the expansion of BSA molecule.
Many workers [26, 271 carried out ultrasonic absorption studies in aqueous
solutions of proteins as a function of frequency and at different pH ranges. These
studies suggest that there is an excess absorption of ultrasonic waves at extreme pH's of
aqueous protein solutions. These workers attribute this observed excess acoustic
absorption at extreme pHs of aqueous protein solutions to the perturbation of inter-
molecular proton transfer at ionizable side chain groups. However the mechanism of
acoustic absorption at neutral pH has not been accounted for quantitatively, with
solvent structure mechanisms, proton exchange and Internal motions of side chains
being proposed (281.

Hussey and Edl:londs i29j irorrl their altra~nraic ~nre>i!? ;a t~oi~ ui p:otc)n tr,ir~ster
reactions in aqueous glycine sol~rtiilns !n t1 .1~ pH r,!i-i&e b N :n 7 7 !7,si t. ~ c ? i i u i ~ ; J t ~ ~ l !ha: the
proton transfer reactions at amino and carbmt.P g ~ o u p s i ~ ~ r ~ n o t be responb~bie for
signit~cant contribution to the total illtrason~c absorption 'i'his range ot pH is
considered as the physiologicai range of pH values of blood ?hat 1s cornpi~!itile witla life.
A similar result of negligible contribution to the total ~litrasonic '3hsorption drie to the
proton transfer reactions has been observed bv the sarile authors 1261 in aqueous
soliltions of proteins in the pH range 6 - 8. This inl.estigstion on ailueou5 so!utions of
protein and polypeptides also establish that the proton transfer processes are very likeiy
a major mechanism contributing to the excess absorption in the range pH<6 and pH>&
However, in each case it is likely that this is not only the mechanism In effect, but other
rnechan~sms such as solvation equilibria, conformational changes and keto - en01
equilibria may also have their contributions superimposed on those due to proton
transfer reaction. But even then proton transfer cannot be eliminated from
consideration.
The theoretical and experimental studies of Holmes et a1 1301 on cysteine at
neutral pH indicate that in contrary to the studies of Hussey and Edmonds [26, 291,
there is an excess absorption in the neutral pH range 6.5 - 8.5. This excess absorption at
neutral pH range of aqueous cysteine solutions has been explained as not due to the
proton transfer between the ionisable groups and the solvent hydroxyl ions, which will
not produce significant absorption. But it is explained as due to the intramolecular
proton transfer. This intramolecular proton transfer may be significant at neutral pH
where ionisable side - chain groups are present. Similar ultrasonic absorption studies
are carried out by the same authors [31] on aqueous glycyltyrosine solutions in the
frequency range 2 - 50 MHz and in physiological pH range (6.8 - 8.8) and at a
temperature of 37°C. The excess acoustic absorption observed in glycyltyrosine
solutions in the physiological pH range is attributed to both inter- and intra- molecular

pfi:!on transfer processes ~!v.ulving U. - ani~no group dr-ld the . t.i,;os;.i . 5icic ch,arna (31-1
g"C"lp
* 7
Ilrte ultrasonic absorption study carried o u t by !i,~.;,ici~~indrcjti 132j in this
iahwratory in aqueous amino acids of I - ahnine, I - ~~aliine, I -- ieuci~ne, dl - .ila:-nlne ,and
dl - vafine in the pH range 8 - i0.5 and in the trequency range 2 - 30 XIHL ~t t r ibute the
&sc.r\.ed excess absorption can be due to the proton triinsi'er process occurring in these
, I L ~ ~ O L I S amino acids solutions. The excess iiltrasonic absorption obtained arourtd the
neutral pH in aqueous 1 - alanine, 1 - valine, dl - alaninr and dl - valine may be due to
the hydration phenomenon
In order to shed more light on the nature of molecular interactions in aqueous
amino acids, ultrasonic absorption studies are carried out in the acjueous solutions of
jl- alani~ze, 1 - cyestine, 1 - glutamic, dl - seriae and l - tyrosine in the present work.
The ultrasonic absorption studies are carried out in the freq~lency range 3 - 89 MHz.
and at different pH ranges. The pH of aqueous j!?- ula?iine, I - cyestine, dl - swine and
1 - tyrosine solutions are varied in the range 6.3 - 12.6, whereas for aqueous
1 - glutamic solution, it is varied in the range 3.5 - 10.75. The ultrasonic absorption
study carried out in these aqueous amino acids at different concentrations and at an RF
frequency of 10 MHz showed an absorption maximum at chosen concentration.
4.2. RESULTS AND DISCUSSION:
The amino acids @ - alanine, I - cyestine, 1 - glutamic, dl - serine and 1 - tyrosine
are of ARJBDH quality and are used as such without further purification. Aqueous
solutions of p - alanine, 1 - cyestine, 1 - glutamic, dl - serine and 1 - tyrosine are ,I
prepared in the concentration range of 0 . 0 5 ~ ~ ~ ~ ~ using double distilled water. The
reason for choosing this concentration for pH variation can be explained a s follows.
The ultrasonic absorption study carried out on these aqueous amino acids at different
concentrations and at an IW frequency of 10 MHz shows an absorption maximum at

tj-j.s concentration. l'he pH of the aqiieous ari-rini:, ,~cjd+ %>j:~tioni '8r.c ;tdju~',:$~i Ly ,111
E/icLi />H m c i ~ ( E - l i j l j ha~.iilg polasslurri chioric!e g1ai.i eieclrodc to a n ilccuracy ot
B.2pl-i. The pH of the solutions is adjiisted to cfiiferer-it \.aliles by the 'iddition of
krrorvn quantities of standard volumetric solrltion o f I h \aOH sokation.
The ultrasonic absorption st~tdies are carried out in the aqueous soliltions ot
- alanine, 1 - cyestine, I - glutamic, dl - serine and 1 - tvrosine in the frequency range
of 3-89 MHz using Pulsed Pozi1~r Osciiinicr and A4AlrtC 77110 sysfcrn as given in Chapter
11. 'The ultrasonic velocity is measured using an Ui f rasc i~ ic Tii-izc Ilrfer-z'iii0t7z~'t~'r (UTI-102)
by Pulse Echo Overlap Method (PEO) in the frequency oi "a OMMz as disci~ssed in chapter
11. The density and viscosity of the solukions are mecisitred using i'pcc$c Griziiif!j Boitie
and Ostu~ald's Viscometer as given in chapter 11. The temperature of the soli~tions is
maintained at 303 K by circulating water from a thermostatically controlled 5vater bath
with an accuracy of rtO.1K The temperatures of the solution and the circtllated water are
noted by using a dual terminal digital thermometer designed in this laboratory by
inserting them in the holes, provided in the ultrasonic liquid cell.
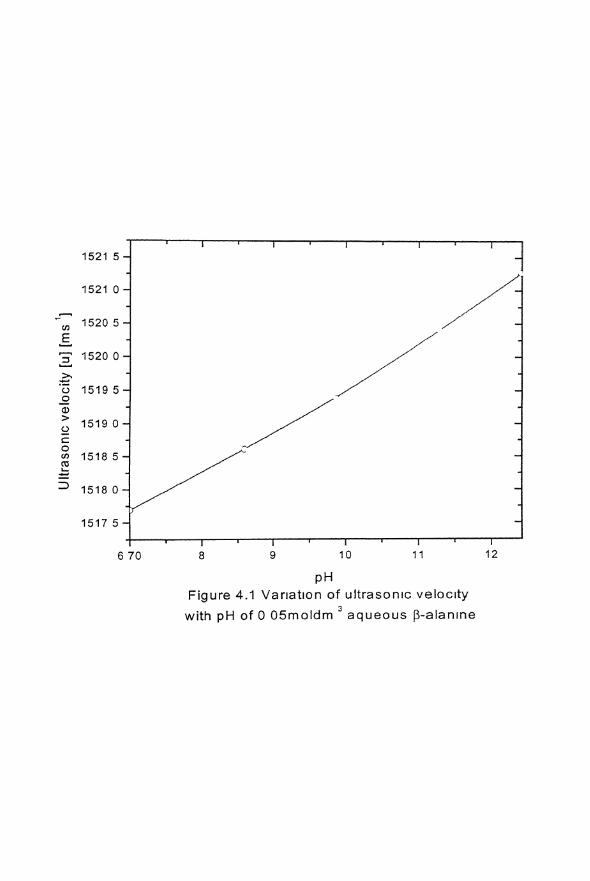
The ultrasonic velocity data for aqueous solutions of P - alanine, 1 - cyestine,
1 - glutamic, dl - serine and 1 - tyrosine at different pH are given in tables 4.1 to 4.5
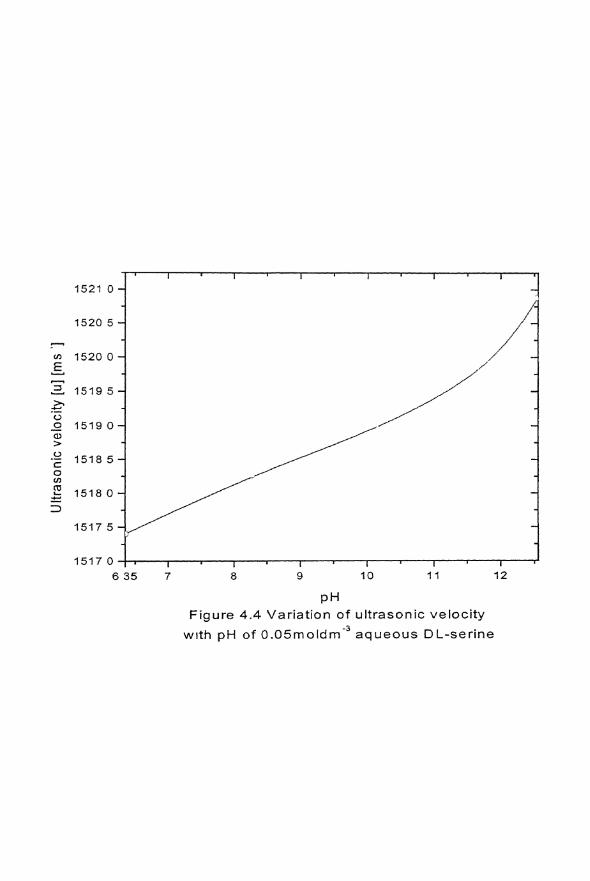
respectively. The variation of ultrasonic velocity with pH is shown in figures 4.1 to 4.5
for aqueous p - alanine, 1 - cyestine, 1 - glutamic, dl - serine and I - tyrosine
respectively.
From the value of absorption coefficient (a), the observed absorption ubs
computed. These absorption data are fitted to the conventional Debye type single
relaxation equation (1.16) in the frequency range studied using the non-linear least
square fitting algorithm proposed D. W. Marqudart [33]. The non-linear fitting
program is written in FORTRAN language [32] and is given in appendix A. From the
computation of non-linear fitting program, the relaxation amplitudes A & 8, the
6 70 8 9 10 11 12
pH Figure 4.1 V a r ~ a t ~ o n of u l t rason~c ve loc~ ty
with pH of 0 OSmoldm aqueous p-a ian~ne


pH F igu re 4.3 Variat ion of u l t r a son ic veloci ty
with p H of 0 . 0 5 r n o l d m ' ~ a q u e o u s L-g lu tamtc acid
(I)
," 1518 - -
pH Figure 4.4 Variat ion of ultrasonic velocity
wlth pH of 0.05rnoldm-~ aqueous DL-serine
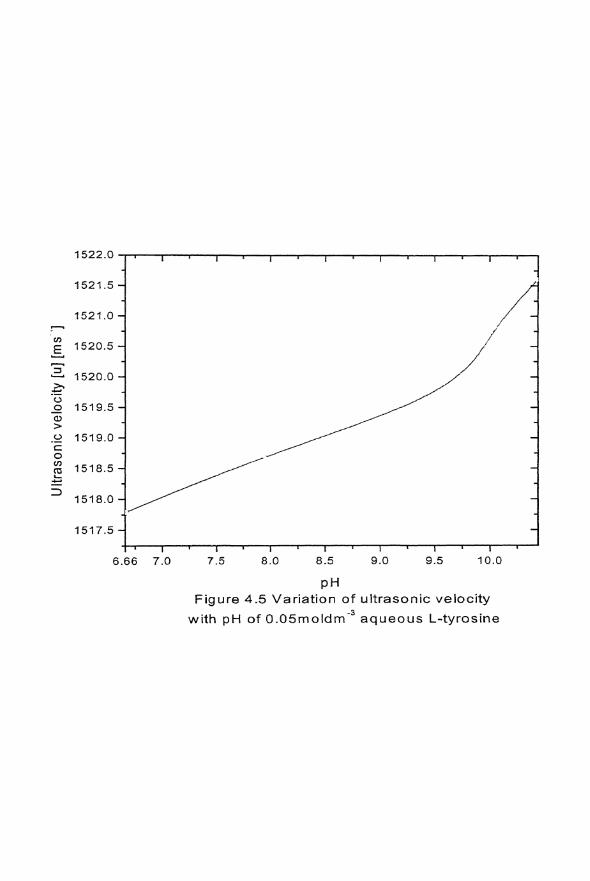
pH Figure 4.5 Variation of ultrasonic velocity
with pH of 0 . 0 5 r n o l d m ~ % ~ u e o u s L-tyrosine
rt.iaw!i~[~ frequency j; and absorption per .iv,t\.t.!t.rlgfJl ! r~ , i , i ;,rc L , ~ i 1 8 F k l t c e ~ \!i]lere '\ I\
the relaxation amplitude, B is the absorption d ~ i c tc3 :kw ~cri\.cnt !,?a5 <1:72' rcs~dLiI~P
relaxai.i~~~ processes occurring with very high rriaz;?iiiirm !reqtltb~iiies i < r o r i ~ the .rbi,i.r
parameters, the relaxation time z is c')Ii.tii;ated tising the rt.i,ltion,
The maximum absorption per wavelength Id) , IS iaPcitic~tcJ u\ir~g i!~c reliliioii,
I'he computed parameters vlz, relaxatlon freqi~rncy f,, relLjx,ition ,inlpiltridrs
A & B, relaxation time T, absorpt~on per maximum wai elength [ail 9 ,, dnd sol~irne
change of the system Av and kinetic parameters viz. tortvard k , and bnckt~arcl A, rate
constants for aqueous p - alanine, 1 - cyestine, 1 - glutamic, dl - serine and I - tyrosine
respectively at different pH range are given in tables 4.6 to 1.13 and in 4.11.
f a The variation of observed absorption 1 for individual concentration and
[s- ,,,,, the absorption per wavelength (d) as function of frequency at different pH are gi.rre11
graphically in figures 4.6 to 4.20.
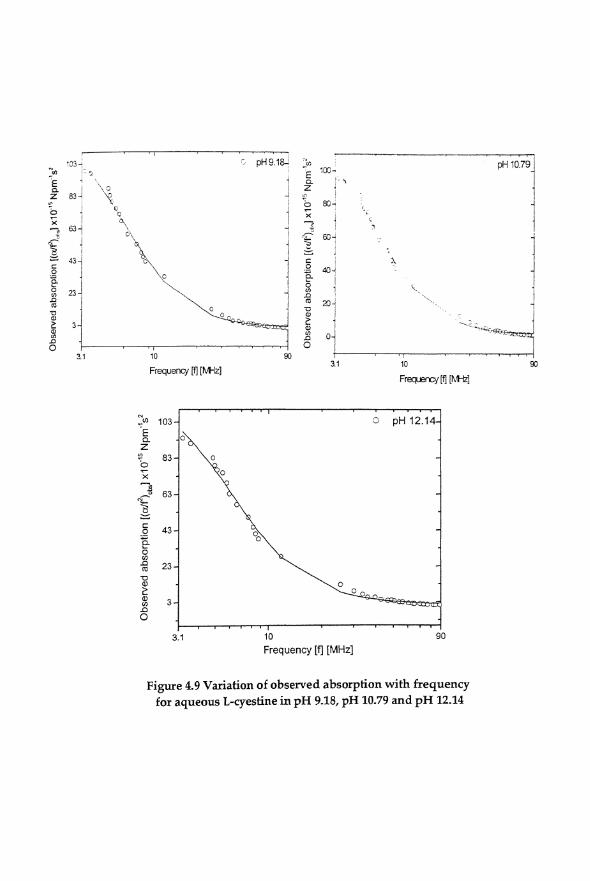
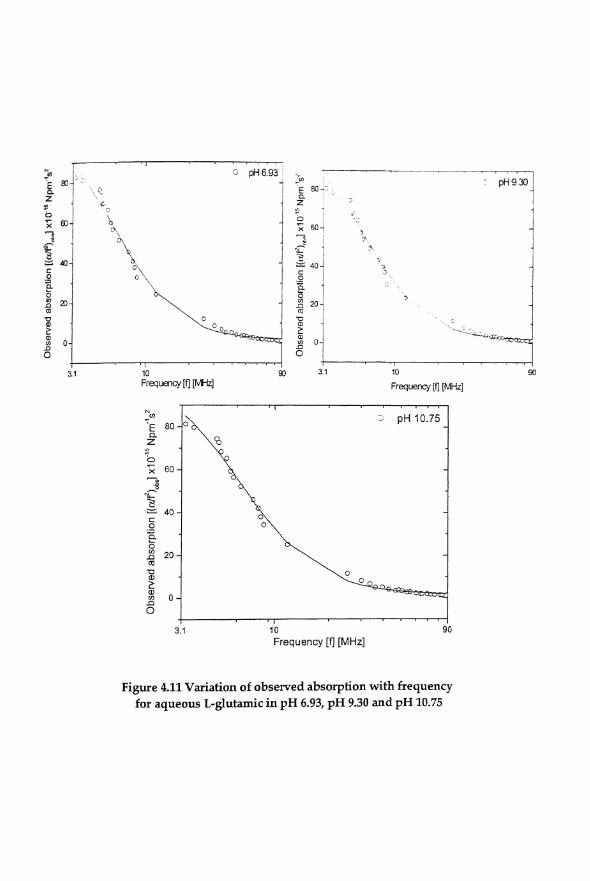
Figures 4.6 - 4.15 shows the variation of observed absorption with frequency for
aqueous solutions of p - alanine, 1 - cyestine, 1 - glutamic, dl - serine and 1 - tyrosine
respectively in the pH range studied. The observed absorption decreases with
increasing frequency. The variation of observed absorption with pH increases with
increasing pH values of P - alanine, 1 - cyestine, 1 - glutamic, dl - serine and 1 - tyrosine.
It can also be seen that the values of observed absorption increases in magnitude with
an increase in the p H of P - alanine, 1 - cyestine, 1 - glutamic, dl - serine and 1 - tyrosine
respectively.

f r e q u e n c y [f] [MHz]
' , 7 0
Frequency [q [ M H z ]
Figure 4.6 Variation of observed absorption with frequency for aqueous p-alanine in pH 6-70 and pH 8.30

Frequency [fl [MHz]
3.1 10
Frequency [q [MHz]
Figure 4.7 Variation of observed absorption with frequency for aqueous p-alanine in pH 9.57, pH 10.99 and pH 12.12

10 Frequency [f] [MHz]
Frequency [fj [MHz]
Figure 4.8 Variation of observed absorption with frequency for aqueous L-cyestine in pH 6.41 and pH 8.05
N -* 103
k Z
? 83 0 .7-
X - -z 63 *L a - u
S 43 .- + E n m 23 71
I % 3
8 3.1 10 90
Frequency [fl [MHz]
Figure 4.9 Variation of observed absorption with frequency for aqueous L-cyestine in pH 9.18, pH 10.79 and p H 12.14

Frequency If] [MHz]
10
Frequency [fl [MHz]
Figure 4-10 Variation of observed absorption with frequency for aqueous L-glutamic in pH 3.50 and pH 4.92
10 90
Frequency [g [P;IHz]
i I I 3.1 10 90
Frequency [q [MHz]
Figure 4.11 Variation of observed absorption with frequency for aqueous L-glutamic in pH 6.93, pH 9.30 and pH 10.75

F r e q u e n c y [fl [ M H z ]
F r e q u e n c y [q [MHz]
Figure 4.12 Variation of observed absorption with frequency for aqueous DL-serine in pH 6.35 and pH 8.27

I I 3 1 10 90
Frequency [fj [MHz]
Figure 4.13 Variation of observed absorption with frequency for aqueous DL-serine in pH 10.17, pH 11.86 and pH 12.56

Frequency [MHz]
Frequency M [MHz]
Figure 4.14 Variation of observed absorption with frequency for aqueous L-tyrosine in pH 6.66 and pH 7.94

10 Frequency [fl [MHz]
Figure 4.15 Variation of observed absorption with frequency for aqueous L-tyrosine in pH 9.74, pH 10.00 and pH 10.44

'The variation of absorption per iv,i\.eleng?.Ia (uj-i \vitE.i irli:cij.i:>t; iieijiienib.
[cnli~ilateJ) is @\.en graphically in figures 4.16 1.232 idi 13 ,.n/,!il:i:c, 1 - ci.c5tji-.if,
1 - glutantic, dl - serine and 1 - tyrosine respectivel;. in the pfd r,irli,;e >:uiiicli, f*rL:nl the
figures, i t can be seen that the absorption per ival.eIengtEi for tire aqni.ot:s sclLltiorls of
fi - aianine, 1 - cyestine, 1 - glutarnic, dl - serint. and ! - t~ro:;jne z! L{it"ers.nr values
incresses with increasing frequency and reaches a rnasimui:~ \ c ~ l u e ,3t '1 pjrticul;~r
frequency called relaxation frequency ,L of that particular concentration and then
decreases further with increase in frequencv. For any particui,tr frt.yiiency, the
absorption per wavelength has shown a non-linear variation ~vith ii~creiist' i n pH oi
p - alanine, 1 - cyestine, 1 - glutan~ic, dl - serine and 1 - tyrosine. Also, t!~e relaxation
frequency .L decreases to a lower value with increase in the pH rraiue oi fl - alanine,
1 - cyestine, 1 - glutamic, dl - serine and 1 - tyrosine.
+3 Salient features of the study are szrmrnarized as,
J The ultrasonic velocity increases with increasing pH value tor ~ ~ q u e o u s
p - alanine, 1 - cyestine, 1 - glutamic, dl - serine and I - tyrosine.
J The adiabatic compressibility decreases with increasing pH value for
aqueous p - alanine, I - cyestine, I - glutamic, dl - serine and I - tyrosine
respectively as seen in the ultrasonic velocity profile.
J The free length decreases with increasing pH value for aqueous
j3 - alanine, 1 - cyestine, 1 - glutamic, dl - serine and 1 - tyrosine.
J The density of the solution increases with increasing pH value for
aqueous p - alanine, 1 - cyestine, 1 - glutamic, dl - serine and 1 - tyrosine.
The shear viscosity increases with increasing pH value for aqueous
fi - alanine, 1 - qestine, 1 - glutamic, dl - serine and 1 - tyrosine, but it
initially decreases below the value of solvent distilled water.

8 ,
a 5 *> 'I'he obser1.t.d absorption - OC.~~L>L)-+.-- { V I ~ ~ I ~ I ; L ~ L ~ ~ . ~ * L . in !~L~,.~L!L~;~L-&. tcbr \ t 2 , "
any particular pH i~i1ile of j3 - riiar2i~~e, 1 - c~~c.?!ji~tr, i - r ; i ~ i t , i ~ : ? i ~ , dl -- s e r l r ? e
and I - tyrosine.
3 The value of observed absorption illgedbeb i ~ i t f ~ ~ ~ l c ~ ~ ~ l s e 111 \ . ; ~ ~ I J Q ~t
f~ - alanine, I - cyestine, 1 - gl~~iamls, dl - serine and i - tyri?>lrar. ir-i water
+:+ For any particular pH value, the sarrcttion &pi iibsorptiitn per $\,i\.elei~gth
(d) shows a maximum a t the relaxaijon freijue~~cq. , fr c ~ t that p~rtictllar
pH value for p - alanine, I - cyestine, I - giutl~mlc, dl - ierlne ailci
1 - tyrosine.
-3 The ~palues of absorption per wa.i.eiengthjd) show a ncn-!l~lear variation
with increasing pH value for p - alanine, 1 - cyestine! 1 - giutnmic,
dl - serine and i - tyrosine.
*:* The relaxation frequency A shifts tonpards a lower value with iilcrease in
pH value of p - alanine, 1 - cyestine, 1 - glutarnic, dl - serine and
1 - tyrosine.
+3 The relaxation time t shifts towards a higher value with increase in pH
value of p - alanine, 1 - cyestine, 1 - glutamic, dl - serine and I - tyrosine.
8 The relaxation amplitudes A & B show a non-linear variation in the pH
range studied for fi - alanine, 1 - cyestine, I - glutamic, dl - serine and
1 - tyrosine and relaxation amplitude A shifts towards a higher value with
increase in pH value of P - alanine, 1 - cyestine, 1 - glutamic, dl - serine
and 1 - tyrosine.
From tables 4.1 to 4.5 and figures 4.1 to 4.5, it can be seen that the ultrasonic
velocity u of aqumus amino acids for varying pH values shows an increase with
increase in the pH value for all the amino acids studied. The adiabatic compressibility

.,re,i>es with the ii~crease in the pH .i-,iluei tor drr\ji-io ,)i.ici\ 5:ii,jil,.~ I I~~ , ,tri,llraii of J . -
Ui i , r , l>f i r~ i~ .i,eiocity with increase in p i i i'~iiie il-i;lv b t b cp l i i i3 j -Ei l \L8j i l',i-jsIiil.i'ij bV
rc.+oriing to flickering cluster n-todei of zv,iter.
According to this model, the water is siipposed roi?siit of j:"i.jrt?seJS -Enncfcd
cjiratt.rs and unbonded water molecules. The moleciiies in tile i n t e r i ~ r 01 the c l ~ i ~ t ~ ~ c , are
yuadri~ptiy bonded (ice likej and unbonded :cater moiecuics arc s ~ i ~ ~ o ~ e d t o I?I 'CL~P~V r .
the space in between the clusters. 'The cliisters are sornctiines reierrc.3 ;s:s "pen
structure' water and the dense monomeric fluid is referred to as 'clilhcd stauct~ire'
water. The mixture is a dynamic mixt~lre and the break do.iz.n ui clusiers is a
cooperative process. When one hydrogen bond breaks in the ciuster, tht' ~ s h o i e cluster
breaks do.rkrn resulting of an increase in the close packed structure oi tzrdter. tl'hers the
amino acids are dissolved in water, it splits into two viz., anions and cations a re formed.
The water molecules are attached to the ions strongly by the electrcstatic forces, ~i-hich
introduce greater cohesion in the solution. When NaOH is added, whose net structure
breaking property would first disturb the open structure of water thereby increasing
free monomer population, an action that would be followed by structural
reorganization leaving the molecules in closely fitted helical cavities. Such a n increase
in the closed packed structure of water results in increased cohesion of water molecules
leading to an increase in the ultrasonic velocity.
The increase in ultrasonic velocity of aqueous amino acids is attributed to the
breaking of clusters by OH- molecules resulting in increasing the closed packed
struQure of water. They first would disrupt the water structure, an action which could
be followed by structural reorganization leaving the amino acids in closely fitting
helical cavities. It is known that such an increase in the close packed structure results in
increased cohesion between the water molecules [34]. This increased cohesion decreases
the adiabatic compressibility resulting in an increase in the ultrasonic velocity c as

oit3tj;ved in the p ~ h e ~ " tbt~dy as seen ir? the i i g r i i t . 5 ~ . ~ - ":..?A i j I 1 dl, I.~~.~~~,....; ; t i . 4 ; uIis u!lrLi-~nic 1,etosity is increasing aa the pki \ . i l i i je orairc.i-cci ji:r t i l c , l i j tili. \i.\ti.nl
I t is also knotvn that the incre,isc i;a t l j :rLjiC,lli i < ~Jc;~!;. iicj i l~. i l t l , i l i l l t I1ll
acrii hoi~ttions is due to hydrat~on of the amino z c i ~ i sno!czcul~>i 1%. hlih i:tir.i.iic* ~ ( ~ ~ I ~ ~ I o ~ I
be:v,vren \cater nlo!ecuies.
In the present ultrasonic absorption 3t~tdies on P - ,ti,lrlnnc, E - ivt.s:ir:c',
i - glutamic, dl - serine and 1 - tyrosine solutions, the adtra>oiaic ,~il>t)rptiu~i:, i tSt;~l l lei i 111
the pH range 6.3 - 12.6 for - alanine, 1 - cyestine, dl - serlne a i d 1 - t\.ro:-.i::t) iitiii i r i the
pti range 3.5 - 10.75 for I - glutamic and in the frequency rz;ngr 3 - 83 lz ,Ire tt>unc? to
be greater than that d ~ ~ e to the solvent water. 'I'his indicates that there e\isth some
mechanism by which the observed ultrasonic absorption of riqueoris ammo acids gets
increased. From figures 4.6 to 4.15, it can be been t h ~ t the observed ultrasonic
absorption (5) decreases with increasing fwqnency thereby shor\.ing that the ubs
ultrasonic absorption is frequency dependent. This decrease of ultrasonic absorption
5) with frequency is an indication of the presence of relaxation time 1351 in the .t+ / "h ,
I '\ a I measured frequency range. The experimentally measured values of absorption - 1 Lf - are plotted as open circles in the figures 4.6 to 4.15. These experimental points fit very
well to the equation for a single relaxation as indicated by the continuous line in figures
4.6 to 4.15 and thereby giving the information that all amino acids studied show a single
relaxation behavior in the pH range studied and in the frequency range 3 to 89 MHz.
From the figures 4.16 to 4.20, it can be seen that for all the amino acids studied,
the value of absorption per wavelength (d) increases with increasing pH of the
aqueous amino acid solutions. Also, the relaxation frequency .f, of an amino acid
solution shifts towards a lower frequency value with increasing pH of the aqueous


1 - ' I ' ' ' . . I
3.1 10 90
Frequency [q [MHz] Figure 4.1 7 Variation of absorptiog per wavelength
ld mL with frequency for O.O5~%qeuous L-cyestine

3.1 10 Frequency [fl [MHz]
Figure 4.1 8 Variation of absgrption pe r wavelength with frequency for 0.05~!i~^e:ous L-glutamic acid

10
Frequency [fl [MHz]
Figure 4.1 9 Variation of per wavelength with frequency for DL-serine

15
14
13
12
11
10
9
8 -4- pH7.94 -b- pH9.74
7 -+ pH1O.OO -+ pH10.44
6 3.1 10 90
Frequency [fl [MHz]
Figure 4.20 Variation of absorption per wavelength d -2
with frequency for 0 . 0 5 ~ ~ ~ u o u s L-tyrosine

chapter Iv ,21ninu Ac1d5.. . - amino acid solutions. From the above results, it is more probable that the proton
transfer process may be considered as the principal source for the obser\red excess
in aqueous solutions of P - alanine, 1 - cyestine, dl - serine and 1 - tyrosine in
the pH range 6.3 - 12.6 and 1 - glutamic acid in the pH range 3.5 - 10.75 and in the
frequer~cy range 3 - 89 MHz. The above results are also in good agreement with the
theory for proton transfer proposed by Hussey and Edmonds [29].
A similar situation of excess absorption, increase in the value of (ai),, and the
shift of relaxation frequency towards low frequency side with increasing pH has
been reported by Holmes et a1 [36] in aqueous glycyltyrosine and cysteine solutions in
the physiological pH range. They have attributed this behavior to inter- and intra-
molecular proton transfer in these solutions. Hence the above explanation holds good
for the present excess absorption observed in aqueous P - alanine, I - cyestine,
1 - glutamic, dl - serine and 1 - tyrosine solutions at different pH.
The results of the present ultrasonic absorption studies on aqueous amino acids
at different pH are further supported by the ultrasonic investigation of Hussey and
Edmonds [26] on aqueous solutions of protein and polypeptides. According to Hussey
and Edmonds, in addition to the proton transfer process other mechanisms such as
interaction between the solute and solvent molecules, the perturbation of salvation
equilibria, conformational changes keto-en01 equilibria may have their contribution
superimposed on those due to the proton transfer to the excess ultrasonic absorption
below pH 8. The amino acid molecules in the neutral solution generally exist in dipolar
form, thus have a stronger interaction with the surrounding water molecules, i.e.
hydration [lo]. This hydration may be the cause for the observed excess absorption
around the neutral pH of aqueous solutions P,- alanine, 1 - cyestine, 1 - glutamic,
dl - serine and 1 - tyrosine.

From the table 4.11, it can be seen that the computed ~,alues of \ .ol~~rne change of
the system 4 v and kinetic parameters v~z. forward k , and backward k, rate constants
for aqueous f3 - alanine, 1 - cyestine, 1 - glutamic, dl - serine and 1 - tyrosine respecti~~ely
are well within the reported values of other amino acid studies where proton transfer
mechanism plays a dominant role in the pH range of Hussey and Edmonds 1261 and
Applegate et a1 [37].
4.3. CONLCUSION:
The ultrasonic absorption studies carried out in the frequency range 3 - 89 MHz
in aqueous solutions p - alanine, 1 - cyestine, 1 - glutamic, dl - serine and 1 - tyrosine at
different pH show that the ultrasonic absorption decreases with increasing frequency
and increasing with increasing value of pH. The absorption variation follows a single
relaxational behavior. The possible relaxation mechanism can be due to the proton
transfer reaction process occurring in these aqueous amino acid solutions. The excess
ultrasonic absorption obtained around the neutral pH in aqueous P - alanine,
1 - cyestine, 1 - glutamic, dl - serine and I - tyrosine may be due to the hydration
phenomenon. Kinetic parameters computed supports the relaxation mechanism is due
to proton transfer reaction in aqueous amino acid solutions.

Table 4.1 Ultrasonic velocity and related parameters for aqueous ,f? -alanine
x = pH of 0.05ndd.lp-alanine; p = density; qs = shear viscosity; u = velocity;
ps = adiabatic compressibility; = classical absorption; Lf = free length;

Table 4.2 Ultrasonic velocity and related parameters for aqueous L-cyestine
12.14 1013.53 0.8348 1519.67 4.272 6.177 0.412
x = pH of 0.05!n.*-?~estine; p = density; qs = shear viscosity; u = velocity; -
pS = adiabatic compressibility; = classical absorption; Lr = free length;
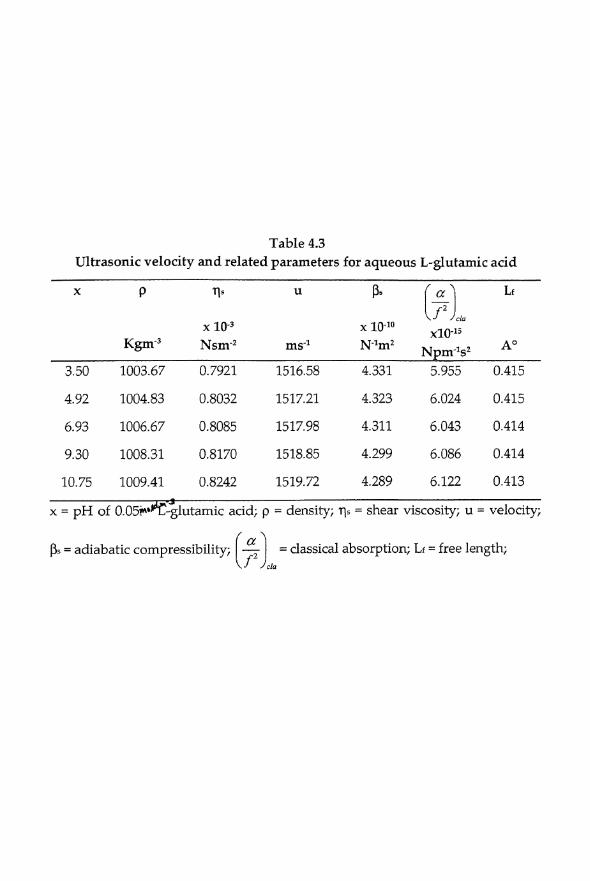
Table 4.3 Ultrasonic velocity and related parameters for aqueous L-glutamic acid
10.75 1009.41 0.8242 1519.72 4.289 6.122 0.413
x = pH of 0.05'ildC~lutamic acid; p = density; qs = shear viscosity; u = velocity;
pS = adiabatic compressibility; = classical absorption; Li = free length;
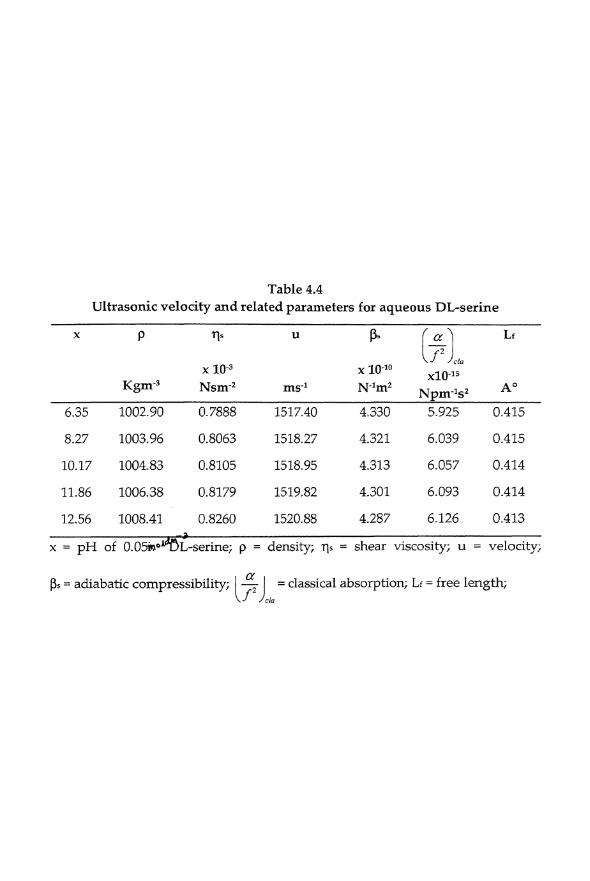
Table 4.4 Ultrasonic velocity and related parameters for aqueous DL-serine
- x = pH of 0.05h~e~-ser ine; p = density; qs = shear viscosity; u = velocity;
pS = adiabatic compressibility; = classical absorption; L,f = free length;

Table 4.5 Ultrasonic velocity and related parameters for aqueous L-tyrosine
x = pH of 0.0&-<~rosine; p = density; T+ = shear viscosity; u = velocity;
p s = adiabatic compressibility; = classical absorption; LF = free length;

Table 4.6 -3
Ultrasonic absorption and related parameters for
MHz Npm-Isz Npm-Is2 s x 10"
6.70 17.04 60.28 1.265 0.934 7.794
12.12 12.38 73.09 2.536 1.286 6.882
x = concentration of amino acid; f r = relaxation frequency; A & B = relaxation amplitudes; s = relaxation time; (ah)rax = absorption per maximum wavelength;
Table 4.7 -3
Ultrasonic absorption and related parameters for 0.05in.f"a*~ueous L-cyestine
pH f, A B T (ck!A)maY
MHZ N P ~ - = S ~ ~ p m - l s ~ s x 104
6.41 18.02 65.23 1.268 0.883 8.911
12.14 12.24 75.68 2.254 1.301 7.038
x = concentration of amino acid; fr = relaxation frequency; A & B = relaxation amplitudes; z = relaxation time; ( a ? b ) ~ ~ = absorption per maximum wavelength;

Table 4.8 - 3 Ultrasonic absorption and related parameters for 0.05 r n ~ k d *
aqueous L-dutamic acid
MHZ ~ p m - l s ~ ~ p m - l s ' s x l o4
x = concentration of amino acid; f r = relaxation frequency; A & B = relaxation amplitudes; z = relaxation time; (ah)3Ta, = absorption per maximum wavelength;
Table 4.9 -3
Ultrasonic absorption and related parameters for 0,05~%"queous DL-serine
pH fr A B % (ah)mm
x 10-l5 x 10-l5 x
MHZ ~ p m - l s ~ ~ p m - ~ s ~ s x l o4
6.35 17.24 59.36 1.105 0.923 7.764
8.27 16.18 63.15 1.365 0.984 7.756
10.17 15.02 64.89 1.597 1.060 7.402
11.86 14.74 66.15 1.959 1.080 7.409
12.56 12.31 68.13 2.158 1.293 6.377
x = concentration of amino acid; 6 = relaxation frequency; A & B = relaxation amplitudes; z = relaxation time; (Oih)max = absorption per maximum wavelength;
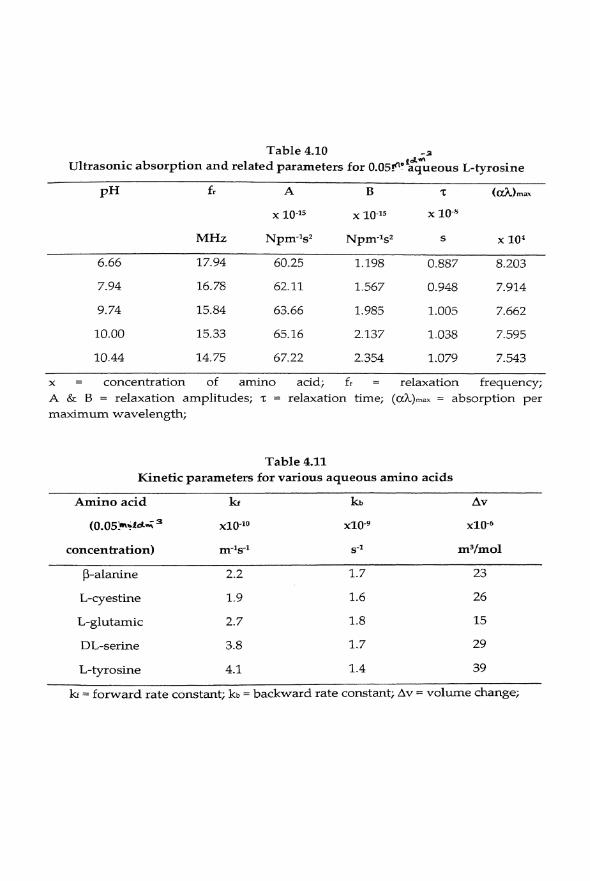
Table 4.10 -3
fara Ultrasonic absorption and related parameters for 0.05r"' aqueous L-tyrosine
pH f r A B 'C (crh)max
MHZ ~ p m - l s ~ ~ p m - l ~ ~ s x lo4
6.66 17.94 60.25 1.198 0.887 8.203
x = concentration of amino acid; f r = relaxation frequency; A & B = relaxation amplitudes; z = relaxation time; ( a h ) m n \ = absorption per maximum wavelength;
Table 4.11 Kinetic parameters for various aqueous amino acids
Amino acid k kb Av
concentration) m-lS-l s-I m3/mol
ki = forward rate constant; kt, = backward rate constant; A v = volume change;
Ctiapt~r Iv 5 l i n l t : ~ Aczdc.. .
REFERENCES:
A. L. iehninger, "Principles oJ Biochemistry" (Worth Pllbiishers Inc.: Ne\\, York)
1984
F. Durn, J . Acoust. Soc. Ind. XI (1983) 6
W. Kauzmann, Adv. Protein Chem 1 4 (1959) 1
C. Tanford, Adv. Protein Chem. 24 (1970) 1
D. Eagland, "Water - A Comprelzens~ve Treaties" Vol. 4 Chap. 5, Ed. F Franks,
(Plenum Press: New York)
C. Tanford, "The hydrop/zobic effect - Formation of micelles and biological membvanes"
(Wiley International: New York) 1973
M. Hussey and P. D. Edmonds, J. Acoust. Soc. Am. 49 (1971) 1907
S. Goto and T. Isemura, Bull. Chem. Soc. Jpn. 37 (1964) 1697
A. Juszluewicz, Achieves of Acoushcs 10 (1985) 151
Wang Jin and Feng Ruo, Ultrasonics 28 (1990) 37
D. Ragouramane and A. Srinivasa Rao, Indian J. Chem. 37A (1998) 659
R. D. White, L. J. Slutsky and S. Pattison, J. Phys. Chem. 75 (1971) 1737
A. P. Sarvazyan, D. I-'. Kharakoz and P. Hemmes, J. Phys. Chem. 83 (1979) 1796
T. K. Nambinarayanan and A. Srinivasa Iiao, Acustica 68 (1989) 218
T. V. Chalikian, D. P. Kharakoz, A. P. Sarvazyan, C. A. Cain, R. J. McGaugh,
I. V. Pogosova and T. N. Gareginian, J. Phys. Chem. 96 (1992) 218

Chapter Iv ,clmino Sczhc. . .
16. kl. V. I?. Rao, M. Atreyi and M. R. Rajeswari, J . Chern. Soc. Faraday Trans.
80 (1984) 2027
17. F. Shahidi and IJ. G. Farrel, J. Chern. Soc. Faraday Trans. 77 (1981) 963
18. M. V. R. Rao, M. Atreyi and M. R. Iiajeswari, J. I'hys. Chem. 88 (1984) 3129
19. C. H. Spink and I. Wadso, J. Chem. Thermodyn. 7 (1975) 561
20. K. P. Prasad and J. C. Ahluwalia, J. Solution Chem 5 (1976) 491
21. S. Cabani, G. Conti, E. Matteoli and A. Tani, J. Chem. Soc. Faraday Trans.
73 (1977) 476
22. J. L,amb, "Physical Acoustics" Vol. I1 Part A, Ed. W. IJ. Mason (Academic Press:
New York) 1965
23. E. L Carstensen and H. P. Schwan, J. Acoust. Soc. Am. 31 (1959) 305
24. S. A. Hawley and F. Dunn, J. Phys. Chem. 50 (1969) 3523
25. L. W. Kessler and F. Dunn, J. Phys. Chem. 73 (1969) 4256
26. M. Hussey and P. D. Edmonds, J. Phys. Chem. 75 (1971) 4012
27. R. Zana and C. Tandre, J. Phys. Chem. 76 (1972) 1737
28. P. R. Strom-Jensen and F. Dunn, J. Acoust. Soc. Am. 75 (1984) 960
29. M. Hussey and P. D. Edmonds, J. Acoust. SOC. Am. 49 (1971) 1309
30. A. K. Holmes and R. E. Challis, J. Chem. Soc. Faraday Trans. 85 (1989) 845
31. D. Grimshaw, P. J. Heyward and E. Wyn-Jones, J. Chem. Soc. Faraday Trans.
69 (1973) 756

CF.apte: i'v Arnlno Acidi.. .
32. G. ~avichandran, "Acoustical studies on salute-solver7t interactlous it-r irqueorls a ~ ~ d non-
aqueoi~s solutions" Ph. D. Thesis (1993) Pondicherry University, Pondicherry, India
33. D. W. Marquardt, J. Soc. Ind. Appl. hlath. 11 (1963) 431
34. J. Kavanau, "Water and Solute - Water interacfiorrs" (Holden - Day Inc.:
Amsterdam) P. 11 (1964)
35. M. J . Blandamer "lntroducfion to Chemical Ulfrasorzics" (Academic Press. London)
(1 973)
36. A. K. Holmes and R. E. Challis, J. Chem. Soc. Faraday Trans 88 (1992) 443
37. K. Applegate, L. J. Slutsky and R. C. Parker, J. Am. Chem. Soc. 90 (1968) 6909