ultralo-1800 alpha particle counter
TRANSCRIPT
XIA LLC
UltraLo-1800 Alpha Particle Counter User’s Manual
Version: 0.3
May, 2013
UltraLo-1800 Alpha Particle Counter
[email protected] XIA LLC Page 2
Contents I. Conventions of the Manual................................................................................................................... 5
II. Theory of Operation .............................................................................................................................. 6
A. Operation of the UltraLo-1800 ......................................................................................................... 6
1. Synopsis......................................................................................................................................... 6
2. Electrostatic Description of the UltraLo-1800 .............................................................................. 8
3. Signal Generation .......................................................................................................................... 9
4. Necessary Assumptions .............................................................................................................. 12
B. Secondary Veto Channel ................................................................................................................. 13
1. Rejection ..................................................................................................................................... 13
2. Counting Efficiency ..................................................................................................................... 13
3. Induction ..................................................................................................................................... 14
C. Comparison to Gas Proportional Counters ..................................................................................... 15
D. Remaining Background Sources in the UltraLo-1800 ..................................................................... 17
1. Cosmogenics ............................................................................................................................... 17
2. Radon .......................................................................................................................................... 19
3. Undersized samples .................................................................................................................... 22
4. When backgrounds become important ...................................................................................... 22
III. Sample Handling ............................................................................................................................. 23
A. Standard Good Practices ................................................................................................................. 23
B. Interactions Between Sample Handling and Results ...................................................................... 23
C. Radon .............................................................................................................................................. 23
D. Cleaning Procedure ......................................................................................................................... 24
1. Thorough ..................................................................................................................................... 24
2. Quick ........................................................................................................................................... 24
IV. System Overview............................................................................................................................. 25
A. Components .................................................................................................................................... 25
1. Complete System ........................................................................................................................ 25
2. Counting Module ........................................................................................................................ 26
3. Support Box ................................................................................................................................. 28
B. Requirements and Specifications .................................................................................................... 29
C. Counter Manipulations ................................................................................................................... 30

UltraLo-1800 Alpha Particle Counter
[email protected] XIA LLC Page 3
1. Adjusting the Tray Height ........................................................................................................... 30
2. Opening the Counter .................................................................................................................. 30
3. Removing a Side Panel ................................................................................................................ 31
4. Opening the Support Box ............................................................................................................ 31
5. Opening the Electronics Box ....................................................................................................... 31
V. Maintenance/Calibration .................................................................................................................... 32
A. Calibration ....................................................................................................................................... 32
B. Weekly Maintenance ...................................................................................................................... 32
C. Monthly Maintenance .................................................................................................................... 32
D. Annual Maintenance ....................................................................................................................... 32
VI. CounterMeasure ............................................................................................................................. 33
A. Application Overview ...................................................................................................................... 33
1. Main Panel .................................................................................................................................. 33
2. Analysis Panel .............................................................................................................................. 38
3. Diagnostic Panel .......................................................................................................................... 40
4. Measurement History ................................................................................................................. 42
5. Start Run Dialog .......................................................................................................................... 44
6. Options Dialog ............................................................................................................................. 46
7. Firmware Update Dialog ............................................................................................................. 47
B. Common Interactions ..................................................................................................................... 48
1. Tooltips........................................................................................................................................ 48
2. Zoom and Pan ............................................................................................................................. 49
3. Splitters ....................................................................................................................................... 50
C. Making a Standard Measurement .................................................................................................. 51
1. Measurement Flowchart ............................................................................................................. 51
2. Detailed Description ................................................................................................................... 52
D. Generated Files ............................................................................................................................... 54
1. Buffers ......................................................................................................................................... 54
2. Logs ............................................................................................................................................. 54
3. Parameters .................................................................................................................................. 54
4. Exports and Reports .................................................................................................................... 55
VII. Troubleshooting .............................................................................................................................. 57
UltraLo-1800 Alpha Particle Counter
[email protected] XIA LLC Page 4
A. General Steps .................................................................................................................................. 57
B. Noise Debugging ............................................................................................................................. 57
C. CounterMeasure Troubleshooting.................................................................................................. 59
1. Can’t Start a Run ......................................................................................................................... 59
2. Status Icons Red .......................................................................................................................... 59
3. CounterMeasure is Frozen .......................................................................................................... 59
D. Counting Issues ............................................................................................................................... 60
1. Can’t Connect to Counter ........................................................................................................... 60
2. Counting Stops During Measurement ........................................................................................ 60
3. Noise on Traces ........................................................................................................................... 61
4. Excessively High Sample Emissivity ............................................................................................. 61
5. No Alphas .................................................................................................................................... 61
6. No Events .................................................................................................................................... 63
7. Excess Events .............................................................................................................................. 63
8. Non-Alpha Events ........................................................................................................................ 65
9. Large Drop in Emissivity During a Run ........................................................................................ 65
VIII. Alpha Analysis Engine ..................................................................................................................... 66
A. Introduction .................................................................................................................................... 66
B. Overview ......................................................................................................................................... 66
C. Classifications .................................................................................................................................. 67
IX. Counting Various Sample Types ...................................................................................................... 69
A. Undersized Samples ........................................................................................................................ 69
B. Dielectrics ........................................................................................................................................ 69
C. Thick Samples .................................................................................................................................. 69
D. Bulk Sources .................................................................................................................................... 70
E. Tiling Samples ................................................................................................................................. 71
X. Appendix ............................................................................................................................................. 72
A. Counter Efficiency ........................................................................................................................... 72

UltraLo-1800 Alpha Particle Counter
[email protected] XIA LLC Page 5
I. Conventions of the Manual Before covering any technical issues, there are a few conventions used in this manual that should be
discussed.
First, when discussing interaction with the software, “click” will always mean “left-click”. Whenever
right-clicking is required, it will be denoted “right-click”. Additionally, when discussing the software
interface, menu names will be in italics, such as File, and options under the menu will be in quotations:
“Exit”.
In the Theory of Operation section, important new terms will be in bold: anode. This is to distinguish
them as terms that will be reused.
The manual has frequent references to other sections, these references will be actively linked (so
clicking on them in the PDF will take you to the correct section), and will be bolded and in light blue:
Theory of Operation. In contrast, hyperlinks that will open an e-mail client or internet browser are, per
the normal convention, underlined and in blue: [email protected]. Finally, references to figures aren’t
distinguished from normal text, but will link to the figure.

UltraLo-1800 Alpha Particle Counter
[email protected] XIA LLC Page 6
II. Theory of Operation
A. Operation of the UltraLo-1800
1. Synopsis
The diagram of the UltraLo-1800 in Figure II-1 shows its major components. It is basically a
specialized ionization counter comprising an active volume filled with argon, a lower grounded
electrode that is a conductive tray holding the sample (called the sample tray) and an upper pair of
positively charged electrodes. Of these two electrodes, the anode sits directly above the sample, while
the guard electrode surrounds and encloses the anode. Both electrodes are connected to charge-
integrating preamplifiers whose output signals are digitized and then processed by a digital pulse shape
analyzer.
An alpha particle emitted from the sample (αs) creates an ionization track of argon ions and
electrons. As the electrons drift in the counter's electric field, they induce a time varying charge on the
anode that is seen as a current by the preamplifier, which integrates it to produce an output pulse that
is digitized and then analyzed to extract its risetime, amplitude and shape. Similarly, ionization tracks
produced by alpha particles emanating from other counter components (e.g. the anode (αa) and the
sidewalls (αw)) also produce digitized output pulses in the anode or guard processing channels or both.
The UltraLo-1800's geometry is designed specifically so that the output pulses associated with these
different points of alpha particle emanation are substantially different – having, specifically, different
risetimes, amplitudes and shapes. The UltraLo-1800's analysis software uses this shape information to
Figure II-1: Schematic overview of the UltraLo-1800.

UltraLo-1800 Alpha Particle Counter
[email protected] XIA LLC Page 7
reject all pulses except those from alpha particles emanating from the sample. This method allows the
UltraLo-1800 to approach “zero background” measurements.
The following sections will examine these processes in detail: how the signals are induced, what the
location-dependent characteristic shapes are, and how the pulse shapes are analyzed. Using this
information, we will then also examine two related topics: what the sources of residual background are
and when they need to be considered; and how to tell when the counter is not working properly and
troubleshooting is required. Finally, we will review counting statistics as they pertain to UltraLo-1800's
ability to provide estimates of the accuracy of its reported measurements.
Before moving on, we would like to re-emphasize the extremely strong correlation between output
pulse shape and point of alpha particle emanation within the counter. In particular, this correlation
leads to a shorthand verbal notation wherein we regularly refer to “a pulse resulting from an alpha
particle (or ‘alpha’ for short) emanating from the sample” as a “sample pulse”, thereby contrasting it
with “ceiling pulses” and “sidewall pulses”, whose initiating alphas emanated from the electrodes and
sidewall, respectively. To avoid confusion, pulses in the anode and guard processing channels will be
referred to as “anode” and “guard” pulses.

UltraLo-1800 Alpha Particle Counter
[email protected] XIA LLC Page 8
2. Electrostatic Description of the UltraLo-1800
To understand how the UltraLo-1800 works we start with a description of its active volume. As
shown in Figure II-2, the active volume is set up as two parallel conductive plates separated by distance
D. The top plate, called the electrode, is held at positive voltage (denoted V throughout), which is
typically 1000 V. The bottom plate, called the sample tray, is held at ground potential and holds the
sample to be measured. This arrangement produces an electric field (E) between the plates that has the
value V/D. The volume between the plates is filled with a high-purity counting gas, in this case argon.
Finally, the sides of the chamber, called the sidewalls, hold the fieldshapers, which are PCBs containing
strips of copper separated by resistors that keep the electric field lines parallel throughout the volume.
Suppose a radioactive isotope on the sample tray decays, emitting an alpha particle in a random
direction. In Figure II-2 it leaves the atom and is stopped in the gas after traveling some distance. This
distance is called its range and is a function of both the alpha particle’s energy and the specific gas
species. As the alpha particle travels through the gas it loses energy by ionizing the gas molecules,
producing a track of ion-electron pairs. The range and number of pairs (N) created in the gas increase
with energy of the alpha particle. Being charged, these ions and electrons drift in the applied electric
field, the electrons toward positive voltage on the electrode, the ions toward the tray. Each drifts with a
velocity equal to its mobility (μ) in the gas times the electric field, or: ⁄ (where the
subscript “e” indicates “electron”, and “i" would indicate “ion”). The mobility of electrons is thousands
of times higher than that of ions, thus they drift to the electrode faster than the ions drift to the tray.
How long does this take? If the electron is freed a distance d away from the electrode (as in Figure II-2),
its drift time is d/ve seconds, or . When d is the height of the entire chamber, D=15cm,
and V=1000V, then te is found to be approximately 70 μs in argon.
Figure II-2: Schematic overview of the important parts of the UltraLo-1800's active volume.

UltraLo-1800 Alpha Particle Counter
[email protected] XIA LLC Page 9
All of the electrons in the track drift at the same velocity, so the initial geometry is preserved from
the moment it is created (t0) until the first electron reaches the electrode (tS), as shown in Figure II-3.
(There is some diffusion of electrons out from the track, but for our purposes this effect is negligible). As
the track continues to drift, the electrode absorbs the electrons as they arrive, until they’re all absorbed
(tR). The time between t0 and tR is called the risetime.
3. Signal Generation
As an electron moves toward the electrode it induces a current in the attached electronics. This may
be understood through Gauss’s Law, which states that the net electric flux through any closed surface is
proportional to the enclosed electric charge. Because the electrode is a conductor it does not support
internal electric fields, all external fields must terminate at its surface, which implies a net flux and, by
Gauss’s Law, the presence of charge on its surface. Further, any changes in the flux imply a change in the
charge present on the surface and therefore imply current in the circuitry connected to the electrode
that is proportional to the rate change of flux. This means that as the electron drifts toward the
electrode it induces a current in the attached electronics (this is also known as the Shockley-Ramo
theorem). This induction only happens while the electron is traveling; once it reaches the electrode its
electric field disappears, the changing flux goes to zero, and therefore the induced current goes to zero.
Figure II-3: The location of the electron track at the 3 important times.

UltraLo-1800 Alpha Particle Counter
[email protected] XIA LLC Page 10
In the UltraLo-1800, tracks consist of hundreds of thousands of electrons, how do many electrons
drifting at once behave? In that case the total observed current is the sum of the individually induced
currents. If the track isn’t parallel with the electrode, (and in general it won’t be), some electrons in the
track will induce current for longer than others, and once the track begins to hit the electrode (at tS) the
rate of induction slows. The rate at which induction slows will be proportional to the angle of the track
relative to the electrode; the further from parallel the longer it will take to slow. This slowing shows up
as a rounding of the pulse from tS to tR, as can be seen in Figure II-4.
What do these induced signals look like? In the UltraLo-1800 the electrode is connected to a charge-
sensitive preamplifier that integrates the current. The preamplifier outputs a signal (in volts) that is
proportional to the total current induced. As discussed above, for a track originating on the sample (α1
in Figure II-5) there are two distinct regions in time: one from t0 until ts where the electrons drift
unchanged, and another from ts until tR where the electrons are disappearing linearly in time. The
resultant integrated signal Ss(t) is thus linear until ts and then parabolic until tR, the chamber’s maximum
transit time:
( )
( )
( )
(
( )
( ))
where Cf is the detector capacitance, e is the charge of an electron, and:
(
)
where ds is the distance from the topmost electron of the track to the electrode (Figure II-5).
Figure II-4: Example of an alpha pulse. The anode is in red, the guard is in blue. The three lines are the three important times, from left to right t0, tS, and tR. Note the rounding between tS and tR.

UltraLo-1800 Alpha Particle Counter
[email protected] XIA LLC Page 11
The resultant pulse is shown in Figure II-4. Note that SsMAX scales with N, so that the final pulse
amplitude is proportional to the energy of the alpha particle.
However, when a uniform charge track originates from the electrode, charge starts disappearing
linearly in time immediately, so that the resultant signal Sa(t) is a parabola given by:
( )
(
( )
)
The risetime ta and maximum amplitude SaMAX are found to be:
da being the track length normal to the electrode.
The important lesson to be drawn from this comparison of the two track types is that electrode
pulses look different from sample pulses. Both the risetime and the maximum amplitude are much
longer for sample pulses. Because the ratio of electrode to sample risetimes (ta/tR) is da/D, if the sample
chamber is made several times the maximum range of an alpha particle, then the risetimes of the two
cases will always be separated. The UltraLo-1800 is designed so this ratio will be about 1/3 for a 5 MeV
alpha particle emitted perpendicular to the anode. Similarly, the ratio of maximum amplitudes
(SaMAX/SSMAX) for two identical alpha decays is ( ). This ratio is dependent on the angle of
emission relative to the anode, but it will always be greater than or equal to the ratio between
risetimes. Since D has already been chosen to exaggerate the difference in risetimes, the difference in
amplitudes is exaggerated as well. Being able to differentiate pulses based on their risetime and
amplitude is a key feature of the UltraLo-1800.
Figure II-5: Demonstration of important distances in the UltraLo-1800's active volume.

UltraLo-1800 Alpha Particle Counter
[email protected] XIA LLC Page 12
4. Necessary Assumptions
There are several assumptions that we must make in order for our model to accurately describe the
physical counting system:
The first is that the electron drift speed is both uniform and known. Because electron mobility
changes with the type of counting gas, so does the drift speed. Further, it can also change by significant
amounts if the counting gas isn’t pure (e.g. concentrations of water of only 100 ppm can decrease
risetimes significantly). By selecting the correct operating gas in CounterMeasure and purging for
adequate amounts of time these assumptions should always be met (unless the material being counted
is itself a source of water vapor, see No Alphas).
We also assume that the charges are free to drift all the way across the active volume. This
assumption can break down if there are significant amounts of oxygen in the active volume, since O2 has
a high electron affinity. As above, adequate purging also makes this condition easy to satisfy.
A third assumption is that the electric field is uniform, which is guaranteed by the design of our
active volume, but can be perturbed if, for example, materials with significant height or very high
resistivity are placed on the sample tray (see Counting Various Sample Types).
Finally, when we report energies we assume that all alpha energy is expended in the gas. If the alpha
isn’t emitted from the sample’s surface (surface emission) and passes through some amount of material
before entering the active volume, then its energy will be reduced by some unknown amount. Because
it’s impossible to know how much material an alpha passed through we cannot correct for this.
However, bulk sources (as these kinds of samples are called) show certain behaviors that are
understood, see Bulk Sources for more information.

UltraLo-1800 Alpha Particle Counter
[email protected] XIA LLC Page 13
B. Secondary Veto Channel
1. Rejection
The second key design feature that allows the UltraLo-1800 to be “zero-background” is its veto, or
guard electrode. The electrodes are arranged as shown in Figure II-2 and are read out simultaneously,
with the interior, active portion called the anode, and the exterior portion called the guard. As can be
seen from Figure II-6, tracks originating on the counter sidewalls or on the tray outside the sample
region will induce signals on the guard and can be rejected. When combined with the risetime
discrimination discussed earlier, we are capable of rejecting events that originate on any surface other
than the sample.
2. Counting Efficiency
Because the direction of emission of an alpha is random, some events that originate near the
boundary of the electrode, but still on the sample, may be rejected because part of their track crosses
the boundary (see α4 in Figure II-6). The end result is that the UltraLo-1800 has a counting efficiency
that is less than 100%, and decreases with increasing energy (higher-energy alphas have longer track
length, and longer track lengths are more likely to cross the boundary). We have calculated this
efficiency loss both directly and with Monte Carlo simulations, and take it into account when calculating
an emissivity with CounterMeasure. For a 6 MeV alpha particle the overall efficiency in the 707 cm2
configuration is about 85%, and in the 1800 cm2 configuration it is about 90%. When we report
emissivities they take this correction into account, see Emissivity Value for more details. For a table
showing the correction values, see Counter Efficiency.
Figure II-6: Alphas originating from various locations in the counter and their resulting pulses. α1 shows a sample alpha, α2 shows a ceiling emission, and α3 shows a sidewall emission, and α4 shows a sample alpha that travels under the guard. The anode pulse is shown in red, the guard in blue.

UltraLo-1800 Alpha Particle Counter
[email protected] XIA LLC Page 14
3. Induction
The final phenomenon resulting from the split electrode is what we call charge induction (also
called Ramo induction). A pulse with significant charge induction is shown in Figure II-7. When electrons
drift near the boundary between the two electrodes, they will induce some charge on both electrodes,
even if they’re entirely located under only one. But as they move closer to the electrodes, that induction
will diminish and eventually disappear, except on the electrode where the electrons are finally collected.
This phenomenon is a result of the physics discussed in Signal Generation. When the charges are far
away the flux they cause on the surface of the electrodes is spread over a wide area. As they drift closer
this area decreases. If this area is initially shared by both electrodes, as it diminishes the rate change in
flux (and, by the Shockley-Ramo theorem, the induced charge) will itself change, increasing on one
electrode and decreasing on the other. The result is a pulse on the collecting electrode that has the
same final height as it would if it originated far from the boundary, but with significantly more curvature
in its rising edge, while the signal on the other channel will be at the same level at the beginning and the
end but with a significant bump that falls directly under the curved portion of the other trace. Our
algorithm looks for these signatures, and when we find them, we perform add-back, a specialized
procedure designed to provide a more accurate estimation of risetime and energy, and thus a more
accurate classification of the pulse.
Figure II-7: Pulse with significant induction. Note the negative curvature on the anode (red) and the hump on the guard (blue). The yellow line is the “add-back” trace, discussed in the text.

UltraLo-1800 Alpha Particle Counter
[email protected] XIA LLC Page 15
C. Comparison to Gas Proportional Counters As previously mentioned, the UltraLo-1800 is an ionization counter and most other low-rate, large-
area alpha counters are proportional counters. There are some important differences between the two,
and if you’re familiar with proportional counters some, but not all, of that familiarity will be able to
transfer over.
First we’ll look at similarities. Both types of counters are filled with inert gas, both use the electron-
ion pairs formed by alpha particles, both use electrodes to collect the signal, and the pulse processing
equipment is largely similar.
The main difference is the electric field in the counter. For ionization counters the field’s value stays
fairly low and is uniform (the UltraLo-1800’s field is around 66 V/cm) while gas proportional counters
have fields high enough to create electron avalanches. An electron avalanche occurs when drifting
electrons accelerate to energies high enough to create electron-ion pairs themselves. The created
electrons can then accelerate and create more pairs, causing an “avalanche” of electrons. In
proportional counters this process is called gas multiplication. To create avalanches proportional
counters typically have an anode composed of thin wires, this creates a region of very high electric field
close to the wire, which is called the multiplication region.
These small changes have large practical consequences. The most immediately obvious is that the
proportional counter has a large internal gain, and so the resulting signals are much larger and easier to
process. This means less electronic noise and fewer design constraints on detector parts such as
preamplifiers. The higher noise and more difficult design for ionization counters is why proportional
counters were long the favored device for low-rate, large-area counting.
However, the tradeoff for this internal gain is that proportional counters lose any information about
where the pulse originated. Pulses from the counting tray look the same as those from the sidewalls, the
ceiling, even the electrode wires themselves. This is because the vast majority of the signal comes from
the time between the first electrons of a track entering the multiplication region and the final
multiplication ending. The duration of that signal is only dependent on the orientation of the track
relative to the anode wires, and not on where the track originated in the detector. (See Figure II-8 for a
Figure II-8: Events and the resulting pulse from a proportional counter. All events result in the same pulse shape.

UltraLo-1800 Alpha Particle Counter
[email protected] XIA LLC Page 16
graphical depiction.) This means that pulses produced by a proportional counter contain no information
about the pulses’ point of origin in the detector, while an ionization counter’s pulses do. As discussed
earlier, knowing where pulses originate enables you to reject those which do not originate from the
sample. This fact allows the UltraLo-1800 to have a significantly lower intrinsic background than a
proportional counter made of similar materials.
In short, the important difference between the gas proportional counter and the ionization counter
in this context is that the ionization counter has poorer signal-to-noise, but saves information about
where pulses originated in the detector.

UltraLo-1800 Alpha Particle Counter
[email protected] XIA LLC Page 17
D. Remaining Background Sources in the UltraLo-1800 While the UltraLo-1800 is capable of filtering out pulses originating from its various internal surfaces
(and is in that sense “zero-background”) there still remain several known sources of rarer events that
produce traces that our software classifies as sample alphas but that do not originate from the sample.
Thus these sources contribute to a background rate that we presently estimate to be about 0.0005
counts/hr/cm2 in the UltraLo-1800 (for a counter at sea level with no significant overhead shielding). The
following background sources are under active R&D at XIA, see our website for more details.
1. Cosmogenics
Historically, ionization counters were most commonly used for measuring fluxes of cosmic radiation,
and we’ve discovered that the UltraLo-1800 still works for that purpose. Early on in the development of
the detector we observed pulses that didn’t look quite like alphas. While alpha pulses will have some
rounding at their peak (due to the absorption of the electrons into the electrode), the rounding
observed on these pulses was much more significant (see Figure II-9). We created a new class of pulse
(the “round”) in order to separate them out while we pursued their origins. From early on we suspected
they were caused by cosmic rays, but proving it experimentally was difficult. The reason we suspected
cosmic rays is that in order to observe a very rounded peak the ionization track would need to be very
long, but in order to deposit energy equivalent to a 1-5 MeV alpha particle it would have to have a fairly
high dE/dx. Alpha tracks are too short and dense, and beta and gamma rays are far too weak. This leaves
some kind of cosmic ray, most likely a light baryon such as a proton.
A recent experiment conducted by XIA [talk available online] showed a strong dependence between
elevation/depth and observed round rate. These findings clearly indicated that rounds are indeed
caused by cosmogenics.
While we can identify and filter out cosmogenic events with some efficiency a few will still pass
through our analysis and show up as alphas, particularly at low alpha energies where our signal-to-noise
Figure II-9: A "Round" pulse. Note the extremely large time between tS and tR (second and third lines, respectively). The anode is shown in red, the guard in blue.
UltraLo-1800 Alpha Particle Counter
[email protected] XIA LLC Page 18
ratio is worse. It is difficult to precisely measure this probability because of the inherent difficulty in
disentangling cosmogenics from true low-energy alphas. This difficulty is compounded by the fact that
the magnitude of the effect can vary greatly between different locations, with altitude, shielding
provided by building materials, and other factors contributing. Additionally the different electrode
configurations will see different rates. This is because the 707 cm2 configuration has a much smaller
solid angle that a cosmic ray could pass through without leaving energy on the guard compared to the
1800 cm2 configuration. The difference is greater than the difference in area alone, and therefore the
707 cm2 configuration sees fewer rounds. We can say that at XIA (which is at about sea level with no
special shielding) we see approximately 8 rounds per hour in the 1800 cm2 configuration, and that only a
small percentage of those can make it through our analysis (about 5%), which leads to a background
rate of about 0.0002 counts/hr/cm2. Additionally, virtually all of these are low-amplitude events, below
3.5 MeV. There are no common isotopes that emit alpha particles of that energy, so pulses in that range
can only be produced by bulk decays or rounds. Therefore this background can be virtually eliminated by
providing a stringent energy cut at around 3.5 MeV if one is only interested in surface activity.
Finally, it’s important to note that a cosmogenic background will be present in any gas-filled
counter, including proportional counters. And, as noted earlier, in proportional counters they cannot be
identified by shape as all pulses have the same shape.

UltraLo-1800 Alpha Particle Counter
[email protected] XIA LLC Page 19
2. Radon
The other source of background in the UltraLo-1800 is radon gas. Radon is a noble gas, and as such
is nonreactive and capable of diffusing some distance through materials (especially plastics). It’s also
radioactive (in fact, it’s the second-leading cause of lung cancer in the US). These two properties
combine to make it a pernicious source of background in any counting experiments. There are two
common isotopes of radon, 220Rn (also called “thoron” because it comes from the 232Th chain) and 222Rn
(sometimes the word “radon” is used solely in reference to this isotope, but as this is potentially
confusing in this manual “radon” will always mean the element with no specific isotope implied). The
decay chains of both are shown in Figure II-10. The two chains have very distinct alpha-decay energies,
and their spectra in equilibrium are shown in Figure II-11. Outside of equilibrium one or more of the
peaks may be missing, depending on conditions. A spectrum with a peak in any of those locations is
generally indicative of some kind of radon contamination on the sample.
In the UltraLo-1800 radon can show up in two different ways: in the “ongoing exposure” case, by
being continuously present in the counting gas itself; or in the “terminated exposure case” by decaying
Figure II-10: Decays series of
222Rn (top) and
220Rn (bottom).

UltraLo-1800 Alpha Particle Counter
[email protected] XIA LLC Page 20
near a sample and contaminating it with its daughter isotopes prior to insertion of the sample into the
Ultra-Lo, which “terminates” the exposure. The two cases can be distinguished with relative ease, since
all of radon’s daughters are either short-lived or very long-lived. If the exposure was terminated prior to
inserting the sample in the counter (case 2) there will be a distinctive drop in the emissivity through the
run (see Figure II-12). In contrast, in the ongoing exposure case no such drop will occur. Exposure prior
to measurement can be easily dealt with by simply waiting for the isotopes to decay (which takes a few
hours for 222Rn and several days for 220Rn). However, the problem of radon in the active volume has no
easy fix.
How does radon get into the active volume? There are many possible sources of exposure, including
the reservoir of counting gas, the tubing leading the gas into the counter, diffusion in through the
counter walls, or generation from minute 232Th/238U contamination in the materials of the counter.
Figure II-11: Simulated spectra from radon as they appear in the UltraLo-1800 based on the terminated exposure case. Given the purge time and measurement windows, some peaks aren’t apparent.
220Rn (left) has small peaks at 6 and 8.6 MeV. These are small because of the split decay of
212Bi. The other decays in the chain are too fast to see through a purge.
222Rn (middle) has similarly-sized peaks at 6 and 7.7 MeV. As before, some
peaks are not visible because of the purge, but additionally 210
Po is not shown because of the long half-life of 210
Pb. A peak at 5 MeV is a giveaway for
210Pb contamination in a sample, but that is a separate problem. Finally, there’s a combined spectrum (right).
Figure II-12: A run with significant terminated radon exposure. Note the similarities to the simulated combined spectrum above.

UltraLo-1800 Alpha Particle Counter
[email protected] XIA LLC Page 21
Radon in the counting gas gives rise to a very specific signal. First, the decay of the radon atom itself
occurs anywhere within the volume with equal probability. Because of the geometry of the counter,
most of the resulting tracks will have a risetime shorter than a typical alpha and longer than a typical
ceiling event. We call these events “mid-airs”, and they form a band of increasing energy and risetime
that spans between events that occur just off of the electrodes to events that occur right next to the
tray (see Figure II-13). Some of these radon decays will have similar risetimes as alphas and thus be
classified as alphas (after all, they are alpha decays occurring near the sample tray). We can estimate
this rate, and it’s about 0.00025 alphas/cm2/hr in the Full configuration. The innate background will not
change over time or between different environments if the counter is set up and maintained correctly.
(Counters have been run in underground labs with external radon activities of over 500 Bq/m3 with no
increase in midairs.) If you see more activity than around 5 midairs per hour, see Excess Events.
Finally, because thoron has a precise decay chain and every alpha decay has a specific energy, any
signal from thoron will create a specific spectrum. For an example of how this looks in the UltraLo-1800,
see Figure II-12. The rate of thoron decay in the chamber is so low that this spectrum takes many days to
appear and will only be noticeable with very low-count samples. However, familiarity with this spectrum
(and the spectrum of 222Rn, also shown in Figure II-11) could help diagnose other forms of radon
contamination, such as emission from a sample or terminated contamination.
Figure II-13: The “band” of midairs (black), starting from ceilings (red) and going toward alphas (blue). There are a number of midairs outside this band that are caused by other phenomena, most are likely misclassified cosmogenics (green). At low energy the timing parameters separating rounds and midairs become difficult to determine accurately.

UltraLo-1800 Alpha Particle Counter
[email protected] XIA LLC Page 22
3. Undersized samples
The design of the UltraLo-1800 assumes that the entirety of the area underneath the anode is
occupied by the sample. If that area isn’t fully occupied, the exposed tray’s activity will be equivalent to
a background. In this case all of the normal background subtraction methods can be used. If you’re
unfamiliar, the idea behind background subtraction is to subtract the number of counts you’d expect the
tray to emit, on average, from the total observed counts, leaving behind only counts from the sample.
The equation for background subtraction that’s pertinent to the UltraLo-1800 is:
(
⁄ )
And the error is:
√( )
( ( ⁄ ))
Where is the measured emissivity that is being corrected, is the background emissivity, is
the area of the sample, is the total area (either 707 or 1800 cm2), and is the error in a given
emissivity measurement. Taking a background immediately before or after the sample measurement is
best, and it should have as small an error as feasible to minimize the error in the background-subtracted
emissivity.
4. When backgrounds become important
Our best estimate of the total background in the UltraLo-1800, at sea level, is about 0.0005
alphas/cm2/hr. As long as the emissivity of a sample is significantly above this number (say around 0.005
or higher) then the background can be safely ignored as it will only have a minor impact on the final
results. But as sample emissivity gets lower the fact that these backgrounds exists becomes more
important. At ultra-low emissivity values (below ~0.002) the background is a large contribution to the
measured emissivity and its existence must be taken into account. Unfortunately, because the
background will vary between individual counters and different locations (due to small differences in
material construction, elevation, and overburden), we cannot provide an exact estimate of the
background, and it will need to be inferred from the behavior of the counter over time.
There are some estimates we can make, however. Based on the counter geometry, for every 6
midairs there will be about 1 that gets classified as an alpha. The estimate for rounds is more difficult,
but based on experiments with a previous generation of counter, for every 20 rounds there will be
about 1 misclassified as an alpha. This means that if a two-day run in the 707 cm2 configuration has 31
alphas, 42 midairs, and 100 rounds, we’d expect its true alpha count to be 31-42/6-100/20 = 19. This
changes its emissivity from 0.00091 (ignoring the corrections due to Counter Efficiency) to 0.00056
alphas/cm2/hr. Keep in mind that there is substantial uncertainty in these estimates, so this will increase
the error significantly.

UltraLo-1800 Alpha Particle Counter
[email protected] XIA LLC Page 23
III. Sample Handling
A. Standard Good Practices There are several practices that will help minimize contamination of your samples and ensure that
your results are as accurate as possible. Most are straightforward prescriptions any lab can follow, a few
require specialized equipment. The most important thing you can do to ensure cleanliness is to think
about cleanliness.
Keep samples covered whenever possible. This helps minimize radon contamination (see
Radon)
Only handle samples with clean instruments. Clean instruments are free from debris and are
regularly washed (for recommended washing procedure, see Cleaning Procedure).
Keep hands gloved at all times, even when not handling samples directly. Use only powder-
free gloves. At XIA we use powder-free blue Nitrile examination gloves.
Regularly clean instruments and tray surfaces, as well as anything else that comes into
contact with samples.
If available, store samples in glovebox or other purged container, particularly before
counting. If a purged container is not available, a sealed or covered container is best.
B. Interactions Between Sample Handling and Results In all but the cleanest of environments, more sample handling means more contamination. Because
of this it’s best to handle samples as little as possible. In addition, more exposure to atmospheric air will
lead to more contamination with radon (as discussed below). For these reasons, it’s incredibly important
to handle samples as little as possible, store them in as clean of an environment as possible (either a
purged box or a sealed container), and move them from their storage location into the counter as
expeditiously as possible.
C. Radon Radon and its effects on the UltraLo-1800 are discussed in depth in Radon. In terms of sample
handling the most important thing to know about radon is that the contamination on a sample is
proportional to the radon concentration in the environment around the sample and the size of the air
column above it. While radon can diffuse through many materials, including most plastics, the actual
range is quite small. This means that simple measures can prevent much contamination, and protecting
samples from radon can be as simple as sealing them in a Ziploc bag. More extensive measures, such as
chambers under constant N2 purge, can be even more effective, but as long as the sample isn’t exposed
to high levels of radon for extended periods of time the contamination will be minimal. For a detailed
treatment of this topic, see The Effects of Exposing Samples to Room Air.

UltraLo-1800 Alpha Particle Counter
[email protected] XIA LLC Page 24
D. Cleaning Procedure There are two types of cleaning procedures we use at XIA while working with the UltraLo-1800, a
quick and a thorough clean. Quick cleans are used when there’s minor contamination of a sample or
handling instrument, whereas thorough cleans are used for major contamination and for routine
precautionary cleaning. All cleans should be done using lint-free clean wipes, which are very important
(an example of lint-free wipes is here). If the wipes leave behind residue the cleaning procedure could
be actively harmful, so using lint-free is essential.
1. Thorough
The thorough clean is designed to eliminate radioactivity on the sample. (Here “sample” refers to
whatever is being cleaned, not necessarily something being measured in the UltraLo-1800.) The first
step is a liberal rinse with Radiacwash, an anti-radioactivity cleaning formula from Biodex (available
here). Radiacwash contains mild acids and will slightly etch some metals, including copper. After several
moments remove the Radiacwash with distilled or deionized water, using enough to ensure that all of
the Radiacwash has been swept away. Finally, rinse with alcohol (at XIA we use methanol for its
exceptionally fast evaporation, but isopropanol will work as well). Note that this procedure can be done
without wiping the sample at all, but wiping with clean wipes can help spread or remove the various
liquids. However, if there is concern about keeping the surface of the sample pristine, using only the
liquids will still provide effective cleaning. For information on the results of this cleaning, see The Effects
of Exposing Samples to Room Air.
2. Quick
If a sample or instrument needs a simple cleaning then a rinse with alcohol and rubbing with a clean
wipe is often sufficient. This quick wash should be used regularly on instruments (such as tweezers) to
minimize cross contamination. In addition, the tray (or any covering) should be frequently washed (e.g.,
weekly) with this method.

UltraLo-1800 Alpha Particle Counter
[email protected] XIA LLC Page 25
IV. System Overview
A. Components
1. Complete System
1. Counting Module: The main body of the UltraLo-1800.
2. Support Box: Houses several necessary components that are separated from the counter for
noise reasons.
3. Rigid Gas Tube: Connects Support Box gas output to Counting Module gas input.
4. Control Laptop: Communicates with the UltraLo, takes and stores data (not shown).
5. 3/8” Hex Key: For opening the Counting Module (not shown).

UltraLo-1800 Alpha Particle Counter
[email protected] XIA LLC Page 26
2. Counting Module
Side View (Panel Removed)
1. Electronics box, houses the electronics that perform many of the communication and
counting functions of the UltraLo. These include:
o Processing electronics: Digitize the incoming signals, look for triggers, send data to the
Control Laptop (not shown).
o HV generation: Generates the High Voltage needed for electron drift (not shown).
o Communications: Communicates both signals and device information (e.g. high voltage
bias, moisture) values to the Control Laptop (not shown).
2. Upper Chamber, contains:
a. Preamplifiers: Analog amplification of the signals coming from the Active Volume.
b. Moisture meter: Measures the moisture in the Active Volume in order to ensure a dry
counting environment.
c. Active Volume (ionization chamber). Includes:
Electrodes: The drifting electrons induce charge via the electrodes (not shown).
Fieldshapers: Ensure that the electric field is uniform (not shown).
3. Lower chamber, introduces samples into the Active Volume. Primarily contains:
o Tray/Door mechanism: Connects the motor to the tray and door, so that samples may
be introduced and a gas seal created in a reliable manner (not shown).
Figure IV-1: Side view of counting module with the panel removed.
UltraLo-1800 Alpha Particle Counter
[email protected] XIA LLC Page 27
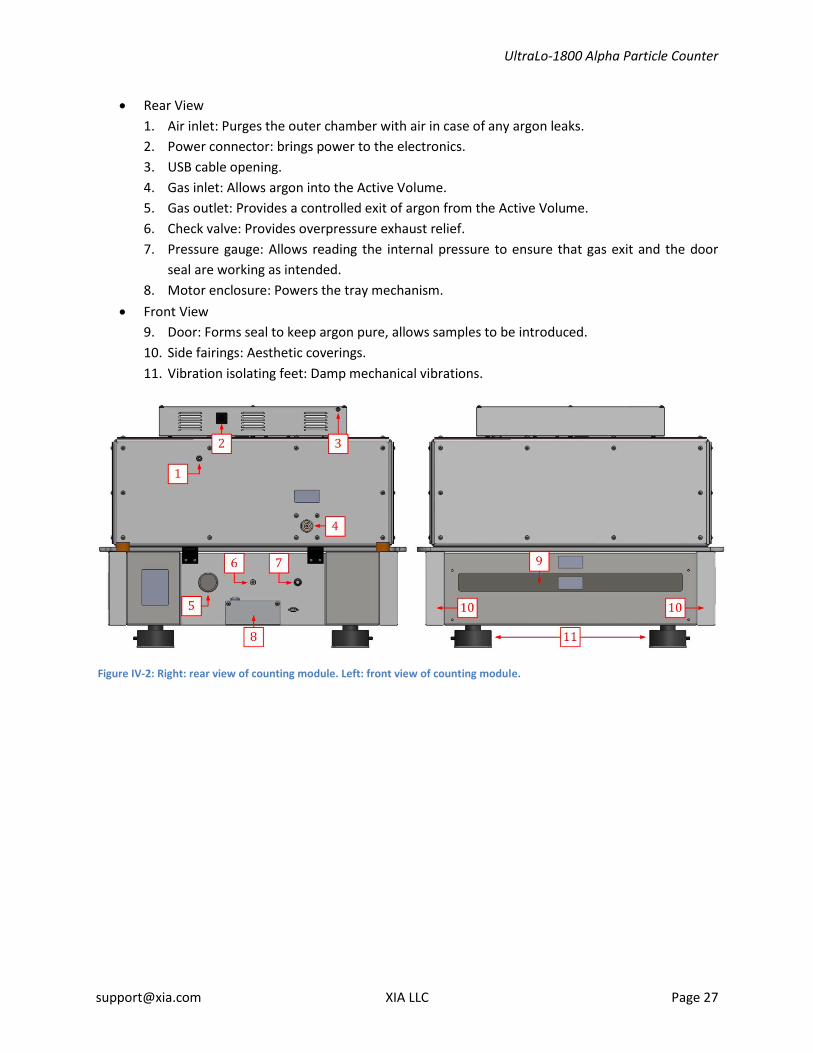
Rear View
1. Air inlet: Purges the outer chamber with air in case of any argon leaks.
2. Power connector: brings power to the electronics.
3. USB cable opening.
4. Gas inlet: Allows argon into the Active Volume.
5. Gas outlet: Provides a controlled exit of argon from the Active Volume.
6. Check valve: Provides overpressure exhaust relief.
7. Pressure gauge: Allows reading the internal pressure to ensure that gas exit and the door
seal are working as intended.
8. Motor enclosure: Powers the tray mechanism.
Front View
9. Door: Forms seal to keep argon pure, allows samples to be introduced.
10. Side fairings: Aesthetic coverings.
11. Vibration isolating feet: Damp mechanical vibrations.
Figure IV-2: Right: rear view of counting module. Left: front view of counting module.

UltraLo-1800 Alpha Particle Counter
[email protected] XIA LLC Page 28
3. Support Box
Rear View
1. Argon gas input
2. USB to computer
3. AC in and power switch
Front View
4. Argon gas out to counter
5. USB to counter
6. Air out
7. DC power to counter
8. Connection to motor enclosure
Top View (Cover Removed)
9. Power supplies: AC/DC converters to supply power to all systems.
10. Flow control: Electronically controls flow rate.
11. Optical isolation: Isolates motor when it’s not in use, to prevent excessive noise pickup.
12. Air pump: Pumps air into the outer chamber of the counting module to prevent argon
buildup.
Figure IV-3: Top left: rear view of support box. Top right: front view of support box. Bottom: top view of support box with cover removed.

UltraLo-1800 Alpha Particle Counter
[email protected] XIA LLC Page 29
B. Requirements and Specifications This section is a brief overview of the various specifications and requirements for the UltraLo-1800.
Requirement Specification
Rated Voltage 100-240 (± 10%) VAC
Rated Frequency 50/60 Hz
Typical Current (Counter + Laptop) 0.7 A
Typical Power (Counter + Laptop) 0.08 kW
Max Power 0.100 kW
Gas Type Argon
Pressure 21 PSI (150 kPa) ± 5%
Tubing ¼” OD metal tubing
Component Width (in) Depth (in) Height (in) Weight (lbs)
Counter Module (closed) 34.3 (87.1 cm) 40.0 (101.6 cm) 27.0 (68.6 cm) 330 (150 kg)
Counter Module (open) 34.3 (87.1 cm) 40.0 (101.6 cm) 45.3 (115.1 cm) 330 (150 kg)
Counter Module (tray ext) 34.3 (87.1 cm) 66.0 (167.6 cm) 27.0 (68.6 cm) 330 (150 kg)
Support Module 16.0 (40.6 cm) 12.0 (30.5 cm) 8.5 (21.6 cm) 30 (13.6 kg)
Laptop 13.5 (34.3 cm) 9.5 (24.1 cm) 10.5 (26.7 cm) 5 (2.2 kg)

UltraLo-1800 Alpha Particle Counter
[email protected] XIA LLC Page 30
C. Counter Manipulations Sometimes in the course of maintenance or troubleshooting it may become necessary to perform
certain manipulations on the UltraLo-1800. This section is a repository of common manipulations. In
fact, other than opening the counter, it’s unlikely that you will need to do any of these. As always, you
should not perform any of these without good reason, and, except for adjusting the tray height, only
under the instruction of an XIA technician.
1. Adjusting the Tray Height
Tools: None.
The tray on the UltraLo-1800 is designed to adjust vertically in order to accommodate samples up to
1/4” thick. To adjust the tray height:
1. Eject the tray, pull it all the way out of the counter.
2. Remove the tray and the perforated support, set them aside.
a. Note: removing these trays is slightly easier if you lower the tray handle by pulling
out the two black knobs on the tray’s sides (you can turn these knobs slightly while
they are pulled out to lock them in the out position).
3. You will now see eight metal blocks with numbers on them. The numbers indicate the
height of that face of the block, all 3 pairs of faces are different. The tallest is 1.440, which
corresponds to a full-height tray. Rotating the blocks so 1.315 faces up will lower the tray
1/8”, and rotating them so 1.190 faces up will lower the tray 1/4”.
4. Once the blocks are all at the same desired position, put the trays back on, making sure that
they are seated on the blocks.
a. Note: if you pulled out the black knobs, reinsert them now.
5. Push the tray pack in and close it via CounterMeasure.
This operation may be performed as needed to accommodate samples of substantial height.
2. Opening the Counter
Tools: One 5/8” box wrench; two 9/16” box wrenches; one 3/8” hex key (supplied with counter).
The counter will need to be opened periodically for maintenance (see Annual Maintenance). To
open it:
1. Close CounterMeasure and turn off the power switch on the Support Box.
2. Wait about 20 seconds for the residual high voltage to drain.
3. Use the wrenches to unhook the rigid gas tube.
4. Remove the two side fairings by gently pulling them off, and set them aside.
5. Then remove the hex key from the rigid gas tube and use it to open the 4 latches on the side
of the counter.
6. Lift the upper chamber to open the counter. The gas springs will provide assistance with
opening, but be careful nonetheless.

UltraLo-1800 Alpha Particle Counter
[email protected] XIA LLC Page 31
To close the counter, simply reverse the process: lower the upper chamber; latch the latches; put on
the side fairings; connect the rigid gas tube; and finally turn the power back on.
3. Removing a Side Panel
Tools: One 1/8” hex key.
This operation should only be done at the request of an XIA Technician.
Very occasionally an XIA technician will request you to open a side panel for troubleshooting or
maintenance. To do this:
1. Close CounterMeasure and turn off the power switch on the Support Box.
2. Wait about 20 seconds for the residual high voltage to drain.
3. Use the hex key to remove the ten screws on the panel.
4. Pull off the panel. Removing the panel from the side may take some force, as there is slightly
tacky silicone rubber between it and the counter body to serve as a vibration reducer.
5. Set the panel and screws aside.
6. To replace the panel you will need to carefully align the first few screws, as the panel sits
slightly above the surface.
4. Opening the Support Box
Tools: One 1/8” hex key.
This operation should only be done at the request of an XIA Technician.
This is essentially the same as removing a side panel, but there are only 6 screws and they’re not all
located on the same surface. See Support Box for an image of where they are located. As with opening
the side panel, make sure to turn the support box off before opening it.
5. Opening the Electronics Box
Tools: One 3/32” hex key.
This operation should only be done at the request of an XIA Technician.
Depending on the height of the UltraLo-1800’s table, you may want a step-ladder to open the
electronics box. As always, don’t perform this procedure unless instructed. First, turn off the power
switch on the Support Box. Next, using the hex key, remove the six screws. Set aside screws and panel
for reinstallation later.

UltraLo-1800 Alpha Particle Counter
[email protected] XIA LLC Page 32
V. Maintenance/Calibration
A. Calibration Calibration is initially performed at XIA, prior to shipment, and should be considered valid for up to a
year. To ensure that your UltraLo-1800 continues to perform optimally over an extended period, XIA
recommends enrolling in the Compliance/Calibration program. This program will verify that your system
is producing results that conform to and comply with industry standards.
If you suspect that your UltraLo-1800 needs calibration, or are interested in learning more about the
Compliance/Calibration program, please contact XIA at [email protected].
B. Weekly Maintenance There is not much maintenance needed on a weekly basis. We recommend that you regularly check
ADC traces (in the Diagnostic Panel) to familiarize yourself with the noise environment, so that if a
change in the noise environment occurs it can be caught quickly.
C. Monthly Maintenance There are only a few maintenance steps needed per month. Cleaning the tray, or any tray liner,
regularly (using the method outlined in Cleaning Procedure) is highly recommended. This will help keep
the background in the detector as low as possible. (If you change samples often you may want to do this
more frequently than once a month.)
In addition, doing a run with a standard sample of your choosing to ensure that your background
hasn’t changed is also good practice.
D. Annual Maintenance One annual maintenance step is to inspect and grease the seal around the door. To do this open the
motor dialog and run the tray out. When door gets all the way down to the bottom, press “hard stop”.
Lightly grease the seal using a silicone lubricant, either using your finger or some appropriate tool. Once
it is greased, tell the motor control dialog to continue ejecting the tray. Once it is ejected push it back in
and close it, either through the dialog or the tray control button.
The second annual maintenance item is to check the air level of the inflatable vibration-dampening
feet and fill them, if necessary. There should be about 3/8” space between the top of the foot and the
bottom of the counter, and the top of the foot should be level and without bulges or divots. The feet can
be filled with a standard bicycle or car tire pump. Be careful not to overfill, as this can damage the foot.
If you add too much air you can bleed some out by pressing the metal pin at the center of the valve with
a fingernail or a small screwdriver.
UltraLo-1800 Alpha Particle Counter
[email protected] XIA LLC Page 33
VI. CounterMeasure
A. Application Overview
1. Main Panel
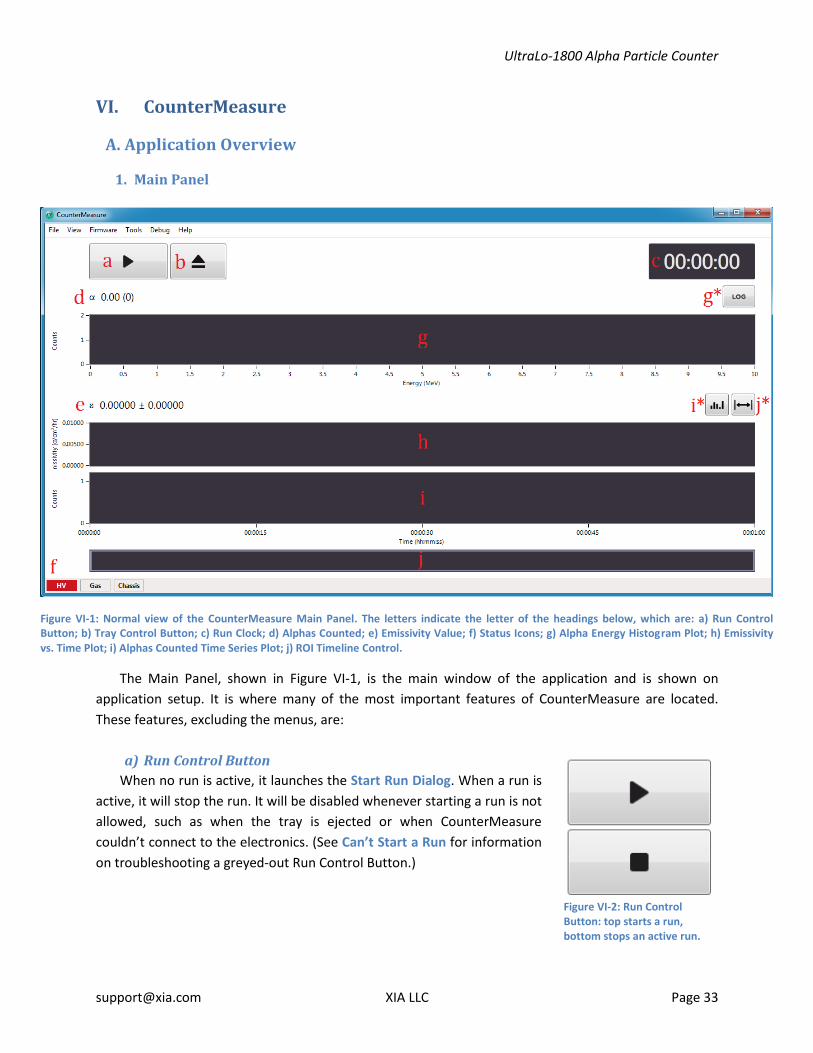
The Main Panel, shown in Figure VI-1, is the main window of the application and is shown on
application setup. It is where many of the most important features of CounterMeasure are located.
These features, excluding the menus, are:
a) Run Control Button
When no run is active, it launches the Start Run Dialog. When a run is
active, it will stop the run. It will be disabled whenever starting a run is not
allowed, such as when the tray is ejected or when CounterMeasure
couldn’t connect to the electronics. (See Can’t Start a Run for information
on troubleshooting a greyed-out Run Control Button.)
Figure VI-1: Normal view of the CounterMeasure Main Panel. The letters indicate the letter of the headings below, which are: a) Run Control Button; b) Tray Control Button; c) Run Clock; d) Alphas Counted; e) Emissivity Value; f) Status Icons; g) Alpha Energy Histogram Plot; h) Emissivity vs. Time Plot; i) Alphas Counted Time Series Plot; j) ROI Timeline Control.
Figure VI-2: Run Control Button: top starts a run, bottom stops an active run.

UltraLo-1800 Alpha Particle Counter
[email protected] XIA LLC Page 34
Figure VI-4: Run clock counting up (top) and down (bottom).
b) Tray Control Button
Pressing the Tray Control Button will
eject the tray and launch a dialog showing
the tray’s progress (1). When the tray is
fully ejected the dialog shows whether it
is fully pushed back (and therefore ready
to be retracted, (2). Once it is ready to be
closed the “Close Tray” button on the
dialog is enabled (3) and pressing that will
close the tray (4). See Figure VI-3 for
screenshots.
c) Run clock
By default the Run Clock displays the amount of time remaining
in the current measurement counting down, clicking the clock will
change the display to time elapsed, counting up (shown in Figure
VI-4).
d) Alphas Counted
This is the number of alpha particles that CounterMeasure has
observed. The number is shown as “Corrected (Observed)”. The corrected alpha number takes into
account efficiency losses. See Counting Efficiency for more information on this correction.
e) Emissivity Value
This is the current value of the emissivity and its error. At the end of a measurement this value
represents the final emissivity of the sample. The emissivity is calculated in the usual manner
( ) where α is the corrected number of alphas, A is the current electrode size, and t is the
elapsed time.
f) Status Icons
Status icons report on the status of three auxiliary systems on
the UltraLo-1800: the high voltage bias; the flow controller; and
the tilt sensor. These icons are grey when their status is
appropriate for immediately starting a run and are red when
some change is needed before a run can be started. In addition,
there is an icon to indicate that the software was unable to
connect to the system. For information on debugging these icons,
see Status Icons Red.
g) Alpha Energy Histogram Plot
The top plot is a histogram of the energies of all alpha particles observed in the measurement and
runs from 0 to 10 MeV. This plot has zooming and panning enabled to allow closer inspection of features
Figure VI-5: Status icons in various states: all inappropriate for running (top); all appropriate for running (middle); software disconnected from hardware (bottom).
Figure VI-3: Tray Control Dialogs, with arrows showing the flow. Ejecting dialog (1), tray extended dialog (2), tray ready to close dialog (3), closing dialog (4).

UltraLo-1800 Alpha Particle Counter
[email protected] XIA LLC Page 35
in the histogram. For more information on zooming and panning, see Zoom and Pan. Finally, the button
indicated as g* will toggle the y-axis of the histogram between linear and logarithmic scales.
h) Emissivity vs. Time Plot
The second plot is the evolution of the emissivity, and the error in the emissivity, versus
measurement time. The most recent value (the right-most value on the plot) is the same as the value
reported in Emissivity Value. This plot is useful diagnostically as it allows the user to look for systematic
changes over time. For instance, a slow rise in emissivity could indicate that there were problems with
moisture early in the run, and a sharp drop could indicate radon exposure. For more on using this plot
for diagnostics, see Troubleshooting.
i) Alpha Counts Time Series Plot
The final plot is a histogram of alpha counts in time. This plot depicts the number of alphas observed
in a given interval of time and is similar to the Emissivity vs. Time plot. This chart can be hidden using the
button indicated as i* in Figure VI-1.
j) ROI Timeline Control
The ROI Timeline control allows you to focus on any window of time that you are interested in. To
set a ROI window, click either edge of the control and drag it toward the other edge. The times displayed
on the edges of the control indicate where the ROI window boundaries are set within the total
measurement time. When the ROI Timeline control is activated the rest of the Main Panel will display
only data from the selected window (to see the ROI in action, see Figure VI-6). Additionally, any reports
generated or data exported will contain only data from the ROI. This is useful for eliminating unwanted
Figure VI-6: Main Panel with an ROI set. All plots are updated to display only data from the selected time window. The emissivity value and alphas counted are also updated. The Run Clock displays both the total measurement length and the ROI length. Both ends of the ROI show the time they’re at.

UltraLo-1800 Alpha Particle Counter
[email protected] XIA LLC Page 36
transient signals, such as radon or moisture, without having to do another run. The ROI can be hidden
using the button indicated as j* in Figure VI-1. You can remove the ROI selection either by sliding the
bars back, double-clicking inside the ROI control window, hitting Ctrl+A, or going to the View menu and
selecting “Auto-scale”.

UltraLo-1800 Alpha Particle Counter
[email protected] XIA LLC Page 37
At the very top of the Main Panel is a series of
menus:
k) File
File menu allows you to exit the program, open
the Measurement History window, or generate
Exports and Reports. File generation via export
menu options is not possible during a
measurement.
l) View
The View menu’s sole option, “Auto-scale”
allows you to remove an ROI window if one is set.
This option is unavailable if there is no ROI set.
m) Firmware
The Firmware menu allows you to launch the
Firmware Update Dialog. This option will be
disabled during a measurement or if the software
didn’t connect to the counter.
n) Tools
Tools provides access to the Diagnostic Panel,
the log window (see Generated Files for more
details on logs), the Analysis Panel, and the Options
Dialog. The Diagnostics Panel will be unavailable
during a measurement.
o) Debug
The Debug menu contains a few debugging
tools, such as a motor controller interface and a
pulser toggle. Most users should never need to use
these.
p) Help
The help menu has one option, “About
CounterMeasure”, which contains information on
software and firmware version numbers, as well as
links to the [email protected] and
http://support.xia.com addresses.

UltraLo-1800 Alpha Particle Counter
[email protected] XIA LLC Page 38
2. Analysis Panel
The Analysis Panel contains detailed information on the UltraLo-1800’s pulse-shape analysis and
event classification results. It is launched from the Tools menu on the Main Panel.
a) Event Scatter Plot
This plot shows the scatter of Anode Energy vs. Risetime for all Alpha-Like events, which can be
clicked to display the traces associated with that event in the event trace plot below (b). The colors
correspond to the event classes shown in d). When an event is selected cursors appear to highlight the
selected event and can be dragged to select other events. This plot can be zoomed/panned, as
described in Zoom and Pan. It can also be used to troubleshoot issues that may rarely arise, as described
in Counting Issues.
b) Event Trace Plot
This plot shows the raw digitized waveforms for the selected event and the fits from their analysis.
The anode trace is red, the guard trace is blue, and the fits are light red and blue. Occasionally a yellow
trace will be present, this is the add-back pulse discussed in Induction. The vertical lines are the times of
the three timing parameters (t0, tS, and tR, from left to right) discussed in Electrostatic Description of the
UltraLo-1800. The text displayed in the upper right-hand corner are, from top to bottom, the event
classification, anode trace classification, and guard trace classification (the meaning of these
classifications is also discussed in Alpha Analysis Engine). By right-clicking on the plot you can hide the
Figure VI-7: Analysis Panel with data shown. The letters indicate the letter of the headings below, which are: a) Event Scatter Plot; b) Event Trace Plot; c) Left/Right Buttons; d) Event Classifications and Counts; e) Log Button; f) Open Button; g) Analyze Button; h) Options Button.

UltraLo-1800 Alpha Particle Counter
[email protected] XIA LLC Page 39
fits or export a zip file containing the traces and the analysis log file (see Exports and Reports). This plot
can be zoomed/panned, as described in Zoom and Pan.
c) Left/Right Buttons
Left/right buttons: Scroll through events sequentially, in the order they were captured, one at a
time. The left/right arrows on the keyboard have the same effect, as does pressing the Ctrl+N or Ctrl+P
keys. The trigger number of the current event is displayed beneath the left/right buttons.
d) Event Classifications and Counts
Displays the classifications and number of each event type observed in the measurement. Clicking
on an event class will toggle the visibility of the associated events in the Risetime vs. Anode Energy
scatterplot and determine whether it will be skipped while scrolling. This is a convenient way to closely
inspect the traces in a certain event class without having to scroll through all the rest. All event classes
are initially toggled on. The event classes with a grey background aren’t displayed in the Risetime vs.
Anode Energy scatterplot plot because they don’t have a well-defined risetime, but they will be scrolled
through. The numbers and rates of events can be a useful diagnostic tool, for more information see
Troubleshooting.
e) Log button
Shows the Alpha Analysis Engine (AAE) log file instead of the trace. Used for diagnostics. Underneath
is the trigger time for the displayed event.
f) Open button
Opens a file for re-analysis. Click the button, navigate to where the file is stored, and open the file.
The filename will now be populated in the text box next to the button. This button, along with the text
box and the other buttons in this row, will disappear during data acquisition.
g) Analyze button
After opening a file, click to analyze it. CounterMeasure will analyze the file as though the data were
being actively taken, and display the results as it analyzes. This button will be disabled when there is no
file selected and disappear during data acquisition.
h) Parameters Button
Opens the Options Dialog. Like the other buttons in this row, it will disappear during data
acquisition.

UltraLo-1800 Alpha Particle Counter
[email protected] XIA LLC Page 40
3. Diagnostic Panel
The Diagnostic panel is the final of the three primary panels. It is mostly used for debugging or
checking for changes in the noise environment. It cannot be launched during a measurement or when
the hardware is not connected. It is launched from the Tools menu on the Main Panel.
a) Trigger Thresholds
Trigger thresholds on the Anode/Guard. These come pre-set from XIA. Unless the UltraLo-1800’s
noise environment changes rather dramatically they should never need changing. If the thresholds are
set too low (around 100-125) the electronics will trigger on detector noise, and if they’re too high low-
energy alphas might not be detected. Experimentation at XIA has found that 175 on the Anode and 255
on the Guard are good choices. The units are arbitrary, but the choice of 175 corresponds to a cutoff of
about 1.5 MeV, with higher thresholds cutting off at higher energies, and lower threshold cutting off at
lower energies.
b) Oscilloscope Plot
The Oscilloscope plot displays 8000 raw ADC values of a selected channel collected at a chosen
sampling interval. To select a sampling interval, enter a time into the Time Step box (b1). The valid range
of time steps is from 0.125 µs to 400 µs, so a time step of 400 µs has a total duration of 3.2 seconds.
Different time steps will emphasize different frequency ranges. To select a channel use the Channel (b2)
Figure VI-8: Diagnostic Panel with Anode trace and FFT displayed. The letters indicate the letter of the headings below, which are: a) Trigger Thresholds; b) Oscilloscope Plot; b1-3) Parameters associated with Oscilloscope Plot; c) Statistics Box; d) FFT Plot.

UltraLo-1800 Alpha Particle Counter
[email protected] XIA LLC Page 41
radio buttons, which switch between taking a trace from the Anode and the Guard. Finally, to collect a
trace simply hit the Acquire Trace button (b3).
c) Statistics Box
The statistics box shows the mean value and the 2σ variance of the raw ADC trace. These
correspond to the solid yellow line and the two dashed yellow lines, respectively.
d) Fast Fourier Transform Plot
The Fast Fourier Transform (FFT) plot shows the FFT of the raw ADC trace and what frequencies are
present in it. The four largest peaks are identified and highlighted in the plot. When the sampling
interval is appropriate, you will usually see a peak at 60 Hz and several harmonic peaks at 120, 180, etc,
which may have power values greater than 1. There shouldn’t be peaks above 1 in power at any other
frequencies. If you see any, or if the peaks at the harmonics of 60 are above 10 in power, consult
Troubleshooting. Zoom and Pan are both enabled on this plot.
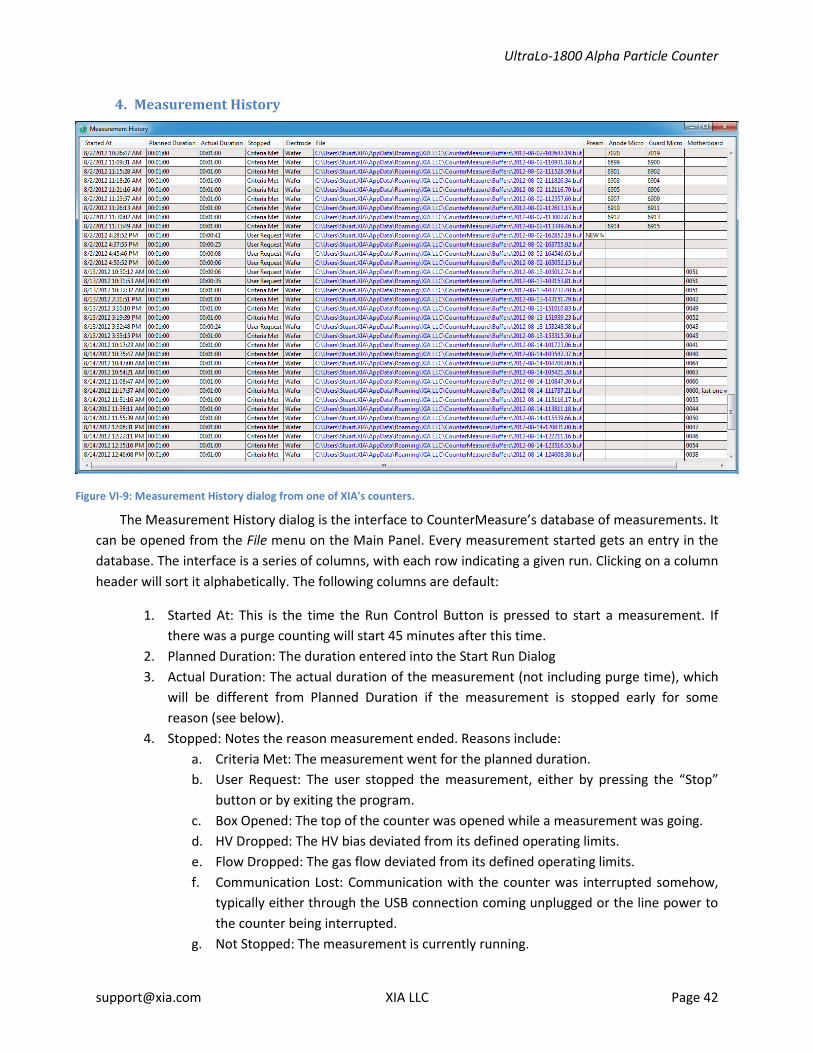
UltraLo-1800 Alpha Particle Counter
[email protected] XIA LLC Page 42
4. Measurement History
The Measurement History dialog is the interface to CounterMeasure’s database of measurements. It
can be opened from the File menu on the Main Panel. Every measurement started gets an entry in the
database. The interface is a series of columns, with each row indicating a given run. Clicking on a column
header will sort it alphabetically. The following columns are default:
1. Started At: This is the time the Run Control Button is pressed to start a measurement. If
there was a purge counting will start 45 minutes after this time.
2. Planned Duration: The duration entered into the Start Run Dialog
3. Actual Duration: The actual duration of the measurement (not including purge time), which
will be different from Planned Duration if the measurement is stopped early for some
reason (see below).
4. Stopped: Notes the reason measurement ended. Reasons include:
a. Criteria Met: The measurement went for the planned duration.
b. User Request: The user stopped the measurement, either by pressing the “Stop”
button or by exiting the program.
c. Box Opened: The top of the counter was opened while a measurement was going.
d. HV Dropped: The HV bias deviated from its defined operating limits.
e. Flow Dropped: The gas flow deviated from its defined operating limits.
f. Communication Lost: Communication with the counter was interrupted somehow,
typically either through the USB connection coming unplugged or the line power to
the counter being interrupted.
g. Not Stopped: The measurement is currently running.
Figure VI-9: Measurement History dialog from one of XIA's counters.

UltraLo-1800 Alpha Particle Counter
[email protected] XIA LLC Page 43
5. Electrode: The electrode configuration chosen in the Start Run dialog
6. File: The location of the data file generated. Clicking the link will open a Windows Explorer
window with the data file selected.
In addition to the defaults listed above, the Measurement History Dialog displays any custom
parameters you have defined in the Options Dialog. Each custom parameter will have its own column,
and text entered into the Start Run Dialog will be displayed in the corresponding row.

UltraLo-1800 Alpha Particle Counter
[email protected] XIA LLC Page 44
5. Start Run Dialog
The Start Run Dialog launches whenever a measurement is
started, which is done by clicking the Run Control Button. As
shown in Figure VI-10 it contains five distinct parts:
a) Acquisition Time
The Acquisition Time box is where you will set your desired
measurement length. The box is designed to be smart and
recognizes many different syntaxes for run length. For
example, to run for 1 day, 2 hours, 3 minutes, and 4 seconds,
you can enter “1d 2h 3m 4s”, or “1.2:3:4”, or even “1 day, 2
hours, 3 minutes, 4 seconds”. Not all of these parameters need
to be entered every time, “1d” is a valid time, as is “1d 4s”. The
box will indicate an invalid time by turning its border red, if the
border remains normal the time entered is valid. Finally, the
box saves the 5 most recently used durations, and will auto-
complete them as the user types if one is matched. They can
be selected via the pull-down arrow. Note that this time does
not include the purge time (which is normally 45 minutes, see
next section).
a) Purge Check-Box and Duration
Most of the time you will be switching samples between
each measurement, which requires a purge. Occasionally you
may want to start a run without purging in order to remeasure
the current sample. In this case simply uncheck the purge box
and the run will begin immediately after hitting the Start
button. CounterMeasure will remember whether the box was
checked on the previous run and keep that setting for the
subsequent measurement.
Underneath the Acquisition Time box is a small clock
symbol, clicking it will reveal the Purge Duration box (see Figure VI-10, top and middle). This box sets the
purge duration, which is by default set to 45 minutes. This value can be changed in the same manner as
the Acquisition Time box. The only situation where we recommend changing the value is to conduct a
longer purge after the counter was opened (or otherwise without purge gas) for an extended period of
time. In this case the duration should be increased proportionally to how long the counter was open
(being open for 5 minutes may only require a 70-minute purge, being without gas for a week may
require a 2-hour purge). This value is not remembered run-to-run, it will always revert to 45 minutes
after being changed. Finally, we strongly recommend never setting this value below 45 minutes, as
that’s the minimum required time for the chamber to completely purge.
Figure VI-10: Start Run Dialog, default (top), with Purge Duration box shown (middle), and with custom parameter “Notes” (bottom).
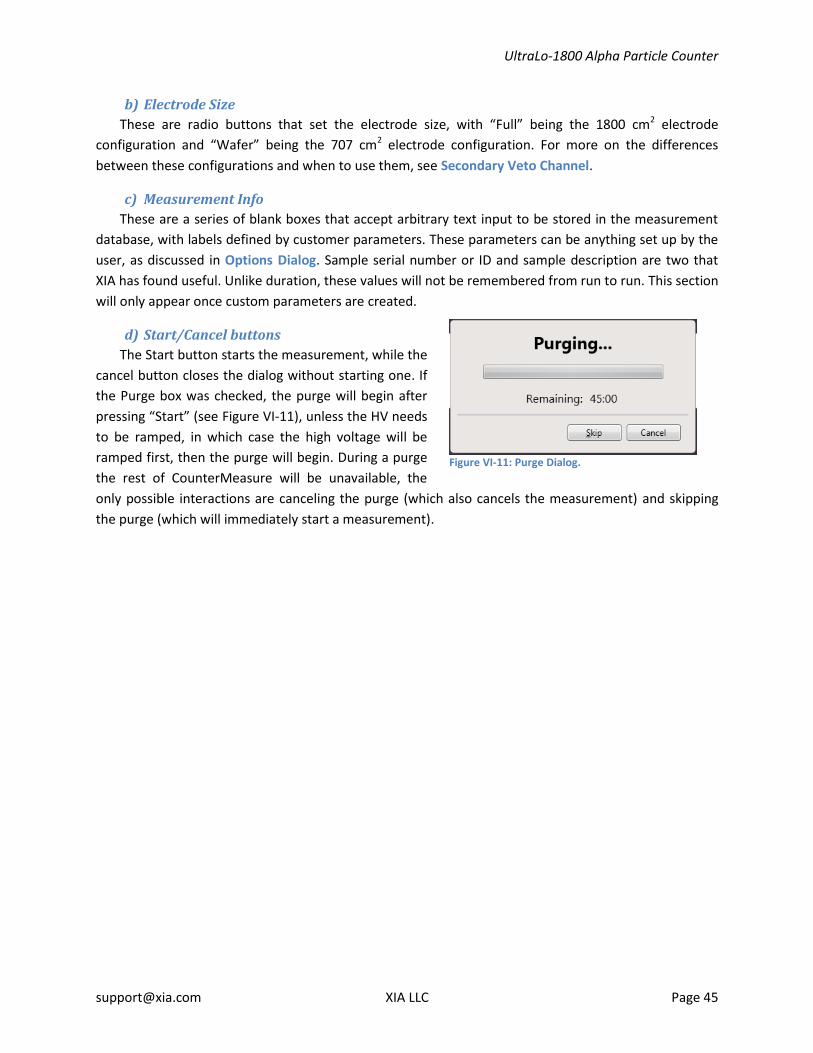
UltraLo-1800 Alpha Particle Counter
[email protected] XIA LLC Page 45
b) Electrode Size
These are radio buttons that set the electrode size, with “Full” being the 1800 cm2 electrode
configuration and “Wafer” being the 707 cm2 electrode configuration. For more on the differences
between these configurations and when to use them, see Secondary Veto Channel.
c) Measurement Info
These are a series of blank boxes that accept arbitrary text input to be stored in the measurement
database, with labels defined by customer parameters. These parameters can be anything set up by the
user, as discussed in Options Dialog. Sample serial number or ID and sample description are two that
XIA has found useful. Unlike duration, these values will not be remembered from run to run. This section
will only appear once custom parameters are created.
d) Start/Cancel buttons
The Start button starts the measurement, while the
cancel button closes the dialog without starting one. If
the Purge box was checked, the purge will begin after
pressing “Start” (see Figure VI-11), unless the HV needs
to be ramped, in which case the high voltage will be
ramped first, then the purge will begin. During a purge
the rest of CounterMeasure will be unavailable, the
only possible interactions are canceling the purge (which also cancels the measurement) and skipping
the purge (which will immediately start a measurement).
Figure VI-11: Purge Dialog.

UltraLo-1800 Alpha Particle Counter
[email protected] XIA LLC Page 46
6. Options Dialog
CounterMeasure has relatively few user-adjustable
settings. They are: a) the Alpha Analysis Engine’s (AAE)
parameters; and b) the user’s custom parameters for
the Measurement Database. Both of these are set in
the same dialog, accessed either by Ctrl+, or by
navigating to Tools and then clicking on Options.
a) AAE Parameters
The AAE parameters are used by the analysis engine
to classify pulses, and are determined based on the
noise characteristics of your detector. Once measured
in a specific location and with specific hardware, they
are quite stable and seldom need to be changed. This
measurement will initially be performed when the
counter is installed. If the noise conditions for a given
machine change, XIA will provide instructions for
updating the parameters. Please note that changing
these parameters without a deep understanding of
their functions can easily lead to erroneous pulse
analyses and measurement results.
b) Custom Parameters
The Custom Parameters are user-specified
descriptions of data and info to be tracked with the
measurement, and can be anything that suits the user’s
needs. Making a new parameter adds that column to
the Measurement History dialog (the column will be
empty for any preceding measurements). The
parameter is also added as a field in the Start Run
Dialog. These fields can be renamed or deleted. Note
that if a field is deleted the existing entries are saved. If
a field with the same name is created, that column in
Measurement History will then be repopulated with the
old entries as well.
Figure VI-12: AAE Parameter options
Figure VI-13: Custom Parameter options.

UltraLo-1800 Alpha Particle Counter
[email protected] XIA LLC Page 47
7. Firmware Update Dialog The Firmware Update dialog (shown in Figure VI-14) is the method by which CounterMeasure
installs new firmware for the electronics. If there is a firmware update included with a new release of
CounterMeasure it will launch automatically the first time the new version of CounterMeasure connects
to the hardware. It can also be launched manually by going to the Firmware menu and clicking
“Update…”.
Once launched, the dialog needs to be pointed to a firmware file. In the case of an automatic launch
the file location will be automatically filled out. If XIA has supplied you with a different firmware file,
simply click the “…” button and use the explorer window to navigate to the file and double-click it. Once
a file is selected, click the “Update” button. Note that this will trigger Windows’ User Account Control,
and you will need to give the application permission to perform the update. The updater will then
launch a Windows Command Prompt, which will perform the update and then close. The Firmware
Update dialog will then close and the firmware will have been updated.
Figure VI-14: Firmware Update dialog. In the event of new firmware on update, the firmware file will be automatically selected.

UltraLo-1800 Alpha Particle Counter
[email protected] XIA LLC Page 48
B. Common Interactions There are several ways of interacting with the various plots and buttons in CounterMeasure that
aren’t immediately obvious at first glance. This section will detail those methods of interaction and
where they occur, and explain their uses.
1. Tooltips
Tooltips are very common in CounterMeasure. Most buttons and text entry locations have tooltips
that explain their purpose. To see a tooltip simply hover the cursor over the control that you’re
interested in for a moment; if a tooltip exists it will pop up.
Two example tooltips are shown in Figure VI-15. The Start Run Dialog has one explaining how enter
the duration of the run, and the Status Icons will show you the current reading.
Figure VI-15: Two example tooltips. The High Voltage Bias (top) and Acquisition Time (bottom)

UltraLo-1800 Alpha Particle Counter
[email protected] XIA LLC Page 49
2. Zoom and Pan
Sometimes you might want to get a closer look at a feature on a graph in CounterMeasure, such as a
peak in a spectrum. Fortunately, many graphs (though not all) allow zoom and pan operations. To zoom,
simply hold down the Shift key, which will cause the cursor to turn into a magnifying glass, and either
draw a box around or click near the area you’re interested in zooming in on. To zoom back out hold
down the Shift key and right click. If you’ve zoomed in multiple times, you will need to zoom back out
multiple times. To pan the plot you simply hold down the Ctrl key, which causes the cursor to turn into a
hand, then click and drag the plot. To undo a pan hold down the Ctrl key and right click.
Zoom and pan work on the Alpha Spectrum, as well as all graphs in the Analysis Panel and the
Diagnostic Panel. Examples of zooming and panning are shown in Figure VI-16, and a summary table is
below this paragraph.
Operation Method
Zoom In Shift+drag or Shift+click
Zoom Out Shift+right-click
Pan Ctrl+drag
Undo Pan Ctril+right-click
Figure VI-16: Examples of zooming (left) and panning (right), with associated icons.

UltraLo-1800 Alpha Particle Counter
[email protected] XIA LLC Page 50
3. Splitters
Several of the plots in CounterMeasure have adjustable heights relative to each other. These are the
Emissivity Evolution and Counts plots on the Main Panel, and the ADC Trace and Fast Fourier Transform
on the Diagnostics Panel. To adjust the relative heights press down your left mouse button on the bar
between the plots. The cursor will change into the one pictured in Figure VI-17. While still holding down
the left mouse button, you can drag the bar up or down. The change will be set upon release of the
button, and persists through restarts of the application.
Figure VI-17: Splitter icon, shown between the Emissivity and Counts graphs.

UltraLo-1800 Alpha Particle Counter
[email protected] XIA LLC Page 51
C. Making a Standard Measurement This section details the steps to take in order to make a typical measurement, first using a flowchart
and subsequently via text.
1. Measurement Flowchart
Figure VI-18: Measurement flowchart

UltraLo-1800 Alpha Particle Counter
[email protected] XIA LLC Page 52
2. Detailed Description
This section is intended to be a very thorough walkthrough of the experience of using
CounterMeasure for routine tasks.
a) Starting the App
Upon starting CounterMeasure you’ll see a loading screen while the software attempts to
communicate with the hardware. This will take several seconds. You will be able to tell if the connection
was successful based on the presence or absence of the “no connection” icon in the bottom-left corner,
near the status icons. If you cannot connect to the counter, see Can’t Connect to Counter.
b) Diagnostics Panel
Thresholds and Traces: Before starting a run there are a few things to check to ensure that the
UltraLo-1800 is performing as expected. The first is to double-check that the thresholds are set
appropriately (175 on the Anode and 255 on the Guard is standard). Once set they should not change on
their own, but it is good to check anyway. The second is to take a few traces on both the Anode and
Guard at various time steps. This allows the user to become familiar with the noise environment in the
detector and notice changes in noise more quickly. For examples of noise on diagnostic traces and for
more information about how to use the diagnostics panel to spot noise, see Troubleshooting.
c) Main Panel
Begin: If you are not changing samples please skip the next three steps and begin at “Start Run”.
Eject tray: To change samples: hit the Tray Control Button to eject the tray.
Swap Samples: Remove the old sample, put on the new sample, all while being careful not to
contaminate the sample. For more information see Sample Handling. In brief: do not handle the sample
directly; use new gloves or cleaned tweezers; and be careful to clean all sample-handling instruments
thoroughly.
Close tray: Gently push the tray all the way back into the counter, until it hits its stop. Hit the
“Close” button in the Tray Control Dialog.
Start run: The next step is to start the run. If a purge is required (that is, if the sample was switched,
the most common case), just hit the “Start Run” button on the Main Panel to launch the Start Run
dialog. In the Start Run dialog choose the duration of the run (this does not include the purge time),
choose the most appropriate electrode size, and fill in any custom parameters. After that the purge will
happen automatically, and when it finishes the run will start.
Watch Data: During and after the run the information on the Main Panel can be extremely useful.
The headline emissivity number is the goal of the measurement, but the graphs also provide other
useful diagnostic information. For instance, if the Emissivity vs. Time graph shows a large drop through a
run, there may be contamination from radon (see Radon for more information). The spectrum can give
information on the specific isotopes in the sample. If there is a significant change over the course of the

UltraLo-1800 Alpha Particle Counter
[email protected] XIA LLC Page 53
measurement (say from outgassing or radon) the ROI can be used to select only good data (all graphs
will update with only data from the selected time period). All of these graphs should be reviewed to
ensure that the measurement was successful.
d) Analysis
Watch Data: If desired, the Analysis Panel can be opened while a measurement is in progress. More
complete details are presented in the Analysis Panel section. Here we only wish to suggest how the
information displayed can be useful for determining whether or not a measurement is proceeding well.
For instance, the main graph, Anode Energy vs. Risetime, can show if there are issues with outgassing
(see Moisture). Further, the rates of various event types (e.g. ceilings and rounds) should stay relatively
constant from run-to-run. Excessive numbers of any kind of events can indicate a problem. Scrolling
through some traces can show any abnormal noise that may have cropped up (such as vibration from
unusual environmental activity). While the majority of runs will show no problems, spending a few
minutes looking through the data can alert the user to potential issues early, before a day has been
wasted taking bad data.
e) Run reporting
Exporting Files: After the run is over and the results have been checked thoroughly, the user will
typically want to generate a report. This can be as simple as inserting the reported emissivity into a
spreadsheet, or as complicated as running custom pulse-shape analyses. CounterMeasure facilitates
reporting by having several different files available for export, most notably a full measurement report,
as discussed in Exports and Reports. This export can be performed either immediately after a run ends,
or later, after reanalyzing a file.

UltraLo-1800 Alpha Particle Counter
[email protected] XIA LLC Page 54
D. Generated Files There are four important file types in CounterMeasure: buffers; logs; parameters; and exports.
1. Buffers
Buffer files, with the file extension .buf, are CounterMeasure’s data storage files. The file is a custom
binary format, and requires special tools to read. These files are located in
C:\Users\UltraLo\AppData\Roaming\XIA LLC\CounterMeasure\Buffers. Buffer files are fairly small, an
average run will only generate around 4 MB/day.
2. Logs
CounterMeasure produces several different log files. They are all located in
C:\Users\UltraLo\AppData\Roaming\XIA LLC\CounterMeasure\Logs. These are the CounterMeasure log,
the Handel log, the sensor log, and the analysis log.
a) CounterMeasure Log
The most immediately useful log is the CounterMeasure log, which is directly in that folder, or
accessible from the Main Panel by navigating to Tools and clicking Logs. It is formatted in plain text and
can be read by any text reader. This log contains information about CounterMeasure’s interaction with
the electronics and the support box, such as when it reads out events or when it reads the HV, moisture
flow, and tilt sensors. It also contains information on errors. If there is an error that requires contacting
XIA ([email protected]), we will almost certainly ask to see this log file. When a CounterMeasure log gets
too large (~52 MB) it is renamed and a new one is generated. CounterMeasure.log will always be the
most recent log, CounterMeasure.log.1 the second most recent, and so on.
b) Handel Log
The second type of log, the Handel log (handel.log), is also stored directly in the logs folder with the
CounterMeasure logs and is also a plain-text log. Handel is XIA’s device interaction software, and
CounterMeasure uses it to communicate to the hardware. This log is also useful in the event of an
unexpected error. It is important to note that this log is overwritten every time CounterMeasure is
launched, so in the event of an unexpected error be sure to save this log before attempting to restart
CounterMeasure.
c) Sensor and Analysis Logs
The remaining two logs are stored in their own folders inside the Logs folder – these are Analysis
and Sensor logs. Sensor logs (.sns) store data from the various sensors, such as the tilt, HV, and flow.
These logs are binary-formatted. Analysis logs store logs from the analysis engine. They are plain-text
logs. These logs are only pertinent to the user if there’s an error with one of those particular systems, in
which case XIA will ask for them.
3. Parameters
The parameter file is where the alpha analysis engine (AAE) stores the various parameters it uses to
classify pulses. This log is stored in C:\Users\UltraLo\AppData\Roaming\XIA
LLC\CounterMeasure\Config. These parameters vary from counter to counter and place to place, and

UltraLo-1800 Alpha Particle Counter
[email protected] XIA LLC Page 55
need to be updated whenever a counter is moved. These parameters can be updated through the
Options menu (see Options Dialog).
4. Exports and Reports
CounterMeasure allows the export of a few different data files. Most users will be interested in
the Measurement Reports, which are PDF files that can be generated by navigating to File and clicking
on “Export Measurement Report…”. A dialog (shown in Figure VI-19) will pop up, asking for a sample
name, a description, and any pertinent notes. These will show up on the report itself, allowing the user
to make each report distinct and immediately salient. After clicking “Save” on the dialog, you’ll need to
pick a filename and location to save the report. Then CounterMeasure will generate a report containing
many useful pieces of information, such as the run emissivity and error, alpha counts, date, run length,
electrode size, as well as the 3 plots on the Main Panel. An example can be seen in Figure VI-20. The
exported data responds to a selected ROI, as discussed in ROI Timeline. Finally, this export can be
performed upon reanalysis of a file, as discussed in Analysis Panel.
There are a few other exports available
besides the Measurement Report. To export one of
them, go to the Main Panel and navigate to File
and click on “Export”. There will be a list of five
files available for export, Alpha Spectrum, Alphas,
Alpha Time-series, Emissivity, and Analysis Results.
These will all be comma-separated (.csv) files, and
their contents are detailed in Table I.
The final export available is the fit export,
available by right-clicking the Event Traces Plot in
the Analysis Panel. It will export a .tar.gz file
containing 4 files, a .trs containing the raw ADC
values of the two traces, another .trs containing
the fit values for both traces, and two log files.
Exported File Contents
Alpha Spectrum Bin number in MeV vs. number of alphas in that bin.
Alphas Time since start of run (in seconds) and energy (in MeV) for every alpha.
Alpha Time-series End time of bin (in seconds) vs. number of alphas in that bin. Same as Counts plot in Main Panel.
Emissivity End time of bin (in seconds) vs. emissivity at that time (in α/cm2/h). Final bin is the final emissivity. Same as Emissivity plot on Main Panel.
Analysis Results Analysis results of every event in the run. Includes event number, trigger time, event class, Anode amplitude, Anode risetime, Anode energy, and Anode timing parameters. (All of these explained more in AAE section of the User Manual.)
Table I: Exported files and their contents.
Figure VI-19: Export Measurement Report Dialog.

UltraLo-1800 Alpha Particle Counter
[email protected] XIA LLC Page 56
Figure VI-20: Sample of a run report.

UltraLo-1800 Alpha Particle Counter
[email protected] XIA LLC Page 57
VII. Troubleshooting
A. General Steps There are a few techniques that are generally useful for troubleshooting the UltraLo-1800,
regardless of the problem. These techniques will allow you to diagnose and/or solve many of the issues
you will encounter during routine use of your counter.
The first technique is tremendously useful for electronics in general, and that’s power cycling. This is
a fancy term for turning a device off and then back on. This simple technique will solve many issues, and
should be your troubleshooting technique of first resort. To power cycle, perform the following steps:
1. If CounterMeasure is open, close it.
2. Turn off the power switch on the support box.
3. Wait about 30 seconds for the high voltage to drain.
4. Turn the power switch back on.
5. Restart CounterMeasure.
6. Check to see if the problem is resolved.
B. Noise Debugging To aid in the troubleshooting process CounterMeasure has a built-in Diagnostic Panel that is very
powerful for troubleshooting sources of unwanted noise. A common technique to make sure the
counter is operating well is to take traces at several time steps, from high to low, to see if any obvious
oscillations appear in the trace, or any frequency peaks appear in the FFT. Taking traces at 400, 100, 10,
1, and 0.125 µs sampling intervals will often reveal noise sources. For instance, Figure VII-1 shows a
trace that has a very large peak at 60 Hz, as well as many harmonics. An FFT like this usually indicates
that ambient room light is making it into the electronics chamber. In general no peak in the FFT
spectrum should have a height above 1.000, and the peak-to-peak values of the ADC traces (at large
time steps) should be less than 40 ADC, and at low time steps the traces should look fairly flat (examples
shown below). Interpreting traces takes experience. To build an intuition for what normal operation
looks like, take some traces before each run, especially in the beginning as you are learning to use the
UltraLo-1800. This will also allow you to find abnormal conditions more quickly!
Finally, one thing you absolutely do not want to do without guidance is remove the side panels or
electronics panel of the detector. The electronics inside are very sensitive, and there are exposed High
Voltage nodes in certain locations. Only perform this maintenance under the guidance of an XIA
technician.

UltraLo-1800 Alpha Particle Counter
[email protected] XIA LLC Page 58
Figure VII-1: TOP: An ADC trace with 60-Hz peak and harmonics. MIDDLE: A typical trace at 400 μs time step. BOTTOM: A typical trace at 1 μs time step.

UltraLo-1800 Alpha Particle Counter
[email protected] XIA LLC Page 59
C. CounterMeasure Troubleshooting CounterMeasure, being the interface to a technically complex and intricate detector system, may
sometimes appear inscrutable or behave in unexpected ways. This section will allow you to debug any
issues you might have with the software so you can get back to counting.
1. Can’t Start a Run
Sometimes CounterMeasure won’t let you start a run,
almost always by disabling the Run Control Button. There are a
two main reasons it will do this. The most likely is that the
software didn’t connect to the counter. If the “disconnected” icon is present near the status icons (see
Figure VII-2) then this is your problem. See Can’t Connect to Counter for how to troubleshoot this. The
next most likely cause is that the tray is either all the way open or not fully closed. If the tray is open,
close it. If it appears to be closed, try running it out, then back in. (For information on tray operation, see
Tray Control Button.)
2. Status Icons Red
There are three Status Icons, and they each turn red for a specific reason. If the HV or Gas icon is
red, it means that the HV or Gas (respectively) is outside of normal operating range. If the Chassis icon is
red, it means that the counter is tilted at a fairly sharp angle (usually because the upper chamber is
opened). To fix a red Chassis icon, simply close and latch the counter. Typically all that’s required to fix a
red HV or Gas icon is to start a run, this will automatically ramp the HV and Gas to where they should be.
If CounterMeasure is unable to ramp them to the correct value, it will generate a warning message. If
the gas cannot be ramped it’s usually due to inadequate gas pressure being supplied to the support box.
Check your gas supply and make sure it’s supplying 21 PSI. If the HV cannot be ramped, contact XIA
support.
3. CounterMeasure is Frozen
Sometimes CounterMeasure will get into a state where it cannot continue normal operation, and
occasionally cannot even be normally closed. If this happens simply open the Task Manager (via
Ctrl+Alt+Delete), click on CounterMeasure, and click “End Task”. Once CounterMeasure is closed, try to
restart it. If it fails to connect, see Can’t Connect to Counter for more troubleshooting information.
Figure VII-2: Disconnected icon.

UltraLo-1800 Alpha Particle Counter
[email protected] XIA LLC Page 60
D. Counting Issues
1. Can’t Connect to Counter
If CounterMeasure cannot connect to
the counter (diagnosed as starting with the
“Disconnected” icon present (Figure VII-2)),
the most likely cause is that the counter is
powered off, or the USB cable has come
unplugged. Check that the counter is
powered on and the USB cable is connected.
If they both are, open the device manager
(by going to the Windows Start menu,
clicking Control Panel, and then clicking
Device Manager) and check under “Universal
Serial Bus controllers”. If “UltraLo-1800” appears in this section, then everything should be working
properly. If it’s not, try clicking the “Scan for Hardware Changes” button (see Figure VII-3). If this turns
up nothing, or if the UltraLo-1800 only shows up with an error icon, try cycling the power switch on the
support box off and then back on. If you still cannot connect to the counter, please contact XIA support.
2. Counting Stops During Measurement
If counting stops during a measurement the most likely causes are detector power issues or USB
connection failures. Especially if the counter is located in a busy lab the USB cables can come
disconnected and cause interruptions. Further, temporary power outages, even if they’re very fleeting,
can also cause communication issues. (If a stable power line is available, using it will help prevent power
dips from causing problems.) If CounterMeasure experiences either interruption while running, it will
stop the run and display an error message (see Figure VII-4). Left unattended in this state,
CounterMeasure will attempt to reconnect automatically, and if the interruption was temporary it will
re-establish the connection. However, CounterMeasure won’t restart a run, and the error message will
continue to be displayed to alert you to the issue. To verify that the counter is connected, check for the
“Disconnected” icon (Figure VII-2).
If CounterMeasure isn’t able to reconnect automatically, follow the troubleshooting steps outlined
above in Can’t Connect to Counter. Finally, if you experience counting stoppages that cannot be
explained by
interruptions in the
power supply or
USB connection, or
particularly frequent
stoppages, please
contact XIA support.
Figure VII-3: Device Manager with "Scan for Hardware Changes" button circled in red.
Figure VII-4: Error message when communication is lost.

UltraLo-1800 Alpha Particle Counter
[email protected] XIA LLC Page 61
3. Noise on Traces
The most common cause of traces with excess noise on them (see Figure VII-5) is electrical noise.
This can come from a variety of sources, but a few are more common than others. One potential source
is a noisy ground connection, which can happen if the ground connection to the UltraLo is shared with
other large machinery, especially large electrical switches. It is very important to make sure that the
UltraLo is connected to a quiet ground. If you start seeing noise suddenly, a change in the ground
environment may have occurred. Try a different outlet and consult your facilities managers to see if
something has changed in the electrical system.
There is also a possibility that noise can be generated internally. If the counter has been moved
recently, connections may have loosened. If you suspect this is the case, contact XIA at
[email protected] and we will assist you with debugging.
4. Excessively High Sample Emissivity
If a sample has a higher emissivity than you expected, there are a few things to check. First, look at
the emissivity versus time plot, if there’s a large decrease throughout the run it’s possible you had radon
contamination (see Radon). In that case, measure the sample again and the measurement should be
accurate. If there’s no transient activity, check the analysis panel to see if there’s an excess number of
events. If there is, see Excess Events for more troubleshooting tips. If everything about the run looks
normal but its emissivity is higher than expected, it’s likely that the sample is simply more radioactive
than expected.
5. No Alphas
If no alphas show up during a run, but there are other events, there are a few different things that
could be happening.
a) Moisture
The most likely reason for not seeing any alphas while other events are occurring is that the
moisture in the counter is too high. Water atoms in otherwise pure gas have the effect of increasing the
drift velocity of electrons. This reduces the measured risetime and energy of alpha events, causing them
to be misclassified (the effect is most apparent with risetime, and the events with low risetimes are
classified as Midairs). See Figure VII-6 for an example of a run with significant risetime decrease due to
excess moisture. In this case alphas will fail the midair/alpha cut and be classified as midairs. An
Figure VII-5: Noise trace.

UltraLo-1800 Alpha Particle Counter
[email protected] XIA LLC Page 62
inspection of your data’s Anode Energy vs. Anode Risetime plot should tell you quickly if this is the case.
If your runs do have too much moisture, what could be causing it? There are a few things. If it’s
transitory you probably just need to purge for longer. To check for transitory moisture, you can use the
ROI Timeline to filter out the early hours of a run and see if the risetimes as shown in the Analysis Panel
are increasing with time. You can also check the moisture values in the CounterMeasure Log to see if
they are changing with time. The moisture information is contained on a line that finishes “Moisture
meter value = XXX ppm”. Interpreting the value here is a bit tricky as every counter has its own baseline,
and that baseline changes with time. Typically, values around 60 ppm are the highest consistent with
normal operation. Significantly higher values (especially above 100 ppm) indicate the presence of excess
moisture.
If the low risetimes and high moisture values persist throughout a run then it’s possible that a
source of moisture is in the counter or the gas line. Plastics absorb significant amounts of moisture and
then outgas into environments with lower moisture (this is often observed in vacuum experiments),
including the counting environment in the UltraLo-1800. If you’re attempting to measure a plastic
sample it may need a significant amount of time in a dry environment in order to measure (there are
other tricky issues with measuring plastics, see Dielectrics). Likewise, if there are significant amounts of
plastic tubing in the gas lines leading to the UltraLo-1800, that may cause increases in moisture.
Another cause for increased moisture levels is that the constituent plastics of the UltraLo-1800 may
be outgassing. All UltraLo-1800’s are outgassed prior to shipping, but if your counter goes for an
extended period without gas flow it’s possible for moisture to resorb. In this case keep the flow of clean
gas undisturbed until risetimes return to normal, which should take only a few days.
Finally, it’s possible, although quite unlikely, that the silicone rubber seal around the door to the
sample tray may be leaking. The simplest test is a visual inspection of the seal. If there is nothing visually
wrong, then ensure that the tray is closed, put your finger over the gas outlet on the rear of the counter
(see Counting Module), and watch the pressure gauge. If the pressure rises smoothly and steadily up to
2 inches of water, the seal is performing adequately. If it doesn’t, especially if it doesn’t rise at all, there
is some issue with the seal or door mechanism, and you should contact XIA support.
b) Electric Field Strength
If the electric field inside of the detector is not at the correct value then it won’t be possible to
Figure VII-6: A run with high moisture. Note the large number of midairs.

UltraLo-1800 Alpha Particle Counter
[email protected] XIA LLC Page 63
observe any alphas. This shouldn’t happen, but if it does CounterMeasure should indicate it with a red
HV status icon, and the run will terminate with an error message. For more information on debugging
red status icons, see Status Icons Red.
c) Oxygen
Oxygen is electronegative, and if it is present it will capture electrons in the active volume. This
means that induced signals will be smaller than expected. By itself this effect will only decrease apparent
alpha energy, but Oxygen is very rarely present in the active volume alone; it is usually accompanied by
water vapor (see above). Getting rid of oxygen in the active volume follows the same procedure as
water, but is even easier because oxygen isn’t readily absorbed by plastics.
6. No Events
If there are no events present at all after several hours of running, there are several possibilities. The
first thing to check is if the baseline voltage value in the active volume has drifted out of the range
accepted by the electronics. This can happen if the high voltage was ramped immediately before starting
a run without a purge. To test for this simply stop the run and start another one. Other than baseline
drift, the remaining possibilities to check are the same as in the “No Alphas” case above. If the counter is
run filled with room air, for instance, it will likely see no events.
7. Excess Events
There are a number of causes of extra events. The following sections include reasons for excesses of
all event types, as well as excesses of specific event types. Excess event types don’t always indicate a
problem, many times they are simply the result of the sample, or conditions in the counter that are
easily rectified. But they can inhibit proper operation, so keeping an eye on typical event rates can help
you notice changes and spot a problem early.
a) All Types
The most likely cause of a large number of events is excess noise in the environment, particularly
from mechanical vibrations, which cause the inherent noise level in the system to increase dramatically.
(The mechanism is that vibrations produce slight changes in the detector’s capacitance, which generate
changes in the output current of a similar size to our signals. See Signal Generation for more
information.) Mechanical noise is usually very easy to spot, for an example see Figure VII-7. Additionally,
mechanical noise will often cause many events to occur in rapid succession, and in that case scrolling
through events sequentially in the Analysis panel will show streaks of these traces. Eliminating this noise
will depend on the environment, in some cases it may be straightforward, in others it could be quite
difficult. But the UltraLo-1800 needs a quiet environment to function properly, so eliminating sources of
vibrations or physical noise is paramount. Finally, if these vibrations are strong enough they can even
trigger a built-in accelerometer that will cause the run to stop.

UltraLo-1800 Alpha Particle Counter
[email protected] XIA LLC Page 64
b) Guards
Excess guards are typically caused by an unusually radioactive sample that extends under the guard,
in which case you will also see an excess of alphas. But an excessive number of guard events can have
other causes. Any contamination on the sidewalls, for instance, will do it, although this is very rare.
c) Midairs
Midairs are mostly caused by Radon. As such an excessive number of midairs usually indicates the
presence of radon. This results in a spectrum with the characteristic peaks of radon. If radon is the
culprit, the most likely source is emanation from the sample being measured. Try removing the sample,
purging, and seeing if the signal remains. If it does, there may be radon contamination somewhere in
your gas line or the counter itself. In this case please contact XIA.
If there are no characteristic radon peaks it could be that excess moisture is causing lowered
risetimes, and alphas are showing up as midairs. For details on troubleshooting this scenario, see
Moisture.
Finally, some percentage of cosmogenics show up as midairs (for more information on cosmogenics,
see Cosmogenics). For information on troubleshooting excess rounds, see the next section.
d) Rounds
Rounds are caused by cosmogenic radiation, as detailed in Cosmogenics. Excess rounds implies
excess cosmic radiation, which has no easy solution. If you see large numbers of rounds (~8/hour is
normal at sea level) try moving the counter into a basement, if possible. At the moment adding more
material above the counter is the only way to reduce the round rate. XIA is actively researching veto
panel technology, and will alert our customers to any progress.
e) Noises
You can get a large number of “Noise” triggers if the thresholds are set too low. The thresholds are
set in the diagnostics panel, and they control the level a trace needs to reach in order for
Figure VII-7: Event caused by mechanical vibration of the counter.

UltraLo-1800 Alpha Particle Counter
[email protected] XIA LLC Page 65
CounterMeasure to process it as a pulse. If that level is low, CounterMeasure will trigger on the noise
inherent in the system, and this will produce quite a few triggers. Fortunately this is very easy to
diagnose, as you can simply check the Trigger Thresholds.
A large increase in Noise events is also possible for various other reasons, including loose
connections between high-voltage nodes. This typically only occurs if the counter has been moved or
otherwise vibrated. If you have excess noise events with adequate thresholds, please contact XIA
support at [email protected].
8. Non-Alpha Events
As was mentioned previously, mechanical vibrations are capable of causing erroneous events to
appear in measurements (see All Types for more information on mechanical vibrations). The computed
energy and risetime of those events will sometimes fall within the typical energy and risetime bands
occupied by our various classifications, but most often they won’t. Vibrations are easy to spot because
the traces oscillate wildly and they rarely look like alpha pulses.
Occasionally the counter will see events whose origin is purely electronic (see Figure VII-8). It’s not
entirely clear what causes these events, but static charge buildup on insulators, especially when the
insulator is the sample, is a prime suspect (see Dielectrics). These events are, in our experience, never
categorized as alphas, but usually as Negative Charges or Noises. If you’re seeing a very large number of
them and you’re not measuring an insulator, contact XIA at [email protected].
9. Large Drop in Emissivity During a Run
The most likely cause for a large drop in emissivity over the course of run is contamination from
radon. See Radon for more information on how to tell if radon is present on your samples.
Figure VII-8: One type of noise event.

UltraLo-1800 Alpha Particle Counter
[email protected] XIA LLC Page 66
VIII. Alpha Analysis Engine
A. Introduction The software responsible for analyzing and classifying traces is called the “Alpha Analysis Engine”, or
AAE for short. The goal of AAE is to identify alphas, and it does this by progressively eliminating non-
alpha events based on their characteristics. If an event passes every elimination test (such tests are
typically called “cuts”), it is classified as an alpha.
B. Overview In brief, the algorithm takes the following steps:
1. Prescreener: A quick fit to both traces that classifies them individually based on amplitude, if
the resulting classification pair indicates a potential alpha, pass trace to Level One. If there’s
no potential alpha, the analysis of the event is finished.
2. Level One: A more robust, least-squares fit of both traces with cuts based on amplitude,
risetime, and other timing results. A test for “induction” on the traces is performed, and if
any is detected, pass to Level Two. If none is detected, the analysis of the event is finished.
3. Level Two: Another least-squares fit, but now modeling a pulse with “induction”. Performs
“add-back” to get more accurate results on the anode, and applies Level One cuts again.

UltraLo-1800 Alpha Particle Counter
[email protected] XIA LLC Page 67
C. Classifications Each trace is given a classification, and most pairs of trace classifications directly result in an event
classification, but some require more detailed analysis (Level One as detailed in the previous section). A
chart showing how trace pairs correspond to event types is shown in Table II. Figure VIII-1 shows
examples of each trace classification. The following text explains all trace and event classes.
The list of trace classification is:
Alpha-like: These traces have a large, positive step-like shape, similar to those generated by alphas.
Baseline: These traces are flat compared to the large alpha pulses and did not cause the channel to generate a trigger signal.
Noise: These traces are also quite flat, but have some feature which caused the channel to trigger. These can be caused by random fluctuations in the baseline. These fluctuations are inherent in the counter, but can be caused by external influences as well.
Negative charge: These traces exhibit a negative step. They are relatively rare and are caused by electrical noise, or by large negative noise fluctuations.
And the list of event classifications is:
Trace pairs that don’t require Level One analysis:
o Sidewall: An event with significant energy on the guard electrode. (Occasionally a pulse
will be classified as a sidewall after Level One, but most sidewalls are classified by the
prescreener.)
o Negative Charge: An event with a negative charge classified trace on either channel.
o Noise: An event with noise or baseline on the anode and guard.
Figure VIII-1: Trace classifications. A: Alpha-like; B: Baseline; C: Noise; D: Negative charge

UltraLo-1800 Alpha Particle Counter
[email protected] XIA LLC Page 68
Trace pairs that require Level One analysis:
o Alpha: If an event is classified as an alpha that means that, to our best ability to
discriminate, it was caused by an alpha particle emission from the sample area under
the anode electrode.
o Midair: Midairs are events whose risetime is too short to be an alpha, but too long to be
a ceiling. They are caused by interactions in the bulk of the counting gas, mostly from
radon but also from cosmic rays.
o Round: Rounds are events whose peak is too rounded to be caused by alpha particle.
These are the result of particles that can cause longer ionization tracks, most likely
cosmic rays.
o Ceiling: An alpha decay emanating from the electrode.
Anode\Guard Baseline Noise Negative Charge Alpha-like
Baseline Noise Event Noise Event Neg. Charge Event Sidewall Event
Noise Noise Event Noise Event Neg. Charge Event Sidewall Event
Negative Charge Neg. Charge Event Neg. Charge Event Neg. Charge Event Neg. Charge Event
Alpha-like Further Analysis Further Analysis Neg. Charge Event Sidewall Event
Table II: Table of anode and guard trace classification pairings and the resulting event classification. Anode classifications are shown in red, Guard in blue.
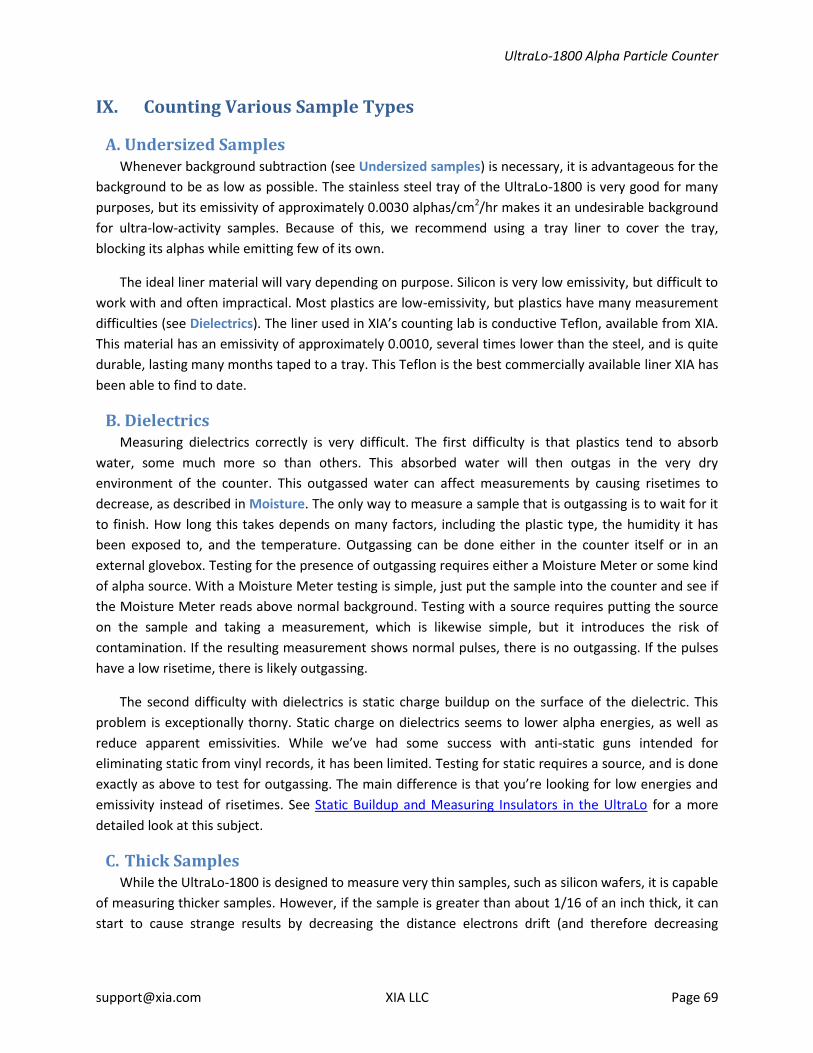
UltraLo-1800 Alpha Particle Counter
[email protected] XIA LLC Page 69
IX. Counting Various Sample Types
A. Undersized Samples Whenever background subtraction (see Undersized samples) is necessary, it is advantageous for the
background to be as low as possible. The stainless steel tray of the UltraLo-1800 is very good for many
purposes, but its emissivity of approximately 0.0030 alphas/cm2/hr makes it an undesirable background
for ultra-low-activity samples. Because of this, we recommend using a tray liner to cover the tray,
blocking its alphas while emitting few of its own.
The ideal liner material will vary depending on purpose. Silicon is very low emissivity, but difficult to
work with and often impractical. Most plastics are low-emissivity, but plastics have many measurement
difficulties (see Dielectrics). The liner used in XIA’s counting lab is conductive Teflon, available from XIA.
This material has an emissivity of approximately 0.0010, several times lower than the steel, and is quite
durable, lasting many months taped to a tray. This Teflon is the best commercially available liner XIA has
been able to find to date.
B. Dielectrics Measuring dielectrics correctly is very difficult. The first difficulty is that plastics tend to absorb
water, some much more so than others. This absorbed water will then outgas in the very dry
environment of the counter. This outgassed water can affect measurements by causing risetimes to
decrease, as described in Moisture. The only way to measure a sample that is outgassing is to wait for it
to finish. How long this takes depends on many factors, including the plastic type, the humidity it has
been exposed to, and the temperature. Outgassing can be done either in the counter itself or in an
external glovebox. Testing for the presence of outgassing requires either a Moisture Meter or some kind
of alpha source. With a Moisture Meter testing is simple, just put the sample into the counter and see if
the Moisture Meter reads above normal background. Testing with a source requires putting the source
on the sample and taking a measurement, which is likewise simple, but it introduces the risk of
contamination. If the resulting measurement shows normal pulses, there is no outgassing. If the pulses
have a low risetime, there is likely outgassing.
The second difficulty with dielectrics is static charge buildup on the surface of the dielectric. This
problem is exceptionally thorny. Static charge on dielectrics seems to lower alpha energies, as well as
reduce apparent emissivities. While we’ve had some success with anti-static guns intended for
eliminating static from vinyl records, it has been limited. Testing for static requires a source, and is done
exactly as above to test for outgassing. The main difference is that you’re looking for low energies and
emissivity instead of risetimes. See Static Buildup and Measuring Insulators in the UltraLo for a more
detailed look at this subject.
C. Thick Samples While the UltraLo-1800 is designed to measure very thin samples, such as silicon wafers, it is capable
of measuring thicker samples. However, if the sample is greater than about 1/16 of an inch thick, it can
start to cause strange results by decreasing the distance electrons drift (and therefore decreasing

UltraLo-1800 Alpha Particle Counter
[email protected] XIA LLC Page 70
risetime, see Theory of Operation). This is especially problematic when the sample is not flat as any
features will cause local distortions.
The only solution to samples with features on their surfaces is careful measurement. However, the
UltraLo-1800 does have the ability to adjust the height of the tray in order to measure thicker samples.
Adjusting the blocks under the sample tray to move thick samples closer to the intended distance from
the electrode makes measurements on them very simple. See Adjusting the Tray Height for details on
how to adjust the blocks.
D. Bulk Sources Bulk sources are materials whose alpha emitters are distributed throughout their entire volume.
This results in a broad tail of events going down to low energy from the main peak, the main peak being
from the alpha emissions at or near the surface. The UltraLo-1800 will count these types of materials
well, but it is only capable of measuring the emissivity, that is the amount of radiation leaving a surface.
This is not the same as the rate of decays throughout the entire sample. Additionally, as with any
counter there is a cutoff energy below which the UltraLo-1800 isn’t sensitive. You can see this in Figure
IX-1, where no alphas below approximately 1.5 MeV (or 750 ADC) register in the detector. The energy at
which about half of events register is around 2.5 MeV. The cutoff energy is dependent on the anode
trigger threshold, the cutoffs cited here are based on measurements taken at the recommended
threshold value of 175. Additionally, the exact cutoff at a given threshold will vary per counter. With
surface sources this isn’t an issue as no alpha particle has an energy that low, but with bulk sources it
means that the detector won’t see events originating below a certain depth. Finally, with a bulk source
the alpha energy spectrum will be “smeared” down to the cutoff energy due to alpha particles emitted
from the bulk losing energy as they pass through the sample material.
Figure IX-1: A bulk source with no alphas below about 1.5 MeV (750 ADC).
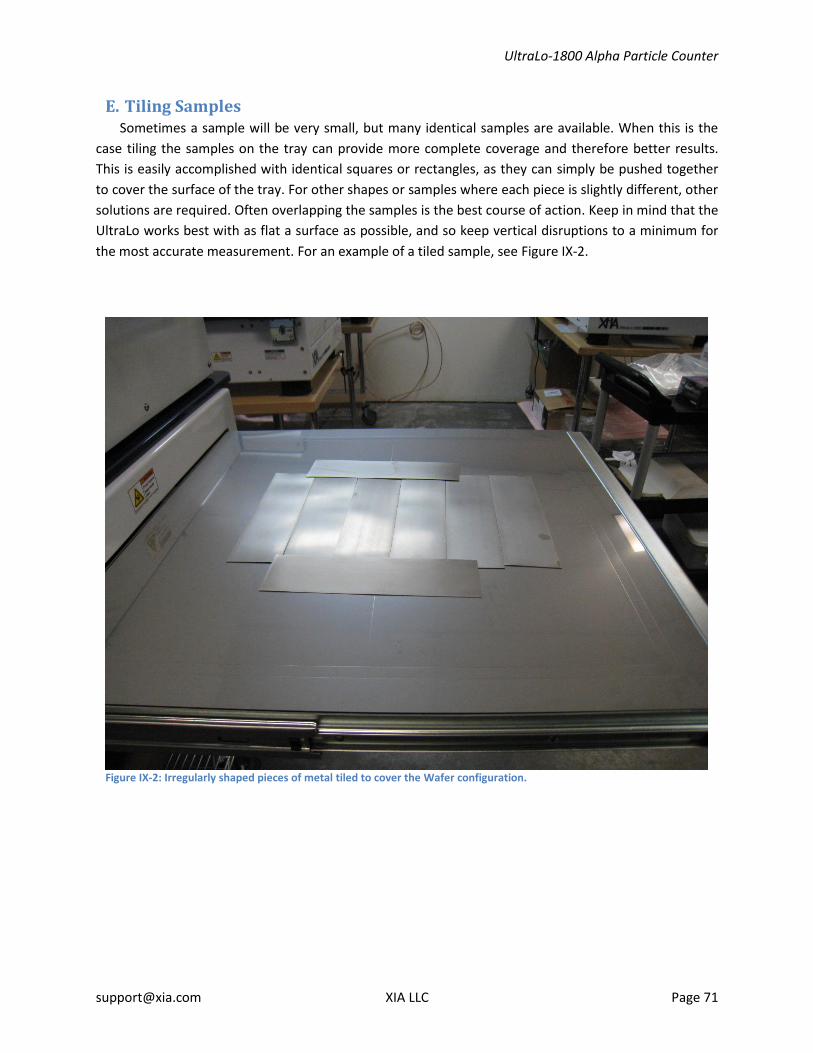
UltraLo-1800 Alpha Particle Counter
[email protected] XIA LLC Page 71
E. Tiling Samples Sometimes a sample will be very small, but many identical samples are available. When this is the
case tiling the samples on the tray can provide more complete coverage and therefore better results.
This is easily accomplished with identical squares or rectangles, as they can simply be pushed together
to cover the surface of the tray. For other shapes or samples where each piece is slightly different, other
solutions are required. Often overlapping the samples is the best course of action. Keep in mind that the
UltraLo works best with as flat a surface as possible, and so keep vertical disruptions to a minimum for
the most accurate measurement. For an example of a tiled sample, see Figure IX-2.
Figure IX-2: Irregularly shaped pieces of metal tiled to cover the Wafer configuration.

UltraLo-1800 Alpha Particle Counter
[email protected] XIA LLC Page 72
X. Appendix
A. Counter Efficiency The UltraLo-1800's guard electrode, while critical for detecting sidewall events and eliminating
background counts, also causes the counter to detect alpha particles emitted from the sample with less
than 100% efficiency. Specifically, if an alpha particle is emitted from the sample and any portion of its
ionization track lies under the guard electrode, then that charge will be collected by the guard electrode,
producing an “alpha-like” output signal from the guard preamplifier. Meanwhile, the rest of the
ionization track is collected on the anode electrode, also producing an “alpha-like” output signal from
the anode preamplifier. Unfortunately, this pair of signals cannot be distinguished from a true sidewall
event (please refer to Figure II-6, where a sidewall α3 and α4 from the edge of the sample produce
similar output pulses). The event is therefore classified as a “sidewall” and rejected. (See Table II for
more information on trace classifications and resulting event classifications.)
The probability of ionization tracks crossing the electrode-guard boundary clearly depends on both
how close the point of emission lies to the boundary and how long the track is. Right at the boundary
fully 50% of emissions will cross under the guard, for example, while if a track is 3 cm long and it's
emitted 4 cm from the boundary, its chance of crossing is clearly zero. Since track length varies with
alpha particle energy, counting efficiency is clearly energy-dependent. For a given energy (track length
) the counting efficiency at each location within the sample area is then just that fraction of 2π
solid angle where crosses the boundary – a straightforward geometric calculation. The counter’s total
efficiency ⟨ ⟩ at that energy is then the average of over the full sample area. We have carried out
these computations analytically and verified them with both Monte Carlo simulations and
measurements with a calibrated check source. The results are shown in the table below.
CounterMeasure then uses these efficiencies to correct the counter's output for “lost” alpha
particles. In principle this could be done in
two ways. The classical method would be
to wait until the measurement was
complete, bin the results by energy, and
then divide each bin result by the efficiency
at that energy to obtain a corrected
number of alpha particles. However, since
we want to be able to always display a
corrected emissivity value as the count
progresses, each time an alpha particle is
detected its energy E is measured and the
quantity ⟨ ⟩⁄ is added to the
“corrected” number of alphas observed,
and used to compute the overall emissivity
from the sample.
Eα (MeV) Efficiency Corrections <ΩE>
Energy Range <Avg> Full Config. Wafer Config.
0 ≤ E < 1 0.5 1.0000 1.0000
1 ≤ E < 2 1.5 0.9816 0.9740
2 ≤ E < 3 2.5 0.9672 0.9542
3 ≤ E < 4 3.5 0.9497 0.9306
4 ≤ E < 5 4.5 0.9290 0.9035
5 ≤ E < 6 5.5 0.9052 0.8736
6 ≤ E < 7 6.5 0.8790 0.8424
7 ≤ E < 8 7.5 0.8505 0.8102
8 ≤ E < 9 8.5 0.8188 0.7769
9 ≤ E < 10 9.5 0.7876 0.7467 Table III: UltraLo-1800 Efficiency Corrections

UltraLo-1800 Alpha Particle Counter
[email protected] XIA LLC Page 73
For example, assume that, in the ‘Full’ configuration, we observe 1 alpha in each of the 1 MeV bins
(1-2, 2-3, up to 10), shown in the table above. These 10 observed alphas are then corrected to 11.09.
Note that this correction is based on the statistics of radioactive decay and is most accurate for large
numbers of alphas. For very small numbers of alphas there may or may not have been a “missed” event,
as implied by the correction factor. However, the corrected number of alphas is still the best unbiased
estimate that we can produce of the true emissivity.
It is important to note that these corrections assume that your sample covers the entire active area
(either wafer or full). If you conduct a measurement with an undersized sample, this correction is still
applied and can lead to discrepancies between corrected measurement results and calibrated sample
values. The differences are particularly noticeable when using a calibrated check source that is
essentially a point source.