ultrabulk a/s 2019
TRANSCRIPT
<
Ultrabulk A/S | Smakkedalen 6 |2820 Gentofte, Denmark | CVR.no. 38 28 37 15
Ultrabulk A/S
2019 Annual Report
Approved on the annual general meeting 2 April 2020.
Chairman of the meeting
2 | Ultrabulk A/S Annual Report 2019 | Content
CONTENT
About Ultrabulk ..................................................................................................................................................................................................................................................... 3
Part of a large and diversified group ....................................................................................................................................................................................................................... 4
2019 highlights ...................................................................................................................................................................................................................................................... 5
2020 Outlook ......................................................................................................................................................................................................................................................... 5
Group Key Figures & Ratios .................................................................................................................................................................................................................................... 6
The fleet ................................................................................................................................................................................................................................................................ 7
Market Review & 2020 Outlook.............................................................................................................................................................................................................................. 8
Sustainability ......................................................................................................................................................................................................................................................... 9
Financial Review .................................................................................................................................................................................................................................................. 10
Corporate Governance ......................................................................................................................................................................................................................................... 11
Statement of the Board of Directors and Executive Management on the Annual Report ....................................................................................................................................... 12
Independent auditor’s report ............................................................................................................................................................................................................................... 13
Consolidated income Statement and comprehensive income ............................................................................................................................................................................... 16
Consolidated Balance sheet ................................................................................................................................................................................................................................. 17
Consolidated cash flow statement ........................................................................................................................................................................................................................ 18
Consolidated statement of changes in equity ....................................................................................................................................................................................................... 19
Notes to the consolidated financial statement...................................................................................................................................................................................................... 20
Ultrabulk A/S - Parent Company ........................................................................................................................................................................................................................... 44

3 | Ultrabulk A/S Annual Report 2019 | About Ultrabulk
ABOUT ULTRABULK Ultrabulk is a leading global dry bulk operator,
servicing customers within the Panamax, Supramax,
Handy and MPP segments. The business model’s
core element remains a strong focus on customer
relations through a range of long-term partnerships,
on cargoes as well as on tonnage. Over the years this
has enabled the establishment of a considerable
long-term book serving as the platform for future
growth.
Ultrabulk also operates in several niche trades with
substantial synergies to our core elements. It is a
strategic focus to continue developing additional
niche trades as they are very important elements in
future growth of the fleet of around 130-165 vessels.
Another important base in Ultrabulk’s business
platform is a well-proven risk management system
covering various business risks. With improved
technologies these risk management systems are
being continuously improved. The new technologies
likewise have increased the company’s focus on
improving the internal processes and data accuracy.
The goal of this drive is to improve efficiency as well
as ensure the best data to support business
decisions going forward.
Continued investments in improving market
surveillance and planning systems will support the
business development process going forward,
especially in relation to efforts to optimise the
balance between cargo contracts and tonnage
commitments.
The Company had 96 employees by the end 2019,
strategically located in offices in Copenhagen (Head
office), Santiago, Stamford, Rio de Janeiro,
Singapore, Cape Town and Sydney. The geographical
spread of offices enables Ultrabulk to serve its
partners in their own time zone in relation to both
chartering and operations.
Throughout the entire organisation Ultrabulk is
committed to perform as a “Partner you can trust”.
Ultrabulk is confident that its ability to live up to this
commitment has developed into an increasingly
strong attribute, which its customers and partners
acknowledges. With its comparatively balanced
book, solid balance sheet and being part of a strong
Group, Ultrabulk is confident that it will be able to
consolidate its position further as a preferred
counterpart, and to actively pursue the
opportunities which will arise under prevailing
market conditions.
Mission statement
A partner you can trust.
Vision statement
We strive to be your preferred
partner in global dry bulk shipping.
Core values
Excellence
We constantly measure, analyze and adjust
in order to enhance quality.
Integrity
We are committed to being reliable,
trustworthy, and dependable.
Passion
We address challenges with passion and
positive commitment.
Safety
We are committed to developing and
stimulating a safe working culture onboard
ships and ashore.

4 | Ultrabulk A/S Annual Report 2019 | Part of a large and diversified group
PART OF A LARGE AND DIVERSIFIED GROUP Ultrabulk is part of the Ultranav Group (“Ultranav”).
Ultranav is a privately owned shipowning and
operating company headquartered in Santiago,
Chile.
Through nine business units, Ultranav operates in
five market segments: Oil, gas, dry bulk, coastal
trades, and towage & offshore. Ultranav operates a
fleet of gas and chemical carriers, tankers for crude
oil and clean petroleum products, bulk carriers,
feeder container ships, multipurpose vessels,
harbour tugs, PSVs, AHTS, pusher tugs, barges and
pilot boats.
Ultranav is focused on providing efficient, safe and
environmentally friendly maritime transportation,
harbour towage and maritime support services to
the mutual benefit of its customers, employees and
all relevant stakeholders. Ultranav aspires to be “A
Partner You Can Trust”.
Ultranav aims to support customers and partners in
those segments and niches where it can develop
long-term sustainable competitive advantages by
adding value to its customers.
Ultranav focuses on customers who value mutually
beneficial long-term relationships. Ultranav has a
flexible organization managed by qualified
professionals committed to providing the best
services to the satisfaction of its customers.

5 | Ultrabulk A/S Annual Report 2019 | 2019 highlights
2019 HIGHLIGHTS The market during the first quarter of 2019 was
lower than the average of 2019 as expected due to
seasonality. The Baltic Supramax Index (BSI) which
was average USD 11,486 per day in 2018 (up 22%
from 2017) decreased to USD 9,094 per day by end
of March 2019, ending the first quarter at average
USD 7,931 per day. Second quarter improved to USD
8,485 per day and third quarter to USD 12,511 per
day before a decrease in Q4 which resulted in
average USD 10,763 per day. This resulted in an
average for 2019 at USD 9,948 per day representing
a 13% decrease compared to 2018.
The Ultrabulk Handysize commercial team in Europe
was restructured during Q2 2019 with the sale of the
Hamburg subsidiary, the responsibilities for
Handysize Europe were transferred to Copenhagen.
The new team in Copenhagen had a good start with
their clients and realized synergies with the other
segments.
Ultrabulk African Services, Ultrabulk Parcel Service
and the specialized MPP Service which focuses on
the Europe/Africa/Europe trades continued with a
good development over 2019. These additional
services provide clients with an even more
diversified product range and have resulted in cross
segment synergies and opportunities.
Ultrabulk operated an average of 142 vessels during
2019, which was in line with the number of vessels
operated in 2018.
The long-term vessel portfolio slightly exceeds the
company’s long-term contractual cargo
commitments. The long-term core fleet decreased
by 1 unit in 2019 to reach 48. A further 5 vessels will
be delivered by 2020. The fleet expansion includes
units within Supramax and Panamax.
The total of physical ship days in 2019 was 51,521
days, in 2018 the total was 52,619 days. Cargo lifted
was slightly down 2 % from 54.51 million tons in
2018 to 53 million tons in 2019.
The Board of Directors has proposed to pay a
dividend of MUSD 10 for 2019.
2020 OUTLOOK Ultrabulk is confident that it will be able to maintain
and develop its market position and it is well
positioned to address the opportunities that will
arise under present market conditions. Our more
general market outlook for 2020 is described on
page 8. Based on the Company’s current coverage,
and while acknowledging the very volatile market
conditions, a positive EBIT and a positive Net Profit is
expected for 2020.

6 | Ultrabulk A/S Annual Report 2019 | Group Key Figures & Ratios
GROUP KEY FIGURES & RATIOS
The Group has implemented IFRS 16 with full retrospective effect. Comparatives are adjusted. Adjusted figures for 2015-2017 are unaudited.
* Comparative figures have not been restated to reflect the implementation of IFRS 9 and IFRS 15.
Restated Restated Restated Restated
KEY FIGURES (USD '000) 2019 2018 2017* 2016* 2015*
INCOME STATEMENT
Revenue 1.005.634 1.047.614 891.716 585.318 641.648
Gross profit (Net earnings from shipping activities) 160.669 161.660 131.604 128.360 127.523
Operating profit before depreciation, amortization and
impairment loss (EBITDA) 136.738 137.473 109.300 106.540 105.385
Operating profit (EBIT) 33.305 35.070 13.864 16.414 18.470
Net financials -16.921 -18.647 -15.898 -14.994 -15.600
Profit before tax 14.795 16.148 -2.035 -1.016 3.139
Net profit 13.159 14.638 -3.470 403 1.803
Profit for the year for the Ultrabulk Shareholders 13.159 14.638 -3.470 403 1.803
STATEMENT OF FINANCIAL POSITION
Non-current assets 447.914 500.856 474.717 509.423 453.382
Current assets 213.439 190.017 182.810 167.767 168.528
Total assets 661.353 690.873 657.527 677.190 621.910
Equity, excl. non-controlling interests 158.101 143.525 133.880 135.012 130.917
Non-controlling interests 64 64 64 64 64
Non-current liabilities 289.054 351.336 331.053 382.012 322.183
Current liabilities 214.134 195.948 192.736 160.103 168.746
Net interest-bearing (liabilities)/assets including leases -280.761 -332.507 -312.623 -314.332 -239.042
Cash and securities 91.932 74.395 69.355 93.179 88.337
CASH FLOW
From operating activities 148.730 143.622 99.440 124.755 118.144
From investing activities 15.344 -19.808 -19.264 -4.899 -16.316
- of which relates to investment in tangible assets -26.056 -43.516 20.098 5.024 48.362
From financing activities -146.537 -118.774 -104.998 -114.016 -93.139
Total net cash flow 17.537 5.040 -24.822 5.840 8.689
FINANCIAL RATIOS AND PER SHARE DATA
Gross profit margin (Net earnings from shipping activities margin) 16,0% 15,4% 14,8% 21,9% 19,9%
EBITDA margin 13,6% 13,1% 12,3% 18,2% 16,4%
Return on equity (ROE) 8,7% 10,6% -2,6% 0,3% 1,4%
Payout ratio 76,0 34,2 0,0 0,0 0,0
Equity ratio 23,9 20,8 20,4 19,9 21,1
USD/DKK rate year-end 667,59 651,94 620,77 705,28 683,00
Average USD/DKK rate 667,03 631,74 659,53 673,27 672,69
Total number of physical ship days 51.521 52.619 52.263 41.143 37.788
Average number of employees 96 97 94 94 94
Proposed dividend (DPS) 0,3690 0,1845 0 0 0
Dividend 10.000 5.000 0 0 0

7 | Ultrabulk A/S Annual Report 2018 |The fleet
THE FLEET

8 | Ultrabulk A/S Annual Report 2019 | Market Review & 2020 Outlook
MARKET REVIEW & 2020 OUTLOOK 2019 was a turbulent year. Q1 saw the typical
seasonal weakness compounded by weak industrial
activity in China. On top of this trade was being
hindered by the bursting of an iron ore tailings dam
in Brazil and weather related disruptions in both
Brazil and Australia. To make matters worse the
trade conflict between China and the US intensified
creating uncertainty and lower investments and
consumption globally. By Q3 the recovering Brazilian
iron ore trade together with record Chinese imports
of most main commodities pushed the market to
record hights. In Q4 the markets fell back as iron ore
stocks in China were rebuild, Asian coal stocks were
at elevated levels and the traditionally slow part of
the grain season set in. Also, the continuing trade
war continued laying as a suffocating blanket over
the global economy.
Usd/day (´000)
2016 2017 2018 2019 2020 FFA (Jan 1.)
C5TC 7.4 15.3 16.4 18.0 13.8
P4TC 5.6 9.8 11.6 11.1 11.5
S10TC 6.2 9.4 11.5 9.9 9.2
BHSI6TC 5.2 7.7 8.7 7.2 7.2
We expect the current weakness to continue
throughout Q1 2020 due to:
• The usual slow grain season.
• The high levels of stock piles of coal in Asia,
• Weak Brazilian ore export,
• Seasonal Australian disruptions,
• Low European coal imports,
• The effects of the Corona-virus,
However, we expect the charter rates to rise in Q2
and Q3 as the Corona-virus is contained and the
resilient global economy bounces back aided by
Chinese infrastructure stimuli and strong Brazilian
ore exports.
Especially the Emerging and Developing economies
are expected to grow strongly. For dry bulk shipping
this is great news as this is the region that drives dry
bulk shipping demand.
Growth pct. 2016 2017 2018 2019 f 2020f World GDP 3.2 3.7 3.6 3.0 3.4 Adv.Econ 1.7 2.4 2.3 1.7 1.7 Emg.Econ 4.3 4.7 4.5 3.9 4.7
Fleet 2.2 2.9 2.9 3.9 3.7 Demand 1.5 9 3.7 1.2 3.9
(IMF, Ultrabulk)
Effective fleet growth in 2020 is more uncertain than
usual due to unclear effects of the new IMO
regulation commencing January 1st. Following the
regulation the sulphur level accepted in bunker fuel
will drop from 3.5% to 0.5% for vessels not fitted
with a scrubber to clean the exhaust gasses. The new
0.5% bunker fuel will be more expensive causing the
vessels to lower the optimal speed. The net result
will be a less effective fleet but the impact is highly
uncertain.
In 2020 Ultrabulk sees the iron ore trade growing by
1.9% based mainly on steel demand growth for
infrastructure and housing in Asia. The coal trade is
forecasted to grow by 1.8% as the forecasted strong
demand from Asia is higher than the shrinking
demand forecasted mainly from Europe. The grain
and the minor bulk trades are the top performers
and are forecasted to grow by close to 4% each.
The major structural change unfolding in 2020 will
be contracting at levels below historical averages.
This trend has already been seen throughout 2019.
The reason behind the lower contracting is:
• In 2020 it has been 10 years since a
shipowner would have been able to make a
decent return when investing in a
newbuilding. Since we do not believe that
average charter rates would reach levels in
2020 that would sustain the cost of a
newbuilding, we do not believe that owners
or institutional investors would feel
comfortable contracting.
• CO2 considerations will also put a dent in
the appetite for contracting. First, the
shipping industry is by many institutional
investors branded as a “polluting industry”
which they shy away from. Second, with the
“green” agenda catching traction there
could be CO2-related legislation impeding
the operational lifetime of a vessel
contracted today
• The current trade war between China and
the United States is a part of a larger break-
up of the liberal free trade consensus. The
uncertainty of future trading capabilities
could also dampen the appetite for
contracting new vessels.

9 | Ultrabulk A/S Annual Report 2019 | Sustainability
SUSTAINABILITY Ultrabulk runs its business operations in accordance with internationally recognized climate and environmental management standards as a minimum. In general Ultrabulk is involved in quite a few projects surrounding sustainability, because we believe it is the right thing to do and that it will be good business in the future.
Environmental challenges One of the main challenges leading up to 2020 was the global Sulphur Cap, requiring that the maximum content of Sulphur in the fuel used in the global trade fleet must be below 0.5% unless there is a so-called scrubber installed. During these past years, Ultrabulk has completed a long-term investment program to install Sulphur scrubber on some existing vessels as well as contracting a series of four new vessels on long term charter to be built with scrubbers onboard together with key partners in Japan. The remainder of the fleet is running on compliant fuels. As we look to the future we have new regulations coming into force in 2030 and 2050, which will only enhance the need for more environmentally clean vessels and we are following that development closely.
CLIMATE The worldwide focus on climate issues is greatly affecting the shipping industry, and via IMO we are committed to reduce our emissions with 40% per cargo tons-mile by 2030 compared to 2008 levels. Globally, the focus on emissions reductions is
increasing day-by-day and we must continue to innovate, collect and analyze data, invest in equipment and systems as well as raise general awareness both on-shore and at-sea to meet the increasing demand from our customers and society at large. We believe we have the opportunity to play a positive role in this future to the benefit of the climate as well as our long-term success as a company. One of the ways we can influence the emission of our vessels is to ensure the bottom and propellers are cleaned at the right time. We are enhancing our focus on this the coming year using a state of the art system to monitor even minor deterioration in performance of our long term fleet.
Online monitoring Ultrabulk continues to invest in online monitoring and optimization software, ensuring cargo is being transported in a fuel-efficient way, thereby minimizing our emissions. The fleet is installed with modern technology transmitting real-time data originating from dozens of different sensors onboard vessels measuring voyage and vessel performance. The information is processed by various online monitoring software systems, and the output is used by our shore-based teams to support the crew on the optimal parameters for navigation, in order to minimize the total bunker consumption at sea. One of the projects Ultrabulk is involved in, is combining the commercial data and decisions that has to be made together with the technical
information and expected performance of the vessel. We believe the successful future online monitoring tool is a tool that can combine the commercial and technical aspects of the decision that has to be made at which speed and consumption the vessel should sail. We hope we can use the system in the future to show our customers what effect their orders to us has on the environment and thereby make it easier to take a joint decision which is the best for the climate and the voyage at the same time.
New technology Ultrabulk has partnered with one of its clients to endeavor to reduce carbon emissions from ocean transportation through the design of a concept cargo ship equipped with innovative sail technology. The next level of this project is pending on building a sustainable business case that can attract investors. Ultrabulk expects to continue to contribute alongside our customer as far as the projects finds support from investors.
Reporting
As of 2018 Ultrabulk reports on all CSR relevant activities according to the requirements in the Danish Financial Statements Act §99a. The report is a joint report between the Danish Ultranav companies; Ultrabulk A/S, Ultragas ApS, UltraShip ApS and Ultranav Business Support ApS. The report is published online and is to be found on the following URL: www.ultrabulk.com/content/csr

10 | Ultrabulk A/S Annual Report 2019 | Financial Review
FINANCIAL REVIEW Ultrabulk has adopted IFRS 16 full retrospectively and has restated comparative figures by determining the lease liability and measure the right-of-use assets. The adjustments arising from the new leasing rules are therefore recognized in the opening balance sheet on 1 January 2018. For more detail see note 1 and 31. The majority of Ultrabulk’s lease contracts are time charter contracts on vessels. For these contracts, the estimated non-lease component (daily running costs) will be excluded from the lease liability. Lease liabilities have been measured at the present value of the lease payments, discounted using the incremental borrowing rate. The adoptions of IFRS 16 has a positive impact on the net profit of USD 0.3 million in 2019 (USD -0.9 million in 2018) and a negative impact on the equity of USD 15.9 million in 2019 (USD 16.3 million in 2018).
Results EBITDA was USD 136.7 million (USD 137.5 million in
2018), corresponding to an EBITDA margin of 13.6%
(13.1% in 2018). Net Profit amounted to USD 13.2
million (USD 14.6 million in 2018), which is almost in
line with expected.
Revenues in 2019 were USD 1,006 million, similar to
the level in 2018 (USD 1,048 million) and this is a
result of a similar fleet size during both years and
ability to keep similar margins even with a lower
market in 2019 compared to 2018.
Gross profit was USD 160.7 million in 2019
corresponding to a gross margin of 16.0%, against
15.4% in 2018.
Profit on sales of vessel of USD 0.5 million is related
to the exercising of a purchase option on a vessel
with the subsequent sale of the vessel and the sale
of the owned vessel Ultra Villarrica.
Depreciation totalled USD 103.6 million (USD 106.3
million in 2018), mainly related to depreciation on
right-of-use assets.
Share of results from joint ventures and associated
companies totalled USD -1.9 million, against USD 0.5
million in 2018.
Net financial items amounting to USD -16.9 million
(USD -18.6 million in 2018). The main part of the
financial expenses is related to interest on lease
liabilities.
Income tax at USD -1.6 million is mainly tonnage tax.
Balance sheet Total assets amounted to USD 661.4 million, against
USD 690.9 million in 2018.
Non-current assets totalled USD 447.9 million
against USD 500.9 million in 2018. Of this USD 328.3
million is related to Right-of-use assets in 2019 (USD
345.3 million in 2018).
Current assets totalled USD 213.4 million against
USD 190.0 million in 2018, due to increase in
inventories, but a decrease in trade and other
receivables. The cash and short-term deposits are
USD 91.9 million as of 31st December 2019 (USD
74.4 million as of 31st December 2018).
A newbuilding has been sold with delivery to the
new owners in January 2020 and is therefore
reclassified to assets held for sale.
Total liabilities amounted to USD 503.2 million
compared to USD 547.3 million in 2018. The main
part of the liabilities are related to lease liabilities of
USD 381.4 million in 2019 (USD 407.2 million in
2018). Total equity USD 158.2 million (USD 143.6
million in 2018), the development driven by a net
result of USD 13.1 million and other comprehensive
income of USD 6.8 million. A dividend of USD 5.0
million was paid to the shareholders.
Return on equity was 8.7%, and equity ratio was
24.3% at the end of 2019 compared to 20.8% at end
of 2018.
At the Annual General Meeting, the Board of
Directors will propose to pay out dividends for 2019
of USD 10.0 million.
Cash flow Cash and cash equivalents at year end were USD
91.9 million, up by USD 17.5 million from 2018.
Cash flow from operating activities was positive by
USD 148.7 million (USD 143.6 million in 2018),
mainly related to cash generated from the shipping
activities and changes in the net working capital.
Cash flow from investing activities netted USD 15.3
million (USD -19.8 million in 2018) reflecting sales of
vessels. Cash flow from financing activities totalled
USD -146.5 million (USD -118.8 million in 2018) is
mainly related to instalment and interest payment
on lease liabilities.
11 | Ultrabulk A/S Annual Report 2019 | Corporate Governance
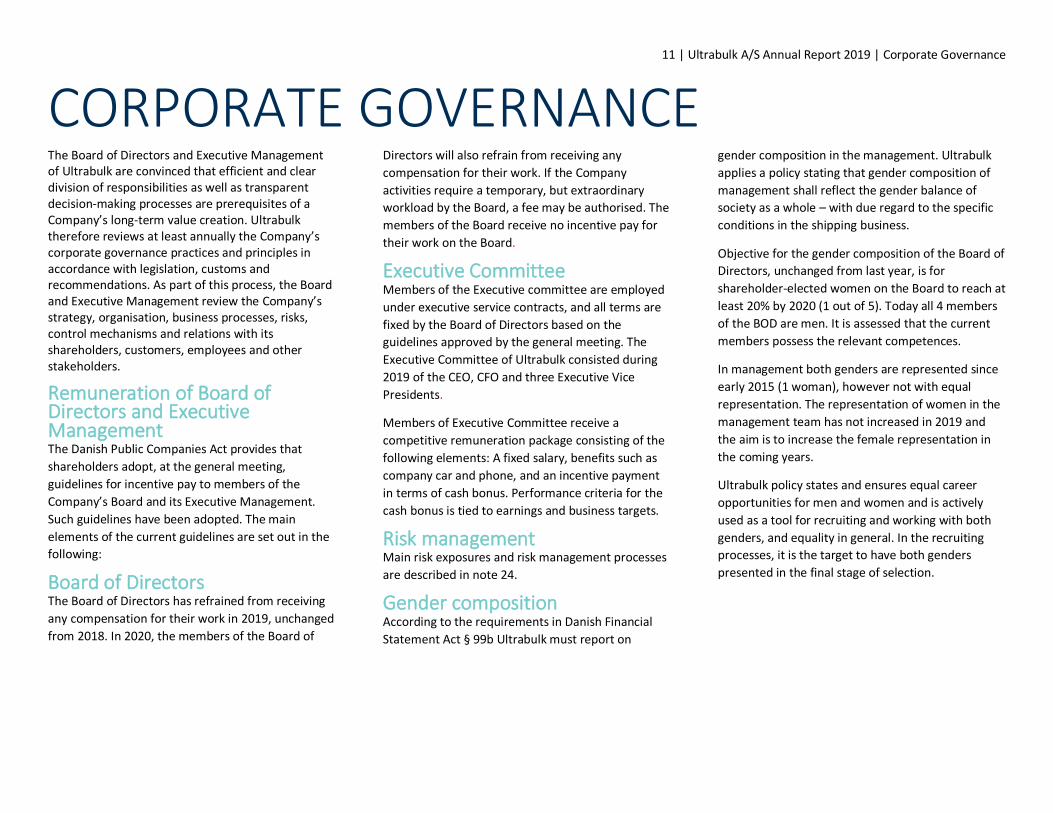
CORPORATE GOVERNANCE The Board of Directors and Executive Management of Ultrabulk are convinced that efficient and clear division of responsibilities as well as transparent decision-making processes are prerequisites of a Company’s long-term value creation. Ultrabulk therefore reviews at least annually the Company’s corporate governance practices and principles in accordance with legislation, customs and recommendations. As part of this process, the Board and Executive Management review the Company’s strategy, organisation, business processes, risks, control mechanisms and relations with its shareholders, customers, employees and other stakeholders.
Remuneration of Board of Directors and Executive Management The Danish Public Companies Act provides that
shareholders adopt, at the general meeting,
guidelines for incentive pay to members of the
Company’s Board and its Executive Management.
Such guidelines have been adopted. The main
elements of the current guidelines are set out in the
following:
Board of Directors The Board of Directors has refrained from receiving
any compensation for their work in 2019, unchanged
from 2018. In 2020, the members of the Board of
Directors will also refrain from receiving any
compensation for their work. If the Company
activities require a temporary, but extraordinary
workload by the Board, a fee may be authorised. The
members of the Board receive no incentive pay for
their work on the Board.
Executive Committee Members of the Executive committee are employed
under executive service contracts, and all terms are
fixed by the Board of Directors based on the
guidelines approved by the general meeting. The
Executive Committee of Ultrabulk consisted during
2019 of the CEO, CFO and three Executive Vice
Presidents.
Members of Executive Committee receive a
competitive remuneration package consisting of the
following elements: A fixed salary, benefits such as
company car and phone, and an incentive payment
in terms of cash bonus. Performance criteria for the
cash bonus is tied to earnings and business targets.
Risk management Main risk exposures and risk management processes
are described in note 24.
Gender composition According to the requirements in Danish Financial
Statement Act § 99b Ultrabulk must report on
gender composition in the management. Ultrabulk
applies a policy stating that gender composition of
management shall reflect the gender balance of
society as a whole – with due regard to the specific
conditions in the shipping business.
Objective for the gender composition of the Board of
Directors, unchanged from last year, is for
shareholder-elected women on the Board to reach at
least 20% by 2020 (1 out of 5). Today all 4 members
of the BOD are men. It is assessed that the current
members possess the relevant competences.
In management both genders are represented since
early 2015 (1 woman), however not with equal
representation. The representation of women in the
management team has not increased in 2019 and
the aim is to increase the female representation in
the coming years.
Ultrabulk policy states and ensures equal career
opportunities for men and women and is actively
used as a tool for recruiting and working with both
genders, and equality in general. In the recruiting
processes, it is the target to have both genders
presented in the final stage of selection.

12 | Ultrabulk A/S Annual Report 2019 | Statement
STATEMENT OF THE BOARD OF DIRECTORS AND EXECUTIVE MANAGEMENT ON THE ANNUAL REPORT The Board of Directors and Executive management
have prepared the 2019 Annual Report. The Annual
Report was considered and adopted today.
The Annual consolidated financial statements for the
Group has been prepared in accordance with
International Financial Reporting Standards as
adopted by the EU and further disclosure
requirements according to the Danish Financial
Statements Act. The financial statements of the
Parent Company are prepared in accordance with
the Danish Financial Statements Act.
We consider the accounting policies used
appropriate and the accounting estimates made
reasonable, and in our opinion the consolidated
financial statements and the financial statements of
the Parent Company provide the relevant
information for assessing the financial position of the
Group and the Parent Company. In our opinion the
consolidated financial statements and the financial
statements of the Parent Company give a true and
fair view of the assets, liabilities and financial
position of the Group and the Parent Company, the
results of the Group’s and the Parent Company’s
operations and the Group’s cash flows for the period
1 January - 31 December 2019.
In our opinion the Management’s review in the
preceding pages gives a true and fair presentation of
the development in the activities and the financial
position of the Group and the Parent Company, the
results for the year and of the Group’s and the
Parent Company’s financial position in general.
Further, in our opinion the Management’s review
describes the most significant risks and uncertainties
that may affect the Group and the Parent Company.
We recommend that the Annual Report is adopted
at the annual general meeting.
Copenhagen, 4 March 2020

13 | Ultrabulk A/S Annual Report 2019 | Independent auditor’s report
INDEPENDENT AUDITOR’S REPORT To the shareholders of Ultrabulk A/S
Opinion We have audited the consolidated financial
statements and the Parent Company financial
statements of Ultrabulk A/S for the financial year 1
January – 31 December 2019, which comprise
income statement, balance sheet, statement of
changes in equity and notes, including accounting
policies for the Group and the Parent Company, and
a consolidated statement of comprehensive income
and a consolidated cash flow statement. The
consolidated financial statements are prepared in
accordance with International Financial Reporting
Standards as adopted by the EU and additional
requirements of the Danish Financial Statements
Act, and the Parent Company’s financial statements
are prepared in accordance with the Danish Financial
Statements Act.
In our opinion, the consolidated financial statements
give a true and fair view of the financial position of
the Group at 31 December 2019 and of the results of
the Group's operations and cash flows for the
financial year 1 January – 31 December 2019 in
accordance with International Financial Reporting
Standards as adopted by the EU and additional
requirements of the Danish Financial Statements
Act.
Further, in our opinion, the Parent Company
financial statements give a true and fair view of the
financial position of the Parent Company at 31
December 2019 and of the results of the Parent
Company's operations for the financial year 1
January – 31 December 2019 in accordance with the
Danish Financial Statements Act.
Basis for opinion We conducted our audit in accordance with
International Standards on Auditing (ISAs) and
additional requirements applicable in Denmark. Our
responsibilities under those standards and
requirements are further described in the "Auditor's
responsibilities for the audit of the consolidated
financial statements and the Parent Company
financial statements" (hereinafter collectively
referred to as "the financial statements") section of
our report. We believe that the audit evidence we
have obtained is sufficient and appropriate to
provide a basis for our opinion.
Independence We are independent of the Group in accordance
with the international Ethics Standards Board for
Accountants' Code of Ethics for Professional
Accountants (IESBA Code) and additional
requirements applicable in Denmark, and we have
fulfilled our other ethical responsibilities in
accordance with these rules and requirements.
Statement on the Management’s review Management is responsible for the Management's
review.
Our opinion on the consolidated financial statements
and the Parent Company financial statements does
not cover the Management’s review, and we do not
express any assurance conclusion thereon.
In connection with our audit of the consolidated
financial statements and the Parent Company
financial statements, our responsibility is to read the
Management's review and, in doing so, consider
whether the Management's review is materially
inconsistent with the consolidated financial
statements and the Parent Company financial
statements or our knowledge obtained during the
audit, or otherwise appears to be materially
misstated.
Moreover, it is our responsibility to consider
whether the Management's review provides the
information required under the Danish Financial
Statements Act.
Based on our procedures, we concluded that the
Management's review is in accordance with the
consolidated financial statements and the Parent
Company financial statements and has been
prepared in accordance with the requirements of the
Danish Financial Statements Act. We did not identify
any material misstatement of the Management's
review.
Management's responsibilities for the financial statements Management is responsible for the preparation of
consolidated financial statements that give a true
and fair view in accordance with International
Financial Reporting Standards as adopted by the EU

14 | Ultrabulk A/S Annual Report 2019 | Independent auditor’s report and additional requirements of the Danish Financial
Statements Act and for the preparation of Parent
Company financial statements that give a true and
fair view in accordance with the Danish Financial
Statements Act.
Moreover, Management is responsible for such
internal control as Management determines is
necessary to enable the preparation of consolidated
financial statements and the Parent Company
financial statements that are free from material
misstatement, whether due to fraud or error.
In preparing the consolidated financial statements
and the Parent Company financial statements,
Management is responsible for assessing the Group's
and the Parent Company's ability to continue as a
going concern, disclosing, as applicable, matters
related to going concern and using the going concern
basis of accounting in preparing the financial
statements unless Management either intends to
liquidate the Group or the Parent Company or to
cease operations, or has no realistic alternative but
to do so.
Auditor's responsibilities for the audit of the financial statements Our objectives are to obtain reasonable assurance as
to whether the consolidated financial statements
and the Parent Company financial statements are
free from material misstatement, whether due to
fraud or error, and to issue an auditor's report that
includes our opinion. Reasonable assurance is a high
level of assurance, but is not a guarantee that an
audit conducted in accordance with ISAs and
additional requirements applicable in Denmark will
always detect a material misstatement when it
exists. Misstatements can arise from fraud or error
and are considered material if, individually or in the
aggregate, they could reasonably be expected to
influence the economic decisions of users taken on
the basis of the financial statements.
As part of an audit conducted in accordance with
ISAs and additional requirements applicable in
Denmark, we exercise professional judgement and
maintain professional scepticism throughout the
audit. We also:
► Identify and assess the risk of material
misstatement of the consolidated financial
statements and the Parent Company financial
statements, whether due to fraud or error, design
and perform audit procedures responsive to those
risks and obtain audit evidence that is sufficient and
appropriate to provide a basis for our opinion. The
risk of not detecting a material misstatement
resulting from fraud is higher than for one resulting
from error, as fraud may involve collusion, forgery,
intentional omissions, misrepresentations or the
override of internal control.
► Obtain an understanding of internal control
relevant to the audit in order to design audit
procedures that are appropriate in the
circumstances, but not for the purpose of expressing
an opinion on the effectiveness of the Group's and
the Parent Company's internal control.
► Evaluate the appropriateness of accounting
policies used and the reasonableness of accounting
estimates and related disclosures made by
Management.
► Conclude on the appropriateness of
Management's use of the going concern basis of
accounting in preparing the consolidated financial
statements and the Parent Company financial
statements and, based on the audit evidence
obtained, whether a material uncertainty exists
related to events or conditions that may cast
significant doubt on the Group's and the Parent
Company's ability to continue as a going concern. If
we conclude that a material uncertainty exists, we
are required to draw attention in our auditor's
report to the related disclosures in the consolidated
financial statements and the Parent Company
financial statements or, if such disclosures are
inadequate, to modify our opinion. Our conclusions
are based on the audit evidence obtained up to the
date of our auditor's report. However, future events
or conditions may cause the Group and the Parent
Company to cease to continue as a going concern.
► Evaluate the overall presentation, structure
and contents of the consolidated financial
statements and the Parent Company financial
statements, including the note disclosures, and
whether the consolidated financial statements and
the Parent Company financial statements represent
the underlying transactions and events in a manner
that gives a true and fair view.
► Obtain sufficient and appropriate audit
evidence regarding the financial information of the
entities or business activities within the Group to
express an opinion on the consolidated financial
statements. We are responsible for the direction,
supervision and performance of the group audit. We
remain solely responsible for our audit opinion.

15 | Ultrabulk A/S Annual Report 2019 | Independent auditor’s report We communicate with those charged with
governance regarding, among other matters, the
planned scope and timing of the audit and significant
audit findings, including any significant deficiencies
in internal control that we identify during our audit.

16 | Ultrabulk A/S Annual Report 2019 | Consolidated income Statement and Comprehensive Income
CONSOLIDATED INCOME STATEMENT AND COMPREHENSIVE INCOME
Income Statement
2018
Figures in USD '000 Note 2019 Restated
Revenue 3 1.005.634 1.047.614
Voyage related expenses -394.544 -415.266
Time-charter hire and opex expenses 4 -450.421 -470.688
Gross profit (Net earnings from shipping activities) 160.669 161.660
Other external expenses 5 -9.215 -9.578
Staff costs 6 -14.716 -14.609
Operating profit before depreciation, and impairment loss (EBITDA)
136.738 137.473
Net profit on sale of vessels 457 3.110
Depreciation 7 -103.587 -106.328
Share of joint ventures' profit after tax 15 -303 815
Operating profit (EBIT) 33.305 35.070
Share of associates' profit after tax 14 -1.589 -275
Other financial items, net 8 -16.921 -18.647
Profit before tax 14.795 16.148
Tax 9 -1.636 -1.510
Net profit 13.159 14.638
Attributable to:
Profit attributable to the equity holders of the parent 13.159 14.638
Profit attributable to non controlling interests 0 0
13.159 14.638
Statement of Comprehensive Income
2018
Figures in USD '000 Note 2019 Restated
Profit/loss (-) for the year 13.159 14.638
Other comprehensive income
Items that will be reclassified subsequently to the consolidated
income statement, when specific conditions are met:
Value adjustments of hedging instruments 5.926 -4.016
Tax effect 0 0
Value adjustments of hedging instruments after tax 5.926 -4.016
Exchange adjustments of foreign entities 218 -567
Reclassified to share of associates profit after tax 645 0
Other comprehensive income for the year, net of tax 6.789 -4.583
Total comprehensive income for the year, after tax 19.948 10.055
Attributable to:
Equity holders of the parent 19.948 10.055
Non-controlling interests 0 0
19.948 10.055
17 | Ultrabulk A/S Annual Report 2019 | Consolidated Statement of Changes in Equity
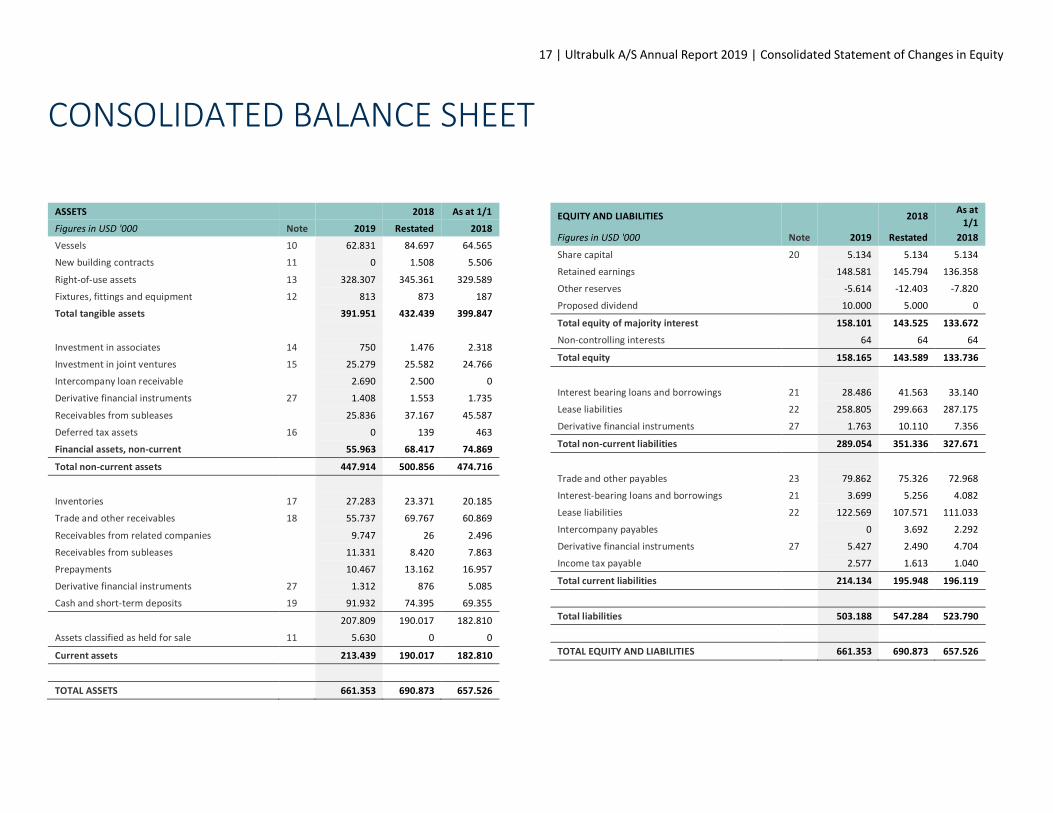
CONSOLIDATED BALANCE SHEET
ASSETS 2018 As at 1/1
Figures in USD '000 Note 2019 Restated 2018
Vessels 10 62.831 84.697 64.565
New building contracts 11 0 1.508 5.506
Right-of-use assets 13 328.307 345.361 329.589
Fixtures, fittings and equipment 12 813 873 187
Total tangible assets 391.951 432.439 399.847
Investment in associates 14 750 1.476 2.318
Investment in joint ventures 15 25.279 25.582 24.766
Intercompany loan receivable 2.690 2.500 0
Derivative financial instruments 27 1.408 1.553 1.735
Receivables from subleases 25.836 37.167 45.587
Deferred tax assets 16 0 139 463
Financial assets, non-current 55.963 68.417 74.869
Total non-current assets 447.914 500.856 474.716
Inventories 17 27.283 23.371 20.185
Trade and other receivables 18 55.737 69.767 60.869
Receivables from related companies 9.747 26 2.496
Receivables from subleases 11.331 8.420 7.863
Prepayments 10.467 13.162 16.957
Derivative financial instruments 27 1.312 876 5.085
Cash and short-term deposits 19 91.932 74.395 69.355
207.809 190.017 182.810
Assets classified as held for sale 11 5.630 0 0
Current assets 213.439 190.017 182.810
TOTAL ASSETS 661.353 690.873 657.526
EQUITY AND LIABILITIES 2018 As at
1/1
Figures in USD '000 Note 2019 Restated 2018
Share capital 20 5.134 5.134 5.134
Retained earnings 148.581 145.794 136.358
Other reserves -5.614 -12.403 -7.820
Proposed dividend 10.000 5.000 0
Total equity of majority interest 158.101 143.525 133.672
Non-controlling interests 64 64 64
Total equity 158.165 143.589 133.736
Interest bearing loans and borrowings 21 28.486 41.563 33.140
Lease liabilities 22 258.805 299.663 287.175
Derivative financial instruments 27 1.763 10.110 7.356
Total non-current liabilities 289.054 351.336 327.671
Trade and other payables 23 79.862 75.326 72.968
Interest-bearing loans and borrowings 21 3.699 5.256 4.082
Lease liabilities 22 122.569 107.571 111.033
Intercompany payables 0 3.692 2.292
Derivative financial instruments 27 5.427 2.490 4.704
Income tax payable 2.577 1.613 1.040
Total current liabilities 214.134 195.948 196.119
Total liabilities 503.188 547.284 523.790
TOTAL EQUITY AND LIABILITIES 661.353 690.873 657.526

18 | Ultrabulk A/S Annual Report 2019 | Consolidated Statement of Changes in Equity
CONSOLIDATED CASH FLOW STATEMENT
2018
Figures in USD '000 Note 2019 Restated
Profit before tax 14.795 16.148
Adjustment for non-cash items etc.
Gain on sale of vessel, plant and equipment -457 -3.110
Depreciation and impairment loss 7 103.587 106.328
Tax paid -674 -498
Share of gain/loss in associated companies 14 1.589 275
Share of gain/loss in joint venture 15 303 -815
Interest expenses 8 18.525 19.560
Interest income 8 -1.604 -913
Net foreign exchange differences 278 354
Net forward contract activity 225 915
Other changes -193 -424
Instalments on sub-lease receivables 8.420 7.863
Working capital adjustments: 28
Change in current assets 3.092 -5.818
Change in current liabilities 844 3.758
Net cash flows from operating activities 148.730 143.622
2018
Figures in USD '000 Note 2019 Restated
Investments in tangible assets 10, 11,12 -26.056 -43.516
Sale of tangible assets 10, 11,12 39.986 25.295
Intercompany loan -190 -2.500
Interest received 1.604 913
Net cash flows from investing activities 15.344 -19.808
Dividends paid to equity holders -5.000 0
Dividend received 0 0
Bank loan 0 14.055
Repayment loan -15.376 -4.670
Instalments on lease liabilities -107.637 -108.599
Interest paid -18.525 -19.560
Net cash flows from financing activities -146.537 -118.774
Net change in cash and cash equivalents 17.537 5.040
Cash and cash equivalents at 1 January 19 74.395 69.355
Cash and cash equivalents at 31 December 19 91.932 74.395

19 | Ultrabulk A/S Annual Report 2019 | Consolidated Statement of Changes in Equity
CONSOLIDATED STATEMENT OF CHANGES IN EQUITY Other Reserves
Share Trans- Total Total
Majority interest
Non-
capital Retained Hedging lation other Proposed controlling
Figures in USD '000 (Note 20) earnings reserves reserve reserves dividend interests Total Equity
At 1 January 2019 5.134 145.794 -10.521 -1.882 -12.403 5.000 143.525 64 143.589
Comprehensive income 0 13.159 5.926 863 6.789 0 19.948 0 19.948
Total comprehensive income 0 13.159 5.926 863 6.789 0 19.948 0 19.948
Other changes 0 -372 0 0 0 0 -372 0 -372
Distributed dividend 0 0 0 0 0 -5.000 -5.000 0 -5.000
Proposed dividend 0 -10.000 0 0 0 10.000 0 0 0
Changes during the year 0 -10.372 0 0 0 5.000 -5.372 0 -5.372
At 31 December 2019 5.134 148.581 -4.595 -1.019 -5.614 10.000 158.101 64 158.165
Other Reserves
Share Trans- Total Total
Majority interest
Non-
capital Retained Hedging lation other Proposed controlling
Figures in USD '000 (Note 20) earnings reserves reserve reserves dividend interests Total Equity
At 1 January 2018 5.134 151.527 -6.505 -1.315 -7.820 0 148.841 64 148.905
Change in accounting practice IFRS 16 0 -15.169 0 0 0 0 -15.169 0 -15.169
At 1 January 2018 restated 5.134 136.358 -6.505 -1.315 -7.820 0 133.672 64 133.736
Comprehensive income 0 14.638 -4.016 -567 -4.583 0 10.055 0 10.055
Total comprehensive income 0 14.638 -4.016 -567 -4.583 0 10.055 0 10.055
Other changes 0 -202 0 0 0 0 -202 0 -202
Proposed dividend 0 -5.000 0 0 0 5.000 0 0 0
Changes during the year 0 -5.202 0 0 0 5.000 -202 0 -202
At 31 December 2018 5.134 145.794 -10.521 -1.882 -12.403 5.000 143.525 64 143.589
20 | Ultrabulk A/S Annual Report 2019 | Notes to the consolidated financial statement
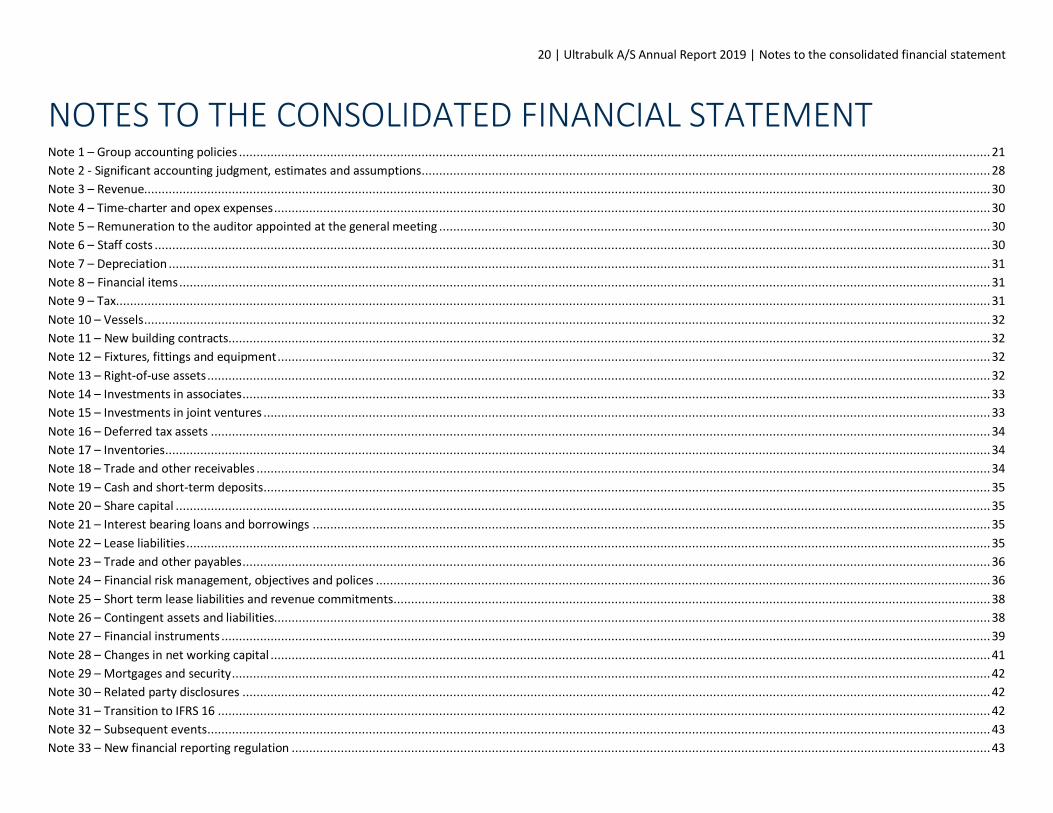
NOTES TO THE CONSOLIDATED FINANCIAL STATEMENTNote 1 – Group accounting policies ...................................................................................................................................................................................................................... 21
Note 2 - Significant accounting judgment, estimates and assumptions.................................................................................................................................................................. 28
Note 3 – Revenue................................................................................................................................................................................................................................................. 30
Note 4 – Time-charter and opex expenses ............................................................................................................................................................................................................ 30
Note 5 – Remuneration to the auditor appointed at the general meeting ............................................................................................................................................................. 30
Note 6 – Staff costs .............................................................................................................................................................................................................................................. 30
Note 7 – Depreciation .......................................................................................................................................................................................................................................... 31
Note 8 – Financial items ....................................................................................................................................................................................................................................... 31
Note 9 – Tax ......................................................................................................................................................................................................................................................... 31
Note 10 – Vessels ................................................................................................................................................................................................................................................. 32
Note 11 – New building contracts......................................................................................................................................................................................................................... 32
Note 12 – Fixtures, fittings and equipment ........................................................................................................................................................................................................... 32
Note 13 – Right-of-use assets ............................................................................................................................................................................................................................... 32
Note 14 – Investments in associates ..................................................................................................................................................................................................................... 33
Note 15 – Investments in joint ventures ............................................................................................................................................................................................................... 33
Note 16 – Deferred tax assets .............................................................................................................................................................................................................................. 34
Note 17 – Inventories ........................................................................................................................................................................................................................................... 34
Note 18 – Trade and other receivables ................................................................................................................................................................................................................. 34
Note 19 – Cash and short-term deposits ............................................................................................................................................................................................................... 35
Note 20 – Share capital ........................................................................................................................................................................................................................................ 35
Note 21 – Interest bearing loans and borrowings ................................................................................................................................................................................................. 35
Note 22 – Lease liabilities ..................................................................................................................................................................................................................................... 35
Note 23 – Trade and other payables ..................................................................................................................................................................................................................... 36
Note 24 – Financial risk management, objectives and polices ............................................................................................................................................................................... 36
Note 25 – Short term lease liabilities and revenue commitments.......................................................................................................................................................................... 38
Note 26 – Contingent assets and liabilities............................................................................................................................................................................................................ 38
Note 27 – Financial instruments ........................................................................................................................................................................................................................... 39
Note 28 – Changes in net working capital ............................................................................................................................................................................................................. 41
Note 29 – Mortgages and security ........................................................................................................................................................................................................................ 42
Note 30 – Related party disclosures ..................................................................................................................................................................................................................... 42
Note 31 – Transition to IFRS 16 ............................................................................................................................................................................................................................ 42
Note 32 – Subsequent events ............................................................................................................................................................................................................................... 43
Note 33 – New financial reporting regulation ....................................................................................................................................................................................................... 43

21 | Ultrabulk A/S Annual Report 2019 | Notes to the consolidated financial statement
Note 1 – Group accounting policies
Ultrabulk A/S is a company domiciled in Denmark.
The consolidated financial statements of Ultrabulk A/S for 2019 have been prepared
in accordance with International Financial Reporting Standards as adopted by the
EU and additional requirements of the Danish Financial Statements Act.
Basis of preparation
The consolidated financial statements have been prepared on the historical cost
basis except all financial assets and liabilities. These financial assets and liabilities
have been measured at fair value. The carrying values of recognised assets and
liabilities that are hedged items in fair value hedges and otherwise carried at cost
are adjusted to record changes in the fair values attributable to the risks that are
being hedged.
The accounting policies set out below have been used consistently in respect of the
financial year and the comparative figures.
The consolidated financial statements have been presented in USD thousands (USD
´000), except when otherwise indicated.
Accounting standards effective in 2019
Ultrabulk A/S has adopted all new or amended and revised accounting standards
and interpretations (IFRSs´) endorsed by the EU effective for the accounting period
beginning on 1 January 2019.
IFRS 16, Leases:
The transition to IFRS 16 is in accordance with the full retrospective approach and previous periods comparative figures have been adjusted in the financial statements. For a description of the impact please refer to note 31. Leases are recognised as right-of-use assets with corresponding lease liabilities at the date on which the leased asset is available for use. The right-of-use asset is depreciated over the shorter of the asset’s useful life and the lease term on a straight line basis. The lease payments is allocated between a reduction of the lease liabilities and an interest expenses. The interest expenses is
charged to the income statement over the lease period to produce a constant period rate of interest on the remaining balance of the liability for each period. The Group elected not to reassess whether a contract is, or contains, a lease at 1 January 2019. The standard includes low recognition exemptions for lessees which is leases of low-value and short term leases (i.e. leases with a lease term of 12 months or less). If a leased vessel is sub-leased under terms transferring substantially all remaining risks and rewards under the head lease to a lessee in the sub-lease, the right-of-use asset is derecognised and a lease receivable is recognised. Gain/loss on the derecognised right-of-use is recognised in the income statement as other operating income/expenses. Other: Several other amendments and interpretations apply for the first time in 2019, but do not have an impact on the consolidated financial statements of the Group. The Group has not early adopted any standards, interpretations or amendments that have been issued but are not yet effective.
Basis of consolidation
The consolidated financial statements comprise the Parent Company Ultrabulk A/S
and subsidiaries in which Ultrabulk A/S has control (the Group), i.e. the power to
govern the financial and operating policies so as to obtain benefits from its
activities. Control is obtained when the Company directly or indirectly holds more
than 50% of the voting rights in the subsidiary or which it, in some other way,
controls.
Enterprises over which the Group exercises significant influence, but which it does
not control, are considered associates. Significant influence is generally obtained by
direct or indirect ownership or control of more than 20% of the voting rights but
less than 50%.
When assessing whether Ultrabulk A/S exercises control or significant influence,
potential voting rights which are exercisable at the balance sheet date are taken
into account.
Common control transactions are accounted for using the pooling-of-interest
method. The receiving company of the net assets initially recognizes the assets and

22 | Ultrabulk A/S Annual Report 2019 | Notes to the consolidated financial statement liabilities transferred at their carrying amount. The result of operations for the
period in which the transfer occurs is presented as though the transfer had
occurred at the beginning of the period. Financial statements and financial
information for prior years are restated to provide appropriate comparative
information.
The consolidated financial statements have been prepared as a consolidation of the
Parent Company's and the individual subsidiaries' financial statements prepared
according to the Group accounting policies. On consolidation, intra-group income
and expenses, shareholdings, intra-group balances and dividends, and realised and
unrealised gains on intra-group transactions are eliminated. Unrealised gains on
transactions with associates are eliminated in proportion to the Group's ownership
share of the enterprise. Unrealised losses are eliminated in the same way as
unrealised gains to the extent that impairment has not taken place.
The accounting items of subsidiaries are included in full in the consolidated financial
statements. Non-controlling interests' share of the profit/loss for the year and of
the equity of subsidiaries which are not wholly owned are included in the Group's
profit/loss and equity, respectively, but are disclosed separately.
Foreign currency translation
For each of the reporting entities in the Group, a functional currency is determined.
The functional currency is the currency used in the primary financial environment in
which the reporting entity operates. Transactions denominated in other currencies
than the functional currency are foreign currency transactions.
On initial recognition, foreign currency transactions are translated to the functional
currency at the exchange rates at the transaction date. Foreign exchange
differences arising between the transaction date and at the date of payment are
recognised in the income statement as financial income or financial expenses.
Receivables and payables and other monetary items denominated in foreign
currencies are translated to the functional currency at the exchange rates at the
balance sheet date. The difference between the exchange rates at the balance
sheet date and at the date at which the receivable or payable arose or was
recognised in the latest annual report is recognised in the income statement as
financial income or financial expenses.
In the consolidated financial statements, the income statements of entities with
another functional currency than USD are translated at the exchange rates at the
transaction date and the balance sheet items are translated at the exchange rates
at the balance sheet date. An average exchange rate for each month is used as the
transaction date exchange rate to the extent that this does not significantly distort
the presentation of the underlying transactions. Foreign exchange differences
arising on translation of the opening balance of equity of such foreign operations at
the exchange rates at the balance sheet date and on translation of the income
statements from the exchange rates at the transaction date to the exchange rates
at the balance sheet date are recognised in other comprehensive income and
presented in equity under a separate translation reserve.
Derivative financial instruments and hedging
The Group uses derivative financial instruments such as forward currency contracts,
bunker hedge and FFA’s to hedge part of risks. Such derivative financial instruments
are initially recognised at fair value on the date on which a derivate contract is
entered into and are subsequently re-measured at fair value. Derivatives are carried
as assets when the fair value is positive and as liabilities when the fair value is
negative. Any gains or losses arising from changes in fair value on derivatives that
do not qualify for hedge accounting are taken directly to profit or loss.
The fair value of forward currency contracts is calculated by reference to current
forward exchange rates for contracts with similar maturity profiles.
The fair value of bunker hedge and the fair value of FFA’s are determined by
reference to market values for similar instruments.
For the purpose of accounting, hedges are classified as:
• fair value hedges when hedging the exposure to change in fair value of a
recognised asset or liability or an unrecognised firm commitment (except for
foreign currency risk); or
• cash flow hedge when hedging exposure to variability in cash flow that is either
attributable to a particular risk associated with a recognised asset or liability or
a highly probable forecast transaction or the foreign currency risk in an
unrecognised firm commitment.
At time of entering into a hedge relationship, the Group designates and documents
the hedge relationship to which the Group wishes to apply for hedge accounting
and the risk management objectives and strategy for undertaking the hedge. The
documentation includes identification of the hedging instrument, the hedged item
23 | Ultrabulk A/S Annual Report 2019 | Notes to the consolidated financial statement or transaction, the nature of the risk being hedged and how the entity will assess
the hedging instrument’s effectiveness requirements.
The criteria for classifying a derivative as a hedging instrument for accounting
purposes are as follows:
• there is an economic relationship between the hedged item and the hedging
instrument
• the effect of credit risk does not dominate the value changes that result from
the economic relationship
• the hedge ratio of the hedging relationship is the same as that resulting from
the quantity of the hedged items that the entity actually hedges and the
quantity of the hedging instrument that the entity actually uses to hedge that
quantity of hedged item.
Hedges which meet the criteria for hedge accounting are accounted for as follows:
Fair value hedges
Derivatives designated as hedging instruments are measured at fair value and
changes in fair value are recognised in the income statement. Correspondingly, a
change in the fair value of the hedged item attributable to the hedged risk is
recognised in the income statement. The fair value hedge accounting is
discontinued if the hedging instrument expires or is sold, terminated or exercised,
or the hedge no longer meets the criteria for hedge accounting stated above.
Cash flow hedges
Changes in the fair value of a hedging instrument that meet the criteria for cash
flow hedge accounting are recognized in other comprehensive income. The
ineffective part of the hedging instrument is recognised directly in the income
statement. Gains and losses that are recognised in other comprehensive income are
taken to the income statement in the same period or periods as the cash flow which
comprises the hedged item is recognised in the income statement. The principle
also applies if the hedged forecasted transaction results in an asset or liability being
recognised in the balance sheet. If the cash flow hedge no longer meets the criteria
for hedge accounting, hedge accounting is discontinued. The cumulative gain or loss
of the hedging instrument recognised in comprehensive income remains separately
recognised in comprehensive income until the forecast transaction occurs. If the
cash flow hedged transaction is no longer expected to occur, any previously
accumulated gain or loss of the hedging instrument that has been recognised in
other comprehensive income will be carried to profit or loss. Derivatives not
accounted for as hedging instruments are classified as financial assets at fair value
through profit or loss and measured at fair value. Changes in the fair value of such
derivatives are recognised in the income statement.
Determination of fair value
The fair value of financial assets and liabilities is measured on the basis of quoted
market prices of financial instruments traded in an active market. If an active
market exists, fair value is based on the most recent observed market price at the
end of the reporting period.
If an active market does not exist, the fair value is measured according to generally
accepted valuation techniques. Market-based parameters are used to measure fair
value.
For bunker contracts the price is based on the prices from Platts Bunkerwire. The
value of FFAs is assessed on basis of daily recorded prices from the Baltic Exchange.
Leases
Right-of-use assets
Ultrabulk recognises right-of-use assets at the commencement date of the lease
(i.e. the date the underlying asset is available for use). Right-of-use assets are
measured at cost, less any accumulated depreciation and impairment losses, and
adjusted for any remeasurement of lease liabilities. The cost of right-of-use assets
includes the amount of lease liabilities recognised, and lease payments made
before the commencement date. Unless the Group is reasonably certain to obtain
ownership of the leased asset at the end of the lease term, the recognised right-of-
use assets are depreciated on a straight-line basis over the shorter of its estimated
useful life and the lease term.
Right-of-use assets are subject to testing for impairment if there is an indicator of
impairment, as for owned assets.
Lease liabilities
At the commencement date of the lease, Ultrabulk recognises lease liabilities
measured at the present value of lease payments to be made over the lease term.
The service fee included in the payments are not included as part of the lease
liabilities. The lease term comprises the non-cancellable period with addition of
periods covered by options to extend the lease if Ultrabulk is reasonably certain to

24 | Ultrabulk A/S Annual Report 2019 | Notes to the consolidated financial statement exercise the extension option. This assessment is made on inception of the lease.
The lease payments include fixed payments and variable payments depending on an
index or a rate. The lease payments also include the exercise price of a purchase
option reasonably certain to be exercised by Ultrabulk.
In calculating the present value of lease payments, Ultrabulk uses the incremental
borrowing rate at the lease commencement date. After the commencement date,
the amount of lease liabilities is increased to reflect the accretion of interest and
reduced for the lease payments made. In addition, the carrying amount of lease
liabilities is remeasured if there is a modification, a change in the lease term, a
change in the fixed lease payments or a change in the assessment to purchase the
underlying asset.
Subleasing The Group enters into arrangements to sublease an underlying asset to a third party, while Ultrabulk retains the primary obligation under the original lease. In these arrangements, Ultrabulk acts as both the lessee and lessor of the same underlying asset. If a leased vessel is sub-leased under terms transferring substantially all remaining risks and rewards under the head lease to the lessee in the sub-lease, the right-of-use asset is derecognised, and a lease receivable is recognised. Gain/loss on the derecognised right-of-use asset, if any, is recognised in the income statement as other operating income/expenses. During the term of the sublease, Ultrabulk recognises both finance income on the
sublease as revenue and interest expense on the head lease as financial expense.
Short-term leases and leases of low-value assets The Group applies the short-term lease recognition exemption to the short-term leases and leases for which the underlying asset is of low value such as office equipment and company cars. Lease payments on short-term leases and leases of low-value assets are recognised as expense on a straight-line basis over the lease term. Business activities
As the Company is unlisted it has been decided not to follow IFRS 8 Operating
Segments.
Non-controlling interests
Non-controlling interests represent the portion of profit or loss and net assets not
held by Ultrabulk A/S and are presented separately in the income statement and
within equity in the consolidated balance sheet, separately from the parent
shareholders’ equity. Initially the non-controlling interest is recognised based on
their share of the fair value of the assets and liabilities acquired.
INCOME STATEMENT
Revenue and expenses
All voyage revenues and voyage expenses are recognised as the services are
rendered bases the percentage of completion method. According to the method all
spot voyages and voyages servicing contract of affreightment (CoA) and the related
expenses are recognised from the vessel’s load date to the delivery of the cargo
(discharge). Expenses directly attributable to position the vessel to the loading port
is capitalised and amortised over the course of the transportation period.
Demurrage is included if a claim is considered probable.
Losses arising from time or voyage charter are provided for in full when they
become probable.
Profit and loss from the sale of vessels etc.
Profits and losses from the sale of vessels are stated as the difference between the
sales price of the vessel less the selling costs and the carrying amount of the vessel
at the time of delivery.
Profit from investments in associates
The proportionate share of the result after tax of associates is recognized in the
consolidated income statement after elimination of the proportionate share of
intra-group profits/losses.
Profit from investments in joint ventures
The proportionate share of the result after tax of the joint ventures is recognized in
the consolidated income statement after elimination of the proportionate share of
intra-group profit/losses.
25 | Ultrabulk A/S Annual Report 2019 | Notes to the consolidated financial statement Financial income and expenses
Financial income and expenses comprise interest income and expense, gains and
losses on payables and transactions denominated in foreign currencies,
amortisation of financial assets and liabilities.
Taxes
Ultrabulk A/S is jointly taxed with the Parent Company Ultranav Denmark ApS and
the Parent Company is the administration company for the jointly taxed companies.
The current Danish corporation tax is allocated between the jointly taxed
companies in proportion to their taxable income. In relation to the shipping
activities Ultrabulk A/S participates in the Danish Tonnage Tax Scheme. Companies
that use tax losses in other companies pay the joint tax contribution to the Parent
Company at an amount corresponding to the tax value of the tax losses used.
Companies whose tax losses are used by other companies receive joint tax
contributions from the Parent Company corresponding to the tax value of the losses
used (full absorption). The jointly taxed companies are taxed under the tax
prepayment scheme.
Tax for the year comprises current tax and changes in deferred tax for the year. The
tax expense relating to the profit/loss for the year is recognised in the income
statement. Tax attributable to entries directly under comprehensive income is
recognised directly in other comprehensive income.
BALANCE SHEET
Tangible assets
Tangible assets are measured at cost less accumulated depreciation and
impairment losses.
Cost comprises the purchase price and any costs directly attributable to the
acquisition until the date when the asset is available for use. Instalments and costs
incurred during the construction period on new building contracts are capitalised as
they are paid. Borrowing costs (interest) that are attributable to the construction of
the vessels are capitalised and included as part of the cost. The capitalised value is
reclassified from new buildings to vessels upon delivery from the yard.
Where individual components of an item of tangible assets have different useful
lives, they are depreciated separately. Depreciation is provided on a straight-line
basis over the expected useful lives of the assets/components. The expected useful
lives are as follows:
• Vessels: 20 years
• Fixtures, fittings and equipment: 3 - 10 years
Depreciation is calculated on the basis of the residual value and impairment losses,
if any. The useful life and residual value are determined at the acquisition date and
reassessed annually. If the residual value exceeds the carrying amount, depreciation
is discontinued. The residual value of the vessels is estimated as the lightweight
tonnage of each vessel multiplied by scrap value per ton.
When changing the depreciation period or the residual value, the effect on the
depreciation is recognised prospectively as a change in accounting estimates.
The carrying values of vessels and new buildings are reviewed for impairments
when events or changes in circumstances indicate that the carrying value may not
be recoverable. Valuations are performed frequently to ensure that the fair value of
the asset does not differ materially from its carrying amount.
Investments in associates
Investments in associates are recognised in the consolidated financial statements
according to the equity method. Investments in associates are measured at the
proportionate share of the enterprises' net asset values calculated in accordance
with the Group's accounting policies minus or plus the proportionate share of
unrealised intra-group profits and losses and plus additional value on acquisition,
including goodwill. Investments in associates are tested for impairment when
impairment indicators are identified.
Investments in associates with negative net asset values are measured at USD 0
(nil). If the Group has a legal or constructive obligation to cover a deficit in the
associate, the remaining amount is recognised under provisions.
Amounts owed by associates are measured at amortised cost. Write-down is made
for bad debt losses.
Investments in joint ventures
Undertakings which are contractually operated jointly with one and more
undertakings (joint ventures) and thus are jointly controlled are recognised in the
consolidated financial statements according to the equity method.

26 | Ultrabulk A/S Annual Report 2019 | Notes to the consolidated financial statement Investments in joint ventures are measured at the proportionate share of the
enterprises' net asset values calculated in accordance with the Group's accounting
policies minus or plus the proportionate share of unrealised intra-group profits and
losses and plus additional value on acquisition, including goodwill. Investments in
joint ventures are tested for impairment when impairment indicators are identified.
Investments in joint ventures with negative net asset values are measured at USD 0
(nil). If the Group has a legal or constructive obligation to cover a deficit in the joint
ventures, the remaining amount is recognised under provisions.
Amounts owed by joint ventures are measured at amortised cost. Write-down is
made for bad debt losses.
Impairment of non-current assets
The carrying amount of other non-current assets is tested annually for indicators of
impairment. When there is an indication that assets may be impaired, the
recoverable amount of the asset is determined. The recoverable amount is the
higher of an asset's fair value less expected costs to sell and its value in use. Value in
use is the present value of the future cash flows expected to be derived from an
asset or the cash-generating unit to which the asset belongs.
An impairment loss is recognised if the carrying amount of an asset or a cash-
generating unit, respectively, exceeds the recoverable amount of the asset or the
cash-generating unit. Impairment losses are recognised in the income statement in
a separate line item. Impairment is reversed only to the extent of changes in the
assumptions and estimates underlying the impairment calculation. Impairment is
only reversed to the extent that the asset's increased carrying amount does not
exceed the carrying amount that would have been determined (net of amortisation
or depreciation) had no impairment loss been recognised for the asset in prior
years.
Receivables
Receivables are measured at amortised cost less provisions for impairment losses.
Impairment loss for trade receivables are determined as the expected loss over the
life of the receivables (simplified approach).
Contract assets
Contract assets includes accrued revenue in progress at 31 December. Contract assets are recognised when a sales transaction fulfils the criteria for revenue
recognition but no final invoice has yet been issued to the customer for the services delivered.
Inventories
Inventories are valued at the lower of cost and net realisable value. Cost is
determined on a first-in, first-out (FIFO) basis. Net realisable value is the estimated
selling price in the ordinary course of business, less applicable variable selling
expense. Costs of bunkers include the transfer from equity to profit and loss on
qualifying cash flow hedges.
Prepayments
Prepayments comprise costs incurred in relation to subsequent financial years.
Contract liabilities
Contract liabilities includes accrued revenue in progress at 31 December. Contract
liabilities are recognised when a sales transaction does not fulfils the criteria for
revenue recognition but the customer has prepaid for the service delivery. If
contract liabilities are beyond one year the contract assets are included in non
current liabilities.
Assets held for sale
The Group classifies non-current assets and disposal groups as held for sale if their
carrying amounts will be recovered principally through a sale transaction rather
than through continuing use. Non-current assets and disposal groups classified as
held for sale are measured at the lower of their carrying amount and fair value less
costs to sell. Costs to sell are the incremental costs directly attributable to the
disposal of an asset (disposal group), excluding finance costs and income tax
expense.
The criteria for held for sale classification is regarded as met only when the sale is
highly probable and the asset or disposal group is available for immediate sale in its
present condition. Actions required to complete the sale should indicate that it is
unlikely that significant changes to the sale will be made or that the decision to sell
will be withdrawn. Management must be committed to the plan to sell the asset
and the sale expected to be completed within one year from the date of the
classification.

27 | Ultrabulk A/S Annual Report 2019 | Notes to the consolidated financial statement Property, plant and equipment assets are not depreciated or amortised once
classified as held for sale.
Cash and cash equivalents
Cash and cash equivalents in the balance sheet comprise cash at bank and in hand
and short-term deposits with an original maturity of three months or less.
Statement of changes in equity
Dividends
Dividends are recognised as a liability at the date when they are adopted at the
annual general meeting (declaration date). The proposed dividend payment for the
year is disclosed as a separate item under equity. Interim dividends are recognised
as a liability at the date when the decision to pay interim dividends is made.
Translation reserve
The translation reserve comprises foreign exchange differences arising on
translation of financial statements of entities that have a functional currency
different from USD. On full or partial realisation of the net investment, the foreign
exchange adjustments are recognised in the income statement.
Hedging reserve
The hedging reserve comprises the cumulative net change in the fair value of
hedging transactions that qualify for recognition as a cash flow hedge and where
the hedged transaction has not been realised.
Provisions
Provisions are recognised when Ultrabulk A/S has a present obligation (legal or
constructive) as a result of a past event, it is probable that the obligation has to be
settled and that a reliable estimate of the obligation can be made.
Financial liabilities
Loans are recognised at the time the loans are obtained in the amount of the
proceeds after deduction of transaction costs. In subsequent periods, the loans are
recognised at amortised costs.
Other liabilities, including trade payables, payables to related parties as well as
other payables, are measured at amortised cost.
Deferred tax
All significant Danish entities within the Group entered into the Danish tonnage
taxation scheme for a binding 10 year period with effect from 2007 and Ultrabulk
will not leave the system. Under the Danish tonnage taxation scheme, taxable
income is not calculated on the basis of income and expenses as under the normal
corporate taxation. Instead, taxable income is calculated with reference to the
tonnage used during the year. The taxable income for a company for a given period
is calculated as the sum of the taxable income from the activities under the tonnage
taxation scheme and the taxable income from the activities that are not covered by
the tonnage taxation scheme made up in accordance with the ordinary Danish
corporate tax system.
If the participation in the Danish tonnage taxation scheme is abandoned, or if the
entities' level of investment and activity is significant reduced, a deferred tax
liability will become payable.
For the taxable income which is made up in accordance to the ordinary corporate
tax system, a deferred tax is recognized at each period end and is accounted for
using the balance sheet liability method. Deferred tax assets, including the tax value
of tax loss carry forwards, are recognised under other non-current assets at the
expected value of their utilisation - either as a set-off against tax on future income
or as a set-off against deferred tax liabilities in the same legal tax entity and
jurisdiction.
Deferred tax assets and liabilities are offset if the Company has a legally enforceable
right to set off current tax liabilities and tax assets or intends either to settle current
tax liabilities and tax assets on a net basis or to realise the assets and settle the
liabilities simultaneously.
Cash flow statement
The cash flow statement shows the cash flows from operating, investing and
financing activities for the year, the year's changes in cash and cash equivalents as
well as cash and cash equivalents at the beginning and end of the year.
Cash flows from operating activities are calculated according to the indirect method
as the profit/loss before tax adjusted for non-cash operating items, changes in
working capital, interest, payments, dividends and income taxes paid.
Cash flows from investing activities comprise payments in connection with
acquisitions and disposals of businesses and of intangible assets, property, plant

28 | Ultrabulk A/S Annual Report 2019 | Notes to the consolidated financial statement and equipment and other non-current assets as well as acquisition and disposal of
securities not classified as cash and cash equivalents.
Cash flows from financing activities comprise changes in the share capital and
related costs as well as the raising of loans, repayment of interest-bearing debt and
leases, interest payments, acquisition and disposal of treasury shares and payment
of dividends to shareholders.
Cash and cash equivalents comprise cash and short-term marketable securities with
a term of three months or less at the acquisition date which are subject to an
insignificant risk of changes in value.
Cash flows in other currencies than the functional currency are translated using
average exchange rates unless these deviate significantly from the rate at the
transaction date.
Note 2 - Significant accounting judgment, estimates and assumptions
The preparation of the Group's consolidated financial statements requires
management to make judgments, estimates and assumptions that affect the
reported amounts of revenues, expenses, assets and liabilities and the disclosure of
contingent liabilities, at the end of the reporting period. However, uncertainty
about these assumptions and estimates could result in outcomes that require a
material adjustments to the carrying amounts of asset and liability affected in
future periods.
Judgments
In the process of applying Ultrabulk A/S accounting policies, management has made
the following judgments which have the most significant effect on the amounts
recognised in the financial statements.
Hedge accounting
In connection with forward freight agreements (FFA’s), purchase of bunkers and
currencies Ultrabulk A/S uses hedge accounting. Several qualifications have to be
met before a hedge is qualified as hedge accounting. One of the qualifications is
that the hedge is expected to be highly effective. If a hedge is subsequently
measured as ineffective, and therefore deviates from the original judgment, the
result must be carried to profit and loss immediately. This could result in a
reallocation of the result from one accounting year to another.
Please refer to note 27 for further details.
Estimates and assumptions
The key assumptions concerning the future and other key sources of estimating
uncertainty at the reporting date, that have a significant risk of causing a material
adjustment to the carrying amount of assets and liabilities within the next financial
year are discussed below.
Impairment of non-financial assets
Managements assessment of indication of impairment on vessels, right-of use
assets and prepayments on newbuilding’s is based on the cash-generating units in
which assets are included. Management has concluded that the entire fleet of dry
bulk vessels (owned and leased) constitutes a cash generating unit, as the vessels
are managed on a portfolio basis and considered to be interchangeable.
At the end of 2019 the market value (broker valuations) were below the carrying
amount of the Group’s three owned vessels. This is considered an impairment
indicator and therefore Management has prepared an impairment test for the dry
bulk fleet, consisting of owned vessels (carrying amount of USD 62.8 million), right-
of-use-assets (carrying amount of USD 328.3 million) and related net working
capital etc.
The impairment test was carried out based on value-in-use. In assessing value in
use, the estimated future cash flows are discounted to their present value using
discount rate that reflects current market assessments of the time value of money
and the risks specific to the assets.
The Group bases its impairment calculation on most recent budgets and forecast
calculations. These budgets and forecast calculations generally cover a period of
five years. No terminal value has been included in the impairment tests.
At 31 December 2019, a pre-tax discount rate of 8.0% has been applied. The
discount rate has been determined by Management based on market input and
taking into consideration the business model applied by the Group, including having
a coverage through long term cargo contracts with customers.
Management’s expected rates (income) for open vessel days (uncovered capacity)
for the next 2 years are based on the Baltic market rates (short term), average of

29 | Ultrabulk A/S Annual Report 2019 | Notes to the consolidated financial statement Baltic market rate and internal rate for year 3 and hereafter the rates are based on
the Company’s own (internal) rate model. In establishing those, consideration is
given to external economic analysis, and the internal rate assumptions include
amongst other things scrapping of old tonnage as well as increased demand. The
internal rates are to the extent available tested against information from external
parties (brokers) and the historical long-term rate development.
The corona virus outbreak in certain parts of the world poses a downside risk to
demand for vessels. Due to the uncertainty, it is not possible to predict the
outcome, but over the budget period of five years, no significant effect to the world
economy and thereby (indirectly) demand for our vessels, is expected.
As time-charters expire over the budget period, it is generally assumed that expired
vessels are replaced with new time charters.
The impairment test calculation shows no impairment loss at 31 December 2019
and no reversal of previous taken impairment loss. The impairment test is highly
sensitive to the discount rate applied, and adverse changes to freight rates and
EBITDA. As an indicator of the sensitivity, a downward fluctuation in EBITDA of 5%,
all other things being equal, will change the value in use with approx. USD 30
million. Furthermore, the application of a WACC of 9.0% instead of 8.0% will change
the value in use with approx. USD 10 million, all other things being equal.
Owned vessels
As noted above the owned vessels are managed together with leased vessels and
therefore included within the dry bulk fleet. Impairment tests are prepared for the
entire bulk fleet. Broker market values show a lower value than the carrying
amount which indicates impairment. Value-in-use tests show no impairment at 31
December 2019.
The impairment test is highly sensitive to the discount rate applied, and adverse
changes to freight rates.
Provision for litigation and claims:
The Group is a party to various litigation proceedings and claims have been made
against the Group. Provision for estimated losses is made in the income statement if
both of the following criteria are met:
• The information that was available prior to the publication of the financial
statements indicates that it is more likely than not that an obligation has arisen
at the balance sheet date.
• The amount of the loss can be reliably measured
Please refer to note 26 for further details.
Lease liabilities
The Group has elected to separate lease and non-lease components for leases of time charter contracts on vessels. For these contracts, the estimated non-lease component (daily running costs) is excluded from the right-of-use assets. Assessing the measurement of the non-lease component includes a significant accounting judgement. The measurement of the non-lease component takes several factors into consideration such as operating costs, aging of the vessels, vessel types, etc.

30 | Ultrabulk A/S Annual Report 2019 | Notes to the consolidated financial statement
Note 3 – Revenue
Revenue per business activities:
2018
Figures in USD '000 2019 Restated
Panamax 199.504 276.829
Supramax 394.872 388.880
Handysize 212.472 243.046
MPP, Parcel Services and African Services 195.365 134.581
Revenue - sublease financial income 3.420 4.277
Total 1.005.634 1.047.614
Revenue per categories:
2018
Figures in USD '000 2019 Restated
Income from freight 800.899 829.079
Income from time charter 197.034 206.014
Other 7.701 12.521
Total 1.005.634 1.047.614
Revenue recognized at a point in time constitutes below 1% of the revenue.
Note 4 – Time-charter and opex expenses
2018
Figures in USD '000 2019 Restated
Time-charter 375.125 392.389
Opex element, IFRS 16 69.813 73.201
Opex own vessels 5.482 5.098
Total 450.421 470.688
Note 5 – Remuneration to the auditor appointed at the general meeting
2018
Figures in USD '000 2019 Restated
Audit 150 150
Other assurance service 0 0
Tax consultancy 32 52
Other services 21 0
Total 203 202
Note 6 – Staff costs
2018
Figures in USD '000 2019 Restated
Fixed salaries 11.549 11.559
Pensions - defined contribution plan 662 651
Other expenses for social security etc. 687 661
Incentive payment (cash based) 1.818 1.738
Staff costs included in administration expenses 14.716 14.609
Average number of employees 96 97
Remuneration for certain employees in 2019 and 2018 are expensed as
management fee, and consequently recognized as “Other external expenses”.
2018
Remuneration for the Management 2019 Restated
Figures in USD '000 Board of Directors
Executive Management
Board of Directors
Executive Management
Fixed salaries 0 885 0 899
Pensions - defined contribution plan 0 28 0 28
Incentive payment (cash based) 0 358 0 182
Total remuneration for the Board of directors and executive management
0 1.271 0 1.109

31 | Ultrabulk A/S Annual Report 2019 | Notes to the consolidated financial statement The members of the Executive Management are subject to a notice of up to 18
months and can resign from management with a notice up to 9 months. No
severance payment applies.
Senior management and a number of the employees are covered by an incentive
scheme (cash based).
Note 7 – Depreciation
2018
Figures in USD '000 2019 Restated
Depreciation vessels 4.250 4.252
Right-of-use assets 98.764 101.813
Depreciation fixtures, fittings and equipment 573 263
Total depreciation 103.587 106.328
Note 8 – Financial items
2018
Figures in USD '000 2019 Restated
Interest income
1.604
913
Interest expense on loan -2.280 -1.963
Other financial items, net -278 -354
Interest expenses lease liabilities -15.966 -17.243
Total -16.921 -18.647
Note 9 – Tax
2018
Figures in USD '000 2019 Restated
Current tax on profit for the year -1.623 -1.243
Deferred tax on profit for the year -137 -301
Tax on profit for the year -1.760 -1.544
Adjustments related to previous years - current tax 124 49
Adjustments related to previous years - deferred tax 0 -15
Tax in the income statement -1.636 -1.510
Computation of effective tax rate (%):
Statutory corporate income tax rate in Denmark 22,0 22,0
Effects from Tonnage Tax Scheme 3,5 -4,6
Effects of adjustments related to prior years -2,1 -0,1
Deviation in foreign subsidiaries' tax rates
compared to the Danish tax rate (net) -12,2 -8,4
Non-tax income less non-tax deductible expenses (net) 0,0 0,0
Effective tax rate 11,2 8,9
Tax on fair value adjustments on financial instruments 0 0
Tax relating to other comprehensive income 0 0

32 | Ultrabulk A/S Annual Report 2019 | Notes to the consolidated financial statement
Note 10 – Vessels
2018
Figures in USD '000 2019 Restated
Cost at 1 January 97.281 72.897
Transferred from newbuilding’s 0 24.177
Additions for the year 21.954 22.391
Disposals for the year -46.206 -22.184
Cost at 31 December 73.029 97.281
Depreciation and impairment at 1 January -12.584 -8.332
Depreciation for the year -4.250 -4.252
Disposals for the year 6.635 0
Depreciation and impairment at 31 December -10.199 -12.584
Carrying amount at 31 December 62.831 84.697
Expected useful life of vessels: 20 years 20 years
Regarding impairment test of the vessels see note 2.
Note 11 – New building contracts
Figures in USD '000 2019 Restated
Cost at 1 January 1.508 5.506
Additions for the year 4.122 20.179
Disposal and transferred during the year to vessels 0 -24.177
Transferred to assets held for sale -5.630 0
Cost at 31 December 0 1.508
Carrying amount at 31 December 0 1.508
The newbuilding has been sold after delivery from the shipyard in January 2020.
The carrying amount has been transferred to assets held for sale.
Note 12 – Fixtures, fittings and equipment
2018
Figures in USD '000 2019 Restated
Cost:
Cost at 1 January 5.510 4.564
Additions for the year 513 946
Cost at 31 December 6.023 5.510
Depreciation and impairment at 1 January -4.637 -4.377
Depreciation for the year -573 -260
Depreciation and impairment at 31 December -5.210 -4.637
Carrying amount at 31 December 813 873
Expected useful life: 3-10 years 3-10 years
Note 13 – Right-of-use assets
2018
Figures in USD '000 2019 Restated
Cost at 1 January 642.073 611.021
Additions for the year 65.185 105.752
Remeasurements 16.526 11.833
Disposals for the year -40.141 -86.533
Cost at 31 December 683.643 642.073
Depreciation at 1 January -296.713 -281.432
Depreciation for the year -98.764 -101.813
Disposals for the year 40.141 86.533
Depreciation at 31 December -355.336 -296.712
Carrying amount 31 December 328.307 345.361
Regarding impairment test see note 2.

33 | Ultrabulk A/S Annual Report 2019 | Notes to the consolidated financial statement
Note 14 – Investments in associates
2018
Figures in USD '000 2019 Restated
Cost:
Cost at 1 January 1.408 1.408
Cost at 31 December 1.408 1.408
Value adjustment at 1 January 67
910
Exchange rate adjustment 218 -567
Impairment -262 -516
Share of the result for the year -682 241
Value adjustment at 31 December -659 67
Carrying amount at 31 December 750 1.476
The carrying amount can be specified as follows:
Pérola S.A., Brasil, interest 20% 750 1.476
750 1.476
Key figures for investment in associates:
Assets 7.278 12.145
Liabilities -2.219 -4.763
Net assets 5.058 7.382
Revenue 14.437 22.569
Profit/loss before tax -5.089 1.856
Income tax 1.679 -651
Profit/loss for the year -3.410 1.205
Total comprehensive income for the year -3.410 1.205
Note 15 – Investments in joint ventures
2018
Figures in USD '000 2019 Restated
Cost:
Cost at 1 January 23.825 23.825
Cost at 31 December 23.825 23.825
Value adjustment at 1 January 1.757 942
Share of the result for the year -303 815
Value adjustment at 31 December 1.454 1.757
Carrying amount at 31 December 25.279 25.582
The carrying amount can be specified as follows:
Ultra Summit (Singapore) Pte. Ltd., 50% 25.279 25.582
25.279 25.582
Key figures for investment in joint ventures (100 % basis):
Assets 115.974 116.880
Liabilities -65.415 -65.716
Net assets 50.558 51.164
Revenues 16.413 14.666
Profit/loss before tax -606 1.630
Income tax 0 0
Profit/loss for the year -606 1.630
Total comprehensive income for the year -606 1.630
Ultra Summit owns 4 vessels. The vessels are chartered out to Ultrabulk. The
management has prepared an impairment test of the vessels, under the same
assumption as described in note 2, although a WACC of 7.75% is used. The
impairment test calculation shows no impairment loss. As an indicator of the
sensitivity, a downward fluctuation of the freight rates for uncovered capacity with
5% would, all other things being equal, give rise to a reduced value in use of USD 2
million. Furthermore, the application of a WACC of 8.0% instead of 7.75% would, all
other things being equal, result in a reduced value in use of USD 1 million.
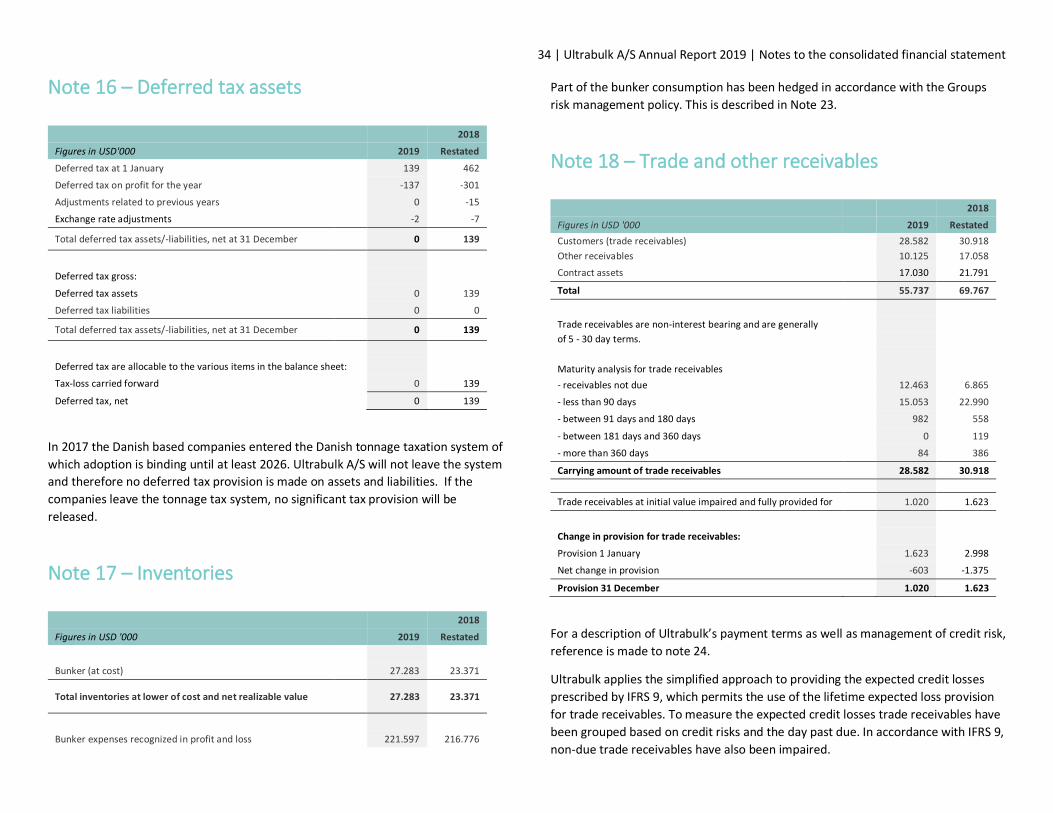
34 | Ultrabulk A/S Annual Report 2019 | Notes to the consolidated financial statement
Note 16 – Deferred tax assets
2018
Figures in USD'000 2019 Restated
Deferred tax at 1 January 139 462
Deferred tax on profit for the year -137 -301
Adjustments related to previous years 0 -15
Exchange rate adjustments -2 -7
Total deferred tax assets/-liabilities, net at 31 December 0 139
Deferred tax gross:
Deferred tax assets 0 139
Deferred tax liabilities 0 0
Total deferred tax assets/-liabilities, net at 31 December 0 139
Deferred tax are allocable to the various items in the balance sheet:
Tax-loss carried forward 0 139
Deferred tax, net 0 139
In 2017 the Danish based companies entered the Danish tonnage taxation system of
which adoption is binding until at least 2026. Ultrabulk A/S will not leave the system
and therefore no deferred tax provision is made on assets and liabilities. If the
companies leave the tonnage tax system, no significant tax provision will be
released.
Note 17 – Inventories
2018
Figures in USD '000 2019 Restated
Bunker (at cost) 27.283 23.371
Total inventories at lower of cost and net realizable value 27.283 23.371
Bunker expenses recognized in profit and loss 221.597 216.776
Part of the bunker consumption has been hedged in accordance with the Groups
risk management policy. This is described in Note 23.
Note 18 – Trade and other receivables
2018
Figures in USD '000 2019 Restated
Customers (trade receivables) 28.582 30.918
Other receivables 10.125 17.058
Contract assets 17.030 21.791
Total 55.737 69.767
Trade receivables are non-interest bearing and are generally
of 5 - 30 day terms.
Maturity analysis for trade receivables
- receivables not due 12.463 6.865
- less than 90 days 15.053 22.990
- between 91 days and 180 days 982 558
- between 181 days and 360 days 0 119
- more than 360 days 84 386
Carrying amount of trade receivables 28.582 30.918
Trade receivables at initial value impaired and fully provided for 1.020 1.623
Change in provision for trade receivables:
Provision 1 January 1.623 2.998
Net change in provision -603 -1.375
Provision 31 December 1.020 1.623
For a description of Ultrabulk’s payment terms as well as management of credit risk,
reference is made to note 24.
Ultrabulk applies the simplified approach to providing the expected credit losses
prescribed by IFRS 9, which permits the use of the lifetime expected loss provision
for trade receivables. To measure the expected credit losses trade receivables have
been grouped based on credit risks and the day past due. In accordance with IFRS 9,
non-due trade receivables have also been impaired.

35 | Ultrabulk A/S Annual Report 2019 | Notes to the consolidated financial statement
Note 19 – Cash and short-term deposits
2018
Figures in USD '000 2019 Restated
Cash at bank and in hand 91.932 74.395
Total 91.932 74.395
As of 31 December 2019, included in total cash at bank is USD 1.0 million (2018:
USD 0.8 million) which is restricted deposits in favour of clearing houses.
Note 20 – Share capital
The share capital has in May 2016 been increased from DKK 500,000 to DKK
2,000,000 and due to an intragroup merger in 2016 the share capital has been
increased from DKK 2,000,000 to DKK 27,100,000. The share capital had not been
subject to other changes in the last 5 years. The shares are denominated in 1 DKK per
shares. No shares confer any special rights. No restrictions have been imposed on
negotiability of the shares or on voting rights. All issued shares are fully paid.
Note 21 – Interest bearing loans and borrowings
2018
Figures in USD '000 2019 Restated
Fixed/ Book Book
Variable Interest rate value value
Mortgage on vessel Fixed 3,10% 18.593 32.757
Mortgage on vessel Variable 4,23% 13.593 14.062
Total 32.185 46.819
Long term part 28.486 41.563
Current part 3.699 5.256
Total 32.185 46.819
The principal of the fixed debt, excluding debt swapped from variable to fixed,
amount to USD 16.1 million. The fair value of the fixed loans is not materially different
from the carrying amount. The loans are subject to financial and operational
covenants. Management considers that Ultrabulk A/S and the guarantor Ultranav
International S.A. meet these covenants at 31 December 2019.
Loans are secured on vessels. The carrying amount of the vessels provided as security
is USD 62.8 million at 31 December 2019 (2018: 84.7 million).
Note 22 – Lease liabilities
Lease agreements for vessels have been entered into with a mutually interminable
lease period up to 10 years. As a general rule, leases include an option to renew for
one additional year at a time for up to three years. Some of the lease agreements
include a purchase option, exercisable as from the end of the fifth year to the expiry
of the period of renewal. Exercise of the purchase option on the individual vessel is
based on an individual assessment.
The Group has purchase options on 37 leases. However the majority of such
purchase options are partly shared.
The lease liabilities are specified as follows:
2018
Figures in USD'000 2019 Restated
Lease liabilities 1 January 407.234 398.207
Additions for the period 65.185 105.750
Remeasurements 16.592 11.875
Instalments made -107.637 -108.599
Lease liabilities 31 December 381.374 407.234
Long term part 258.805 299.663
Current part 122.569 107.571
Total 381.374 407.234
Of the total liabilities USD 31.0 million (2018: USD 22.9 million) is related to liabilities
under flexible lease hire contracts. The flexible hire is basis the Baltic Exchange index
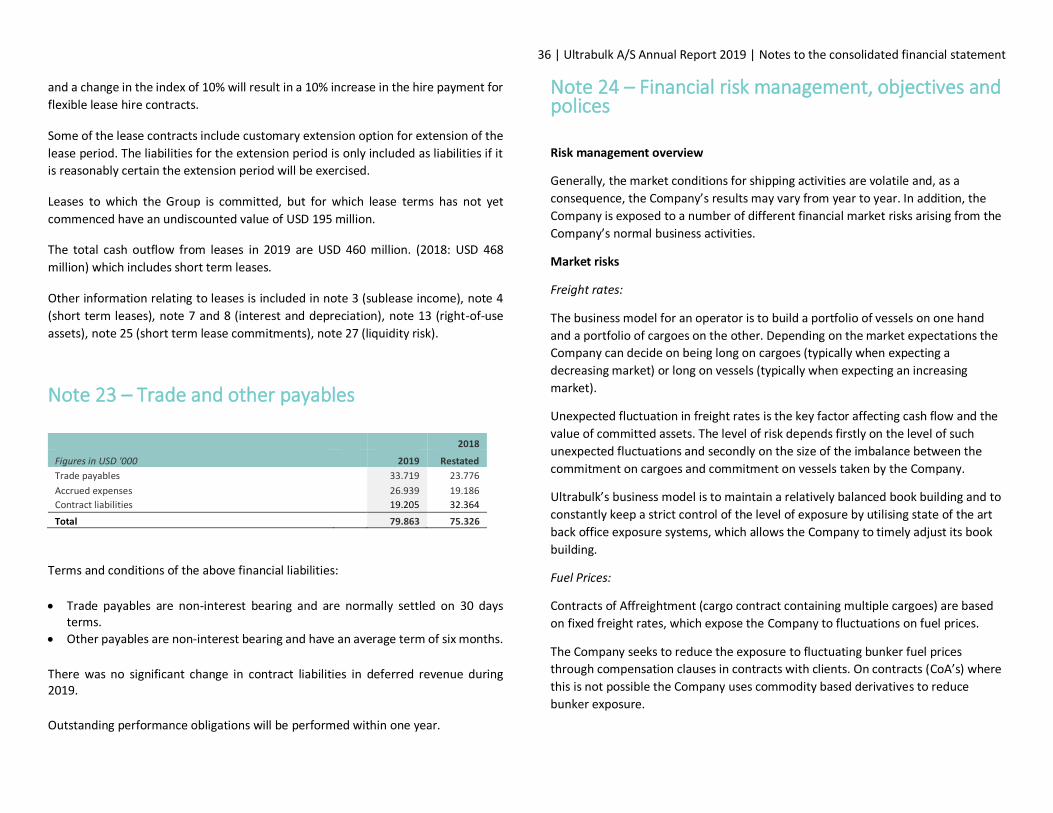
36 | Ultrabulk A/S Annual Report 2019 | Notes to the consolidated financial statement and a change in the index of 10% will result in a 10% increase in the hire payment for
flexible lease hire contracts.
Some of the lease contracts include customary extension option for extension of the
lease period. The liabilities for the extension period is only included as liabilities if it
is reasonably certain the extension period will be exercised.
Leases to which the Group is committed, but for which lease terms has not yet
commenced have an undiscounted value of USD 195 million.
The total cash outflow from leases in 2019 are USD 460 million. (2018: USD 468
million) which includes short term leases.
Other information relating to leases is included in note 3 (sublease income), note 4
(short term leases), note 7 and 8 (interest and depreciation), note 13 (right-of-use
assets), note 25 (short term lease commitments), note 27 (liquidity risk).
Note 23 – Trade and other payables
2018
Figures in USD '000 2019 Restated
Trade payables 33.719 23.776
Accrued expenses 26.939 19.186
Contract liabilities 19.205 32.364
Total 79.863 75.326
Terms and conditions of the above financial liabilities:
• Trade payables are non-interest bearing and are normally settled on 30 days terms.
• Other payables are non-interest bearing and have an average term of six months.
There was no significant change in contract liabilities in deferred revenue during 2019.
Outstanding performance obligations will be performed within one year.
Note 24 – Financial risk management, objectives and polices
Risk management overview
Generally, the market conditions for shipping activities are volatile and, as a
consequence, the Company’s results may vary from year to year. In addition, the
Company is exposed to a number of different financial market risks arising from the
Company’s normal business activities.
Market risks
Freight rates:
The business model for an operator is to build a portfolio of vessels on one hand
and a portfolio of cargoes on the other. Depending on the market expectations the
Company can decide on being long on cargoes (typically when expecting a
decreasing market) or long on vessels (typically when expecting an increasing
market).
Unexpected fluctuation in freight rates is the key factor affecting cash flow and the
value of committed assets. The level of risk depends firstly on the level of such
unexpected fluctuations and secondly on the size of the imbalance between the
commitment on cargoes and commitment on vessels taken by the Company.
Ultrabulk’s business model is to maintain a relatively balanced book building and to
constantly keep a strict control of the level of exposure by utilising state of the art
back office exposure systems, which allows the Company to timely adjust its book
building.
Fuel Prices:
Contracts of Affreightment (cargo contract containing multiple cargoes) are based
on fixed freight rates, which expose the Company to fluctuations on fuel prices.
The Company seeks to reduce the exposure to fluctuating bunker fuel prices
through compensation clauses in contracts with clients. On contracts (CoA’s) where
this is not possible the Company uses commodity based derivatives to reduce
bunker exposure.

37 | Ultrabulk A/S Annual Report 2019 | Notes to the consolidated financial statement Counterparty risk:
The Company’s main credit risks are related to its counterparty risk. The risk profile
is determined by the counterparty’s solvency and the type of legal contract upon
which the deal is based. Counterparty vetting has increased in importance as well as
in efforts in Ultrabulk.
Single cargoes:
It is industry standard that freight payment is made within very few days of
departing from the loading port. It is also an industry standard that the vessel
owner has a lien in the cargo, should the freight payment not have been paid prior
to the arrival at the discharge port. The counterparty risk on these types of deals is
therefore limited.
Contract of Affreightment (multiple cargoes):
It is important for Ultrabulk to carefully evaluate counterparty risk on CoA
contracts, as the Company is highly dependent on the counterparty’s solvency and
its ability and willingness to fulfil their obligations. Typically, the counterparties
would operate within the commodities industry.
Approval of CoA counterparties is done on senior management level only, and
involves the following elements:
• Positive credit rating report from a London based maritime credit rating
bureau.
• Positive industry references.
• Satisfactory performance on existing commitments, if any, between Ultrabulk
and the counterpart.
• Positive reference from the fuel purchase market.
Approval of counterparties may vary from one cargo to multiple year contracts.
Time charter out:
Ultrabulk does only on a limited basis use ‘time charter out’, however occasionally
Ultrabulk vessels are on shorter or longer time charter to other ship operators. The
approval process is very similar to that outlined above, with extra emphasis on
positive industry references.
Time charter in:
Although Ultrabulk is paying hire to the owners of the vessel, there is a risk that the
owners may default and the contract terminate early. The loss of such charter may
represent a significant risk, therefore Ultrabulk evaluates these types of contracts in
line with those of the CoAs and time charter out.
Derivative financial instruments are only entered with highly rated financial
institutions, which imply that the credit exposures for these transactions are
expected to be at an acceptable level.
Forward Freight Agreements (FFA):
Several contract types are being offered in the derivatives market, Ultrabulk A/S
however only utilizes swaps.
FFAs are utilised both as an instrument for hedge and speculation, for cargo as well
as vessel commitments. The Company utilises extensive risk management systems
in order to control the market value of all open positions. Based on the risk systems,
the Company is able to monitor the market position on a daily basis.
Interest rate risk exposure
Interest rate and currency risks are moderate financial risks for Ultrabulk A/S.
Management periodically reviews and assesses the primary financial market risks.
Ultrabulk will use financial derivatives to manage such risks. These may include
interest rate swaps, forwards contracts and options. A 1% change in interest rate
will affect the result with USD 0.1 million.
Currency risk
The Company’s reporting currency is USD. Most of the Company’s revenues and
expenses are denominated in USD. The Company has owned vessels. The
Company’s strategy is to finance the vessels in the same currency as the vessels
receive income. As a consequence, the vessels will be financed in USD. The
Company may use financial derivatives to reduce the net operational currency
exposure.
Currency risks on administrative expenses can be hedged for a period up to 12
months.

38 | Ultrabulk A/S Annual Report 2019 | Notes to the consolidated financial statement Liquidity exposure
It is the Company’s objective to maintain a balance between continuity of funding
and flexibility through the usage of available bank facilities, either in the form of
overdraft facilities, or through revolving credit facilities. The Company’s surplus
liquidity is placed in bank accounts with interest on deposits, or through term
deposits.
Capital management
The primary objective of the Company’s capital management is to ensure that it
maintains an adequate capital ratio in order to support its business and maximise
shareholder value. Ultrabulk A/S manages its capital structure and makes
adjustments to it, in light of changes in economic conditions. To maintain or adjust
the capital structure, the Company can make dividend payment to shareholders, or
issue new shares.
Other risks
Environment:
The majority of the vessels controlled by Ultrabulk A/S are chartered and therefore
the majority of risk in connection with environmental issues rests with the owner of
the vessel. There are however situations, whereby Ultrabulk A/S may become liable
for spills or other environmental impacts. Ultrabulk A/S has an insurance against
these types of accidents limited to USD 400 million for charter vessels and to USD
1,000 million for owned vessels for each single incident.
Piracy:
The risks encountered when transiting the Indian Ocean High Risk Area as well as
certain countries in West Africa are substantial. The Company is constantly
following the recommendations made by the UN subsidiary International Maritime
Organisation (IMO), and the recommendations made by the underwriters as well as
“Best Management Practices (BMP4)” – this includes having a contingency plan for
all vessels calling the area.
Note 25 – Short term lease liabilities and revenue commitments
From 1 January 2018 the Group has recognized right-of-use assets, except for short
term and low value leases.
2018
Figures in USD '000 2019 Restated
Short term lease and low value
Within one year 67.364 114.403
Total 67.364 114.403
At 31 December, the Group had entered into COAs and time charters with
customers amounting to:
2018
COAs and Time Charter commitments as service provider 2019 Restated
Within one year 121.706 134.614
Between 1 - 5 years 356.007 394.845
More than 5 years 46.324 68.410
Total 524.037 597.869
Note 26 – Contingent assets and liabilities Contingent assets Ultrabulk A/S has no significant contingent assets. Contingent liabilities Ultrabulk A/S is engaged in certain litigation proceedings. In the opinion of management, settlement or continuation of these proceedings are not expected to have a material effect on Ultrabulk A/S financial position, operating profit or cash flow.
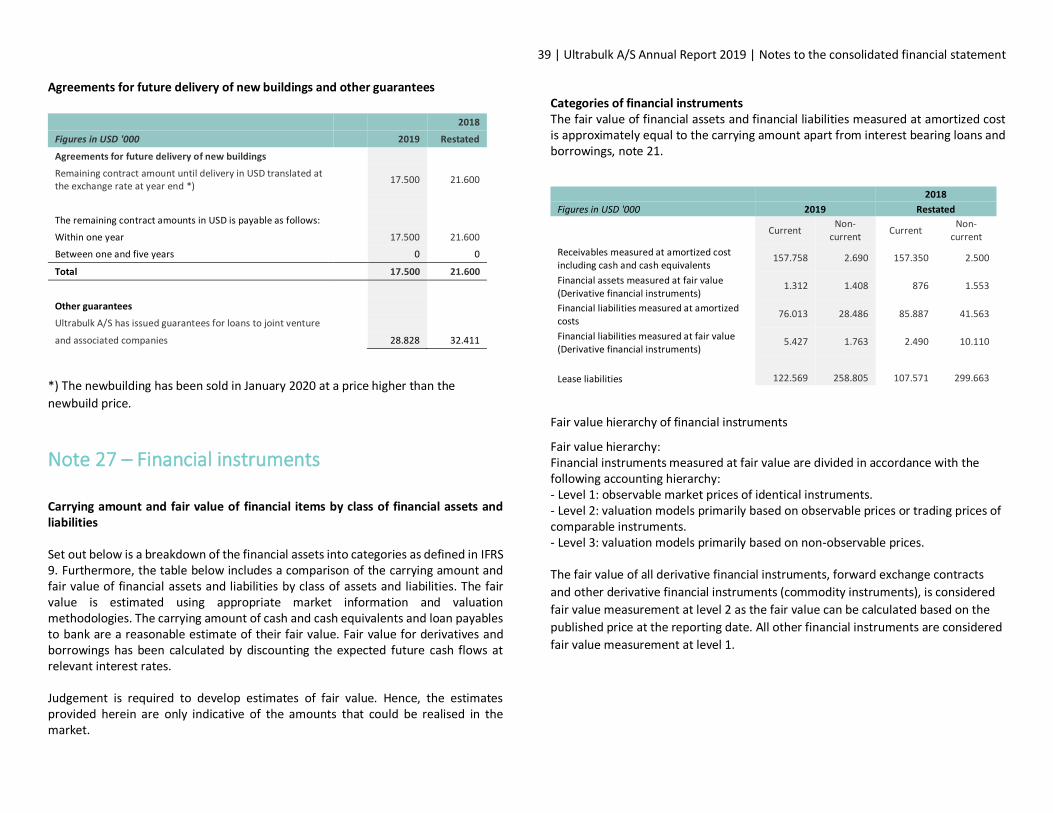
39 | Ultrabulk A/S Annual Report 2019 | Notes to the consolidated financial statement Agreements for future delivery of new buildings and other guarantees
2018
Figures in USD '000 2019 Restated
Agreements for future delivery of new buildings
Remaining contract amount until delivery in USD translated at the exchange rate at year end *)
17.500 21.600
The remaining contract amounts in USD is payable as follows:
Within one year 17.500 21.600
Between one and five years 0 0
Total 17.500 21.600
Other guarantees
Ultrabulk A/S has issued guarantees for loans to joint venture
and associated companies 28.828 32.411
*) The newbuilding has been sold in January 2020 at a price higher than the
newbuild price.
Note 27 – Financial instruments
Carrying amount and fair value of financial items by class of financial assets and liabilities Set out below is a breakdown of the financial assets into categories as defined in IFRS 9. Furthermore, the table below includes a comparison of the carrying amount and fair value of financial assets and liabilities by class of assets and liabilities. The fair value is estimated using appropriate market information and valuation methodologies. The carrying amount of cash and cash equivalents and loan payables to bank are a reasonable estimate of their fair value. Fair value for derivatives and borrowings has been calculated by discounting the expected future cash flows at relevant interest rates. Judgement is required to develop estimates of fair value. Hence, the estimates provided herein are only indicative of the amounts that could be realised in the market.
Categories of financial instruments The fair value of financial assets and financial liabilities measured at amortized cost is approximately equal to the carrying amount apart from interest bearing loans and borrowings, note 21.
2018
Figures in USD '000 2019 Restated
Current
Non-current
Current Non-
current
Receivables measured at amortized cost including cash and cash equivalents
157.758 2.690 157.350 2.500
Financial assets measured at fair value (Derivative financial instruments)
1.312 1.408 876 1.553
Financial liabilities measured at amortized costs
76.013 28.486 85.887 41.563
Financial liabilities measured at fair value (Derivative financial instruments)
5.427 1.763 2.490 10.110
Lease liabilities 122.569 258.805 107.571 299.663
Fair value hierarchy of financial instruments
Fair value hierarchy: Financial instruments measured at fair value are divided in accordance with the following accounting hierarchy: - Level 1: observable market prices of identical instruments. - Level 2: valuation models primarily based on observable prices or trading prices of comparable instruments. - Level 3: valuation models primarily based on non-observable prices. The fair value of all derivative financial instruments, forward exchange contracts
and other derivative financial instruments (commodity instruments), is considered
fair value measurement at level 2 as the fair value can be calculated based on the
published price at the reporting date. All other financial instruments are considered
fair value measurement at level 1.
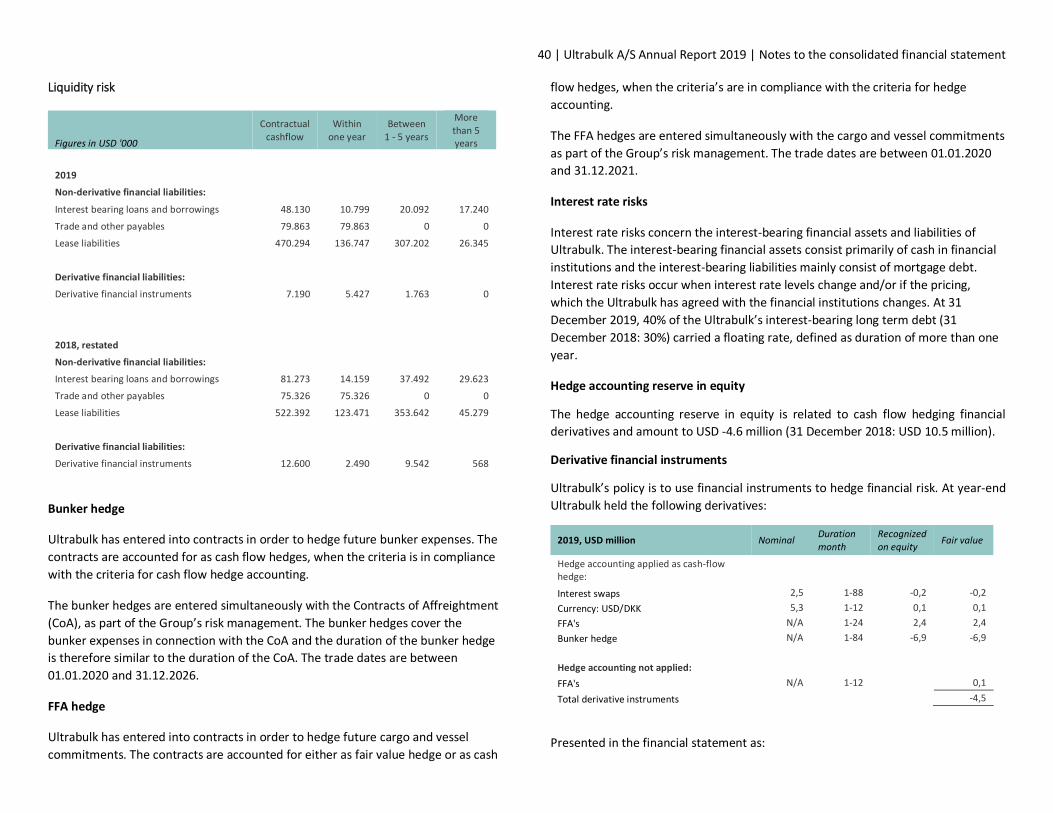
40 | Ultrabulk A/S Annual Report 2019 | Notes to the consolidated financial statement Liquidity risk
Figures in USD '000
Contractual cashflow
Within one year
Between 1 - 5 years
More than 5 years
2019
Non-derivative financial liabilities:
Interest bearing loans and borrowings 48.130 10.799 20.092 17.240
Trade and other payables 79.863 79.863 0 0
Lease liabilities 470.294 136.747 307.202 26.345
Derivative financial liabilities:
Derivative financial instruments 7.190 5.427 1.763 0
2018, restated
Non-derivative financial liabilities:
Interest bearing loans and borrowings 81.273 14.159 37.492 29.623
Trade and other payables 75.326 75.326 0 0
Lease liabilities 522.392 123.471 353.642 45.279
Derivative financial liabilities:
Derivative financial instruments 12.600 2.490 9.542 568
Bunker hedge
Ultrabulk has entered into contracts in order to hedge future bunker expenses. The
contracts are accounted for as cash flow hedges, when the criteria is in compliance
with the criteria for cash flow hedge accounting.
The bunker hedges are entered simultaneously with the Contracts of Affreightment
(CoA), as part of the Group’s risk management. The bunker hedges cover the
bunker expenses in connection with the CoA and the duration of the bunker hedge
is therefore similar to the duration of the CoA. The trade dates are between
01.01.2020 and 31.12.2026.
FFA hedge
Ultrabulk has entered into contracts in order to hedge future cargo and vessel
commitments. The contracts are accounted for either as fair value hedge or as cash
flow hedges, when the criteria’s are in compliance with the criteria for hedge
accounting.
The FFA hedges are entered simultaneously with the cargo and vessel commitments
as part of the Group’s risk management. The trade dates are between 01.01.2020
and 31.12.2021.
Interest rate risks
Interest rate risks concern the interest-bearing financial assets and liabilities of
Ultrabulk. The interest-bearing financial assets consist primarily of cash in financial
institutions and the interest-bearing liabilities mainly consist of mortgage debt.
Interest rate risks occur when interest rate levels change and/or if the pricing,
which the Ultrabulk has agreed with the financial institutions changes. At 31
December 2019, 40% of the Ultrabulk’s interest-bearing long term debt (31
December 2018: 30%) carried a floating rate, defined as duration of more than one
year.
Hedge accounting reserve in equity
The hedge accounting reserve in equity is related to cash flow hedging financial
derivatives and amount to USD -4.6 million (31 December 2018: USD 10.5 million).
Derivative financial instruments
Ultrabulk’s policy is to use financial instruments to hedge financial risk. At year-end
Ultrabulk held the following derivatives:
2019, USD million Nominal Duration month
Recognized on equity
Fair value
Hedge accounting applied as cash-flow hedge:
Interest swaps 2,5 1-88 -0,2 -0,2
Currency: USD/DKK 5,3 1-12 0,1 0,1
FFA's N/A 1-24 2,4 2,4
Bunker hedge N/A 1-84 -6,9 -6,9
Hedge accounting not applied:
FFA's N/A 1-12 0,1
Total derivative instruments -4,5
Presented in the financial statement as:

41 | Ultrabulk A/S Annual Report 2019 | Notes to the consolidated financial statement
2019, USD million Nominal Duration month
Recognized on equity
Fair value
Derivative financial instruments, non current assets
1,4
Derivative financial instruments, current assets
1,3
Derivative financial instruments, non current liabilities
-5,4
Derivative financial instruments, current liabilities
-1,8
2018, USD million Nominal Duration month
Recognized on equity
Fair value
Hedge accounting applied as cash-flow hedge:
Interest swaps 8,6 1-100 0,1 0,1
Currency: USD/DKK 5,6 1-12 0,0 0,0
FFA's N/A 1-36 1,9 1,9
Bunker hedge N/A 1-96 -12,6 -12,6
Hedge accounting not applied:
FFA's N/A 1-12 0,3
Total derivative instruments -10,3
Presented in the financial statement as:
Derivative financial instruments, non current assets
1,5
Derivative financial instruments, current assets
0,8
Derivative financial instruments, non current liabilities
-10,1
Derivative financial instruments, current liabilities
-2,5
Changes in liabilities arising from finance activities
Figures in USD '000 1 Jan. 19 Cash flow Other 31 Dec. 19
Current interest-bearing loans and borrowings
5.256 -1.557 0 3.699
Lease liabilities 407.234 -107.637 81.777 381.374
Non-current interest-bearing loans and borrowings
41.563 -13.819 742 28.486
Total liabilities from financing activities 454.053 -123.013 82.519 413.559
Figures in USD '000 1 Jan. 18 Cash flow Other 31 Dec. 18
Current interest-bearing loans and borrowings
4.082 1.174 0 5.256
Lease liabilities 398.207 -108.599 117.625 407.234
Non-current interest-bearing loans and borrowings
33.140 8.211 212 41.563
Total liabilities from financing activities 435.429 -99.214 117.837 454.053
Other is related to additions and remeasurements of lease liabilities, see note 22.
Note 28 – Changes in net working capital
2018
Figures in USD '000 2019 Restated
Change in inventories -3.912 -3.185
Change in trade and other receivables 14.030 -8.898
Change in receivables from related companies -9.721 2.470
Change in prepayments 2.695 3.795
Change in trade and other payables 4.536 2.358
Change in intercompany -3.692 1.400
Total 3.936 -2.060

42 | Ultrabulk A/S Annual Report 2019 | Notes to the consolidated financial statement
Note 29 – Mortgages and security
The Group has issued a pro rata guarantee for the mortgages in the joint venture
Ultra Summit (Singapore) Pte. Ltd.
Vessels with a carrying amount of USD 62.8 million (USD 84.7 million) are provided
as security for loans.
Note 30 – Related party disclosures
Ultrabulk A/S is controlled by Ultranav Denmark ApS, Denmark. The ultimate parent of the Group is Naviera Ultranav Limitada, El Bosque Norte 500 19-20th floor, 7550092 Las Condes, Santiago, Chile. Other related parties are considered to be companies within Ultranav Group, associated companies, the directors and officers of the entities and management of Ultrabulk A/S.
Figures in USD '000 Sale/ (Purchases)
Sale/ (Purchases) Amounts Amounts
to/from to/from owed
by/(to) owed
by/(to)
Related party / Type of transaction related parties
related parties
related parties
related parties
2019 2018 2019 2018
Parent company: Restated Restated
Management fee expense -2.092 -2.190 0 0
Loan 12 0 9.400 2.500
Joint Venture:
Charter hire -16.413 -14.666 0 0
Guarantees 0 0 28.828 32.411
Loan 2.662
Service 0 30 -4
Associated companies:
Charter hire 10.803 18.224 -1.073 -3.104
Service 0 -133 -337 -561
Management fee expense -2.627 -2.742 0 0
There have not been any transactions with any member of the Board of Directors,
Executive Management of Ultrabulk A/S, Naviera Ultranav Limitada or associated
companies. For information on remuneration to the Board of Directors and
Executive Management of Ultrabulk A/S, please refer to note 6. Outstanding
balances at year-end apart from loans are short-term, unsecured, interest free and
settlement occurs in cash. There have been no guarantees (refer to note 23 and 26)
provided or received for any related party receivables or payables. The Group has
not made any provision for doubtful debts relating to amounts owed by related
parties. The assessment hereof is undertaken each financial year through examining
the financial position of the related party and the market in which the related party
operates.
Joint taxation
The Danish companies in the Group are in joint taxation with the other Danish
companies in the Naviera Ultranav Group.
Note 31 – Transition to IFRS 16
This note explains the impact of the adoption of IFRS 16 Leases on the Group’s financial statements and discloses the new accounting policies that have been applied from 1 January 2019. Ultrabulk has adopted IFRS 16 full retrospectively and has restated comparative figures by determining the lease liability and measure the right-of-use assets. The adjustments arising from the new leasing rules are therefore recognized in the opening balance sheet on 1 January 2018. The majority of Ultrabulk’s lease contracts are time charter contracts on vessels. For these contracts, the estimated non-lease component (daily running costs) will be excluded from the lease liability. Lease liabilities have been measured at the present value of the remaining lease payments, discounted using the incremental borrowing rate. The incremental borrowing rate has been applied retrospectively. At 1 January 2019, the incremental borrowing rate is in the range of 4.8-5.3%, depending on the maturity of the lease contracts and the time the leasing contract is started. Ultrabulk has elected to use the exemptions not to recognize contracts with a lease term of 12 months or less and lease contracts for which the underlying asset is of low

43 | Ultrabulk A/S Annual Report 2019 | Notes to the consolidated financial statement value. Ultrabulk has leases of certain office equipment (e.g. personal computers, printing and photocopying machines), company cars that are considered of low value. Ultrabulk has applied the following practical expedients on adoption of IFRS 16 Leases permitted by the standard: • Leased contracts with a term of 12 months or less will not be recognized as lease assets • The use of hindsight in determining the lease term where the contract contains options to extend or terminate the lease • Not to reassess whether a contract is, or contains, a lease at 1 January 2019. The lease liabilities can be reconciled to the operating lease commitments disclosed in
the annual report 2018 note 22 as follows:
The effect of adopting IFRS 16 is, as follows:
Impact on the consolidated statement of financial positions:
Impact on the consolidated income statement:
The impact on the cash flow statement is an increase in operating cash flow of USD 123
million (2018: 125 million), and a reduction in financing cash flow of USD 123 million
(2018: 125 million).
Note 32 – Subsequent events
No other significant events than the sale of the vessel delivered in January 2020
have occurred between the reporting period and the publication of the annual
report.
Note 33 – New financial reporting regulation
Following new accounting standard and amendments have been issued but are not
yet effective.
• Amendments to IFRS 3: Definition of a Business
• Amendments to IAS 1 and IAS 8: Definition of Material
The standards are note expected to have impact on the consolidated financial
statement.
Figures in USD '000 2018 2017
Total operating lease commitments 894.652 1.039.154
Leased assets with a term of 12 months or less -114.403 -190.524
Lease obligation regarding assets not delivered -40.288 -75.286
Daily running cost of vessel leases (non-lease component) -286.448 -319.478
Interest element -46.278 -55.658
Lease liability as of 1 January 407.234 398.208
31 December 31 December 1 January
Figures in USD '000 2019 2018 2018
Assets
Right-of-use assets 328.307 345.361 329.589
Receivables from subleases 37.167 45.587 53.450
Total assets 365.474 390.948 383.039
Equity
Retained earnings -15.900 -16.286 -15.169
Liabilities
Lease liabilities 381.374 407.234 398.208
Figures in USD '000 2019 2018
Revenue -13.271 -12.476
Time-charter hire and opex element 127.768 130.231
Gross profit (Net earnings from shipping activities) 114.496 117.755
Other external expenses 552 417
Depreciation -98.764 -101.816
Operating profit (EBIT) 16.284 16.356
Other financial items, net -15.966 -17.243
Net profit 318 -887
44 | Ultrabulk A/S Annual Report 2019 | Ultrabulk A/S - Parent Company
ULTRABULK A/S - PARENT COMPANY

45 | Ultrabulk A/S Annual Report 2019 | Ultrabulk A/S - Parent Company
Income Statement
Figures in USD '000 Note 2019 2018
Revenue 2 630.320 674.638
Voyage related expenses -218.409 -235.646
Time-charter hire -392.163 -414.294
Gross profit (Net earnings from shipping activities) 19.748 24.698
Other external expenses 3 -12.726 -13.740
Staff costs 4 -7.470 -6.698
Operating profit before depreciation and impairment loss (EBITDA)
-448 4.260
Profit from sale of vessel 2.972 3.110
Depreciation 6 -500 -216
Operating profit (EBIT) 2.024 7.154
Share of subsidiaries' profit after tax 7 12.854 9.331
Share of associates' profit after tax 8 -1.589 -275
Other financial items, net 1.050 729
Profit before tax 14.339 16.939
Tax 5 -1.498 -1.414
Net profit 12.841 15.525
Proposal for the distribution of net profit:
Reserve for net revaluation according to equity method 11.265 9.056
Retained earnings -8.424 1.469
Proposed dividend 10.000 5.000
12.841 15.525
Balance sheet
Figures in USD '000
ASSETS Note 2019 2018
Fixtures, fittings and equipment 6 673 692
Total tangible assets 673 692
Investment in subsidiaries 7 86.809 73.473
Investment in associates 8 750 1.476
Derivative financial instruments 15 1.408 1.394
Loans receivable from related parties 0 2.500
Deferred tax assets 0 135
Financial assets, non-current 88.967 78.978
Total non-current assets 89.640 79.670
Inventories 17.791 14.773
Trade and other receivables 9 35.241 40.776
Intercompany receivables 17.686 14.891
Prepayments 16.375 12.869
Derivative financial instruments 15 1.312 493
Cash and short-term deposits 59.421 52.168
Current assets 147.826 135.970
TOTAL ASSETS 237.466 215.640
Figures in USD '000
EQUITY AND LIABILITIES Note 2019 2018
Share capital 5.134 5.134
Reserve for net revaluation according to the equity method 24.260 13.510
Hedging reserve -4.405 -11.064
Retained earnings 139.166 147.293
Proposed dividend 10.000 5.000
Total equity 10 174.155 159.873
Derivative financial instruments 15 1.763 10.110
Total non-current liabilities 1.763 10.110
Trade and other payables 11 48.798 40.005
Intercompany payables 5.456 2.025
Derivative financial instruments 15 5.237 2.490
Income tax payable 2.057 1.137
Total current liabilities 61.548 45.657
Total liabilities 63.311 55.767
TOTAL EQUITY AND LIABILITIES 237.466 215.640

46 | Ultrabulk A/S Annual Report 2019 | Ultrabulk A/S - Parent Company
Statement of change in Equity Share Reserve
capital Retained Hedging net revaluation Proposed Total
Figures in USD '000 (Note
20) earnings reserves equity method dividend equity
At 1 January 2019 5.134 147.293 -11.064 13.510 5.000 159.873
Distribution of net profit 0 -8.424 0 11.265 10.000 12.841
Dividend paid out -5.000 -5.000
Hedge reserve 0 0 6.659 -733 0 5.926
Other changes 0 297 0 218 0 515
Changes during the year 0 -8.127 6.659 10.750 5.000 14.282
At 31 December 2019 5.134 139.166 -4.405 24.260 10.000 174.155
Share Reserve
capital Retained Hedging net revaluation Propoded Total
Figures in USD '000 (Note
20) earnings reserves equity method dividend equity
At 1 January 2018 5.134 145.664 -9.485 7.592 0 148.905
Distribution of net profit 0 1.469 0 9.056 5.000 15.525
Hedge reserve 0 0 -1.579 -2.571 0 -4.150
Other changes 0 160 0 -567 0 -407
Changes during the year 0 1.629 -1.579 5.918 5.000 10.968
At 31 December 2018 5.134 147.293 -11.064 13.510 5.000 159.873
Note 1 – Accounting policies The Parent Company financial statements for Ultrabulk A/S has been prepared
pursuant to the provisions for large class C enterprises of the Danish Financial
Statements Act.
The accounting policies of the Parent Company financial statements are unchanged
compared to last year.
The Company’s business is primarily based on the US Dollar. All income in the form
of freight income is in US Dollar, and most costs are in US Dollars as well. Based on
this, the Company has designated the US Dollar as its functional and reporting
currency. Consequently, all amounts are recognized in US Dollar. For 2019 the
average USD/DKK rate of exchange was 6.66758 and the closing rate on 31
December 2019 was 6.6759.
Income statement and balance sheet
Earnings from investments in subsidiaries and associates
In the Parent Company’s income statement, the proportional share of earnings is
recognised under the items “Share of subsidiaries’ profit after tax” and “Share of
associates’ profit after tax”.
Investments in subsidiaries and associates
Investments in subsidiaries and associates are recognised and measured according
to the equity method. In the balance sheet under the items “Investments in
subsidiaries” and “Investments in associates”, the proportional ownership share of
the companies’ net asset value is recognised.
The total net revaluation of investments in subsidiaries and associates is transferred
through the distribution of profits to “Reserve for net revaluation according to
equity method” under equity. The reserve is reduced by dividend payments to the
Parent Company and is adjusted with other changes in equity in subsidiaries and
associates.
Subsidiaries and associates with negative net asset value are recognised at USD 0
million, and a provision to cover the negative balance is recognised if such a present
obligation for this purpose exists.

47 | Ultrabulk A/S Annual Report 2019 | Ultrabulk A/S - Parent Company Leases
All leases are classified as operational lease. The payments (time-charter hire) are
recognised as an expense and charged to profit or loss on a straight line basis over
the term for the lease.
Other accounting policies
With reference to the provisions of the Danish Financial Statements Act, the
Company has refrained from preparing a cash flow statement in the Parent
Company financial statements. For this information, see the consolidated financial
statements for Ultrabulk A/S.
The Company’s accounting policies are otherwise consistent with the consolidated
financial statements except for IFRS 16.
Note 2 – Revenue
Figures in USD '000 2019 2018
Panamax 191.109 205.479
Supramax 367.071 383.991
Handysize 2.413 0
MPP, Parcel Services and African Services 69.727 85.168
Total 630.320 674.638
Figures in USD '000 2019 2018
Income from freight 446.868 506.289
Income from time charter 183.452 168.350
Total 630.320 674.638
Note 3 – Remuneration to the auditor appointed at the general meeting
Figures in USD '000 2019 2018
Audit 108 105
Other assurance service 0 0
Tax consultancy 13 13
Other services 0 0
Total 121 118
Note 4 – Staff costs
Figures in USD '000 2019 2018
Fixed salaries 6.036 5.716
Pensions - defined contribution plan 421 392
Other expenses for social security etc. 70 68
Incentive payment (cash based) 943 522
Staff costs included in administration expenses 7.470 6.698
Average number of employees 55 46
Please refer to the consolidated financial statements, note 5, for management
remuneration.
Note 5 – Tax
Figures in USD '000 2019 2018
Current tax on profit for the year -1.504 1.137
Deferred tax on profit for the year -132 300
Tax on profit for the year -1.636 1.437
Adjustments related to previous years - current tax 140 -48
Adjustments related to previous years - deferred tax -2 25
Tax in the income statement -1.498 1.414

48 | Ultrabulk A/S Annual Report 2019 | Ultrabulk A/S - Parent Company
Note 6 – Fixtures, fittings and equipment
Figures in USD '000 2019 2018
Cost:
Cost at 1 January 4.650 3.777
Additions for the year 480 873
Cost at 31 December 5.130 4.650
Depreciation and impairment at 1 January -3.957 -3.742
Depreciation for the year -500 -215
Depreciation and impairment at 31 December -4.457 -3.957
Carrying amount at 31 December 673 692
Expected useful life: 3-10 years 3-10 years
Note 7 – Investments in subsidiaries
Figures in USD '000 2019 2018
Cost:
Cost at 1 January 17.751 18.066
Disposal for the year -793 -315
Cost at 31 December 16.958 17.751
Value adjustment at 1 January 54.797
48.647
Dividends received 0 -925
Share of the result for the year 12.854 9.331
Change on equity (hedge reserve etc.) 887 -2.256
Value adjustment at 31 December 68.538 54.797
Carrying amount at 31 December 85.496 72.548
The carrying amount can be specified as follows:
Investment in subsidiaries 86.809 74.742
Negative equity in subsidiaries, deducted intercompany receivables -1.313 -2.194
85.496 72.548
Ownership Ownership
Ultrabulk Shipholding Singapore Pte. Ltd 100% 100%
Ultrabulk (Singapore) Pte. Ltd 100% 100%
Ultrabulk (USA) Ltd. 100% 100%
Ultrabulk (Hong Kong) Ltd 100% 100%
Ultrabulk do Brazil Ltda 100% 100%
Cedrella Transport Ltd. 100% 100%
Ultrabulk South Africa (Pty) Ltd. 100% 100%
Ultrabulk Cargo Services GmbH 100% 100%

49 | Ultrabulk A/S Annual Report 2019 | Ultrabulk A/S - Parent Company
Note 8 – Investments in associates
Figures in USD '000 2019 2018
Cost:
Cost at 1 January 1.408 1.408
Cost at 31 December 1.408 1.408
Value adjustment at 1 January 67
910
Exchange rate adjustment 218 -567
Impairment -262 -516
Share of the result for the year -682 241
Value adjustment at 31 December -659 67
Carrying amount at 31 December 750 1.476
The carrying amount can be specified as follows:
Pérola S.A., Brasil, interest 20% 750 1.476
750 1.476
Key figures for investment in associates:
Assets 7.278 12.145
Liabilities -2.219 -4.763
Net assets 5.058 7.382
Revenue 14.437 22.569
Profit/loss before tax -5.089 1.856
Income tax 1.679 -651
Profit/loss for the year -3.410 1.205
Total comprehensive income for the year -3.410 1.205
Note 9 – Trade and other receivables
Figures in USD '000 2019 2018
Customers (trade receivables) 19.251 14.876
Other receivables 15.990 25.900
35.241 40.776
Note 10 – Equity and allocation of result
The share capital is commented upon in note 20 to the consolidated financial
statements.
The targets for the capital structure of Ultrabulk A/S is determined and assessed for
the Group as a whole, for which reason no operational goals or policies are set for
the Parent Company.
Figures in USD '000 2019 2018
Transfer to retained earnings -8.424 1.470
Reserve for net revaluation according to equity method 11.265 9.056
Proposed dividend 10.000 5.000
12.841 15.526
Note 11 – Trade and other payables
Figures in USD '000 2019 2018
Trade payables 19.744 10.923
Accrued expenses and deferred income 29.053 29.082
48.797 40.005
Note 12 – Mortgages and security
Figures in USD '000 2019 2018
Other guarantees
Ultrabulk A/S has issued guarantees for loans to joint venture and associated company
28.228 32.411
Ultrabulk A/S has issued guarantees for time charter hires to subsidiaries 390.548 423.083
Ultrabulk A/S has issued guarantees for remaining payments under new building contracts 17.500 21.600
Total 436.276 477.094
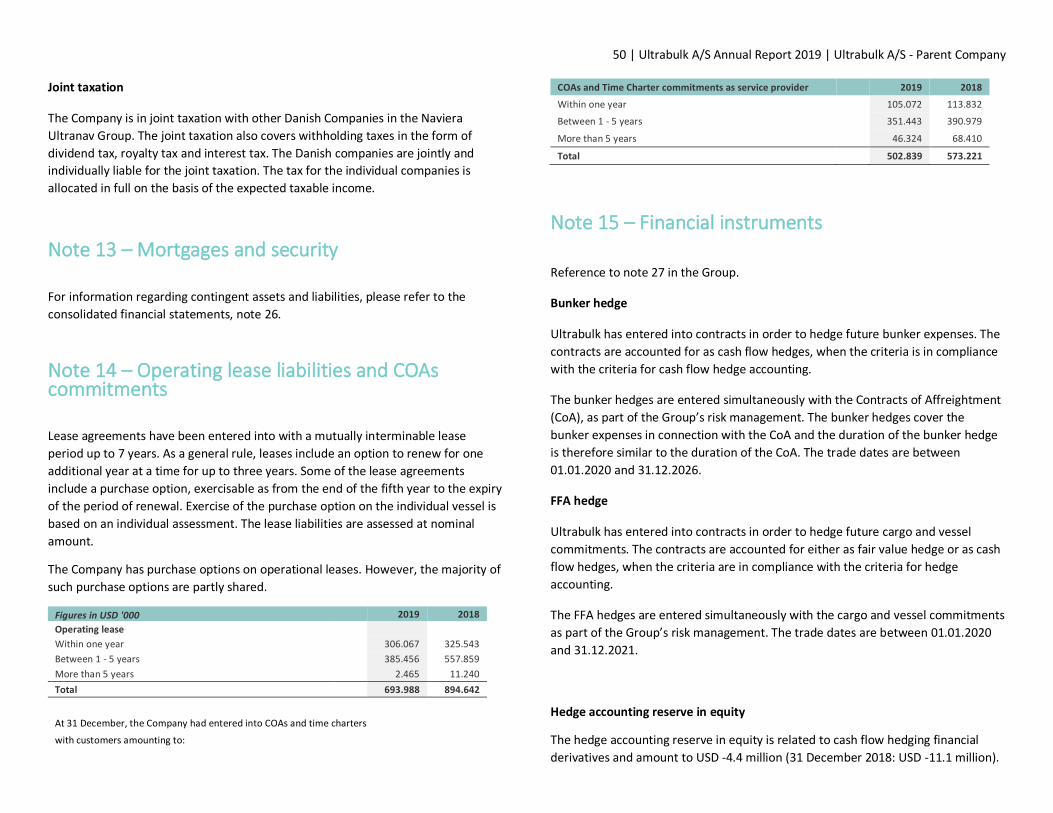
50 | Ultrabulk A/S Annual Report 2019 | Ultrabulk A/S - Parent Company Joint taxation
The Company is in joint taxation with other Danish Companies in the Naviera
Ultranav Group. The joint taxation also covers withholding taxes in the form of
dividend tax, royalty tax and interest tax. The Danish companies are jointly and
individually liable for the joint taxation. The tax for the individual companies is
allocated in full on the basis of the expected taxable income.
Note 13 – Mortgages and security
For information regarding contingent assets and liabilities, please refer to the
consolidated financial statements, note 26.
Note 14 – Operating lease liabilities and COAs commitments
Lease agreements have been entered into with a mutually interminable lease
period up to 7 years. As a general rule, leases include an option to renew for one
additional year at a time for up to three years. Some of the lease agreements
include a purchase option, exercisable as from the end of the fifth year to the expiry
of the period of renewal. Exercise of the purchase option on the individual vessel is
based on an individual assessment. The lease liabilities are assessed at nominal
amount.
The Company has purchase options on operational leases. However, the majority of
such purchase options are partly shared.
Figures in USD '000 2019 2018
Operating lease
Within one year 306.067 325.543
Between 1 - 5 years 385.456 557.859
More than 5 years 2.465 11.240
Total 693.988 894.642
At 31 December, the Company had entered into COAs and time charters
with customers amounting to:
COAs and Time Charter commitments as service provider 2019 2018
Within one year 105.072 113.832
Between 1 - 5 years 351.443 390.979
More than 5 years 46.324 68.410
Total 502.839 573.221
Note 15 – Financial instruments
Reference to note 27 in the Group.
Bunker hedge
Ultrabulk has entered into contracts in order to hedge future bunker expenses. The
contracts are accounted for as cash flow hedges, when the criteria is in compliance
with the criteria for cash flow hedge accounting.
The bunker hedges are entered simultaneously with the Contracts of Affreightment
(CoA), as part of the Group’s risk management. The bunker hedges cover the
bunker expenses in connection with the CoA and the duration of the bunker hedge
is therefore similar to the duration of the CoA. The trade dates are between
01.01.2020 and 31.12.2026.
FFA hedge
Ultrabulk has entered into contracts in order to hedge future cargo and vessel
commitments. The contracts are accounted for either as fair value hedge or as cash
flow hedges, when the criteria are in compliance with the criteria for hedge
accounting.
The FFA hedges are entered simultaneously with the cargo and vessel commitments
as part of the Group’s risk management. The trade dates are between 01.01.2020
and 31.12.2021.
Hedge accounting reserve in equity
The hedge accounting reserve in equity is related to cash flow hedging financial
derivatives and amount to USD -4.4 million (31 December 2018: USD -11.1 million).

51 | Ultrabulk A/S Annual Report 2019 | Ultrabulk A/S - Parent Company
Note 16 – Related party transaction
Ultrabulk A/S is included in the consolidated financial statement for Ultranav
Denmark ApS, Denmark and Naviera Ultranav Limitada, Chile.
Figures in USD '000
Sale/
(Purchases) Sale/
(Purchases)
Amounts owed by/(to)
Amounts owed by/(to)
Related party
Type of transaction
2019 2018 2019 2018
Parent Loan 12 0 9.400 2.500
Joint
Ventures Charter hire -12.398 -10.133 270 -18
Guarantees 0 0 28.228 32.411
Subsidiaries Charter hire -176.802 -174.741 0
Service 0 0 5.528 14.312
Management fee -6.788 -6.620 0
Affiliated Charter hire -4.616 -14.249 121 -51
companies Service 388 506 -1.690 -1.426
Management fee -2.626 -2.791 -87 50
Note 17 – Subsequent events
For subsequent events, please refer to the consolidated financial statements, note
32.
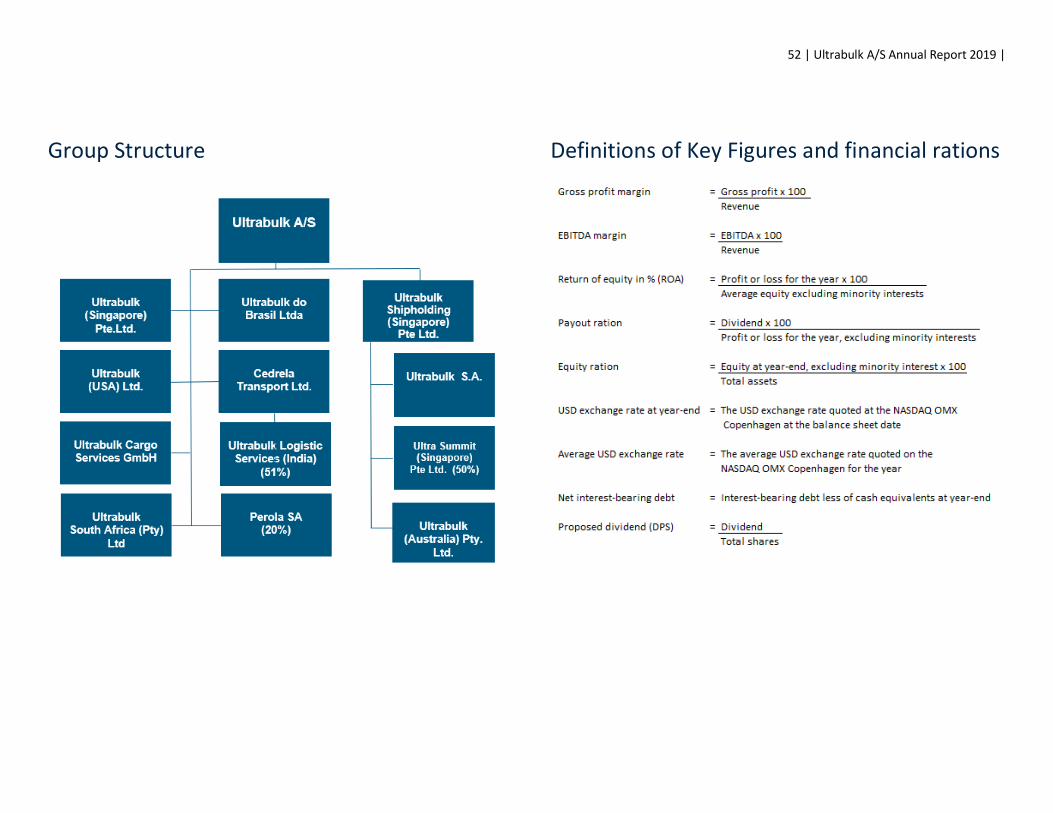
52 | Ultrabulk A/S Annual Report 2019 |
Group Structure
Definitions of Key Figures and financial rations
53 | Ultrabulk A/S Annual Report 2019 | Contact
Ultrabulk A/S Smakkedalen 6 2820 Gentofte Denmark Phone +45 3997 0400 Ultrabulk South Africa (Pty) Ltd., ICR House, Alphen Office Park, Constantia Main Road,7806 Constantia, South Africa Phone +27 21 300 6980 Ultrabulk Cargo Services GmbH Prinzenallee 7 40549 Düsseldorf Ultrabulk (USA) Inc. 1055 Washington Boulevard Suite 420 Stamford Connecticut 06901 U.S.A Phone +1 203 964 2121
Ultrabulk do Brasil Ltda. Atlantica Business Center Av. Atlantica 1130, 12th Floor Rio de Janeiro 22021-000 Brazil Phone +55 21 3500 0345 Ultrabulk (Singapore) Pte Ltd. 12 Marina View #21-07 Asia Square Tower 2 Singapore 018961 Phone +65 3163 4065 Ultrabulk SA c/o Naviera Ultranav Limitada Avda. El Bosque Norte 500 - 20th Floor Las Condes - Santiago 7550092 Chile Phone +56 2 630 1180 Ultrabulk (Australia) Pty. Ltd. Level 5. 203-233 New South Head Road Sydney 2027
Ultrabulk back-office services are provided by; Ultranav Business Support ApS Smakkedalen 6 2820 Gentofte, Denmark Phone +45 3997 0400