ultra-miniature force plate for measuring triaxial forces ... · autumn et al., 2006 brass...
TRANSCRIPT

The
Jour
nal o
f Exp
erim
enta
l Bio
logy
704
© 2014. Published by The Company of Biologists Ltd | The Journal of Experimental Biology (2014) 217, 704-710 doi:10.1242/jeb.094177
ABSTRACTMeasuring the ground reaction forces of a single leg is indispensableto understanding the dynamics of legged locomotion. Because of thetechnical state of the art, investigations are limited to animals with abody mass above 1 g. Here we present the design, fabrication,calibration and performance of a novel ultra-miniature force platformat the micronewton level. The sensor was built using thestereolithography technology and is equipped with semiconductorstrain gauges. We found a highly linear signal response in thecalibrated force range to ±1300 μN. Individual tests revealed that ourforce plate still shows a linear response at forces as great as 4 mN,confirming a large measuring range and particular robustness. Thesensitivity was above 50 V N−1 in all directions, which makes itpossible to resolve forces of 10 μN. We demonstrated the suitabilityof the device on the basis of a typical ground reaction forcemeasurement of an ant, Formica polyctena.
KEY WORDS: 3D reaction force, Miniature force plate, Triaxial forcemeasurement, Insect biomechanics, Small animal
INTRODUCTIONGround reaction forces represent the ‘footprint’ of the dynamics oflegged locomotion. Depending on the force range and the object ofinvestigation, a number of measurement techniques are available(Table 1). Each of these is based on deformations of measuringinstruments when a force is applied. Accordingly, in most cases,cantilevers equipped with strain gauges or piezo elements are used assensing units. In the range from 1 mN up to 30 kN, three-dimensional(3D) force plates are commercially available from differentmanufacturers. However, for a variety of reasons, many force sensorsused in biomechanical studies on small animals are custom-made.Over the last few decades, several researchers have developed two-dimensional miniature force plates for species weighing only a fewgrams (Heglund, 1981; Full and Tu, 1990; Drechsler and Federle,2006; Wood et al., 2009; Lin and Trimmer, 2012). Versions of theHeglund (Heglund, 1981) force plate design were most often used todesign measuring instruments for animals of different size.Furthermore, it was possible to build 3D force plates via theadvancement of this design (Full et al., 1991; Katz and Gosline, 1993;Autumn et al., 2006; Dai et al., 2011). Another approach consistingof bronze springs with attached strain gauges led to a force platewithin the same sensitivity range (Blickhan and Barth, 1985).Unfortunately, none of these devices are suitable to resolve 3D forcesat the micronewton level. They are therefore not able to capture thedynamics of small insects, for example, in the size range of an ant.
METHODS & TECHNIQUES
Science of Motion, Friedrich-Schiller-University Jena, Seidelstr. 20, 07749 Jena,Germany
*Author for correspondence ([email protected])
Received 18 July 2013; Accepted 7 November 2013
In this area, ultrasensitive, silicon-based microelectromechanicalsystems (MEMS) devices seem to be the method of choice. Variousprototypes and their principal usability in the field of insectbiomechanics have already been demonstrated (Bartsch et al., 2007;Muntwyler et al., 2010; Kan et al., 2013). However, a majorproblem with these sensors is their high fragility and the associatedsmall measuring range. Muntwyler and colleagues reported a forcerange for their device from ±20 to ±200 μN (Muntwyler et al.,2010). Ants are able to generate forces up to a multiple of their ownweight with their mandibles. Measurements have been publishedshowing that ants of the species Cataglyphis fortis could easily carryloads of 40 mg (Zollikofer, 1994). It is to be expected that theseanimals may generate much higher forces with their mandibles andlegs, which would damage the MEMS devices.
In a first attempt, we have succeeded in building a 3D miniatureforce plate based on PVC springs as well as measuring groundreaction forces in ants (Reinhardt et al., 2009). This sensorcombined an adequate sensitivity and robustness for our task.However, this design variant, consisting of a horizontal bar cross-connected with two orthogonally oriented bars, caused undesirablecrosstalk effects. In this paper, we present a detailed description ofa further development of our first prototype with significantly lowercrosstalk between the channels.
RESULTSStatic calibrationMean sensor outputs versus loading force are plotted in Fig. 1 andthe corresponding values are shown in Table 2. There is a highlinearity between output voltage and applied force in all directionsof the sensor. Coefficients of determination (r2) of the linearregressions were found to be nearly 1.0 for all piezoresistors. Basedon these results, we determined the sensitivity matrix K−1:
Calculating the inverse of K−1 provides the characteristic matrixK:
Inserting K in Eqn 13 (see Materials and methods) results in thefollowing matrix equation:
=⎛
⎝
⎜⎜
⎞
⎠
⎟⎟ μK
–0.0978 0.0295 –0.0007–0.0057 –0.1976 –0.00400.0010 –0.0013 –0.0510
mv / N . (1)–1
=⎛
⎝
⎜⎜
⎞
⎠
⎟⎟ μK
–10.13 –1.51 0.270.30 –5.02 0.39–0.28 0.13 –19.60
N / mv . (2)
⎛
⎝
⎜⎜⎜
⎞
⎠
⎟⎟⎟=
⎛
⎝
⎜⎜
⎞
⎠
⎟⎟
⎛
⎝
⎜⎜⎜
⎞
⎠
⎟⎟⎟
FF
F
UU
U
–10.13 –1.51 0.270.30 –5.02 0.39–0.28 0.13 –19.60
. (3)x
y
z
x
y
z
Ultra-miniature force plate for measuring triaxial forces in themicronewton rangeLars Reinhardt* and Reinhard Blickhan

The
Jour
nal o
f Exp
erim
enta
l Bio
logy
705
METHODS & TECHNIQUES The Journal of Experimental Biology (2014) doi:10.1242/jeb.094177
For the piezoresistors of the three directions (x, y and z), wedetermined the following regressions:
Matrix K and Fig. 1 confirm the predictions of the finite elementanalysis concerning the decoupling (crosstalk <2%) of the z-direction from the other two directions. Similarly, there is crosstalkbelow 6% in the x-direction when forces act along the y-axis.Surprisingly, we found crosstalk between Fx and Fy (see Fig. 1A).With respect to the calibrated forces, this effect is in the range of15%. This behaviour can be corrected, because a highly significantrelationship was determined through linear regression:
Dependence on site of force applicationThe z-component is largely independent (<5%) of the site (±2 mm) offorce application (see Fig. 3D). As predicted by modelling, thevertically oriented bending beams changed their signals at off-centrevertical loads (Fig. 2D). Here Sx only responds to shifts of the point of
= = =F U U r N( ) –10.13 , 0.997, 40 , (4)x x x2
= = =F U U r N( ) –5.02 , 0.999, 40 , (5)y y y2
= = =F U U r N( ) –19.60 , 0.997, 25 . (6)z z z2
= = =F F F r N( ) –0.1491 , 0.988, 40 . (7)y x x2
force application in the x-direction and Sy only to changes in the y-direction. In each direction, a significant (r2>0.937) relationshipbetween position and signal of the corresponding sensor exists. This isdirectly proportional to the signal of the vertical force sensor (Sz). Withknowledge of Sz and the x- and y-coordinates of the point of forceapplication, this effect could be corrected with the following equations:
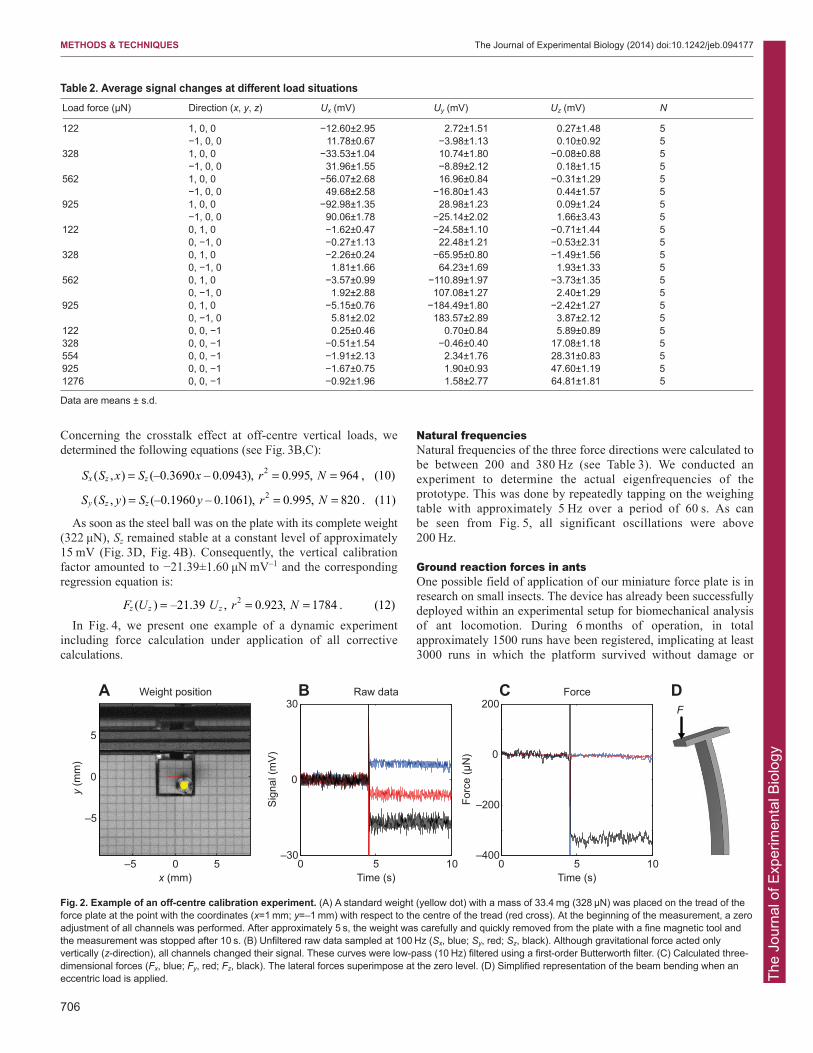
One example of a static calibration experiment including forcecalculation under application of all corrective calculations is shownin Fig. 2.
Dynamic calibrationThe dynamic calibration led to similar results as in the staticexperiments (Fig. 3). Because the calibration events had an averageduration of 57.2±8.6 ms, which is approximately equal to the contacttime of an ant leg during running (see Fig. 6), these trials verify theapplicability of the sensor in the field of insect biomechanics.Through the software-supported identification of the site of forceapplication, accuracy and spatial resolution was clearly higher thanin the static experiments. Accordingly, quantity and quality of thedata set and thus reliability of the results were much higher.
= = =S S x S x r N( , ) (–0.3790 – 0.0371), 0.987, 45 , (8)x z z2
= + = =S S y S y r N( , ) (–0.2453 0.0568), 0.937, 45 . (9)y z z2
–1 0 1–200
0
200
Sig
nal (
mV
)
x-direction
–1 0 1–200
0
200
Force (mN)
y-direction
–1.5 –0.5 0.5–200
0
200z-directionA B C
Fig. 1. Three-dimensional calibration of the force plate using standard weights between 12 and 130 mg (0.12–1.28 mN). The coloured points representthe signal changes of the strain gauges with respect to the applied load force. In each plot, the same colour scheme is used: Sx, blue; Sy, red; Sz, black. Foreach direction, regression lines are shown (see Eqns 4–6). As standard deviations are smaller than the marker size, no error bars are plotted (see Table 2).
Table 1. Prior measurement techniques
Reference Technology Axis Resolution
Heglund, 1981 Aluminium beams/strain gauge 2 0.1 NBlickhan and Barth, 1985 Plastic/bronze beams/strain gauge 3 1 mNFull and Tu, 1990 Brass beams/semiconductor strain gauge 2 1 mNFull et al., 1991 Brass beams/semiconductor strain gauge 3 1 mNKatz and Gosline, 1993 Brass beams/semiconductor strain gauge 3 1 mNDrechsler and Federle, 2006 Metal beams/strain gauge 2 0.1 mNAutumn et al., 2006 Brass beams/semiconductor strain gauge 3 0.5 mNBartsch et al., 2007 MEMS-based 3 1 µNWood et al., 2009 Invar® FeNi36/capacitive sensor 2 5 µNReinhardt et al., 2009 PVC-based/semiconductor strain gauge 3 10 µNMuntwyler et al., 2010 MEMS-based 3 1 µNDai et al., 2011 Aluminium beams/strain gauge 3 1 mNLin and Trimmer, 2012 Acrylic/strain gauge 2 0.3 mNKan et al., 2013 MEMS-based 3 1 µN
MEMS, microelectromechanical systems.
The
Jour
nal o
f Exp
erim
enta
l Bio
logy
706
METHODS & TECHNIQUES The Journal of Experimental Biology (2014) doi:10.1242/jeb.094177
Concerning the crosstalk effect at off-centre vertical loads, wedetermined the following equations (see Fig. 3B,C):
As soon as the steel ball was on the plate with its complete weight(322 μN), Sz remained stable at a constant level of approximately15 mV (Fig. 3D, Fig. 4B). Consequently, the vertical calibrationfactor amounted to −21.39±1.60 μN mV–1 and the correspondingregression equation is:
In Fig. 4, we present one example of a dynamic experimentincluding force calculation under application of all correctivecalculations.
= = =S S x S x r N( , ) (–0.3690 – 0.0943), 0.995, 964 , (10)x z z2
= = =S S y S y r N( , ) (–0.1960 – 0.1061), 0.995, 820 . (11)y z z2
= = =F U U r N( ) –21.39 , 0.923, 1784 . (12)z z z2
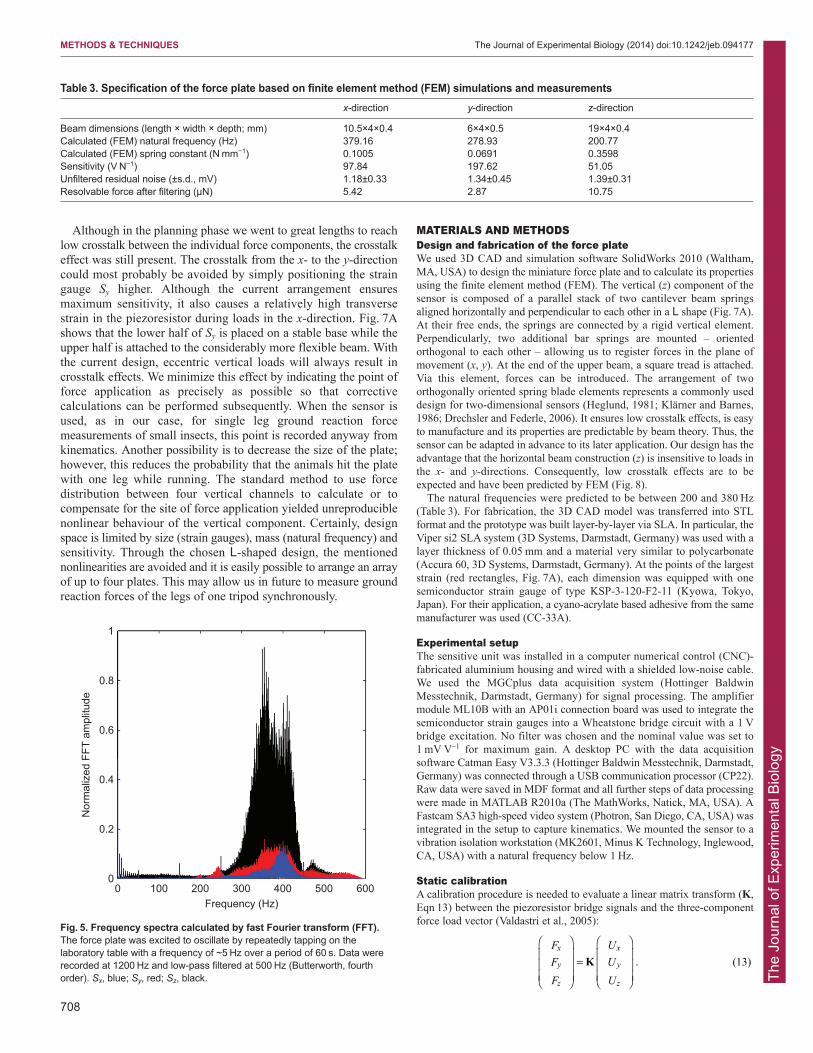
Natural frequenciesNatural frequencies of the three force directions were calculated tobe between 200 and 380 Hz (see Table 3). We conducted anexperiment to determine the actual eigenfrequencies of theprototype. This was done by repeatedly tapping on the weighingtable with approximately 5 Hz over a period of 60 s. As can be seen from Fig. 5, all significant oscillations were above 200 Hz.
Ground reaction forces in antsOne possible field of application of our miniature force plate is inresearch on small insects. The device has already been successfullydeployed within an experimental setup for biomechanical analysisof ant locomotion. During 6 months of operation, in totalapproximately 1500 runs have been registered, implicating at least3000 runs in which the platform survived without damage or
Table 2. Average signal changes at different load situationsLoad force (µN) Direction (x, y, z) Ux (mV) Uy (mV) Uz (mV) N
122 1, 0, 0 −12.60±2.95 2.72±1.51 0.27±1.48 5−1, 0, 0 11.78±0.67 −3.98±1.13 0.10±0.92 5
328 1, 0, 0 −33.53±1.04 10.74±1.80 −0.08±0.88 5−1, 0, 0 31.96±1.55 −8.89±2.12 0.18±1.15 5
562 1, 0, 0 −56.07±2.68 16.96±0.84 −0.31±1.29 5−1, 0, 0 49.68±2.58 −16.80±1.43 0.44±1.57 5
925 1, 0, 0 −92.98±1.35 28.98±1.23 0.09±1.24 5−1, 0, 0 90.06±1.78 −25.14±2.02 1.66±3.43 5
122 0, 1, 0 −1.62±0.47 −24.58±1.10 −0.71±1.44 50, −1, 0 −0.27±1.13 22.48±1.21 −0.53±2.31 5
328 0, 1, 0 −2.26±0.24 −65.95±0.80 −1.49±1.56 50, −1, 0 1.81±1.66 64.23±1.69 1.93±1.33 5
562 0, 1, 0 −3.57±0.99 −110.89±1.97 −3.73±1.35 50, −1, 0 1.92±2.88 107.08±1.27 2.40±1.29 5
925 0, 1, 0 −5.15±0.76 −184.49±1.80 −2.42±1.27 50, −1, 0 5.81±2.02 183.57±2.89 3.87±2.12 5
122 0, 0, −1 0.25±0.46 0.70±0.84 5.89±0.89 5328 0, 0, −1 −0.51±1.54 −0.46±0.40 17.08±1.18 5554 0, 0, −1 −1.91±2.13 2.34±1.76 28.31±0.83 5925 0, 0, −1 −1.67±0.75 1.90±0.93 47.60±1.19 51276 0, 0, −1 −0.92±1.96 1.58±2.77 64.81±1.81 5
Data are means ± s.d.
Weight position
x (mm)
y (m
m)
–5 0 5
5
0
–5
0 5 10–30
0
30Raw data
Time (s)
Sig
nal (
mV
)
0 5 10–400
–200
0
200Force
Time (s)
Forc
e (μ
N)
A B C DF
Fig. 2. Example of an off-centre calibration experiment. (A) A standard weight (yellow dot) with a mass of 33.4 mg (328 μN) was placed on the tread of theforce plate at the point with the coordinates (x=1 mm; y=–1 mm) with respect to the centre of the tread (red cross). At the beginning of the measurement, a zeroadjustment of all channels was performed. After approximately 5 s, the weight was carefully and quickly removed from the plate with a fine magnetic tool andthe measurement was stopped after 10 s. (B) Unfiltered raw data sampled at 100 Hz (Sx, blue; Sy, red; Sz, black). Although gravitational force acted onlyvertically (z-direction), all channels changed their signal. These curves were low-pass (10 Hz) filtered using a first-order Butterworth filter. (C) Calculated three-dimensional forces (Fx, blue; Fy, red; Fz, black). The lateral forces superimpose at the zero level. (D) Simplified representation of the beam bending when aneccentric load is applied.

The
Jour
nal o
f Exp
erim
enta
l Bio
logy
707
METHODS & TECHNIQUES The Journal of Experimental Biology (2014) doi:10.1242/jeb.094177
decreased performance. One exemplary measurement of the redwood ant Formica polyctena is shown in Fig. 6.
DISCUSSIONIn this work, we present a new design and fabrication method of atriaxial miniature force plate for the micronewton range. A 3Dbeam construction was built using the highly precisestereolithography (SLA) technique. The prototype was equippedwith commercially available semiconductor strain gauges andconnected to a digital multi-channel amplifier system. We heredemonstrate that the properties of the used material are suitable forsensor design. The polycarbonate similar material is light, veryelastic, well damped, and the adhesive bond with the strain gaugesis solid and permanent. For the investigated range up to 1.3 mN,we found a highly linear behaviour in all directions. Furthermore,individual experiments with loads of up to 4 mN proved the same
characteristics and confirmed the particular robustness of our forceplate. This property in particular is a distinct advantage comparedwith other highly sensitive MEMS devices described in theliterature (Bartsch et al., 2007; Muntwyler et al., 2010; Kan et al.,2013). These sensors are extremely fragile and are not able toresist the maximum forces that, for instance, ants can produce withtheir mandibles. Thus, MEMS devices are, despite their highsensitivities, rather unsuitable for experiments with freely runninginsects. Additionally, they are considerably more expensive toproduce. The stereolithographic manufacturing processes offerfreedom of design, which makes it possible to adapt the sensor toa wide range of applications. Therefore, our measuring device canbe applied far beyond the field of insect biomechanics. Forexample, the force plate could be invaluable to the design andtesting of the next generation of micro-robots (Hoffman and Wood,2011; Ozcan et al., 2013).
–4 –2 0 2 4–4
–2
0
2
4
x (mm)
y (m
m)
Path
x (mm)Sx (
mV
)
x-direction
–2 –1 0 1 2–2
–1
0
1
2
y (mm)
Sy (
mV
)
y-direction
–2 –1 0 1 2–2
–1
0
1
2
x/y (mm)
Sz (
mV
)
z-direction
–2 –1 0 1 20
10
20
30Sx(Sz,x)=Sz(–0.369x–0.094)
r²=0.995Sy(Sz,y)=Sz(–0.196y–0.106)
r²=0.995Sz=15.05r²=0.923
A B C D
Fig. 3. Dynamic calibration using a 32.8 mg steel ball with a diameter of 2 mm. The ball was set rolling across the plate 13 times along the x-axis and justas often along the y-axis. (A) Pathways of the steel ball shown as black lines. The outline of the force plate is marked by a bold black square. (B–D) Meansignal of the strain gauges in the x- (B), y- (C) and z-directions (D) versus the position of force application. In each plot, solid black lines represent the meanvalues and grey areas the standard deviations. Linear regressions are designated by red dotted lines, and the equations are presented. Signals of thehorizontal (x, y) channels in the plots B and C are normalised to a vertical signal of 1 mV (21.4 μN). (D) The signal of the vertical (Sz) channel is independentfrom the load position and the linear regression results in a constant value.
–4 –2 0 2 4–4
–2
0
2
4
x (mm)
y (m
m)
Path
0 0.1 0.2 0.3 0.4–50
–30
–10
10
30
50
Time (s)
Sig
nal (
mV
)
Signal
0 0.1 0.2 0.3 0.4–0.2
0
0.2
0.4
0.6
Time (s)
Forc
e (m
N)
ForceA
D
B C
0.13 s 0.17 s 0.21 s 0.25 s 0.29 s
SxSySz
FxFyFz
Fig. 4. Individual measurement of a rolling steel ball. Force and video data were synchronously sampled at 1200 Hz. (A) Pathway of the ball and outline ofthe force plate (bold square). (B) Sensor signals were smoothed by applying a low-pass first-order Butterworth filter, with a cut-off frequency of 150 Hz. A blackbar on the time axis marks the stage in which the ball crossed the force plate. (C) Calculated three-dimensional forces (Fx, blue; Fy, red; Fz, black). The dottedline indicates the weight force (322 μN). (D) Image sequence of the presented trial including the pathway (red line).
The
Jour
nal o
f Exp
erim
enta
l Bio
logy
708
METHODS & TECHNIQUES The Journal of Experimental Biology (2014) doi:10.1242/jeb.094177
Although in the planning phase we went to great lengths to reachlow crosstalk between the individual force components, the crosstalkeffect was still present. The crosstalk from the x- to the y-directioncould most probably be avoided by simply positioning the straingauge Sy higher. Although the current arrangement ensuresmaximum sensitivity, it also causes a relatively high transversestrain in the piezoresistor during loads in the x-direction. Fig. 7Ashows that the lower half of Sy is placed on a stable base while theupper half is attached to the considerably more flexible beam. Withthe current design, eccentric vertical loads will always result incrosstalk effects. We minimize this effect by indicating the point offorce application as precisely as possible so that correctivecalculations can be performed subsequently. When the sensor isused, as in our case, for single leg ground reaction forcemeasurements of small insects, this point is recorded anyway fromkinematics. Another possibility is to decrease the size of the plate;however, this reduces the probability that the animals hit the platewith one leg while running. The standard method to use forcedistribution between four vertical channels to calculate or tocompensate for the site of force application yielded unreproduciblenonlinear behaviour of the vertical component. Certainly, designspace is limited by size (strain gauges), mass (natural frequency) andsensitivity. Through the chosen L-shaped design, the mentionednonlinearities are avoided and it is easily possible to arrange an arrayof up to four plates. This may allow us in future to measure groundreaction forces of the legs of one tripod synchronously.
MATERIALS AND METHODSDesign and fabrication of the force plateWe used 3D CAD and simulation software SolidWorks 2010 (Waltham,MA, USA) to design the miniature force plate and to calculate its propertiesusing the finite element method (FEM). The vertical (z) component of thesensor is composed of a parallel stack of two cantilever beam springsaligned horizontally and perpendicular to each other in a L shape (Fig. 7A).At their free ends, the springs are connected by a rigid vertical element.Perpendicularly, two additional bar springs are mounted – orientedorthogonal to each other – allowing us to register forces in the plane ofmovement (x, y). At the end of the upper beam, a square tread is attached.Via this element, forces can be introduced. The arrangement of twoorthogonally oriented spring blade elements represents a commonly useddesign for two-dimensional sensors (Heglund, 1981; Klärner and Barnes,1986; Drechsler and Federle, 2006). It ensures low crosstalk effects, is easyto manufacture and its properties are predictable by beam theory. Thus, thesensor can be adapted in advance to its later application. Our design has theadvantage that the horizontal beam construction (z) is insensitive to loads inthe x- and y-directions. Consequently, low crosstalk effects are to beexpected and have been predicted by FEM (Fig. 8).
The natural frequencies were predicted to be between 200 and 380 Hz(Table 3). For fabrication, the 3D CAD model was transferred into STLformat and the prototype was built layer-by-layer via SLA. In particular, theViper si2 SLA system (3D Systems, Darmstadt, Germany) was used with alayer thickness of 0.05 mm and a material very similar to polycarbonate(Accura 60, 3D Systems, Darmstadt, Germany). At the points of the largeststrain (red rectangles, Fig. 7A), each dimension was equipped with onesemiconductor strain gauge of type KSP-3-120-F2-11 (Kyowa, Tokyo,Japan). For their application, a cyano-acrylate based adhesive from the samemanufacturer was used (CC-33A).
Experimental setupThe sensitive unit was installed in a computer numerical control (CNC)-fabricated aluminium housing and wired with a shielded low-noise cable.We used the MGCplus data acquisition system (Hottinger BaldwinMesstechnik, Darmstadt, Germany) for signal processing. The amplifiermodule ML10B with an AP01i connection board was used to integrate thesemiconductor strain gauges into a Wheatstone bridge circuit with a 1 Vbridge excitation. No filter was chosen and the nominal value was set to1 mV V–1 for maximum gain. A desktop PC with the data acquisitionsoftware Catman Easy V3.3.3 (Hottinger Baldwin Messtechnik, Darmstadt,Germany) was connected through a USB communication processor (CP22).Raw data were saved in MDF format and all further steps of data processingwere made in MATLAB R2010a (The MathWorks, Natick, MA, USA). AFastcam SA3 high-speed video system (Photron, San Diego, CA, USA) wasintegrated in the setup to capture kinematics. We mounted the sensor to avibration isolation workstation (MK2601, Minus K Technology, Inglewood,CA, USA) with a natural frequency below 1 Hz.
Static calibrationA calibration procedure is needed to evaluate a linear matrix transform (K,Eqn 13) between the piezoresistor bridge signals and the three-componentforce load vector (Valdastri et al., 2005):
FF
F
UU
U
K . (13)x
y
z
x
y
z
⎛
⎝
⎜⎜⎜
⎞
⎠
⎟⎟⎟=
⎛
⎝
⎜⎜⎜
⎞
⎠
⎟⎟⎟
Table 3. Specification of the force plate based on finite element method (FEM) simulations and measurementsx-direction y-direction z-direction
Beam dimensions (length × width × depth; mm) 10.5×4×0.4 6×4×0.5 19×4×0.4Calculated (FEM) natural frequency (Hz) 379.16 278.93 200.77Calculated (FEM) spring constant (N mm−1) 0.1005 0.0691 0.3598Sensitivity (V N−1) 97.84 197.62 51.05Unfiltered residual noise (±s.d., mV) 1.18±0.33 1.34±0.45 1.39±0.31Resolvable force after filtering (µN) 5.42 2.87 10.75
0 100 200 300 400 500 6000
0.2
0.4
0.6
0.8
1
Frequency (Hz)
Nor
mal
ized
FFT
am
plitu
de
Fig. 5. Frequency spectra calculated by fast Fourier transform (FFT).The force plate was excited to oscillate by repeatedly tapping on thelaboratory table with a frequency of ~5 Hz over a period of 60 s. Data wererecorded at 1200 Hz and low-pass filtered at 500 Hz (Butterworth, fourthorder). Sx, blue; Sy, red; Sz, black.

The
Jour
nal o
f Exp
erim
enta
l Bio
logy
709
METHODS & TECHNIQUES The Journal of Experimental Biology (2014) doi:10.1242/jeb.094177
To calculate K, we followed the algorithm described by Dai andcolleagues (Dai et al., 2011). Five standard weights with masses from 12 to130 mg (0.12–1.28 mN) were used and their weight was measured
accurately to 0.1 mg using an analytical balance (ABS 80-4, Kern and Sohn,Balingen, Germany). Each calibration experiment proceeded according tothe same pattern. The force plate was rotated such that gravity acted in the
0 ms 40 ms 80 ms 120 ms 160 ms 200 ms
Time (ms)
Forc
e (μ
N)
Individual ground reaction force measurement
0 40 80 120 160 200–150
–100
–50
0
50
100
150
200
xy
z
Fx
Fy
Fz
Gas
ter
Fig. 6. Individual ground reaction force measurement of a running wood ant of the species Formica polyctena. Blue, fore–aft forces (Fx); red, lateralforces (Fy); black, vertical forces (Fz). The ant had a body mass of 23.2 mg and ran with a velocity of 10.2 cm s−1. Force data were sampled at 1200 Hz andsmoothed using a low-pass first-order Butterworth filter with a cut-off frequency of 150 Hz. An image sequence of the synchronously recorded high-speed videois shown in the lower part of the figure. The single frames are shown in a 40 ms time interval and the corresponding time points are indicated by black trianglesin the force tracings. As can be seen, the ant steps on the plate firstly with the left front leg at ~40 ms. Approximately 50 ms later, the stance phase ends andthe leg is lifted up again. In the horizontal force (blue) after 40 ms the ringing of this component at a frequency of ~400 Hz is observed. At ~120 ms the hind leftleg steps on the tread and has ground contact until 160 ms. Closer examination of video and force registration revealed that the first major force impact at120 ms is not generated by the hind leg but by the abdomen (gaster), which touches the ground at this instant (grey area).
A B
14 m
m
30 mm
Sz
Sx
Sy
x
z
y
Fig. 7. Construction drawing. (A) Design of the triaxial miniature force plate. The transducer is sensitive in the three directions of the illustrated coordinatesystem. In each direction, at least one beam is arranged to take up the respective force component. Beam bending is measured by strain gauges whosepositions are marked by red rectangles. Vertical forces (z-direction) effect bending of four horizontally aligned cantilevers. One of them is equipped with a straingauge (Sz) at its clamping. Horizontal forces in the x- and y-directions are registered by the signal of the strain gauges Sx and Sy, respectively, on twoorthogonally oriented bars. At the end of the upper beam, a square tread is attached (side length 4 mm). (B) Embedding of the force plate in our experimentalrunway for measuring ground reaction forces in ants.

The
Jour
nal o
f Exp
erim
enta
l Bio
logy
710
METHODS & TECHNIQUES The Journal of Experimental Biology (2014) doi:10.1242/jeb.094177
direction to be calibrated. A weight was placed on the tread, zero adjustmentof all bridge channels was performed and the measurement was started.After approximately 5 s, the weight was carefully and quickly removed fromthe plate with a fine magnetic tool and the measurement was stopped after10 s. This procedure was repeated five times per calibration situation. Wecalculated the difference between the mean voltages of the first and the last3 s of each calibration cycle. These values were used to calculate the linearregression between the loaded weight and the output signal with the CurveFitting Toolbox in MATLAB. Zero crossing was forced by setting up alinear equation with an intercept of zero as the regression model. From theregression analysis, the sensitivity matrix K−1 (Eqn 14) was established,which is the inverse of K:
Our simulations and calibration experiments have shown that themeasurement of the force in the z-direction is independent from the point offorce application. However, the upright-standing beams also bend at off-centre vertical loads (see Fig. 2D). To quantify this effect, we repeated thecalibration process in the z-direction at nine different positions. We usedscale paper bonded to the tread to define these points. They were arrangedin a 3×3 matrix with a grid width of 1 mm around the centre. An exampleof an off-centre calibration is illustrated in Fig. 2.
Dynamic calibrationBesides the static calibration, we performed dynamic experiments using asteel ball with a mass of 32.8 mg and a diameter of 2 mm. For this, the forceplate was tilted by an angle of approximately 2 deg to the plane and the steelball was allowed to roll across the plate with a starting distance ofapproximately 4 cm. Because of the marginal inclination, it was assumedthat only a vertical force of 322 μN acted on the sensor, when the steel ballwas on the plate. The slope was chosen so that the ball rolled closely alongthe horizontal axes of the coordinate system (see Fig. 3A). We repeated thisprocedure 13 times for the x- and y-directions. The signals of the forcesensor were recorded synchronously with high-speed videos at 1200 Hz(resolution: 0.077 mm pixel−1). Steel ball kinematics were digitized using thesoftware WINanalyze 3D (Version 2.1.1, Mikromak, Berlin, Germany). Onaverage, the ball rolled across the plate with a velocity of 7.1±1.1 cm s−1
(mean ± s.d.) and the contact duration was 57.2±8.6 ms. Thus, in everysingle experiment, ~70 data points were registered to map the complete platelength of 4 mm. These data points were used to re-calculate the calibrationfactor in the z-direction and the crosstalk effect on Sx and Sy at off-centrevertical (z) loads.
Competing interestsThe authors declare no competing financial interests.
UU
U
FF
F
K . (14)x
y
z
x
y
z
–1
⎛
⎝
⎜⎜⎜
⎞
⎠
⎟⎟⎟=
⎛
⎝
⎜⎜⎜
⎞
⎠
⎟⎟⎟
Author contributionsL.R. made significant and substantial contributions to the conception, design,execution and interpretation of the findings being published, and drafting andrevising the article. R.B. made significant and substantial contributions to thedesign, execution and interpretation of the findings being published.
FundingThis work was funded by the German Research Foundation (DFG) [BL 236/20-1 toR.B.].
ReferencesAutumn, K., Hsieh, S. T., Dudek, D. M., Chen, J., Chitaphan, C. and Full, R. J.
(2006). Dynamics of geckos running vertically. J. Exp. Biol. 209, 260-272. Bartsch, M. S., Federle, W., Full, R. J. and Kenny, T. W. (2007). A multiaxis force
sensor for the study of insect biomechanics. J. Microelectromech. Syst. 16, 709-718.
Blickhan, R. and Barth, F. (1985). Strains in the exoskeleton of spiders. J. Comp.Physiol. A 157, 115-147.
Dai, Z., Wang, Z. and Ji, A. (2011). Dynamics of gecko locomotion: a force-measuringarray to measure 3D reaction forces. J. Exp. Biol. 214, 703-708.
Drechsler, P. and Federle, W. (2006). Biomechanics of smooth adhesive pads ininsects: influence of tarsal secretion on attachment performance. J. Comp. Physiol.A 192, 1213-1222.
Full, R. J. and Tu, M. S. (1990). Mechanics of six-legged runners. J. Exp. Biol. 148,129-146.
Full, R. J., Blickhan, R. and Ting, L. H. (1991). Leg design in hexapedal runners. J.Exp. Biol. 158, 369-390.
Heglund, N. C. (1981). Short communication: a simple design for a force-plate tomeasure ground reaction forces. J. Exp. Biol. 93, 333-338.
Hoffman, K. and Wood, R. (2011). Myriapod-like ambulation of a segmentedmicrorobot. Auton. Robots 31, 103-114.
Kan, T., Takahashi, H., Binh-Khiem, N., Aoyama, Y., Takei, Y., Noda, K.,Matsumoto, K. and Shimoyama, I. (2013). Design of a piezoresistive triaxial forcesensor probe using the sidewall doping method. J. Micromech. Microeng. 23,035027.
Katz, S. L. and Gosline, J. M. (1993). Ontogenetic scaling of jump performance in theafrican desert locust (Schistocerca gregaria). J. Exp. Biol. 177, 81-111.
Klärner, D. and Barnes, W. J. P. (1986). The cuticular stress detector (CSD2) of thecrayfish: II. Activity during walking and influences on leg coordination. J. Exp. Biol.122, 161-175.
Lin, H.-T. and Trimmer, B. A. (2012). A new bi-axial cantilever beam design forbiomechanics force measurements. J. Biomech. 45, 2310-2314.
Muntwyler, S., Beyeler, F. and Nelson, B. J. (2010). Three-axis micro-force sensorwith sub-micro-Newton measurement uncertainty and tunable force range. J.Micromech. Microeng. 20, 025011.
Ozcan, O., Baisch, A. T. and Wood, R. J. (2013). Design and feedback control of abiologically-inspired miniature quadruped. IEEE/RSJ International Conference onIntelligent Robots and Systems (IROS), pp. 1438-1444. Tokyo, Japan.
Reinhardt, L., Weihmann, T. and Blickhan, R. (2009). Dynamics and kinematics of ant locomotion: do wood ants climb on level surfaces? J. Exp. Biol. 212, 2426-2435.
Valdastri, P., Roccella, S., Beccai, L., Cattin, E., Menciassi, A., Carrozza, M. C. andDario, P. (2005). Characterization of a novel hybrid silicon three-axial force sensor.Sens. Actuators A Phys. 123-124, 249-257.
Wood, R. J., Cho, K.-J. and Hoffman, K. (2009). A novel multi-axis force sensor formicrorobotics applications. Smart Mater. Struct. 18, 125002.
Zollikofer, C. (1994). Stepping patterns in ants – influence of load. J. Exp. Biol. 192,119-127.
Von
Mis
es s
tress
(N m
–2) 5.0E+004
4.2E+004
3.3E+004
2.5E+004
1.7E+004
8.3E+003
4.8E-009
A B C D
x
z
y
Fig. 8. Results of the finite element analysis at different load conditions. Von Mises stress in the three-dimensional model was calculated when a 1 mNforce was acting on the tread in the x- (A), y- (B) and z-directions (C). A triaxial force of 1 mN in each direction causes the stress condition shown in D.