ultra-efficient scientific computing more science less power john shalf leonid oliker, michael...
Post on 23-Jan-2016
225 views
TRANSCRIPT

Ultra-Efficient Scientific Computing
More Science Less Power
John ShalfLeonid Oliker, Michael Wehner, Kathy Yelick
RAMP Retreat: January 16, 2008

End of Dennard Scaling
• New Constraints– Power limits clock rates– Cannot squeeze more
performance from ILP (complex cores) either!
• But Moore’s Law continues!– What to do with all of those
transistors if everything else is flat-lining?
– Now, #cores per chip doubles every 18 months instead of clock frequency!
• No more free lunch for performance improvement!
Figure courtesy of Kunle Olukotun, Lance Hammond, Herb Sutter, and Burton Smith

ORNL Computing Power and Cooling 2006 - 2011• Immediate need to add 8 MW to
prepare for 2007 installs of new systems
• NLCF petascale system could require an additional 10 MW by 2008
• Need total of 40-50 MW for projected systems by 2011
• Numbers just for computers: add 75% for cooling
• Cooling will require 12,000 – 15,000 tons of chiller capacity
0
10
20
30
40
50
60
70
80
90
2005 2006 2007 2008 2009 2010 2011
Year
Computer Center Power Projections
Cooling
Computers
Cost estimates based on $0.05 kW/hr
$3M
$17M
$9M
$23M
$31M
OAK RIDGE NATIONAL LABORATORYU. S. DEPARTMENT OF ENERGY
Site FY 2005 FY 2006 FY 2007 FY 2008 FY 2009 FY 2010LBNL 43.70 50.23 53.43 57.51 58.20 56.40 *ANL 44.92 53.01ORNL 46.34 51.33PNNL 49.82 N/A
Annual Average Electrical Power Rates $/MWh
Data taken from Energy Management System-4 (EMS4). EMS4 is the DOE corporate system for collecting energy information from the sites. EMS4 is a web-based system that collects energy consumption and cost information for all energy sources used at each DOE site. Information is entered into EMS4 by the site and reviewed at Headquarters for accuracy.
YIKES!

Top500 Estimated Power Requirements
Growth in Power Consumption (Top50)
0.00
500.00
1000.00
1500.00
2000.00
2500.00
3000.00
3500.00
4000.00
Jun-00Sep-00Dec-00Mar-01Jun-01Sep-01Dec-01Mar-02Jun-02Sep-02Dec-02Mar-03Jun-03Sep-03Dec-03Mar-04Jun-04Sep-04Dec-04Mar-05Jun-05Sep-05Dec-05Mar-06Jun-06
System Power (kW)
max pwr
avg pwr
Growth in Power Consumption (Top50)Excluding Cooling
0.00
100.00
200.00
300.00
400.00
500.00
600.00
700.00
800.00
Jun-00Sep-00Dec-00Mar-01Jun-01Sep-01Dec-01Mar-02Jun-02Sep-02Dec-02Mar-03Jun-03Sep-03Dec-03Mar-04Jun-04Sep-04Dec-04Mar-05Jun-05Sep-05Dec-05Mar-06Jun-06
System Power (kW)
Avg. Power Top50

Power is an Industry Wide Problem
“Hiding in Plain Sight, Google Seeks More Power”, by John Markoff, June 14, 2006
New Google Plant in The Dulles, Oregon, from NYT, June 14, 2006

Cost of Power Will Dominate, and Ultimately Limit Practical Scale of Future Systems
Source: Luiz André Barroso, (Google) “The Price of Performance,” ACM Queue, Vol. 2, No. 7, pp. 48-53, September 2005.
(Modified with permission.)
Unrestrained IT power consumption could eclipse hardware costs and put great pressure on affordability, data center infrastructure, and the environment.

Ultra-Efficient Computing:100x over Business As Usual
• Cooperative effort we call “science-driven system architecture” – Effective future exascale systems must be developed in
the context of application requirements
• Radically change HPC system development via application-driven hardware/software co-design– Achieve 100x power efficiency and 100x capability of
mainstream HPC approach for targeted high impact applications
– Accelerate development cycle for exascale HPC systems
– Approach is applicable to numerous scientific areas in the DOE Office of Science
– Proposed pilot application: Ultra-high resolution climate change simulation

New Design Constraint: POWER
• Transistors still getting smaller– Moore’s Law is alive and well
• But Dennard scaling is dead!
– No power efficiency improvements with smaller transistors
– No clock frequency scaling with smaller transistors
– All “magical improvement of silicon goodness” has ended
• Traditional methods for extracting more performance are well-mined
– Cannot expect exotic architectures to save us from the “power wall”
– Even resources of DARPA can only accelerate existing research prototypes (not “magic” new technology)!

Estimated Exascale Power Requirements
• LBNL IJHPCA Study for ~1/5 Exaflop for Climate Science in 2008
– Extrapolation of Blue Gene and AMD design trends
– Estimate: 20 MW for BG and 179 MW for AMD
• DOE E3 Report
– Extrapolation of existing design trends to exascale in 2016
– Estimate: 130 MW
• DARPA Study
– More detailed assessment of component technologies
– Estimate: 20 MW just for memory alone, 60 MW aggregate extrapolated from current
design trends
• Baltimore Sun Article (Jan 23, 2007): NSA drawing 65-75MW in Maryland
– Crisis: Baltimore Gas & Electric does not have sufficient power for city of
Baltimore!
– Expected to increase by 10-15MW per year!
The current approach is not sustainable!

Path to Power EfficiencyReducing Waste in Computing
• Examine methodology of low-power embedded computing market– optimized for low power, low cost, and high computational
efficiency
“Years of research in low-power embedded computing have shown only one design technique to reduce power: reduce waste.”
Mark Horowitz, Stanford University & Rambus Inc.
• Sources of Waste– Wasted transistors (surface area)– Wasted computation (useless work/speculation/stalls)– Wasted bandwidth (data movement)– Designing for serial performance

Our New Design Paradigm: Application-Driven HPC
• Identify high-impact exascale scientific applications
• Tailor system architecture to highly parallel applications
• Co-design algorithms and software together with the hardware – Enabled by hardware emulation environments– Supported by auto-tuning for code generation

Designing for Efficiency is Application Class Specific

Processor Power and PerformanceEmbedded Application-Specific Cores
Performance on EEMBC benchmarks aggregate for Consumer, Telecom, Office, Network, based on ARM1136J-S (Freescale i.MX31), ARM1026EJ-S, Tensilica Diamond 570T, T1050 and T1030, MIPS 20K, NECVR5000). MIPS M4K, MIPS 4Ke, MIPS 4Ks, MIPS 24K, ARM 968E-S, ARM 966E-S, ARM926EJ-S, ARM7TDMI-S scaled by ratio of Dhrystone MIPS within architecture family. All power figures from vendor websites, 2/23/2006.
Courtesy of Chris Rowen, Tensilica Inc.
0
2
4
6
8
10
12
0 25 50 75 100 125 150 175 200
Power (core mW)
Performance (ARM1136 @ 333MHz = 1.0)
50x performance/watt
Conventional Embedded Core
Application-Targeted Core

How Small Is “Small”?
• Power5 (Server)– 389 mm2
– 120 W @ 1900 MHz
• Intel Core2 sc (Laptop)– 130 mm2
– 15 W @ 1000 MHz
• PowerPC450 (BlueGene/P)– 8 mm2
– 3 W @ 850 MHz
• XTensa DP (cell phones)– 0.8 mm2
– 0.09 W @ 650 MHz
Intel Core2
PPC450
TensilicaDP
Power 5
Each core operates at 1/3 to 1/10th efficiency of largest chip, but you can pack 100x more cores onto a chip and consume 1/20 the power!

Chris Rowen DataQuickTime™ and a
TIFF (LZW) decompressorare needed to see this picture.

QuickTime™ and aTIFF (LZW) decompressor
are needed to see this picture.
Intel

Partnerships for Power-Efficient Computing
• Identify high-impact exascale office of science projects!• Embark on targeted program of tightly coupled
hardware/software co-design– Impossible using the typical two-year hardware lead
times– Break slow feedback loop for system designs via RAMP
hardware emulation platform and auto-tuned code generation
– Technology partners:• UC Berkeley: K Yelick, J Wawrzynek,
K Asanovic, K Keutzer• Stanford University / Rambus Inc.: M Horowitz• Tensilica Inc.: C Rowen
• Pilot application: kilometer-scale climate model– Provides important answers to question with multi-trillion-dollar ramifications– Climate community partners: Michael Wehner, Bill Collins, David Randall, et al.

Cloud System Resolving Climate Simulation
• A major source of errors in climate models is poor cloud simulation
• At ~1 km horizontal resolution, cloud systems can be resolved
• Requires significant algorithm work and unprecedented concurrencies
• Dave Randall’s SciDAC-funded effort at Colorado State University offers an algorithm for this regime
– Icosahedral grid is highly uniform– Amenable to massively concurrent architectures composed
of power-efficient embedded cores

Effects of Finer Resolutions
Duffy, et al
Enhanced resolution of mountains yield model improvements at larger scales

Pushing Current Model to High Resolution
QuickTime™ and a decompressor
are needed to see this picture.
20 km resolution produces reasonable tropical cyclones

Kilometer-scale fidelity
• Current cloud parameterizations break down somewhere around 10km– Deep convective processes responsible for moisture transport from near
surface to higher altitudes are inadequately represented at current resolutions
– Assumptions regarding the distribution of cloud types become invalid in the Arakawa-Schubert scheme
– Uncertainty in short and long term forecasts can be traced to these inaccuracies
• However, at ~2 or 3km, a radical reformulation of atmospheric general circulation models is possible:– Cloud system resolving models replace cumulus convection and large
scale precipitation parameterizations.• Will this lead to better global cloud distributions

Extrapolating fvCAM to km Scale
• fvCAM: NCAR Community Atmospheric Model version 3.1– Atmospheric component of fully coupled climate model, CCSM3.0– Finite Volume hydrostatic dynamics (Lin-Rood)– Parameterized physics is the same as the spectral version– We use fvCAM as a tool to estimate future computational
requirements.
Major algorithm components of FVCAM?• Dynamics - solves atmospheric motion, N.S. eqn fluid dynamics
– Ops = O(mn2) Time step determined by the Courant (CFL) condition– Time step depends horizontal resolution (n)
• Physics - Parameterized external processes relevant to state of atmosphere
– Ops = O(mn), Time step can remain constant t = 30 minutes– Not subject to CFL condition
• Filtering– Ops = O(mlog(m)n2), addresses high aspect cells at poles via FFT– Allows violation of overly restrictive Courant condition near poles

Extrapolation to km-Scale
Theoretical scaling behavior matches experimental measurements
By extrapolating out to 1.5km, we see the dynamics dominates calculation time while Physics and Filters overheads become negligible
Computational Breakdown
0%10%20%30%40%50%60%70%80%90%
100%
200(B)
100(C)
50(D)
25(E)
13(F)
6.3(G)
3.1(H)
1.5(I)
Horizontal Resolution (Mesh Name)
% of Total Time
Dynamics
Physics
Filters
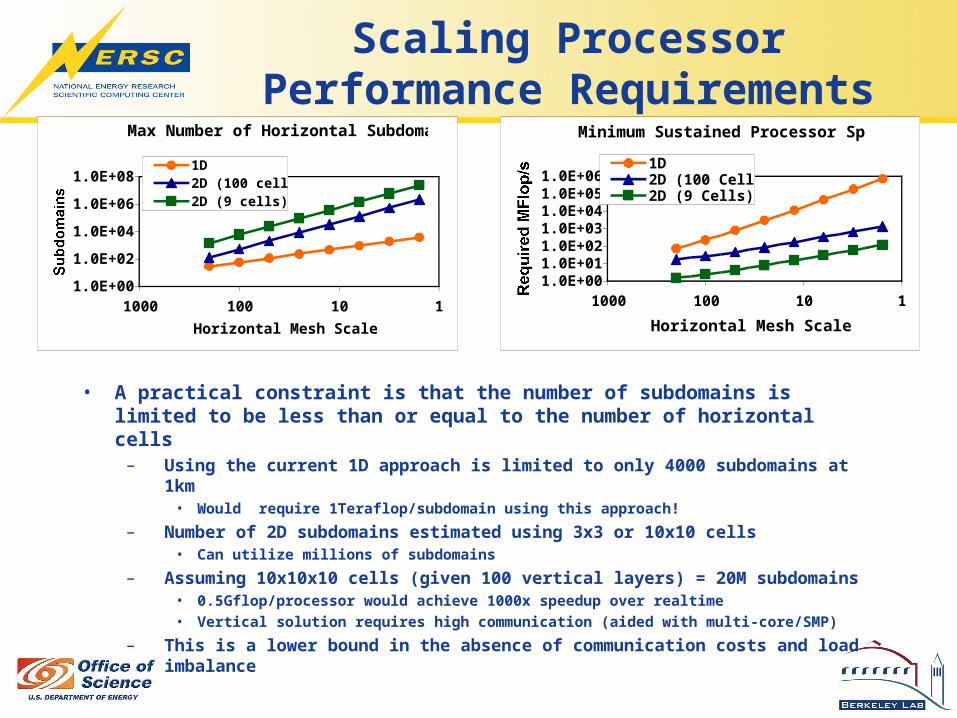
Scaling Processor Performance Requirements
• A practical constraint is that the number of subdomains is limited to be less than or equal to the number of horizontal cells
– Using the current 1D approach is limited to only 4000 subdomains at 1km• Would require 1Teraflop/subdomain using this approach!
– Number of 2D subdomains estimated using 3x3 or 10x10 cells• Can utilize millions of subdomains
– Assuming 10x10x10 cells (given 100 vertical layers) = 20M subdomains• 0.5Gflop/processor would achieve 1000x speedup over realtime• Vertical solution requires high communication (aided with multi-core/SMP)
– This is a lower bound in the absence of communication costs and load imbalance
Max Number of Horizontal Subdomains
1.0E+00
1.0E+02
1.0E+04
1.0E+06
1.0E+08
1101001000
Horizontal Mesh Scale (km)
Subdomains
1D2D (100 cells)2D (9 cells)
Minimum Sustained Processor Speed
1.0E+001.0E+011.0E+021.0E+031.0E+041.0E+051.0E+06
1101001000
Horizontal Mesh Scale (km)
Required MFlop/s
1D2D (100 Cells)2D (9 Cells)

Memory Scaling Behavior
Total Memo
ry
Horizontal
Scale
Terabytes
Total Memory
0.001
0.01
0.1
1
10
100
1101001000Horizontal Scale (km)
Terabytes
ModeledMeasured
Memory to Speed Ratio
0.001
0.01
0.1
1
1101001000
Horizontal scale (km)
bytes/flop
• Memory estimate at km-scale is about 25 TB total)– 100 TB total with 100 vertical levels
– Total memory requirement independent of domain decomposition
• Due to Courant condition, operation count scales at greater rate than mesh cells - thus relatively low per processor memory requirement
– Memory bytes per flop drop from 0.7 for 200km mesh to .009 for 1.5km mesh.
– Using current 1D approach requires 6GB per processor
– With 2D approach requires only 5MB per processor

Interconnect Requirements
• Three factors cause sustained performance lower than peak:– Single processor performance, interprocessor communication, load balancing
• 2D case message size are independent on horizontal resolution, however in 1D case communication contains ghost cells over the entire range of longitudes
• Assuming (pessimistically) communication only occurs during 10% of calculation - not over the entire (100%) interval - increases bandwidth demands 10x
– 2D 10x10 case requires: minimum 277 MB/s bandwidth and maximum18microsec latency– 1D case would require minimum of 256 GB/s bandwidth
• Note that the hardware/algorithm ability to overlap computation with communication would decrease interconnect requirements
• Load balance is important issue, but is not examined in our study
Communication Requirements
0
100
200
300
400
500
600
700
50 25 13 6 3 2
Horizontal Scale (km)
Required Rate
Max Latency (usec)
Min Bandwidth (MB/s)
Data assumes 2D 10x10 decomposition where only 10% of the calculation is devoted to communication

Communication Topology

New Discretization for Massive Parallelism
• Latitude-longitude based algorithm would not scale to 1km– Filtering cost would be only 7% of calculation– However the semi-Lagrangian advection algorithm breaks down
• Grid cell aspect ratio at the pole is 10000!• Advection time step is problematic at this scale
• Ultimately requires new discretization for atmosphere model– Must expose sufficient parallelism to exploit power-efficient design– Investigating Cubed Sphere (NOAA) and Icosahedral (Randall code)
Current Cubed Sphere Icosahedral

Strawman 1km Climate Computer
“I” mesh at 1000X real time
– .015oX.02oX100L (1.5km)– 10 Petaflops sustained– 100-200 Petaflops peak– 100 Terabytes total memory – Only 5 MB memory per processor– 5 GB/s local memory performance per domain (1
byte/flop)– 2 million horizontal subdomains– 10 vertical domains (assume fast vertical
communication)– 20 million processors at 500Mflops each sustained– 200 MB/s in four nearest neighbor directions– Tight coupling of communication in vertical dimension
We now compare available technology in current generation of HPC systems

Estimation of 1 km Climate Model Computational Requirements
• We have performed a detailed analysis of kilometer-scale climate model resource requirements
– Paper in International Journal of High Performance Computing Applications
• Equations of motion dominate at ultra-high resolutions because of Courant stability condition
• Require model run 1000x faster than real time (minimum)
– A truly exascale class scientific problem
– About 2 billion icosahedral points
– 20 million processors with modest vertical parallelization
– Modest 0.5 gigaflops/processor with 5 MB memory per processor
– Modest 200MB/s comm bandwidth to nearest neighbors

Customization Continuum
• Application-driven architecture does not NOT necessitate a special purpose machine!
• D.E. Shaw System: Semicustom design with some custom elements– Uses fully programmable cores with full-custom co-processors to achieve
efficiency (~1Megawatt)– Simulate 100x–1000x longer timescales than ANY feasible HPC system– Programmability broadens application reach (but narrower than our approach)
• MD-Grape: Full custom ASIC design – 1 petaflop performance for one application using 260 kilowatts– Cost $9M from concept to implementation
• Application-Driven Architecture (Climate Simulator): Semicustom design– Highly programmable core architecture using C/C++/Fortran– 100x better power efficiency is modest compared to demonstrated capability
of more specialized approaches!
AMD XT3
General Purpose Special Purpose Single Purpose
MD-GRAPED.E. ShawBlueGeneApp-DrivenArchitecture

Climate Strawman System DesignIn 2008
• Design system around the requirements of the massively parallel application• Example: kilometer scale climate model application
We examined three different approaches:• AMD Opteron: Commodity approach, lower efficiency for scientific applications
offset by cost efficiencies of mass market• BlueGene: Generic embedded processor core and customize system-on-chip
(SoC) services to improve power efficiency for scientific applications• Tensilica: Customized embedded CPU as well as SoC provides further power
efficiency benefits but maintains programmability
Processor Clock Peak/Core(Gflops)
Cores/Socket
Mem/BW(GB/s)
NetworkBW(GB/s)
Sockets Power Cost
2008
AMD Opteron 2.8GHz 5.6 2 6.4 4.5 890K 179 MW
IBM BG/P 850MHz 3.4 4 5.5 2.2 740K 20 MW
Climate computer 650MHz 2.7 32 51.2 34.5 120K 3 MW $75M
Solve an exascale problem without building an exaflop/s machine!

Climate System Design ConceptStrawman Design Study
10PF sustained
~120 m2
<3MWatts
< $75M
32 boards per rack
100 racks @ ~25KW
power + comms
32 chip + memory clusters per board (2.7
TFLOPS @ 700W
VLIW CPU: • 128b load-store + 2 DP MUL/ADD + integer op/ DMA
per cycle:• Synthesizable at 650MHz in commodity 65nm • 1mm2 core, 1.8-2.8mm2 with inst cache, data cache
data RAM, DMA interface, 0.25mW/MHz• Double precision SIMD FP : 4 ops/cycle (2.7GFLOPs)• Vectorizing compiler, cycle-accurate simulator,
debugger GUI (Existing part of Tensilica Tool Set)• 8 channel DMA for streaming from on/off chip DRAM• Nearest neighbor 2D communications grid
ProcArray
RAM RAM
RAM RAM
8 DRAM perprocessor
chip: 50 GB/s
CPU64-128K D
2x128b
32K I
8 chanDMA
CPU
D
IDM A
CPU
D
IDM A
CPU
D
IDM A
CPU
D
IDM A
CPU
D
IDM A
CPU
D
IDM A
CPU
D
IDM A
CPU
D
IDM A
CPU
D
IDM A
CPU
D
IDM A
CPU
D
IDM A
CPU
D
IDM A
CPU
D
IDM A
CPU
D
IDM A
CPU
D
IDM A
CPU
D
IDM A
CPU
D
IDM A
CPU
D
IDM A
CPU
D
IDM A
CPU
D
IDM A
CPU
D
IDM A
CPU
D
IDM A
CPU
D
IDM A
CPU
D
IDM A
CPU
D
IDM A
CPU
D
IDM A
CPU
D
IDM A
CPU
D
IDM A
CPU
D
IDM A
CPU
D
IDM A
CPU
D
IDM A
CPU
D
IDM A
Op
t. 8M
B e
mb
ed
de
d D
RA
M
External DRAM interface
External DRAM interface
Exte
rna
l DR
AM
inte
rfaceE
xte
rna
l DR
AM
inte
rfa
ce
MasterProcessor
Comm LinkControl
32 processors per 65nm chip83 GFLOPS @ 7W
From Chris Rowen, Tensilica

ProcessorGenerator(Tensilica) Build with any
process in any fab (Costs ~$1M)
Tailored SW Tools: Compiler, debugger,
simulators, Linux,other OS Ports(Automatically
generated together with the Core)
Application-optimized processor
implementation (RTL/Verilog)
Base CPU
AppsDatapaths
OCD
Timer
FPUExtended Registers
Cache
Automatic Processor Generation(Example from Existing Tensilica Design Flow)
Processor configuration1. Select from menu2. Automatic instruction
discovery (XPRES Compiler)3. Explicit instruction
description (TIE)

Impact on Broader DOE Scientific Workload
• We propose a cloud resolving climate change simulation to illustrate our power-efficient, application-driven design methodology
• Our approach is geared for a class of codes, not just for a single code instantiation
• This methodology is broadly applicable and could be extended to other scientific disciplines– BlueGene was originally targeted at chemistry
and bioinformatics applications result was very power-efficient architecture, and application was broader than the original target

More Info
• NERSC Science Driven System Architecture Group– http://www.nersc.gov/projects/SDSA
• Power Efficient Semi-custom Computing– http://vis.lbl.gov/~jshalf/SIAM_CSE07
• The “View from Berkeley”– http://view.eecs.berkeley.edu
• Memory Bandwidth– http://www.nersc.gov/projects/SDSA/reports/uploaded/S
OS11_mem_Shalf.pdf

Extra

Consumer Electronics Convergence
QuickTime™ and aTIFF (LZW) decompressor
are needed to see this picture.
From: Tsugio Makimoto

Consumer Electronics has Replaced PCs as the Dominant Market Force in CPU Design!!
QuickTime™ and aTIFF (LZW) decompressor
are needed to see this picture.
Apple Introduces
IPod
IPod+ITunes exceeds 50% of
Apple’s Net Profit
Apple Introduces Cell Phone
(iPhone)
From: Tsugio Makimoto

Convergence of Platforms
– Multiple parallel general-purpose processors (GPPs)– Multiple application-specific processors (ASPs)
“The Processor is the new Transistor”
[Rowen]
Intel 4004 (1971): 4-bit processor,
2312 transistors, ~100 KIPS,
10 micron PMOS, 11 mm2 chip
1000s of processor cores per
die
Sun Niagara8 GPP cores (32 threads)
Intel®XScale
™ Core32K IC32K DC
MEv210
MEv211
MEv212
MEv215
MEv214
MEv213
Rbuf64 @ 128B
Tbuf64 @ 128BHash
48/64/128Scratch
16KB
QDRSRAM
2
QDRSRAM
1
RDRAM1
RDRAM3
RDRAM2
GASKET
PCI
(64b)66
MHz
IXP280IXP28000 16b16b
16b16b
1188
1188
1188
1188
1818 1818 1818
64b64b
SPI4orCSIX
Stripe
E/D Q E/D Q
QDRSRAM
3E/D Q1188
1188
MEv29
MEv216
MEv22
MEv23
MEv24
MEv27
MEv26
MEv25
MEv21
MEv28
CSRs -Fast_wr
-UART-Timers
-GPIO-BootROM/SlowPort
QDRSRAM
4E/D Q1188
1188
Intel Network Processor1 GPP Core
16 ASPs (128 threads)
IBM Cell1 GPP (2 threads)
8 ASPs
Picochip DSP1 GPP core248 ASPs
Cisco CRS-1188 Tensilica GPPs

BG/L—the Rise of the Embedded Processor?
TOP 500 Performance by Architecture
1
10
100
1000
10000
100000
1000000
10000000
06/1993
MPPSMPClusterConstellationsSingle ProcessorSIMDOthersMPP embedded
06/1994
06/1995
06/1996
06/1997
06/1998
06/1999
06/2000
06/2001
06/2002
06/2003
06/2004
06/2005
Ag
gre
gat
e R
max
(Tfl
op
/s)

Tension Between Commodity and Specialized Architecture
• Commodity Components– Amortize high development costs by sharing costs with high
volume market– Accept lower computational efficiency for much lower capital
equipment costs!
• Specialization– Specialize to task in order to improve computational efficiency.– Specialization used very successfully by embeded processor
community– Not cost effective if volume is too low.
• When cost of power exceeds capital equipment costs– Commodity clusters are optimizing wrong part of the cost model– Will need for higher computational efficiency drive more
specialization? (look at embedded market… lots of specialization)

What is Happening Now?• Moore’s Law
– Silicon lithography will improve by 2x every 18 months
– Double the number of transistors per chip every 18mo.
• CMOS PowerTotal Power = V2 * f * C + V * Ileakage active power passive power
– As we reduce feature size Capacitance ( C ) decreases proportionally to transistor size
– Enables increase of clock frequency ( f ) proportionally to Moore’s law lithography improvements, with same power use
– This is called “Fixed Voltage Clock Frequency Scaling” (Borkar `99)
• Since ~90nm– V2 * f * C ~= V * Ileakage
– Can no longer take advantage of frequency scaling because passive power (V * Ileakage ) dominates
– Result is recent clock-frequency stall reflected in Patterson Graph at right
SPEC_Int benchmark performance since 1978 from Patterson & Hennessy Vol 4.
We are here!We are here!

Some Final Comments on Convergence(who is in the driver’s seat of the multicore revolution?)

Parallel Computing EverywhereCisco CRS-1 Terabit Router
• 188+4 Xtensa general purpose processor cores per Silicon Packet Processor
• Up to 400,000 processors per system• (this is not just about HPC!!!)
16 PPE
16 Clusters of 12 cores each(192 cores!)
Replaces ASIC using 188 GP cores!Emulates ASIC at nearly same power/performance
Better power/performance than FPGA!New Definition for “Custom” in SoC

Conclusions
• Enormous transition is underway that affects all sectors of computing industry– Motivated by power limits
– Proceeding before emergence of the parallel programming model
• Will lead to new era of architectural exploration given uncertainties about programming and execution model (and we MUST explore!)
• Need to get involved now– 3-5 years for new hardware designs to emerge
– 3-5 years lead for new software ideas necessary to support new hardware to emerge
– 5+ MORE years to general adoption of new software

Interconnect Design Considerations for Massive Concurrency
• Application studies provide insight to requirements for Interconnects (both on-chip and off-chip)
– On-chip interconnect is 2D planar (crossbar won’t scale!)
– Sparse connectivity for dwarfs; crossbar is overkill
– No single best topology• A Bandwidth-oriented network for data
– Most point-to-point message exhibit sparse topology & bandwidth bound
• Separate Latency-oriented network for collectives
– E.g., Thinking Machines CM-5, Cray T3D, IBM BlueGene/L&P
• Ultimately, need to be aware of the on-chip interconnect topology in addition to the off-chip topology
– Adaptive topology interconnects (HFAST)– Intelligent task migration?

Reliable System Design
• The future is unreliable– Silicon Lithography pushes towards the atomic scale, the opportunity for spurious
hardware errors will increase dramatically
• Reliability of a system is not necessarily proportional to the number of cores in the system
– Reliability is proportional to # of sockets in system (not #cores/chip)– At LLNL, BG/L has longer MTBF than Purple despite having 12x more processor
cores– Integrating more peripheral devices onto a single chip (e.g. caches, memory controller,
interconnect) can further reduce chip count and increase reliability (System-on-Chip/SOC)
• A key limiting factor is software infrastructure– Software was designed assuming perfect data integrity (but that is not a multicore
issue)– Software written with implicit assumption of smaller concurrency (1M cores not part of
original design assumptions) – Requires fundamental re-thinking of OS and math library design assumptions

Operating Systems for CMP
• Old OS Assumptions are bogus for hundreds of cores!
– Assumes limited number of CPUs that must be shared• Old OS: time-multiplexing (context switching and cache pollution!)• New OS: spatial partitioning
– Greedy allocation of finite I/O device interfaces (eg. 100 cores go after the network interface simultaneously)
• Old OS: First process to acquire lock gets device (resource/lock contention! Nondeterm delay!)
• New OS: QoS management for symmetric device access
– Background task handling via threads and signals• Old OS: Interrupts and threads (time-multiplexing) (inefficient!)• New OS: side-cores dedicated to DMA and async I/O
– Fault Isolation• Old OS: CPU failure --> Kernel Panic (will happen with increasing frequency in
future silicon!)• New OS: CPU failure --> Partition Restart (partitioned device drivers)
– Old OS invoked any interprocessor communication or scheduling vs. direct HW access

I/O For Massive Concurrency
• Scalable I/O for massively concurrent systems!– Many issues with coordinating access to disk within node (on chip
or CMP)
– OS will need to devote more attention to QoS for cores competing for finite resource (mutex locks and greedy resource allocation policies will not do!) (it is rugby where device == the ball)
nTasks I/O Rate
16 Tasks/node
I/O Rate
8 tasks per node
8 - 131 Mbytes/sec
16 7 Mbytes/sec 139 Mbytes/sec
32 11 Mbytes/sec 217 Mbytes/sec
64 11 Mbytes/sec 318 Mbytes/sec
128 25 Mbytes/sec 471 Mbytes/sec

QuickTime™ and aTIFF (LZW) decompressor
are needed to see this picture.
Intel

Chris Rowen DataQuickTime™ and a
TIFF (LZW) decompressorare needed to see this picture.

Increasing Blue Gene Impact
• SC 2005 Gordon Bell Award, 101.7 TFs on real materials science simulation– Recently exceeding 200 TFs sustained
• Sweep of the all four HPC Challenge class 1 benchmarks– G-HPL (259 Tflop/s), G-RandomAccess (35 GUPS) EP-
STREAM (160 TB/s) and G-FFT (2.3 Tflop/s)
• Over 80 large-scale applications ported and running on BG/L27.6 kW power consumption per rack (max)7 kW power consumption (idle)
Slide adapted from Rick Stevens, ANL

Future Scaling without Innovation
Slide adapted from Rick Stevens, ANL
If we scale current peak performance numbers for various architectures and allowing system peak doubling every 18 months. Trouble ahead
Projected Year BlueGene/LEarth
SimulatorMareNostrum
250 TF 2005 1.0 MWatt 100 MWatt 5 MWatt
1 PF 2008 2.5 MWatt 200 MWatt 15 MWatt
10 PF 2013 25 MWatt 2000 MWatt 150 MWatt
100 PF 2020 250 MWatt 20,000 MWatt 1500 MWatt

Green Grid - DOE Energy Savings Goal; 10.7 billion kWh/yr by 2011
Source: “Report to Congress on Server and Data Center Energy Efficiency Public Law 109-431” US EPA, August 2, 2007
Projected electricity useProjected electricity use- - Various scenarios 2007 - 2011Various scenarios 2007 - 2011

Petascale Architectural Exploration(back of the envelope calculation)
Processor Clock Peak/Core(Gflops)
Cores/Socket
Mem/BW(GB/s)
NetworkBW(GB/s)
Sockets Power(based on current generation technology)
AMD Opteron 2.8GHz 5.6 2 6.4 4.5 890K 179 MW
IBM BG/L 700MHz 2.8 2 5.5 2.2 1.8M 27 MW
Semicustom Embedded
650MHz 2.7 32 51.2 34.5 120K 3 MW
Software challenges (at all levels) are a tremendous obstacle for any of these
approaches.Unprecedented levels of concurrency are required.Unprecedented levels of power are required if we adopt conventional routeEmbedded route offers tractable power, but daunting concurrency!
This only gets us to 10 Petaflops peak - 200PF system to meet application sustained performance requirementsthus cost and power are likely to be 10x-20x more.