ulrich spiesshofer, ceo; eric elzvik, cfo, february 3 ... · increased profitability in challenging...
TRANSCRIPT
Slide 1© ABB
Ulrich Spiesshofer, CEO; Eric Elzvik, CFO, February 3rd, 2016
Increased profitability in challenging marketsABB 2015 Q4 and full-year results

Slide 2© ABB
Important notices
This presentation includes forward-looking information and statements including statements concerning the outlook for ourbusinesses. These statements are based on current expectations, estimates and projections about the factors that may affectour future performance, including global economic conditions, and the economic conditions of the regions and industries thatare major markets for ABB Ltd. These expectations, estimates and projections are generally identifiable by statementscontaining words such as “expects,” “believes,” “estimates,” “targets,” “plans,” “outlook” or similar expressions.
There are numerous risks and uncertainties, many of which are beyond our control, that could cause our actual results todiffer materially from the forward-looking information and statements made in this presentation and which could affect ourability to achieve any or all of our stated targets. The important factors that could cause such differences include, amongothers:
business risks associated with the volatile global economic environment and political conditions costs associated with compliance activities raw materials availability and prices market acceptance of new products and services changes in governmental regulations and currency exchange rates, and, such other factors as may be discussed from time to time in ABB Ltd’s filings with the U.S. Securities and Exchange
Commission, including its Annual Reports on Form 20-F.
Although ABB Ltd believes that its expectations reflected in any such forward-looking statement are based upon reasonableassumptions, it can give no assurance that those expectations will be achieved.
This presentation contains non-GAAP measures of performance. Definitions of these measures and reconciliations between these measures and their US GAAP counterparts can be found in the ‘Supplemental reconciliations and definitions’ section of “Financial Information” under “Financial results & presentations” – “Quarterly results & annual reports” on our website at www.abb.com/investorrelations
February 5, 2016

Slide 3© ABB
Q4 2015 – Next Level Strategy delivering positive results
1Changes in orders, revenues and order backlog are on a comparable basis; 2PIE: Penetration, Innovation, Expansion; 3Constant currencyFebruary 5, 2016
Progress in all three focus areas
Orders and revenues stable1; base orders -6%PIE2 showing positive results mitigating market headwinds; order backlog +5% Market oriented divisional realignment completeStrategic portfolio review of Power Grids on track
Business-led Collaboration
Relentless Execution
Profitable Growth
Op. EBITA margin up 60 bps. to 11.7%Power Systems entered target margin corridor, op. EBITA margin 7.5% Accelerated productivity and cost out measures in white collar, supply chain and op. excellence Cash flow from operating activities up 18%3; cash return on invested capital up 70 bps. to 13.4%
Streamlined and simplified organization in place Leadership appointed; nomination of 4 new Board MembersCollaborative sales platform, salesforce.com, operational in 40 countriesNext Level account management defined and implemented
Slide 4© ABB
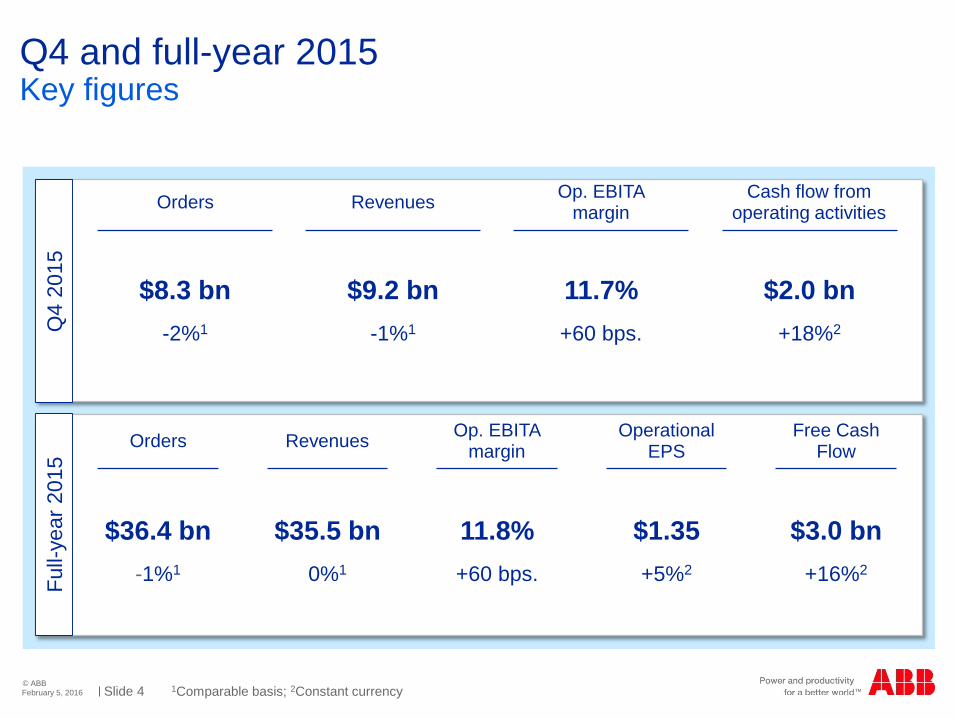
Q4 and full-year 2015
1Comparable basis; Constant currency2February 5, 2016
Key figuresFu
ll-ye
ar 2
015
Orders Revenues Op. EBITA margin
Operational EPS
Free Cash Flow
$36.4 bn-1%1
$35.5 bn0%1
11.8%+60 bps.
$1.35+5%2
$3.0 bn+16%2
Q4
2015
Orders Revenues Op. EBITA margin
Cash flow from operating activities
$8.3 bn-2%1
$9.2 bn-1%1
11.7%+60 bps.
$2.0 bn+18%2

Slide 5© ABBFebruary 5, 2016
Steady revenues, solid execution, margin accretion, strong cash
Target Result 2015 Comments
Revenue growth1 3-6% 0%Growth momentum in key
segments tainted by market headwinds
Operational EBITA %2 11-16% 11.8% 60 bps. accretion; solid execution
Operational EPS CAGR3 10-15% 5% Execution strength tainted
by market headwinds
FCF conversion to net income >90% 156% Solid results, new cash
culture well underway
CROI %4 Mid-teens 13.4% 70 bps. accretion
1Average annual revenue growth on a like-for-like basis over 6 years, base year 2014; 2Target is on a full-year basis; 3CAGR = Compound annual growth rate, base year is 2014 and assuming constant exchange rates; 4Temporary reduction possible in the event of larger acquisitions
Full-year 2015 versus targets 2020
Slide 6© ABB
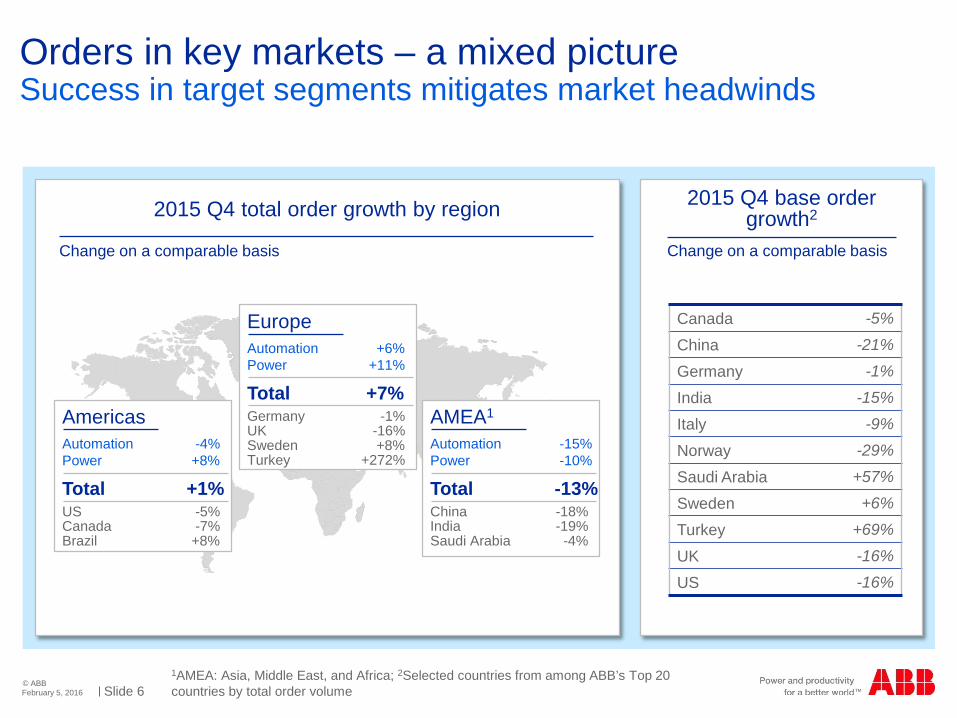
Orders in key markets – a mixed picture
February 5, 2016
Success in target segments mitigates market headwinds
2015 Q4 total order growth by region
Canada -5%
China -21%
Germany -1%
India -15%
Italy -9%
Norway -29%
Saudi Arabia +57%
Sweden +6%
Turkey +69%
UK -16%
US -16%
Change on a comparable basis
AmericasAutomation -4%Power +8%
Total +1%US -5%Canada -7%Brazil +8%
EuropeAutomation +6%Power +11%
Total +7%Germany -1%UK -16%Sweden +8%Turkey +272%
AMEA1
Automation -15%Power -10%
Total -13%China -18%India -19%Saudi Arabia -4%
2015 Q4 base order growth2
Change on a comparable basis
Middle Africa; 2Selected countries from among ABB’s Top 20 countries by total order volume1AMEA: Asia, East, and
Slide 7© ABB
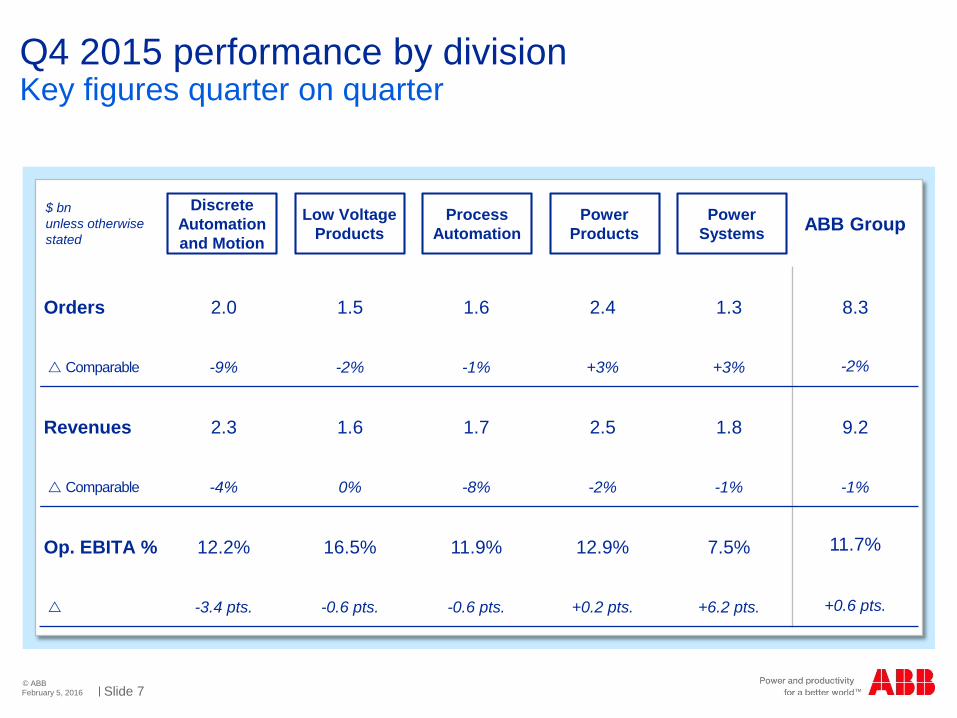
Q4 2015 performance by division
February 5, 2016
Key figures quarter on quarter
Orders 2.0 1.5 1.6 2.4 1.3 8.3
Comparable -9% -2% -1% +3% +3% -2%
Revenues 2.3 1.6 1.7 2.5 1.8 9.2
Comparable -4% 0% -8% -2% -1% -1%
Op. EBITA % 12.2% 16.5% 11.9% 12.9% 7.5% 11.7%
-3.4 pts. -0.6 pts. -0.6 pts. +0.2 pts. +6.2 pts. +0.6 pts.
Discrete Automation and Motion
Low Voltage Products
Process Automation
Power Products
Power Systems ABB Group
$ bnunless otherwise stated
Slide 8© ABB
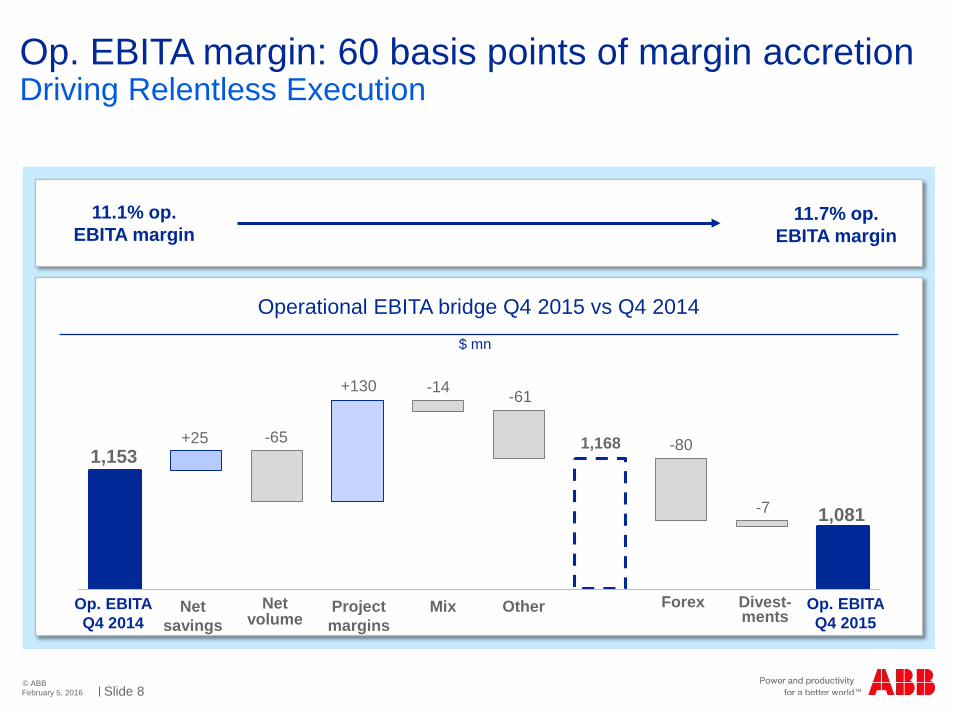
Op. EBITA margin: 60 basis points of margin accretion
February 5, 2016
Driving Relentless Execution
11.1% op. EBITA margin
11.7% op. EBITA margin
Net savings
Net volume
OtherProject margins
Mix ForexOp. EBITAQ4 2014
Op. EBITAQ4 2015
1,081
-65 -80
+130-61
+251,153
-14
1,168
-7
Divest-ments
Operational EBITA bridge Q4 2015 vs Q4 2014$ mn
Slide 9© ABB
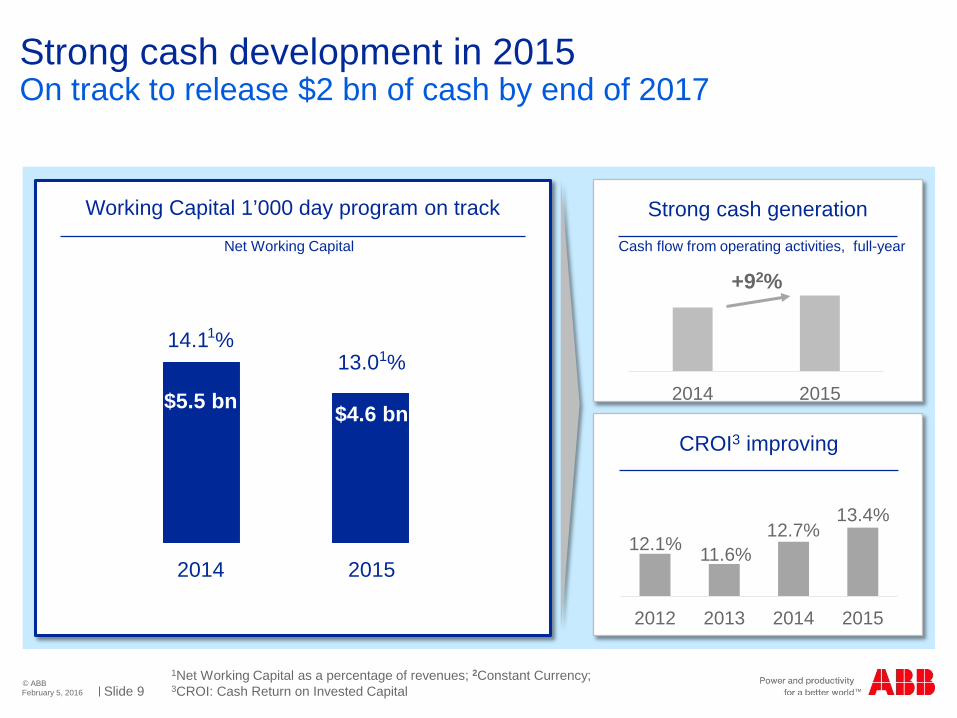
Strong cash development in 2015
February 5, 2016
On track to release $2 bn of cash by end of 2017
Net Working Capital
Working Capital 1’000 day program on track
1Net Working Capital as a percentage of revenues; Constant Currency; 2
3CROI: Cash Return on Invested Capital
$5.5 bn $4.6 bn
14.11% 13.01%
2014 2015
Cash flow from operating activities, full-year
Strong cash generation
CROI3 improving
+92%
2014 2015
2012 2013 2014 2015
12.1%12.7%
13.4%
11.6%
Slide 10© ABB
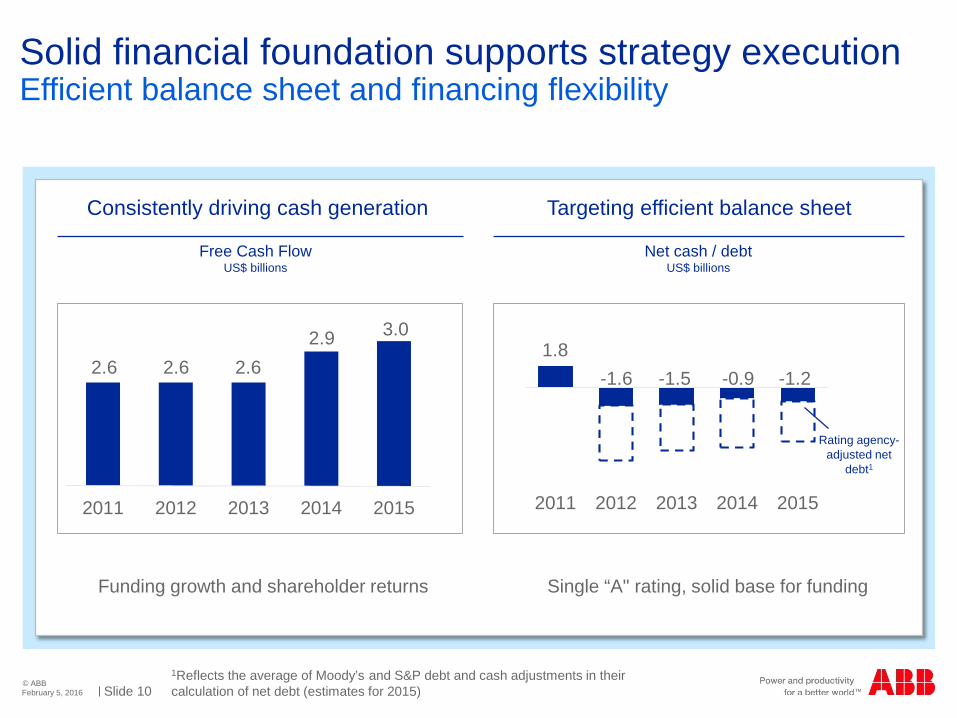
Solid financial foundation supports strategy execution
February 5, 2016
Efficient balance sheet and financing flexibility
Funding growth and shareholder returns Single “A" rating, solid base for funding
2011 2012 2013 2014 2015
Net cash / debtUS$ billions
Free Cash FlowUS$ billions
Rating agency-adjusted net
debt1
1.8
Consistently driving cash generation Targeting efficient balance sheet
2011 2012 2013 2014 2015
2.6 2.6 2.62.9 3.0
-1.6 -1.5 -0.9 -1.2
1Reflects the average of Moody’s and S&P debt and cash adjustments in their calculation of net debt (estimates for 2015)
Slide 11© ABB
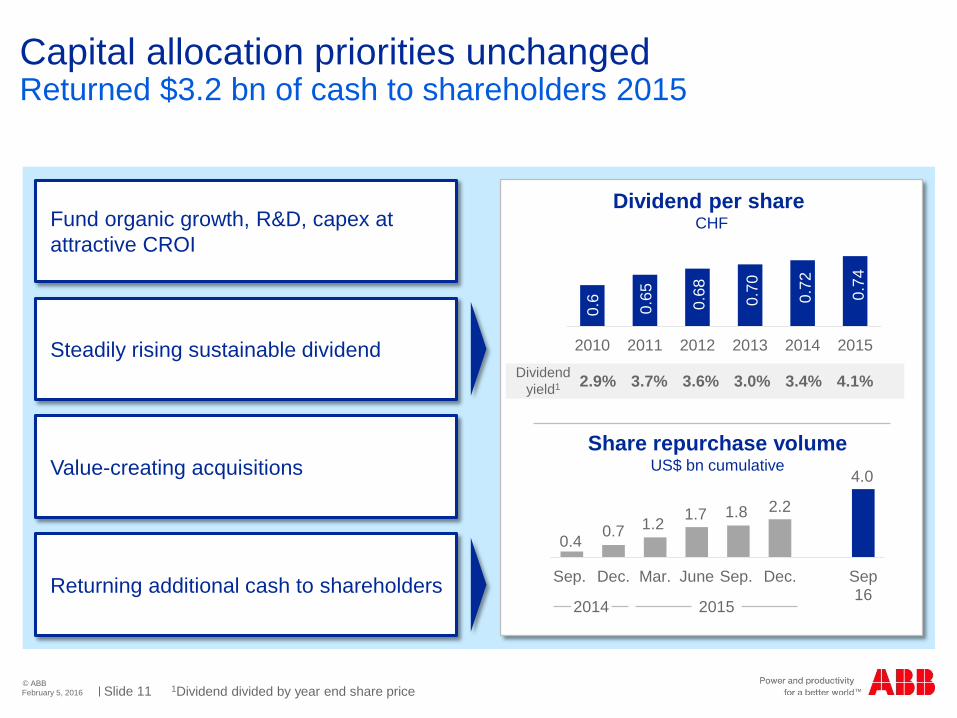
Capital allocation priorities unchanged
February 5, 2016
Returned $3.2 bn of cash to shareholders 2015
Fund organic growth, R&D, capex at attractive CROI
Steadily rising sustainable dividend
Value-creating acquisitions
Returning additional cash to shareholders
Dividend per share CHF
Sep. Dec. Mar. June Sep. Dec. Sep16
Share repurchase volumeUS$ bn cumulative
1Dividend divided by year end share price
2015
Dividend yield1
2014
0.41.2
2.21.7 1.80.7
4.0
3.7% 3.6% 3.0% 3.4% 4.1%2.9%
2010 2011 2012 2013 2014 2015
0.74
0.72
0.70
0.68
0.65
0.6
Slide 12© ABB
Profitable Growth
Relentless Execution
Business-led
Collabo-ration
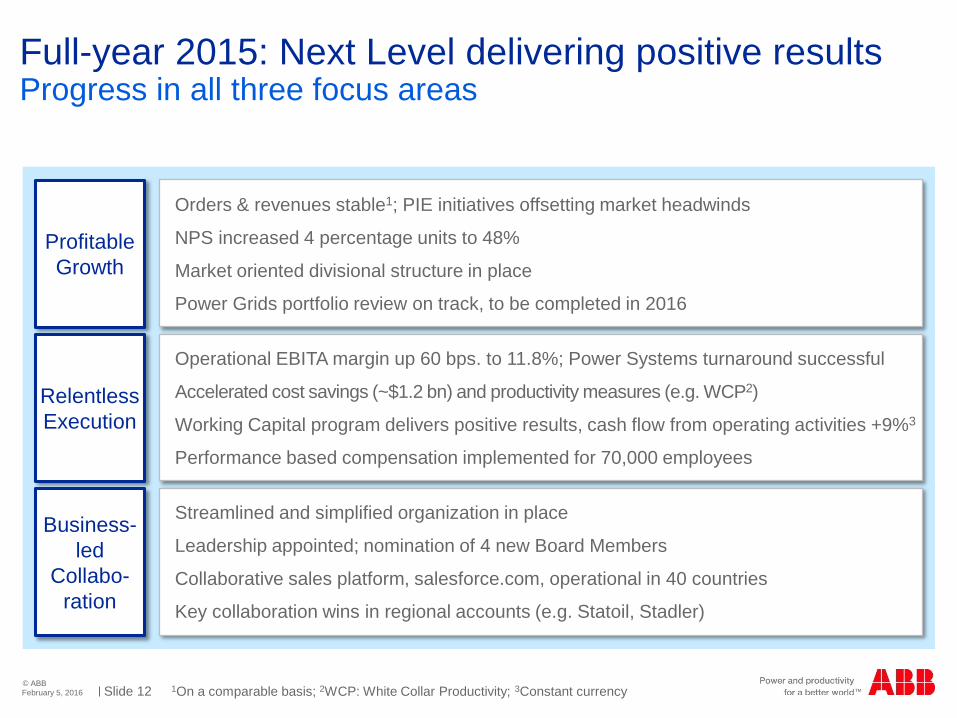
Full-year 2015: Next Level delivering positive results
February 5, 2016
Progress in all three focus areas
1On a comparable basis; 2WCP: White Collar Productivity; 3Constant currency
Streamlined and simplified organization in place
Leadership appointed; nomination of 4 new Board Members
Collaborative sales platform, salesforce.com, operational in 40 countries
Key collaboration wins in regional accounts (e.g. Statoil, Stadler)
Orders & revenues stable1; PIE initiatives offsetting market headwinds
NPS increased 4 percentage units to 48%
Market oriented divisional structure in place
Power Grids portfolio review on track, to be completed in 2016
Operational EBITA margin up 60 bps. to 11.8%; Power Systems turnaround successful
Accelerated cost savings (~$1.2 bn) and productivity measures (e.g. WCP2)
Working Capital program delivers positive results, cash flow from operating activities +9%3
Performance based compensation implemented for 70,000 employees
Slide 13© ABB
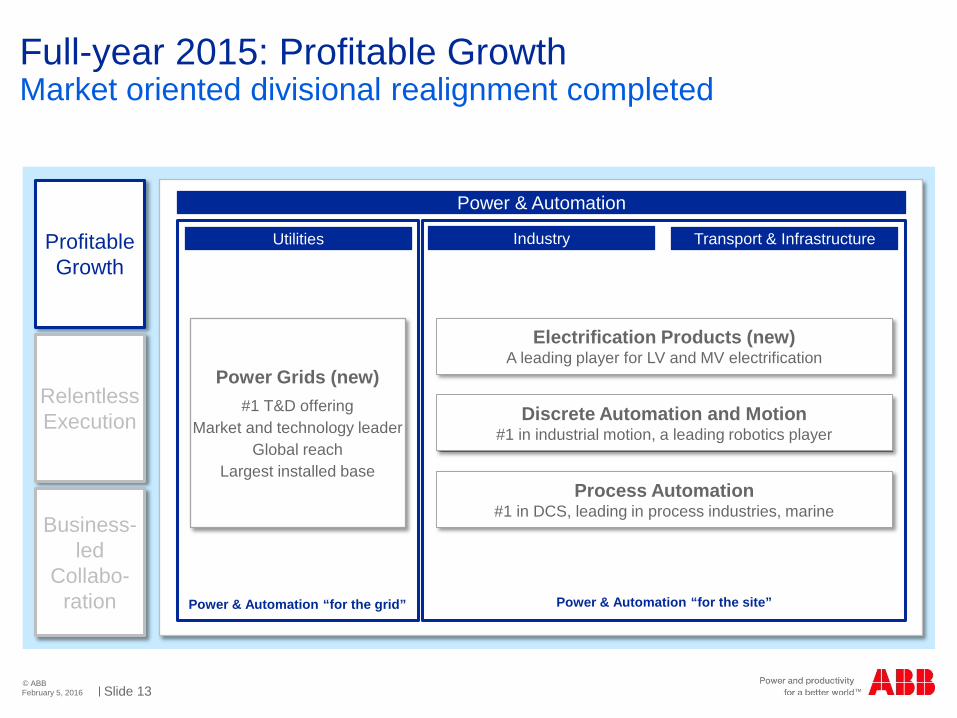
Full-year 2015: Profitable Growth
February 5, 2016
Market oriented divisional realignment completed
Profitable Growth
Relentless Execution
Business-led
Collabo-ration
Power & Automation
Utilities Transport & InfrastructureIndustry
Power & Automation “for the site”Power & Automation “for the grid”
Electrification Products (new)A leading player for LV and MV electrification
Discrete Automation and Motion#1 in industrial motion, a leading robotics player
Process Automation#1 in DCS, leading in process industries, marine
Power Grids (new)#1 T&D offering
Market and technology leaderGlobal reach
Largest installed base
Slide 14© ABB
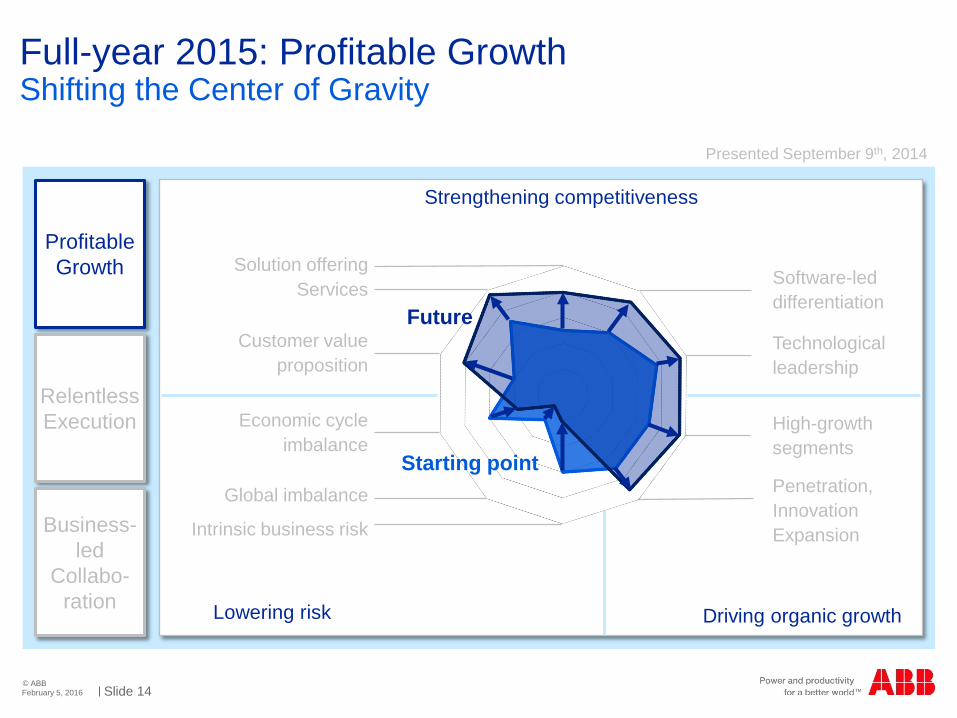
Full-year 2015: Profitable Growth
February 5, 2016
Shifting the Center of Gravity
Lowering risk
Strengthening competitiveness
Driving organic growth
Software-led differentiation
Penetration, Innovation Expansion
Technological leadership
High-growth segments
Intrinsic business risk
Solution offeringServices
Customer value proposition
Global imbalance
Economic cycle imbalance
Future
Starting point
Presented September 9th, 2014
Profitable Growth
Relentless Execution
Business-led
Collabo-ration
Slide 15© ABB
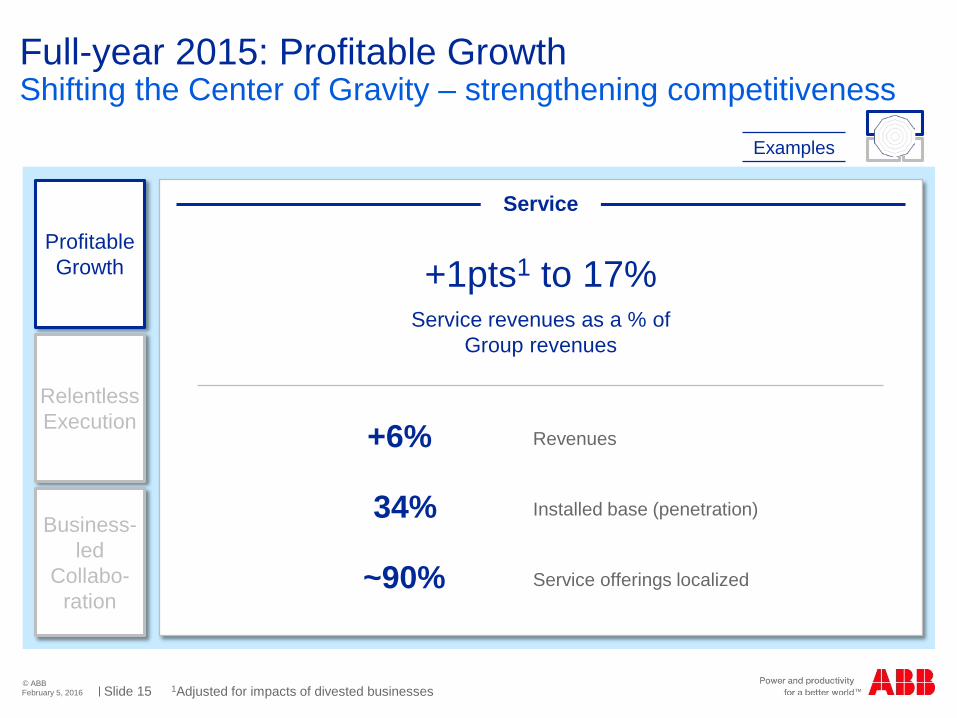
Full-year 2015: Profitable Growth
Service revenues as a % of Group revenues
February 5, 2016
Shifting the Center of Gravity – strengthening competitiveness
Examples
Profitable Growth
Relentless Execution
Business-led
Collabo-ration
+1pts1 to 17%
Revenues
Installed base (penetration)34%
Service offerings localized~90%
+6%
Service
1Adjusted for impacts of divested businesses

Slide 16© ABB
Full-year 2015: Profitable Growth
February 5, 2016
Shifting the Center of Gravity – strengthening competitiveness
Profitable Growth
Relentless Execution
Business-led
Collabo-ration
Examples
Technology leadershipKey innovations
Sustainable grid infrastructure
Eco-efficient switchgear
Industry 4.0, IoTSP1
YuMi®
Sustainable transportFast charging robot for public buses
Util
ities
Indu
stry
Tran
spor
t &
Infr
astr
uctu
re
1IoTSP: Internet of Things, Services and People
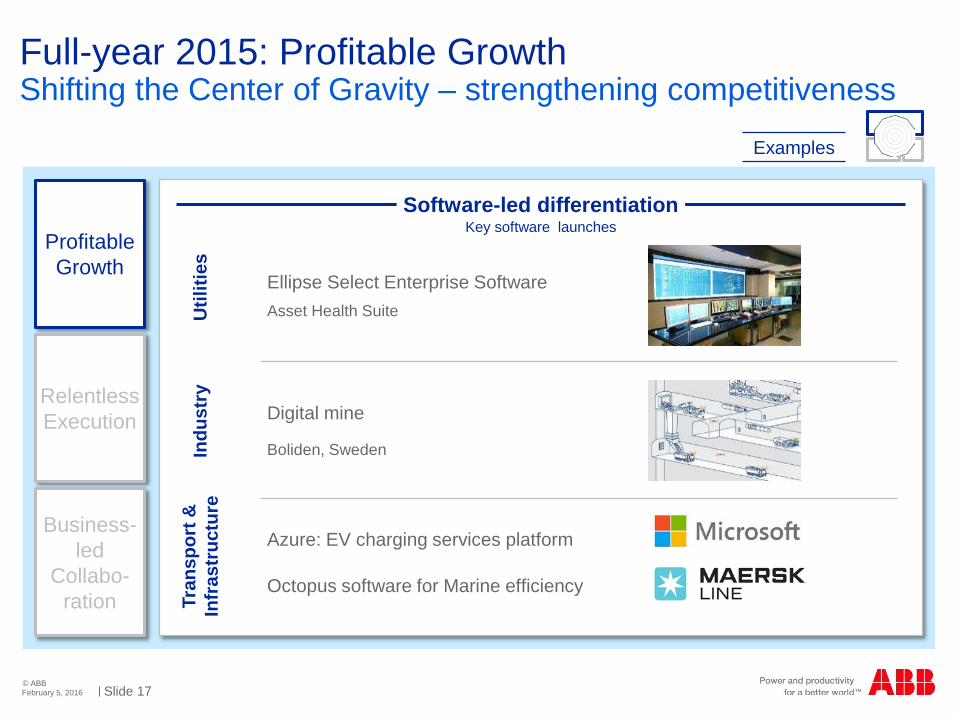
Slide 17© ABB
Full-year 2015: Profitable Growth
February 5, 2016
Shifting the Center of Gravity – strengthening competitiveness
Profitable Growth
Relentless Execution
Business-led
Collabo-ration
Ellipse Select Enterprise Software Asset Health Suite
Digital mine
Boliden, Sweden
Azure: EV charging services platform
Octopus software for Marine efficiency
Examples
Software-led differentiationKey software launches
Util
ities
Indu
stry
Tran
spor
t &
Infr
astr
uctu
re
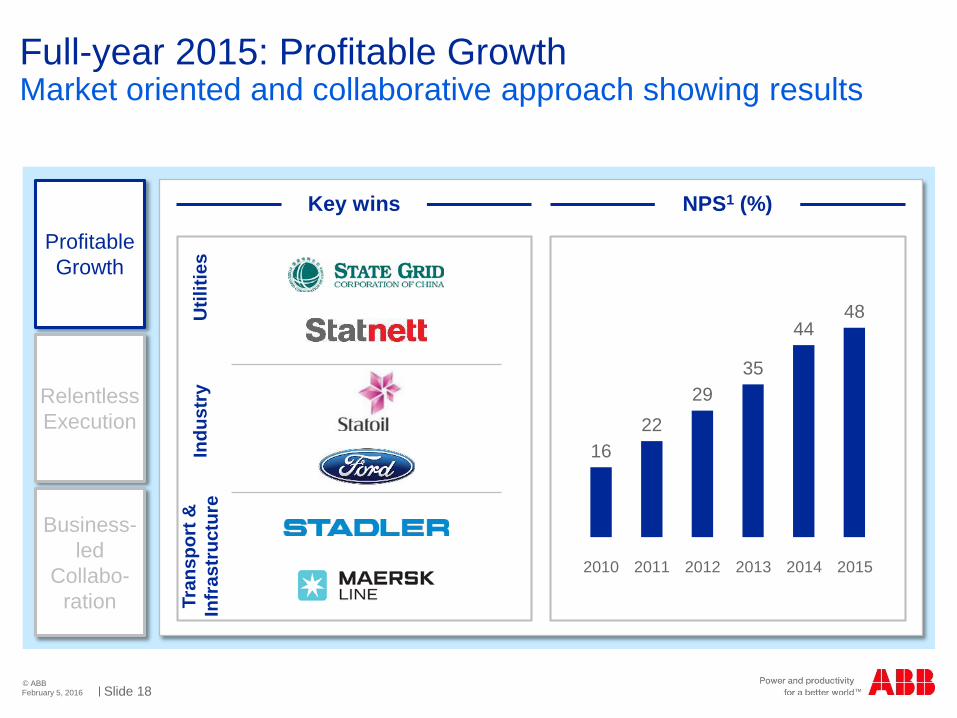
Slide 18© ABB
Full-year 2015: Profitable Growth
February 5, 2016
Market oriented and collaborative approach showing results
Profitable Growth
Relentless Execution
Business-led
Collabo-ration
Key wins
1622
2935
4448
2010 2011 2012 2013 2014 2015
NPS1 (%)U
tiliti
esIn
dust
ryTr
ansp
ort &
In
fras
truc
ture

Slide 19© ABB
Full-year 2015: Relentless Execution
February 5, 2016
Power Systems entered target margin corridor in Q4
Illustrative
Profitable Growth
Relentless Execution
Business-led
Collabo-ration
-97
Status offshore wind connections: 2 connections handed over, 1 in energization phase
Exit of solar EPC completed Business model transformation; de-risking on trackHitachi HVDC joint venture in operation
Q1 Q2 Q3 Q4 Q1 Q2 Q3 Q42014 2015
- $ 96 mn
$ 274 mn
7%
11%Target
Op. EBITA %
Actions completed in 2015
FY 2014 FY 2015

Slide 20© ABB
Full-year 2015: Relentless Execution
February 5, 2016
7th consecutive year more than $1 billion in cost savings
Profitable Growth
Relentless Execution
Business-led
Collabo-ration
Accelerated cost savings; 2015 savings ~5% of cost of sales
1.1 1.1 1.1 1.21.2
2011 2012 2014 20152013
Supply chainOperational excellence
Regular cost savings (3-5% of cost of sales p.a. )
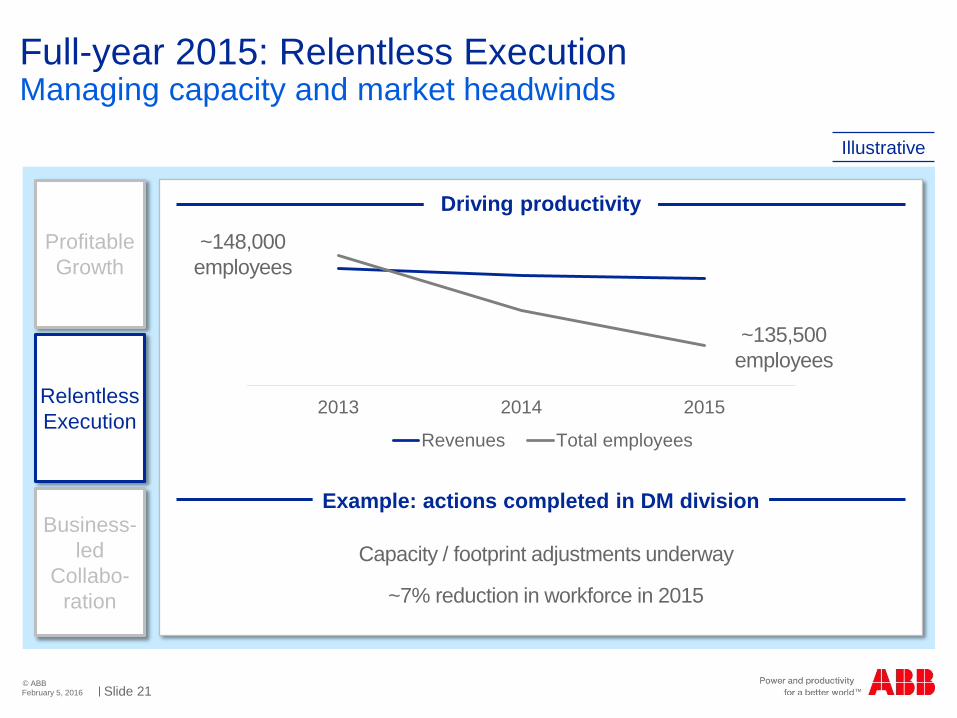
Slide 21© ABB
Full-year 2015: Relentless Execution
February 5, 2016
Managing capacity and market headwinds
Illustrative
Profitable Growth
Relentless Execution
Business-led
Collabo-ration
Capacity / footprint adjustments underway
~7% reduction in workforce in 2015
Example: actions completed in DM division
130000
140000
150000
25
30
35
40
45
2013 2014 2015
Revenues Total employees
Driving productivity
~148,000 employees
~135,500 employees

Slide 22© ABB
Lean business functions
Decentralized, subscale
Centers of excellence with critical mass
Global shares services
68 country based shared services
2 global (India, Poland)4 regional
Market-oriented complexity reduction
5 divisions23 BUs125 product groups
20 % reduction of global / local units
February 5, 2016
White Collar Productivity – well on track for $1 bn1 cost savingsFull-year 2015: Relentless Execution
Profitable Growth
Relentless Execution
Business-led
Collabo-ration On track to achieve >$400 mn gross savings 2016
From To
1Run-rate at end of 2017
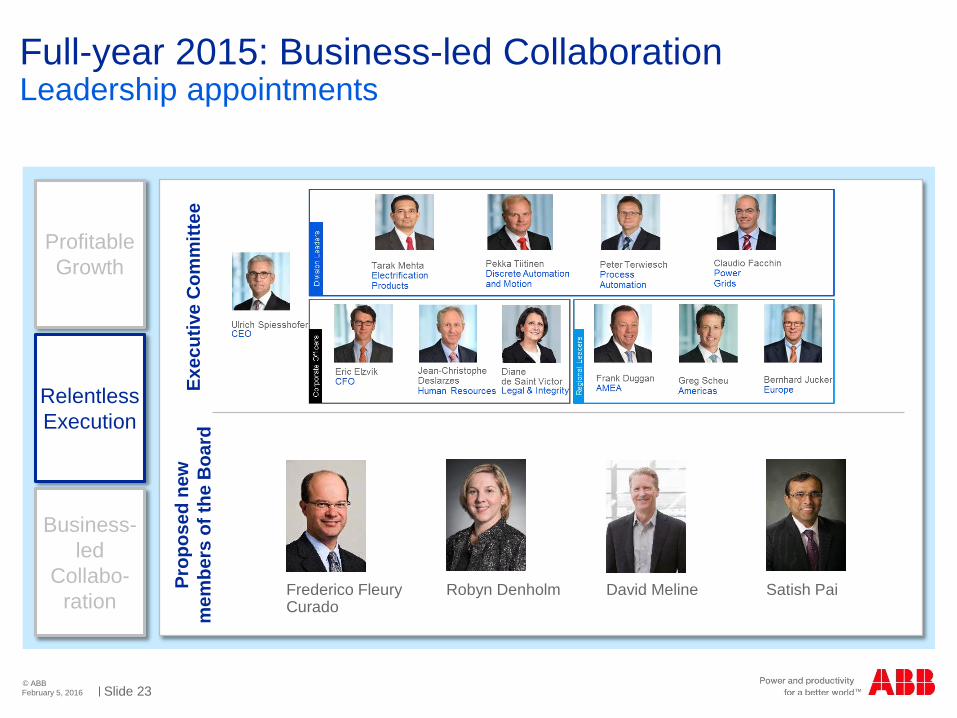
Slide 23© ABB
Full-year 2015: Business-led Collaboration
February 5, 2016
Leadership appointments
Profitable Growth
Relentless Execution
Business-led
Collabo-ration
Exec
utiv
e C
omm
ittee
Prop
osed
new
m
embe
rs o
f the
Boa
rd
Satish PaiRobyn Denholm David MelineFrederico Fleury Curado

Slide 24© ABB
2016 market outlook
February 5, 2016
Challenging environment
Utilities Transport & InfrastructureIndustry
Power & Automation
Globally
Fewer coal capacity additions from historical high, gas stable (smaller ABB exposure)
O&G remains difficult with further investment cuts
Solar and Wind continue growth at mid-to-high single-digital rate
Mining and other process industries to decline on global overcapacity and lowered demand
Construction holding up well, driven by residential and commercial
Continued growth in T&D, positive fundamental drivers intact
Discrete industries1 grow moderately after several high-growth years
Transportation mixed with growing rail but difficult Marine environment
Asia, Middle East, Africa Americas Europe
1Incl. automotive, F&B, machinery
Slide 25© ABB
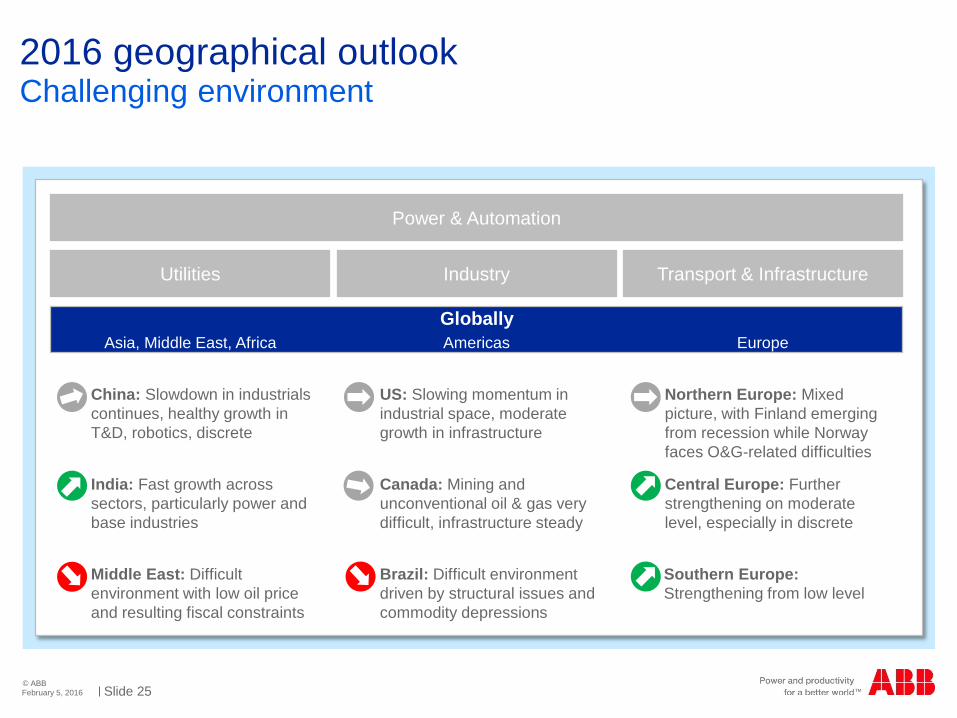
2016 geographical outlook
February 5, 2016
Challenging environment
India: Fast growth across sectors, particularly power and base industries
Canada: Mining and unconventional oil & gas very difficult, infrastructure steady
Central Europe: Further strengthening on moderate level, especially in discrete
China: Slowdown in industrials continues, healthy growth in T&D, robotics, discrete
US: Slowing momentum in industrial space, moderate growth in infrastructure
Northern Europe: Mixed picture, with Finland emerging from recession while Norway faces O&G-related difficulties
Middle East: Difficult environment with low oil price and resulting fiscal constraints
Brazil: Difficult environment driven by structural issues and commodity depressions
Southern Europe: Strengthening from low level
Utilities Transport & InfrastructureIndustry
Power & Automation
GloballyAsia, Middle East, Africa Americas Europe

Slide 26© ABB
2016 Priorities
February 5, 2016
Next Level Strategy in action
Profitable Growth
Relentless Execution
Business-led
Collabo-ration
Tap “growth collaboration” opportunities in countries and accounts
Drive momentum with newly shaped organization and leadership team
Ramp up shared services
Drive organic growth through PIE, expand technology leadership
Realize benefits from divisional realignment; conclude Power Grids strategic portfolio review
Deliver value from partnerships
Ready for disciplined inorganic moves
Continue cost savings program of 3-5% cost of sales
Deliver >$400 mn savings from White Collar Productivity
Accelerate Working Capital reduction towards 2017 target of $2 bn

Slide 27© ABB
ABB Next Level
February 5, 2016
Next Level Strategy: accelerating sustainable value creation
Strong balance sheet; committed to attractive returns to shareholders
Pioneering technology leader with strong positions in attractive markets
Clear transformation agenda driving EPS and CROI
Slide 29© ABB
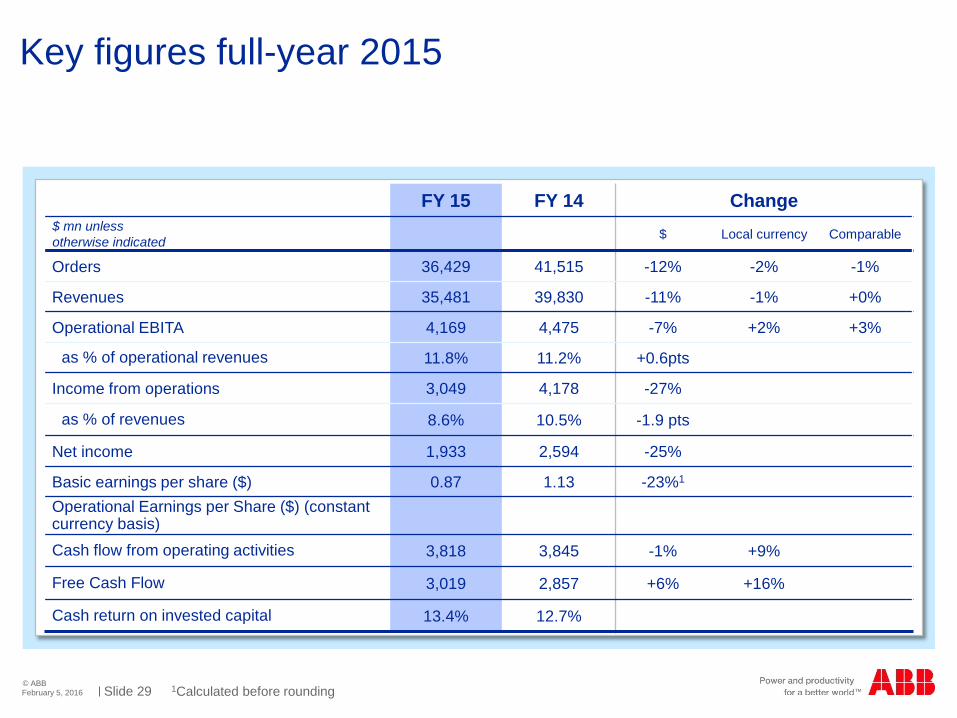
Key figures full-year 2015
1Calculated before roundingFebruary 5, 2016
FY 15 FY 14 Change$ mn unless otherwise indicated $ Local currency Comparable
Orders 36,429 41,515 -12% -2% -1%
Revenues 35,481 39,830 -11% -1% +0%
Operational EBITA 4,169 4,475 -7% +2% +3%
as % of operational revenues 11.8% 11.2% +0.6pts
Income from operations 3,049 4,178 -27%
as % of revenues 8.6% 10.5% -1.9 pts
Net income 1,933 2,594 -25%
Basic earnings per share ($) 0.87 1.13 -23%1
Operational Earnings per Share ($) (constant currency basis) Cash flow from operating activities 3,818 3,845 -1% +9%
Free Cash Flow 3,019 2,857 +6% +16%
Cash return on invested capital 13.4% 12.7%
Slide 30© ABB
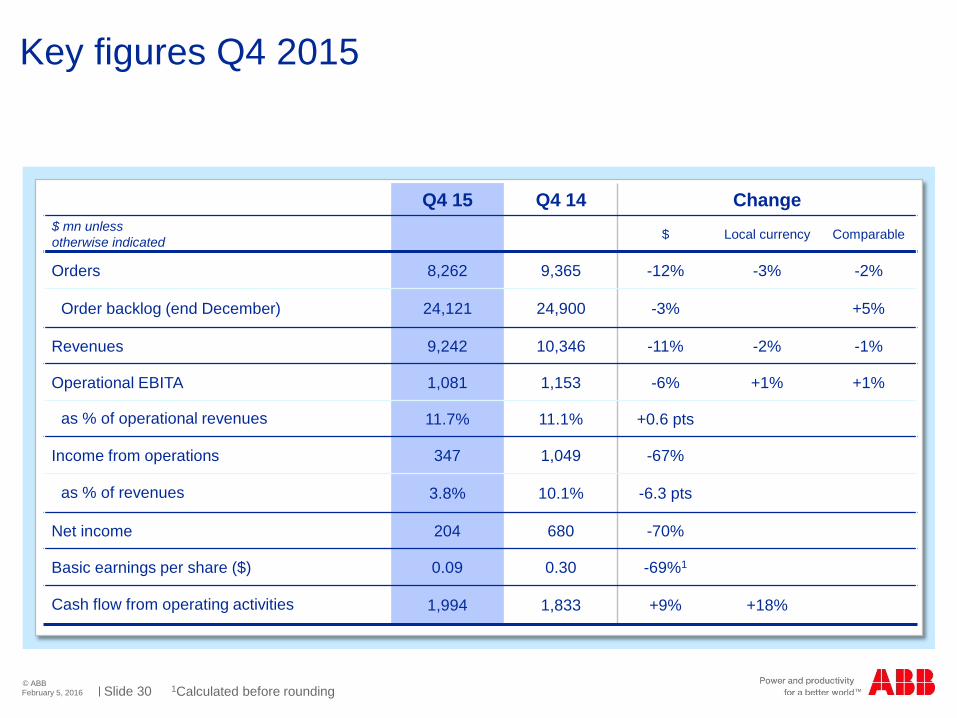
Key figures Q4 2015
1Calculated before roundingFebruary 5, 2016
Q4 15 Q4 14 Change$ mn unless otherwise indicated $ Local currency Comparable
Orders 8,262 9,365 -12% -3% -2%
Order backlog (end December) 24,121 24,900 -3% +5%
Revenues 9,242 10,346 -11% -2% -1%
Operational EBITA 1,081 1,153 -6% +1% +1%
as % of operational revenues 11.7% 11.1% +0.6 pts
Income from operations 347 1,049 -67%
as % of revenues 3.8% 10.1% -6.3 pts
Net income 204 680 -70%
Basic earnings per share ($) 0.09 0.30 -69%1
Cash flow from operating activities 1,994 1,833 +9% +18%

Slide 31© ABB
Order backlog by division
February 5, 2016
Q4 2015 Q4 2014 Change %Order backlog (end December)$ mn $ Comparable
Discrete Automation and Motion 4,232 4,385 -3% +3%
Low Voltage Products 857 891 -4% +6%
Process Automation 5,203 5,661 -8% +3%
Power Products 7,717 7,791 -1% +7%
Power Systems 8,218 8,246 -0% +8%
Consolidation and Other(incl. Inter-division eliminations) (2,106) (2,074)
Total Group 24,121 24,900 -3% +5%

Slide 32© ABB
Cash flow from operating activities by division
February 5, 2016
Q4 2015 Change % FY 2015 Change %Cash flow from operating activities$ mn Constant currency Constant currency
Discrete Automation and Motion 328 -25% 1,232 -13%
Low Voltage Products 399 -1% 981 -9%
Process Automation 267 -25% 607 -29%
Power Products 659 +38% 1,174 +16%
Power Systems 426 +128% 458 n.a.
Consolidation and Other(incl. Inter-division eliminations) (85) (634)
Total Group 1,994 +18% 3,818 +9%
Slide 33© ABB
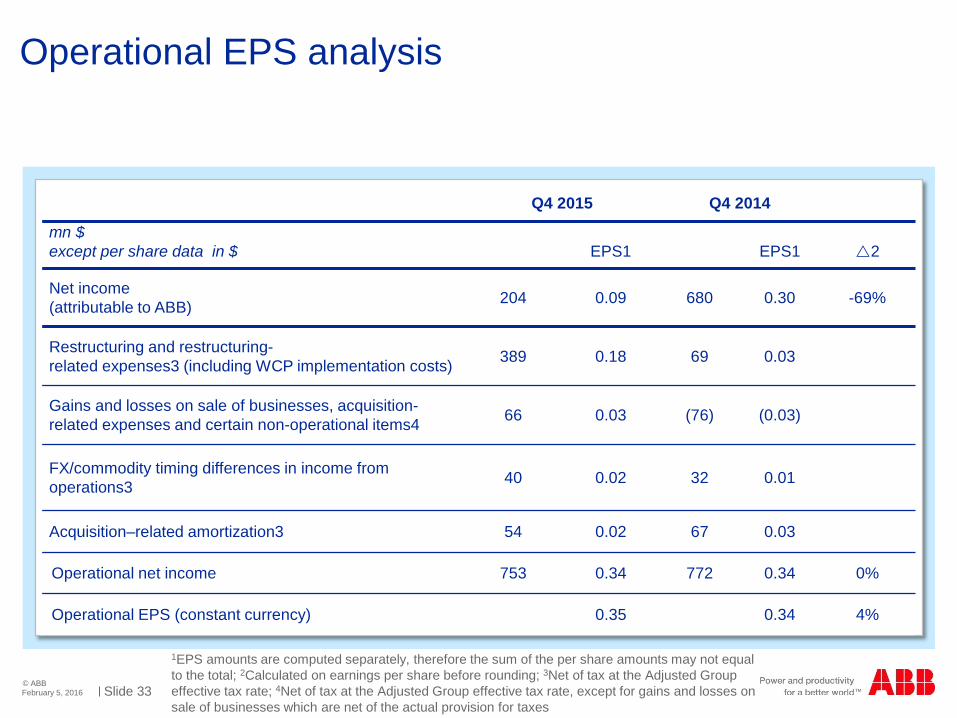
Operational EPS analysis
1EPS amounts are computed separately, therefore the sum of the per share amounts may not equal to the total; 2Calculated on earnings per share before rounding; 3Net of tax at the Adjusted Group effective tax rate; 4Net of tax at the Adjusted Group effective tax rate, except for gains and losses on sale of businesses which are net of the actual provision for taxes
February 5, 2016
Q4 2015 Q4 2014
mn $except per share data in $ EPS1 EPS1 2
Net income (attributable to ABB) 204 0.09 680 0.30 -69%
Restructuring and restructuring-related expenses3 (including WCP implementation costs) 389 0.18 69 0.03
Gains and losses on sale of businesses, acquisition-related expenses and certain non-operational items4 66 0.03 (76) (0.03)
FX/commodity timing differences in income from operations3 40 0.02 32 0.01
Acquisition–related amortization3 54 0.02 67 0.03
Operational net income 753 0.34 772 0.34 0%
Operational EPS (constant currency) 0.35 0.34 4%

Slide 34© ABB
Operational EPS analysis
1EPS amounts are computed separately, therefore the sum of the per share amounts may not equal to the total; 2Calculated on earnings per share before rounding; 3Net of tax at the Adjusted Group effective tax rate; 4Net of tax at the Adjusted Group effective tax rate, except for gains and losses on sale of businesses which are net of the actual provision for taxes
February 5, 2016
FY 2015 FY2014
mn $except per share data in $ EPS1 EPS1 2
Net income (attributable to ABB) 1,933 0.87 2,594 1.13 -23%
Restructuring and restructuring-related expenses3 (including WCP implementation costs) 492 0.22 171 0.07
Gains and losses on sale of businesses, acquisition-related expenses and certain non-operational items4 107 0.05 (221) (0.10)
FX/commodity timing differences in income from operations3 13 0.01 120 0.05
Acquisition–related amortization3 224 0.10 275 0.12
Operational net income 2,769 1.24 2,939 1.28 -3%
Operational EPS (constant currency) 1.35 1.28 5%

Slide 35© ABB
Q4 2015 Net Income development
February 5, 2016
Significant impact from restructuring and one off charges
Productivity and capacity measures impacted net income
Net income Q4 2014
Net Income Q4 2015
680
$ mn
Net Income reconciliation
204
Op. EBITA
Restructuring and
restructuring-related
expensesGains and
losses from sale of
businesses, acquisition related xx
FX/commodity timing
differences in income from operations
Acquisition-related
amortization
Finance net
Taxes Income from discontinued operations
and net income
attributable
-72-320
-142
-8 1342 25 -14
Slide 36© ABB
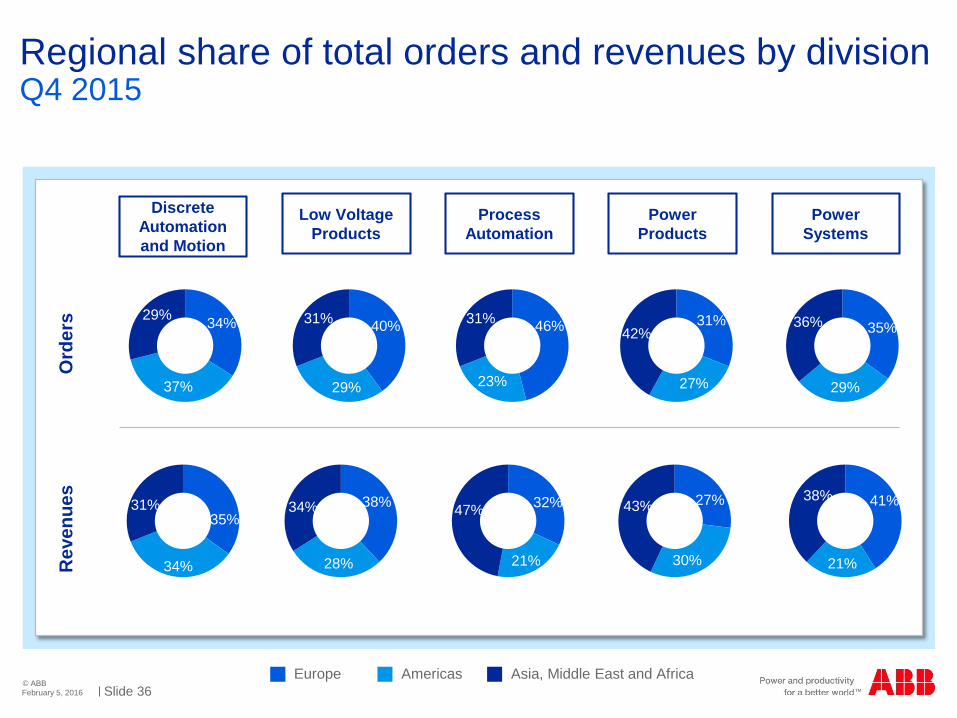
Regional share of total orders and revenues by division
February 5, 2016
Q4 2015
Discrete Automation and Motion
Low Voltage Products
Process Automation
Power Products
Power Systems
Ord
ers
Rev
enue
s
29% 34%
37%
31%35%
34%
31% 40%
29%
31% 46%
23%
42%31%
27%
35%
29%
36%
34% 38%
28%
47% 32%
21%
43% 27%
30%
38% 41%
21%
Europe Americas Asia, Middle East and Africa
Slide 37© ABB
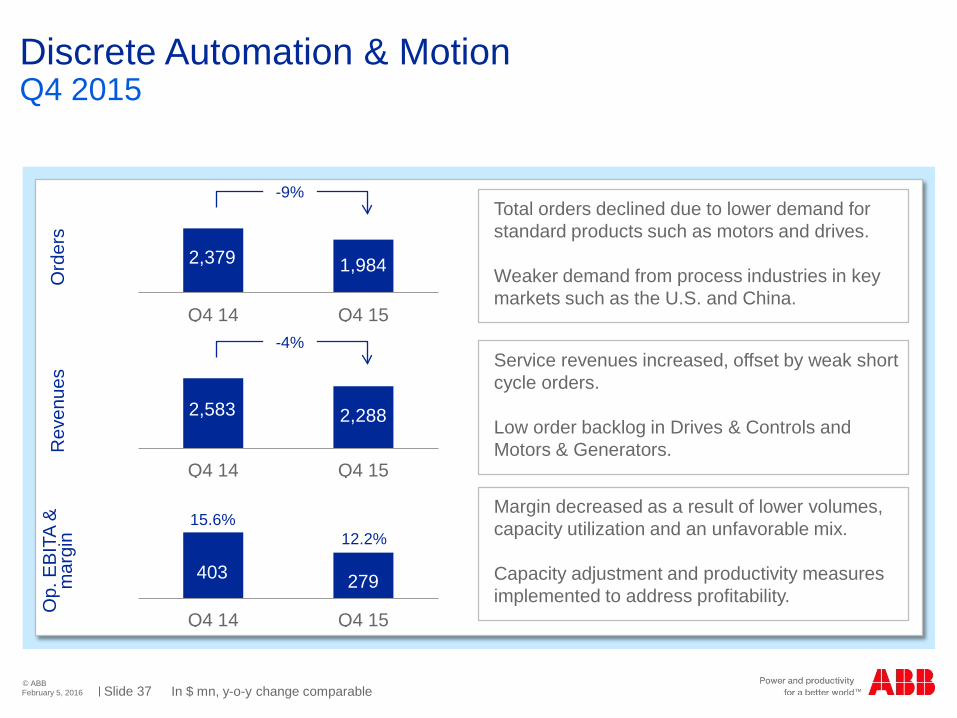
Discrete Automation & Motion
In $ mn, y-o-y change comparableFebruary 5, 2016
Q4 2015O
rder
sR
even
ues
Op.
EB
ITA
&
mar
gin
Q4 14 Q4 15
Q4 14 Q4 15
Q4 14 Q4 15
Total orders declined due to lower demand for standard products such as motors and drives.
Weaker demand from process industries in key markets such as the U.S. and China.
Service revenues increased, offset by weak short cycle orders.
Low order backlog in Drives & Controls and Motors & Generators.
Margin decreased as a result of lower volumes, capacity utilization and an unfavorable mix.
Capacity adjustment and productivity measures implemented to address profitability.
-9%
-4%
12.2%
2,379 1,984
2,583 2,288
403 279
15.6%

Slide 38© ABB
Low Voltage Products
In $ mn, y-o-y change comparableFebruary 5, 2016
Q4 2015O
rder
sR
even
ues
Op.
EB
ITA
&
mar
gin
Q4 14 Q4 15
Q4 14 Q4 15
Q4 14 Q4 15
Stable order development in Europe partially offset declines in AMEA and the Americas
Product orders were softer in China, the US and Canada
Revenues were steady in the quarter.
Margin impacted by mix partially compensated by increased cost savings and the strong focus on execution.
-2%
0%
16.5%
1,722 1,530
1,793 1,624
307 268
17.1%
Slide 39© ABB
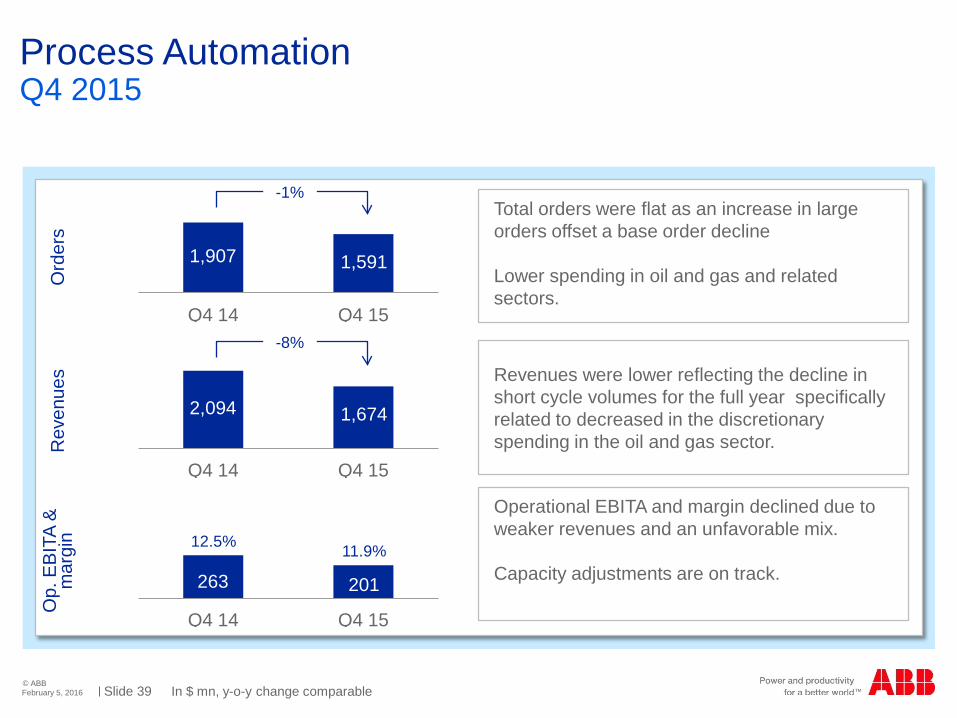
Process Automation
In $ mn, y-o-y change comparableFebruary 5, 2016
Q4 2015O
rder
sR
even
ues
Op.
EB
ITA
&
mar
gin
Q4 14 Q4 15
Q4 14 Q4 15
Q4 14 Q4 15
Total orders were flat as an increase in large orders offset a base order decline
Lower spending in oil and gas and related sectors.
Revenues were lower reflecting the decline in short cycle volumes for the full year specifically related to decreased in the discretionary spending in the oil and gas sector.
Operational EBITA and margin declined due to weaker revenues and an unfavorable mix.
Capacity adjustments are on track.
-1%
-8%
11.9%
1,907 1,591
2,094 1,674
263 201
12.5%

Slide 40© ABB
Power Products
In $ mn, y-o-y change comparableFebruary 5, 2016
Q4 2015O
rder
sR
even
ues
Op.
EB
ITA
&
mar
gin
Q4 14 Q4 15
Q4 14 Q4 15
Q4 14 Q4 15
Orders increased with selective transmission utility investments compensating the decline in industrial orders.
Revenues were lower mainly reflecting project milestones
Slower short cycle demand in key industrial markets like China and the US.
Operational EBITA margin improved as steady execution and cost savings offset the lower revenues.
+3%
-2%
12.9%
2,548 2,398
2,825 2,544
360 329
12.7%
Slide 41© ABB
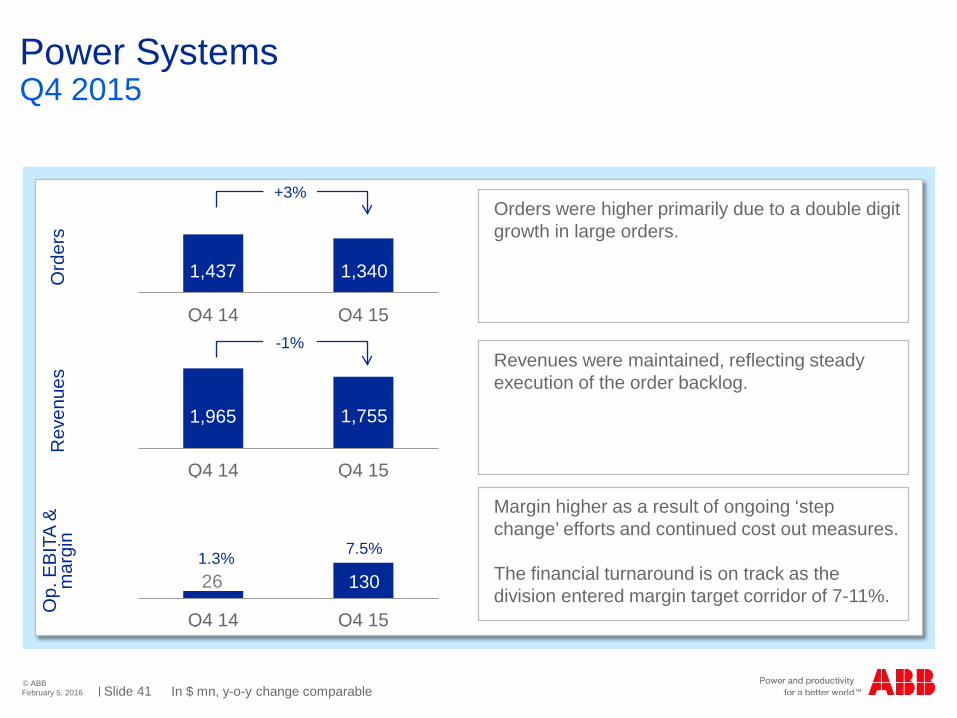
Power Systems
In $ mn, y-o-y change comparableFebruary 5, 2016
Q4 2015O
rder
sR
even
ues
Op.
EB
ITA
&
mar
gin
Q4 14 Q4 15
Q4 14 Q4 15
Q4 14 Q4 15
Orders were higher primarily due to a double digit growth in large orders.
Revenues were maintained, reflecting steady execution of the order backlog.
Margin higher as a result of ongoing ‘step change’ efforts and continued cost out measures.
The financial turnaround is on track as the division entered margin target corridor of 7-11%.
+3%
-1%
7.5%
1,437 1,340
1,965 1,755
26 1301.3%
Slide 42© ABB
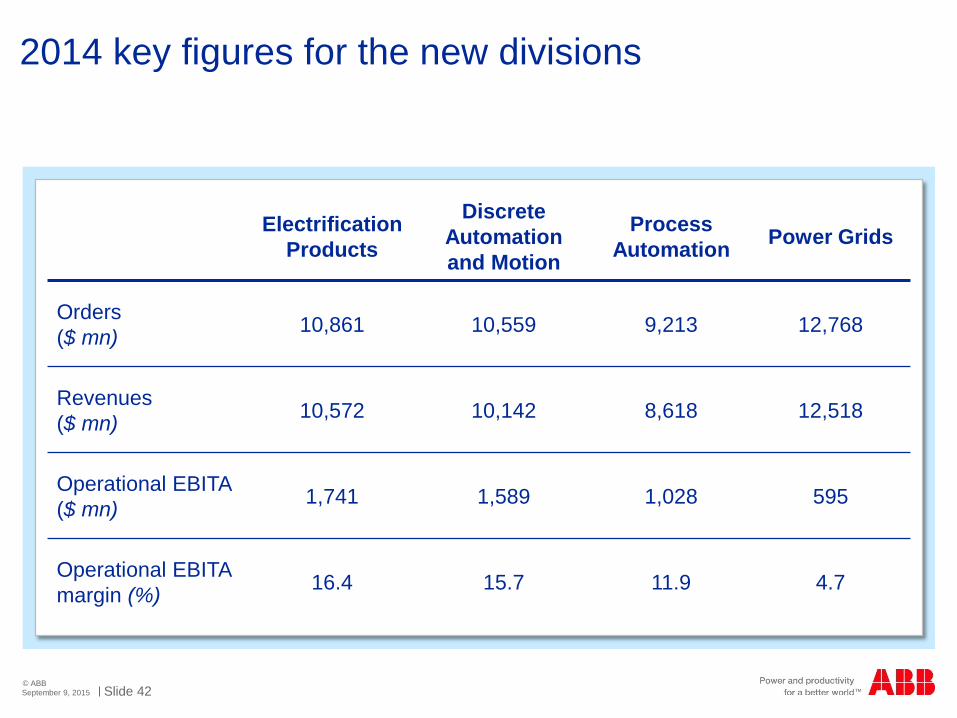
2014 key figures for the new divisions
September 9, 2015
ElectrificationProducts
Discrete Automation and Motion
Process Automation Power Grids
Orders($ mn) 10,861 10,559 9,213 12,768
Revenues($ mn) 10,572 10,142 8,618 12,518
Operational EBITA($ mn) 1,741 1,589 1,028 595
Operational EBITA margin (%) 16.4 15.7 11.9 4.7
Slide 43© ABB
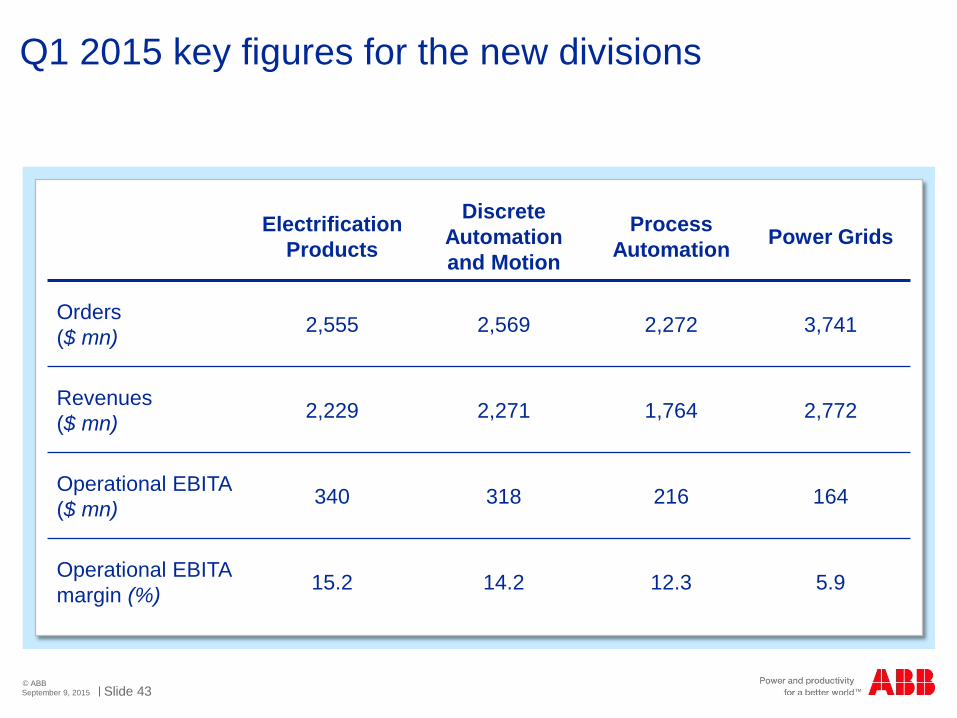
Q1 2015 key figures for the new divisions
September 9, 2015
ElectrificationProducts
Discrete Automation and Motion
Process Automation Power Grids
Orders($ mn) 2,555 2,569 2,272 3,741
Revenues($ mn) 2,229 2,271 1,764 2,772
Operational EBITA($ mn) 340 318 216 164
Operational EBITA margin (%) 15.2 14.2 12.3 5.9
Slide 44© ABB
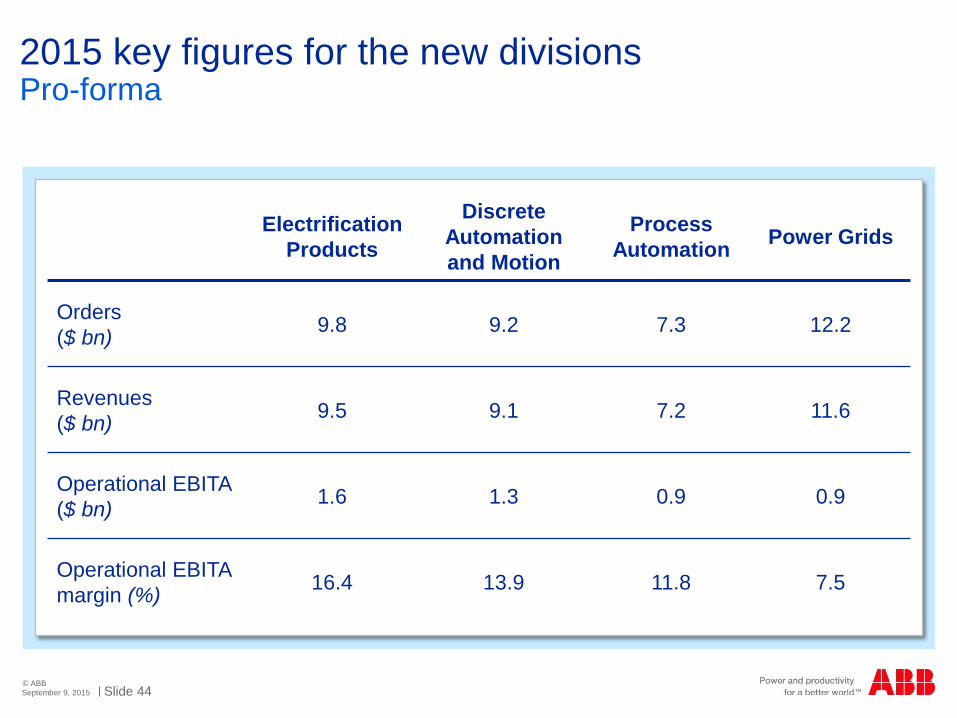
2015 key figures for the new divisions
September 9, 2015
Pro-forma
ElectrificationProducts
Discrete Automation and Motion
Process Automation Power Grids
Orders($ bn) 9.8 9.2 7.3 12.2
Revenues($ bn) 9.5 9.1 7.2 11.6
Operational EBITA($ bn) 1.6 1.3 0.9 0.9
Operational EBITA margin (%) 16.4 13.9 11.8 7.5
Slide 45© ABB
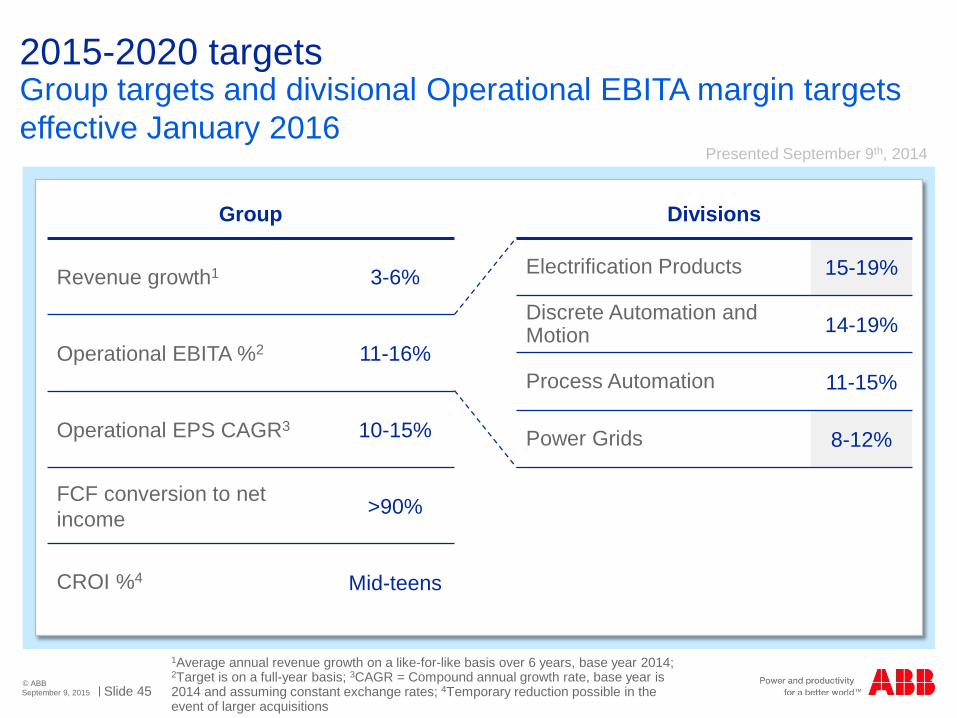
2015-2020 targets
September 9, 2015
Group targets and divisional Operational EBITA margin targets effective January 2016
Group
Revenue growth1 3-6%
Operational EBITA %2 11-16%
Operational EPS CAGR3 10-15%
FCF conversion to net income >90%
CROI %4 Mid-teens
Divisions
Electrification Products 15-19%
Discrete Automation and Motion 14-19%
Process Automation 11-15%
Power Grids 8-12%
1Average annual revenue growth on a like-for-like basis over 6 years, base year 2014;2Target is on a full-year basis; 3CAGR = Compound annual growth rate, base year is 2014 and assuming constant exchange rates; 4Temporary reduction possible in the event of larger acquisitions
Presented September 9th, 2014
Slide 46© ABB
More information available at ABB Investor Relations
February 5, 2016
Name Telephone E-Mail
Alanna AbrahamsonHead of Investor Relations +41 43 317 3804 [email protected]
Binit Sanghvi +41 43 317 3832 [email protected]
Beat Fueglistaller +41 43 317 4144 [email protected]
Annatina Tunkelo +41 43 317 3820 [email protected]
Ruth Jaeger +41 43 317 3808 [email protected]