ulementary inormation - nature · of bodipy fl-pip 3 (donor) in the presence of alexa-555-strep...
TRANSCRIPT
S U P P L E M E N TA RY I N F O R M AT I O N
WWW.NATURE.COM/NATURECELLBIOLOGY 1
DOI: 10.1038/ncb3473
© 2017 Macmillan Publishers Limited, part of Springer Nature. All rights reserved.
In the format provided by the authors and unedited.
Lin, et al, 2016 Supplementary Figure 1
b
Fo
ld C
ha
ng
e
0
10
20
30
40
50
LINC01
139
RP11
-433
A10
.1
SNHG6
XLO
C_0
0238
4
LINC00
607
RP5-
858B
6.3
SNHG9
RP11
-383
G10
.5
SNHG3
a
010203040
60708090
50
LINC01
139
RP11
-433
A10
.1
SNHG6
XLO
C_0
0238
4
LINC00
607
RP5-
858B
6.3
SNHG9
RP11
-383
G10
.5
SNHG3
Lip
id E
nrich
me
nt
Fa
cto
r (L
/T%
) Normal BT
TNBC
E
c
0
0.05
0.1
0.15
0.2
0.25
0.3
% o
f In
pu
t
Lipid-coatedBeads
CTL
PAPC
PE P
S
Ptd
Ins
PI(3
)P
PI(4
)P
PI(5
)P
PI(3
,4)P
2
PI(3
,5)P
2
PI(4
,5)P
2
PI(3
,4,5
)P3
Cer
amide
LBPA
Sph
ingo
mye
lin
Sph
ingo
sine
S1PLP
A
Car
diolipin
PEth
+RT-RT
Lipid-coated Beads Pull-down
RNA GAPDH
0
0.05
0.1
0.15
0.2
0.25
0.3
Lipid-coatedBeads
CTL
% o
f In
pu
t
PAPC
PE P
S
Ptd
Ins
PI(3
)P
PI(4
)P
PI(5
)P
PI(3
,4)P
2
PI(3
,5)P
2
PI(4
,5)P
2
PI(3
,4,5
)P3
Cer
amide
LBPA
Sph
ingo
mye
lin
Sph
ingo
sine
S1P LP
A
Car
diolipin
PEth
+RT-RT
Lipid-coated Beads Pull-down
RNA LINK-A
*
*
d
e
0
2.0
4.0
6.0
Flu
ore
sce
nce
In
ten
sity (
x1
0)
4
500 510 520 530 540 550
Wavelength (nm)
BODIPY FL-PIP3
+ Alexa-555-Strep
BODIPY FL-PIP3
+ Alexa-555-Strep-Biotin- (400 nM)RP11-383G10.5
Alp
ha
Sig
na
l (x
10
00
)
0
10
20
35
5
15
25
30
-11 -10 -9 -7 -6 -5 -4
Unlabeled LINK-A
Full Length Log(M)
-8 -3
142.3 8.4 nM=Kd
DIG- +Biotin-PI(3,4,5)PLINK-A 3
10
20
35
5
15
25
30
0-11 -10 -9 -7 -6 -5 -4
Unlabeled LINK-A
(PC-binding motif) Log(M)
-8 -3
=IC50 N.D.
10
20
35
5
15
25
30
0-11 -10 -9 -7 -6 -5 -4
Unlabeled LINK-A
(PIP -binding motif) Log(M)3
-8 -3
4.1 0.6 M�=IC50
g
Emission520-620nm
Excitation680nm 1/2 O2
DIG-LINK-A
BIO-PIP3
StreptavidinAcceptor Beads
Anti-DIGDonor Beads
f
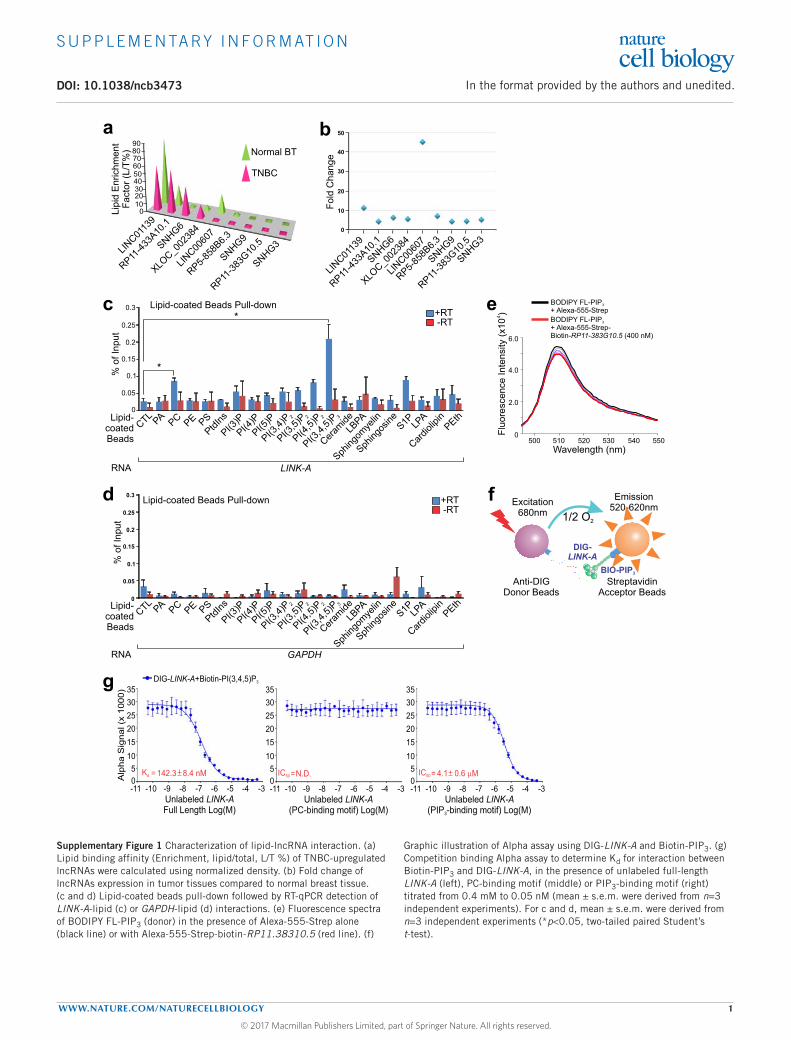
Supplementary Figure 1 Characterization of lipid-lncRNA interaction. (a) Lipid binding affinity (Enrichment, lipid/total, L/T %) of TNBC-upregulated lncRNAs were calculated using normalized density. (b) Fold change of lncRNAs expression in tumor tissues compared to normal breast tissue. (c and d) Lipid-coated beads pull-down followed by RT-qPCR detection of LINK-A-lipid (c) or GAPDH-lipid (d) interactions. (e) Fluorescence spectra of BODIPY FL-PIP3 (donor) in the presence of Alexa-555-Strep alone (black line) or with Alexa-555-Strep-biotin-RP11.38310.5 (red line). (f)
Graphic illustration of Alpha assay using DIG-LINK-A and Biotin-PIP3. (g) Competition binding Alpha assay to determine Kd for interaction between Biotin-PIP3 and DIG-LINK-A, in the presence of unlabeled full-length LINK-A (left), PC-binding motif (middle) or PIP3-binding motif (right) titrated from 0.4 mM to 0.05 nM (mean ± s.e.m. were derived from n=3 independent experiments). For c and d, mean ± s.e.m. were derived from n=3 independent experiments (*p<0.05, two-tailed paired Student’s t-test).

S U P P L E M E N TA RY I N F O R M AT I O N
WWW.NATURE.COM/NATURECELLBIOLOGY 2
© 2017 Macmillan Publishers Limited, part of Springer Nature. All rights reserved.
Lin, et al, 2016 Supplementary Figure 2
0
50
100
150
200
250
0 10 20 304050 60 70 80
Distance (nm)
Inte
nsity
Intensity Ch1
Intensity Ch2
90100
DO
PC
YO
YO
-1O
ve
rla
p
50nm 0
50
100
150
200
250
0 20 40 60 80 100120140160
Distance (nm)
Inte
nsity
Intensity Ch1
Intensity Ch2
100nm
DO
PC
BC
AR
4O
ve
rla
p
b
Inte
nsity
Ch2
Intensity Ch1
0
50
100
150
200
250
0 50 100 150 200 250
0 50 100 150 200 250
Inte
nsity C
h2
0
50
100
150
200
250
0 50 100 150 200 250
0 50 100 150 200 250
Intensity Ch1
Overlap Coefficient 0.90
Distance (nm)
0
50
100
150
200
250
0 10 20 30 4050 60 70 80
Inte
nsity
Intensity Ch1
Intensity Ch2
0
50
100
150
200
250
0 10 203040 5060 7080
Distance (nm)
Inte
nsity
Intensity Ch1
Intensity Ch2
90
DO
PC
LIN
K-A
Ove
rla
p
50nm
DO
PC
Lin
c-1
31
Ove
rla
p
50nm
Inte
nsity C
h2
0
50
100
150
200
250
0 50 100 150 200 250
0 50 100 150 200 250
Intensity Ch1
Overlap Coefficient 0.00
LINK-A Linc-131a
c
Permeable IPn DM
SO
DM
SO
Ins(1
,4,5
,6)P
4
Ins(1
,,4
,5,6
)P5
3
DM
SO
DM
SO
Ins(1
,4,5
,6)P
4
Ins(1
,,4
,5,6
)P5
3
DM
SO
DM
SO
Ins(1
,4,5
,6)P
4
Ins(1
,,4
,5,6
)P5
3
GST-MS2 - + - + - +
MS2-LINK-A
Input IP:IgG IP:PI3K
p110�
MDA-MB-231
IB:PI3K p110�
Input IP:IgG
MDA-MB-231
IP:PI3K
p110�
GST-MS2 - +
FL
- + - + - + - + - +
MS2-LINK-A �P
IP3
FL
�P
IP3
FL
�P
IP3IB:PI3K p110�
e f
h i
d
g
0
5
10
15
20
25
30
35
Re
lative
Exp
ressio
nL
eve
l o
f M
S2
-LIN
K-A
GST-MS2 - - + + +
MS2-LINK-A
Bla
nk
***� �PI3K p110 �IgG
0
2
4
6
% o
f P
IPto
PIP
23
Convers
ion
DM
SO
DM
SO
Ins
(1,4
,5,6
)P4
Ins
(1,
,4,5
,6)P
53Permeable IPn
GST-MS2 +-
MS2-LINK-A
n.s.n.s.
n.s.
� �PI3K p110 �IgG
0
2
4
6
% o
f P
IPto
PIP
23
Convers
ion
GST-MS2 - + - +
MS2-LINK-A FL �PIP3
n.s.n.s.
n.s.
0
5
10
15
20
25
30
Re
lative
Exp
ressio
nL
eve
l o
f M
S2
-LIN
K-A
GST-MS2 -
FL
- + - +
MS2-LINK-A
�P
IP3
Bla
nk
40
35
***
Ove
rla
p C
oe
f ficie
nt
LINK-A
BCAR4
H19
Linc
-131
***
0.0
0.5
1.0
1.5 LINK-A
BCAR4
H19
Linc-131
Supplementary Figure 2 Determination of LINK-A-PIP3 and LINK-A-Ins (1,3,4,5)P4 interactions by giant unilamellar vesicles and MS2-TRAP. (a and b) Fluorescence imaging of interaction between DOPC lipid vesicles (visualized by Nile Red) and indicated lncRNA (visualized by YOYO-1) (a) or YOYO-1 dye only (b). Left panel: Representative images. Scale bars, 50 nm. Middle and right panels: fluorescence intensities along the diagonal bars (middle panel) and intensity correlation between two channels (right panel) were shown. (c) Overlap coefficient between channel 1 (Nile Red) and channel 2 (YOYO-1) was calculated based on the number of giant lipid vesicles, LINK-A (n=34 lipid vesicles), BCAR4 (n=19 lipid vesicles), Lnc-131 (n=21 lipid vesicles), and H19 (n=7 lipid vesicles) (median, one-way ANOVA, ***p<0.001). (d and g) Relative expression level of MS2-tagged full-length LINK-A (d) or ΔPIP3
deletion mutant (g) in MDA-MB-231 cells was detected by RT-qPCR. (e and h) ELISA assay detecting the conversion of PIP2 to PIP3 by immunoprecipitated PI3K p110α from cells pretreated with DMSO, PI(1,4,5,6)P4 or PI(1,3,4,5,6)P5 (100 µM, 2 hrs) (e) or transfected with MS2-tagged full-length LINK-A or ΔPIP3 deletion mutant (h). (f and i) Immunoblotting detection of immunoprecipitated PI3K p110α from cells pretreated with DMSO, PI(1,4,5,6)P4 or PI(1,3,4,5,6)P5 (100 µM, 2 hrs) (f) or transfected with MS2-tagged full-length LINK-A or ΔPIP3 deletion mutant (i). For d, e, g and h, mean ± s.e.m. were derived from n=3 independent experiments (n.s. p>0.05 and ***p<0.001, two-tailed paired Student’s t-test). Statistics source data for a are in Supplementary Table 6. Unprocessed original scans of all blots with size marker are shown in Supplementary Fig. 9.

S U P P L E M E N TA RY I N F O R M AT I O N
WWW.NATURE.COM/NATURECELLBIOLOGY 3
© 2017 Macmillan Publishers Limited, part of Springer Nature. All rights reserved.
Lin, et al, 2016 Supplementary Figure 3
0
10
30
20
40
Alp
ha
Sig
na
l (x
10
00
)
0 0.2 0.8 1
Biotin-Ins(1,3,4,5)P ( M)4 �
0.4 0.6
DIG- (FL)LINK-A
196.5 13.8 nMKd =
0
10
30
20
40
DIG- ( PC)LINK-A �
0 0.2 0.8 1
Biotin-Ins(1,3,4,5)P ( M)4 �
0.4 0.6
221.7 22.6 nMKd =
0
10
30
20
40 0.2 M�
0.1 M�
0.05 M�
0 0.2 0.8 1
Biotin-Ins(1,3,4,5)P ( M)4 �
0.4 0.6
DIG- ( PIP )LINK-A � 3
Kd = N.D.
-11 -10 -9 -7 -6 -5 -4
Unlabeled Ins(1,3,4,5)P ] Log(M)4
-8 -30
10
20
15
25
Alp
ha
Sig
na
l (x
10
00
)
5
DIG- +Biotin-Ins(1,3,4,5)PLINK-A 4
210.9 9.3 nMKd =
a
b**
0
0.04
0.08
0.12
0.16
% o
f In
pu
t0
0.04
0.08
0.12
0.16
0.2
MDA-MB-468
�PIP3
IgG
- + - +
LINK-A GAPDH
MDA-MB-231
LY294002 - + - +
LINK-A GAPDHRNA
* **
c d
LY294002 - + - +
MD
A-M
B-
23
1
MD
A-M
B-
46
8IB:AKT
IB:p-AKT(Ser473)
Supplementary Figure 3 Determination of LINK-A-PIP3 and LINK-A-Ins (1,3,4,5)P4 interactions by RIP and Alpha assay respectively. (a) Saturation curve used to determine Kd of the interactions between Biotin-Ins (1,3,4,5)P4 and Digoxigenin-labeled full-length LINK-A (left panel), ΔPC LINK-A (middle panel), or ΔPIP3 LINK-A (right panel) in Alpha format (mean ± s.e.m. were derived from n=3 independent experiments). (b) Competition binding assay to determine Kd for the interactions between biotin- Ins(1,3,4,5)P4 and Digoxigenin-labeled LINK-A in the
presence of unlabeled Ins(1,3,4,5)P4 as competitor (mean ± s.e.m. were derived from n=3 independent experiments). (c and d) Immunoblotting detection (c) or RIP-qPCR detection of indicated RNAs retrieved by PIP3-specific antibody (d) in MDA-MB-231 cells treated with DMSO or LY294002. For a, b and d, mean ± s.e.m. were derived from n=3 independent experiments (*p<0.05 and ***p<0.001, two-tailed paired Student’s t-test). Unprocessed original scans of all blots with size marker are shown in Supplementary Fig. 9.
S U P P L E M E N TA RY I N F O R M AT I O N
WWW.NATURE.COM/NATURECELLBIOLOGY 4
© 2017 Macmillan Publishers Limited, part of Springer Nature. All rights reserved.
Lin, et al, 2016 Supplementary Figure 4
0
20
40
60
80
100
120
Mem
.
Cyto.
***
Ab
so
lute
Co
py N
um
be
ro
fp
er
Ce
llL
INK
-A
140
160
Mem
.
Cyto.
IB: Na/K ATPase
IB: -Tubulin�
a b c
0
20
40
60
80
100
120
% o
f E
xp
ressio
n L
eve
l
MembraneCytosol
LINK-A B2M
******
e
d
0
0.2
0.4
0.6
0.8
1.0
1.2
LIN
K-A
Re
lative
Exp
ressio
n L
eve
l
Scr
LNA#1
LNA#2
LNA#3
LNA#4
LNA#5
*
0
500
1000
2000
1500
LNA Scr LINK-A #5
Bla
nk
Ve
cto
r
Bla
nk
Ve
cto
r
LIN
K-A FL
LIN
K-A
PIP
�3
LIN
K-A PC
�
LIN
K-A
Exp
ressio
nR
ela
tive
Fo
ld C
ha
ng
e
- EGF
+ EGF*
0
0.05
0.1
0.15
0.2
0.25
Re
lative
Kin
ase
Activity (
OD
45
0n
m)
In Vitro AKT Kinase Assay
** **
n.s.
n.s.n.s.
1 2 3 4 5 6 7 8
no AKTAKT
AKT+LINK-A
AKT Ctl PolyPIPosomes+
AKT PIP PolyPIPosomes+ 3
AKT PIP PolyPIPosomes++ LINK-A3
AKT PIP PolyPIPosomes+ PIP+ LINK-A,3 3�
AKT PIP PolyPIPosomes+ PC+ LINK-A,3 �
1
2
3
4
5
6
7
8
g
0
0.2
0.4
0.6
0.8
1.0
% o
f In
pu
t
EGF +- +- +- +- +-
LNA Scr
LINK-A
Vecto
r
Vecto
r FL�PC
�PIP
3
LINK-A #5
+- +- +- +- +-
Vecto
r
Vecto
r FL�PC
�PIP
3
�PIP3
IgG
RIP
Scr LINK-A #5
LINK-A RP11-383G10.5
n.s.
**
*
n.s.
f
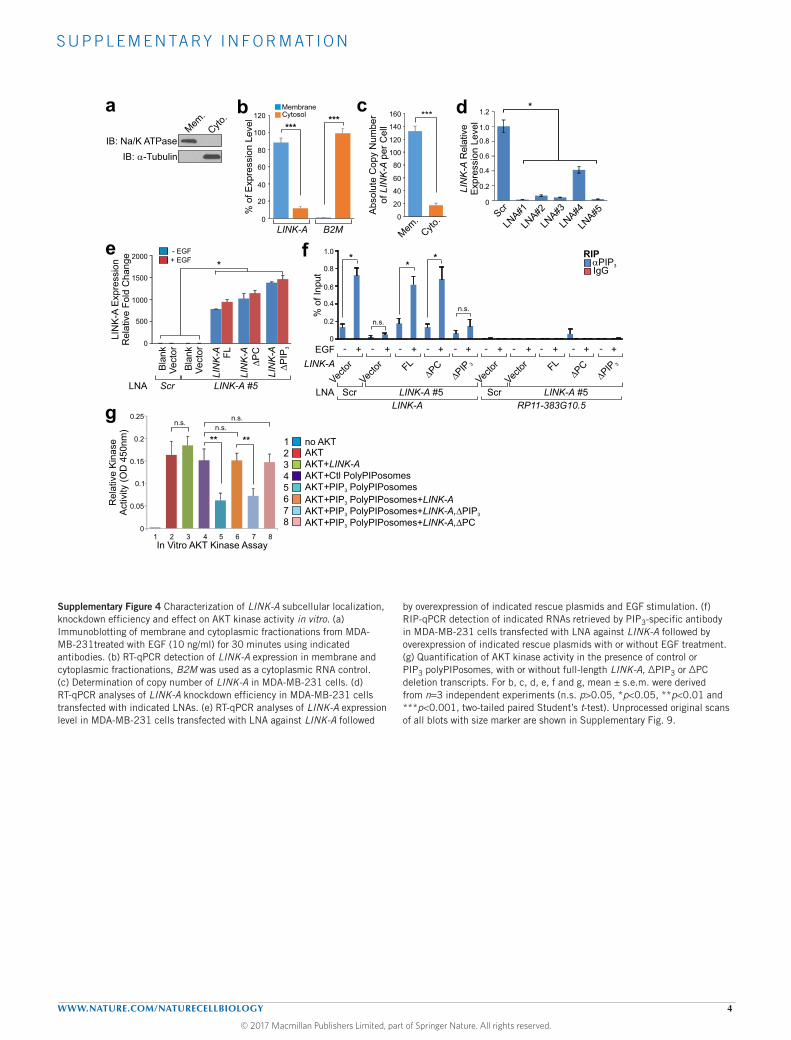
Supplementary Figure 4 Characterization of LINK-A subcellular localization, knockdown efficiency and effect on AKT kinase activity in vitro. (a) Immunoblotting of membrane and cytoplasmic fractionations from MDA-MB-231treated with EGF (10 ng/ml) for 30 minutes using indicated antibodies. (b) RT-qPCR detection of LINK-A expression in membrane and cytoplasmic fractionations, B2M was used as a cytoplasmic RNA control. (c) Determination of copy number of LINK-A in MDA-MB-231 cells. (d) RT-qPCR analyses of LINK-A knockdown efficiency in MDA-MB-231 cells transfected with indicated LNAs. (e) RT-qPCR analyses of LINK-A expression level in MDA-MB-231 cells transfected with LNA against LINK-A followed
by overexpression of indicated rescue plasmids and EGF stimulation. (f) RIP-qPCR detection of indicated RNAs retrieved by PIP3-specific antibody in MDA-MB-231 cells transfected with LNA against LINK-A followed by overexpression of indicated rescue plasmids with or without EGF treatment. (g) Quantification of AKT kinase activity in the presence of control or PIP3 polyPIPosomes, with or without full-length LINK-A, ΔPIP3 or ΔPC deletion transcripts. For b, c, d, e, f and g, mean ± s.e.m. were derived from n=3 independent experiments (n.s. p>0.05, *p<0.05, **p<0.01 and ***p<0.001, two-tailed paired Student’s t-test). Unprocessed original scans of all blots with size marker are shown in Supplementary Fig. 9.

S U P P L E M E N TA RY I N F O R M AT I O N
WWW.NATURE.COM/NATURECELLBIOLOGY 5
© 2017 Macmillan Publishers Limited, part of Springer Nature. All rights reserved.
Lin, et al, 2016 Supplementary Figure 5
a b
BRK Binding #1nt. 471-550
BRK Binding #2nt. 771-850
LRRK2 Bindingnt. 1251-1330
PIP3 binding loop
PC Bindingnt. 241-300
d
PIP3-binding loop
0
1
2
MS
2-
Re
trie
va
lL
INK
-A
(% o
f In
pu
t)
0.5
1.5
�GST-tag �IgGMS2-TRAP
GST-MS2BP
- +
MS2-LINK-A
WT
EGF - + - + - + - + - +
MS2 �PIP3 3C 4A 6A
MDA-MB-231
n.s.
WT CAGGGU GCUCUGAGACUC
CAGGGU GCUCUGAC
CAGGGU GCUCUGCGACUC
CAGGGU GCUCUGA ACUCU
CAGGGU GCUCUGAG CUCC
CAGGGU GCUCUGAGA UCA
CAGGGU GCUCUGAGAC CG
CAGGGU GCUCUGAGACUA
DIG- (nt. 1100-1117)LINK-A
�2-5
1A
2G
3A
4C
5U
6C
C
U
C
A
G
A
c
Ma
rke
r0.5
1
1.5
22.5
34569
(kb
)
WT 3C 4A 6A
BiotinylatedLINK-A
e
Supplementary Figure 5 Secondary structural modeling of LINK-A-protein and –lipid interactions. (a) Graphic illustration of predicted LINK-A secondary structure and the stem loops corresponding to protein (black dot line circle) and lipid (red dot line circle) binding. (b) Secondary structure of LINK-A (nt. 1,081-1,140) harboring a stem-loop corresponding to PIP3 binding (red dot line circle). (c) List of DIG-labeled wild-type LINK-A and mutant oligonucleotides used in Alpha assay. (d)
RNA agarose gel of in vitro transcribed biotinylated LINK-A (wild-type and single nucleotide mutants). (e) Relative retrieval level of MS2-tagged full-length LINK-A or indicated mutants in MS2-TRAP assay detected by RT-qPCR. For e, mean ± s.e.m. were derived from n=3 independent experiments (n.s. p>0.05, two-tailed paired Student’s t-test). Unprocessed original scans of all blots and gels with size marker are shown in Supplementary Fig. 9.

S U P P L E M E N TA RY I N F O R M AT I O N
WWW.NATURE.COM/NATURECELLBIOLOGY 6
© 2017 Macmillan Publishers Limited, part of Springer Nature. All rights reserved.
Lin, et al, 2016 Supplementary Figure 6
0
0.2
0.4
0.6
0.8
1.0
1.2
1.4
1.6
D1 D2 D3 D4 D5D0
**Scr LNA
LINK-A LNA + Blank vector
LINK-A LINK-ALNA + FL
LINK-A LINK-ALNA + PIP3�
Ab
so
rba
nce
(5
90
nm
)
0
0.1
0.2
0.3
0.4
0.5
0.6
0.7
0.8
D1 D2 D3 D4 D5D0
**LINK-A PIP� 3
Blank Vector
LINK-A FL
Ab
so
rba
nce
(5
90
nm
) 0.9
IB:p-GSK-3�
(Ser9)
MCF-10A
BlankVector
LINK-A
FL
LINK-A
�PIP3
EGF
IB:AKT
IB:p-AKT(Ser473)
IB:p-AKT(Thr308)
IB:GSK-3�
0 15 30 60 min0 15 30 60 0 15 30 60
a b c d
e f
1 2 3 4 5 6Log copy number LINK-A
12
16
20
24
32
28
Me
an
CT
y=-3.363x+34.82R =0.998
2
g
0
100
200
150
50
Ve
c.
Ve
c.
FL
PIP
3�
Co
py N
um
be
ro
f/C
ell
LIN
K-A
LNA Scr LINK-A #5
**
**
LINK-A
0
40
80
120
160
Co
py N
um
be
ro
f/C
ell
LIN
K-A
MCF-10A
Ve
c.
FL
�P
IP3
MD
A-
MB
-23
1
***
LINK-A
jh i
0
50
100
150
Co
py n
um
be
rL
INK
-A
WTRP11-
383G10
3C 4A 6A
LINK-A
Intracellular RNA delivery
-EGF +EGFDLD-1 PIK3CA +/+
***
0
50
100
150
Co
py n
um
be
rL
INK
-A
200-EGF +EGF
DLD-1 PIK3CA +/-
RNA
PIP3 + +
WT
+ +
Intracellular delivery
3C 4A 6ARP11-
383G10 LINK-A
+
***
RNA
PIP3 + +
WT
+ +
Intracellular delivery
3C 4A 6ARP11-
383G10 LINK-A
+
PIP
(pm
ol)/5
x1
03
6ce
ll
0
0.5
1
1.5
2
2.5 -EGF +EGF
DLD-1 PIK3CA +/-
n.s.
PIP ELISA3
LNA Scr LINK-A #5
Bla
nk
Ve
cto
r
Bla
nk
Ve
cto
r
LIN
K-A
FL
LIN
K-A
PIP
3�
EGF - + - + - + - +
IB:AKT
IB:p-AKT(Ser473)
IB:p-AKT(Thr308)
IB:p-GSK-3�
(Ser9)
MDA-MB-231
IB:GSK-3�
Supplementary Figure 6 Determination of LINK-A copy number and characterization of functional sufficiency of LINK-A copy number. (a) Generation of a standard curve for calculating LINK-A copy number. In vitro transcribed LINK-A (a range of amounts from 10 copies to 106 copies) was used to generate cDNAs and generated cDNAs were used in real-time PCR. The resultant CT values decreased linearly with increasing LINK-A copy number, indicating sensitive detection from a wide range of template amounts. (b-d) Determination of LINK-A copy number (b), AKT/GSK-3β activation (c) and cell proliferation (d) in MDA-MB-231 cells transfected with LNA against LINK-A followed by overexpression of indicated rescue plasmids and EGF stimulation. (e-g) LINK-A copy number (e), AKT/GSK-3β activation (f) and cell proliferation (g) were determined by RT-
qPCR, immunoblotting and cell proliferation assay in MCF-10A cells stably expressing full-length LINK-A or ΔPIP3 deletion mutant, with or without EGF stimulation. (h and i) RT-qPCR determination of LINK-A copy number (h) and quantification of cellular PIP3 in DLD-1 PIK3CA+/-cells delivered with PIP3 and indicated LINK-A single nucleotide mutated transcripts with or without EGF stimulation. (j) RT-qPCR determination of LINK-A copy number in DLD-1 PIK3CA+/+ cells delivered with indicated LINK-A single nucleotide mutated transcripts with or without EGF stimulation. For b, d, e, g, h, i and j, mean ± s.e.m. were derived from n=3 independent experiments (n.s. p>0.05, **p<0.01 and ***p<0.001, two-tailed paired Student’s t-test). Unprocessed original scans of all blots with size marker are shown in Supplementary Fig. 9.

S U P P L E M E N TA RY I N F O R M AT I O N
WWW.NATURE.COM/NATURECELLBIOLOGY 7
© 2017 Macmillan Publishers Limited, part of Springer Nature. All rights reserved.
Lin, et al, 2016 Supplementary Figure 7
100
200
300400500
1000
(bp
)
Ma
rke
r
1 2 3 4 5 6 7 WT
WT
LINK-A PIP BM3
-/-
a
b
Target sequenceof LINK-A
GATTATAATTATTTGTCTAAGGTGGAGATTACCAGGGTAGACTCGCTCTGGCCGTATGTAATGATGTCTGTGGCTACATAACCTGCC
GCCGTATGTAATGATGTCTGTGTCTAAGGTGGAGATTACCgRNA#2 gRNA#1
5’- -3’
cATGCTAGATTATAATTATTTGTCTAAGGTGGAGATT------------------------------------TCTGTGGCTACATAACCTGCCAACACTTAG
||||||||||||||||||||||||||||||||||||||||||||||||||||||||||||||||||||||||||||||||||||||||||||||||||||||
ATGCTAGATTATAATTATTTGTCTAAGGTGGAGATTACCAGGGTAGACTCGCTCTGGCCGTATGTAATGATGTCTGTGGCTACATAACCTGCCAACACTTAG
LINK-A PIP BM3
-/-
clone #3
LINK-A PIP BM3
+/+
PIP binding motif (nt. 1081-1140)3
36 nucleotides deletion
ATGCTAGATTATAATTATTTGTCTAAGGTGGAGA ------------------------------------TCTGTGGCTACATAACCTGCCAACACTTAG
||||||||||||||||||||||||||||||||||||||||||||||||||||||||||||||||||||||||||||||||||||||||||||||||||||||
ATGCTAGATTATAATTATTTGTCTAAGGTGGAGATTACCAGGGTAGACTCGCTCTGGCCGTATGTAATGATGTCTGTGGCTACATAACCTGCCAACACTTAG
LINK-A PIP BM3
-/-
clone #6
LINK-A PIP BM3
+/+
PIP binding motif (nt. 1081-1140)3
--
38 nucleotides deletiond
Supplementary Figure 7 Generation of LINK-A PIP3-binding motif knockout cell line by CRISPR/Cas9 gene editing. (a) gRNA sequences targeting LINK-A PIP3-binding motif. (b) PCR analysis of targeted locus showing the band corresponding to the genomic deletion in colonies #1, 3 and
6. (c and d) Genotyping PCR results showing the deletion of LINK-A PIP3 binding region in colonies #3 (c) and #6 (d) of MDA-MB-231 cells. Unprocessed original scans of all gels with size marker are shown in Supplementary Fig. 9.
S U P P L E M E N TA RY I N F O R M AT I O N
WWW.NATURE.COM/NATURECELLBIOLOGY 8
© 2017 Macmillan Publishers Limited, part of Springer Nature. All rights reserved.
Lin, et al, 2016 Supplementary Figure 8
100
50
0
Su
rviv
al R
ate
(%
)
month
High LINK-A
Low LINK-A
p=0.0116
0 100 20050 150
0
20
40
60
80
100
120
LIN
K-A
Po
sitiv
e (
%)
NBT
Maligan
t
p=4.8e-4e f
g High Low
p-A
KT
(Th
r30
8)
p-A
KT
(Se
r47
3)
LIN
K-A
SNPs within gene loci significantly associated with survival of breast cancer in TCGA samples (n=712)LINK-A
chr1:238628248 rs12095274 G A 2.14(1.21-3.78) 0.008673 2.15E-08 765 137 16 5
ChrPosID SNPEffect
Allele
Reference
AlleleHR MissingeQTL-PP AA AG GG
SNPs within gene loci significiantly associated with survival of lung cancer in TCGA samples (LUAD+LUSC)LINK-A
(n=793)
chr1:238655389 rs2392862 T G 1.25(1.01-1.54) 0.042 0.744 433 299 61 0
eQTL-PEffect
Allele
Reference
AlleleHR PChrPosID SNP MissingGG GT TT
SNPs within gene loci significantly associated with lung cancerLINK-A
(n=2332) compared to normal lung tissues (n=3077)
chr1:238667409 rs7513497 A G 2.05(1.24-3.40) 0.0054
chr1:238666721 rs116316949 T C 3.21(1.30-7.91) 0.0113
chr1:238666024 rs10925671 C G 0.31(0.13-0.77) 0.0114
chr1:238665702 rs10925670 T C 3.21(1.30-7.93) 0.0116
chr1:238664537 rs10925669 A G 0.31(0.13-0.77) 0.0118
chr1:238667405 - T G 0.39(0.16-0.97) 0.0417
chr1:238667427 - C G 0.28(0.08-0.96) 0.0431
PChrPosID SNPEffect
Allele
Reference
AlleleOR
SNPs within gene loci significantly associated with gastric cancerLINK-A
(n=1006) compared to normal gastric tissues (n=2273)
chr1:238668602 rs11809478 T C 1.24(1.06-1.46) 0.008
chr1:238664492 rs59083989 G A 1.23(1.05-1.45) 0.011
OR PChrPosID SNPEffect
Allele
Reference
Allele
a
b
c
d
i
D7
**
D0 D1 D3 D5
0
1
2
3
4
Ab
so
rba
nce
(5
90
nm
)
�
CTL shRNA
LINK-A sh#2
LINK-A sh#3
MDA-MB-231
h
j
0
5
10
15
20
% o
fA
nn
ex-V
Po
sitiv
e **
CT
L
LIN
K-AsiRNA
Annex-V Positive
0
50
100
150
200
10 10 10 10 10 10101 2 3 4 5 76
FL1-A
Co
un
t
CTL si LINK-A si
k
Re
lative
Exp
ressio
n L
eve
l
CTL
LIN
K-A
MDA-MB-231
0
0.2
0.4
0.6
0.8
1.0
1.2 ***
siRNA
Re
lative
Exp
ressio
n L
eve
l
MDA-MB-468
0
0.2
0.4
0.6
0.8
1.0
1.2 ***
CTL
LIN
K-A
Re
lative
Exp
ressio
n L
eve
l
0
0.2
0.4
0.6
0.8
1.0
1.2
MDA-MB-231
*
CTL
LIN
K-A
#1shRNA
LIN
K-A
#2
LINK-A
Ne
ga
tive
Po
sitiv
e
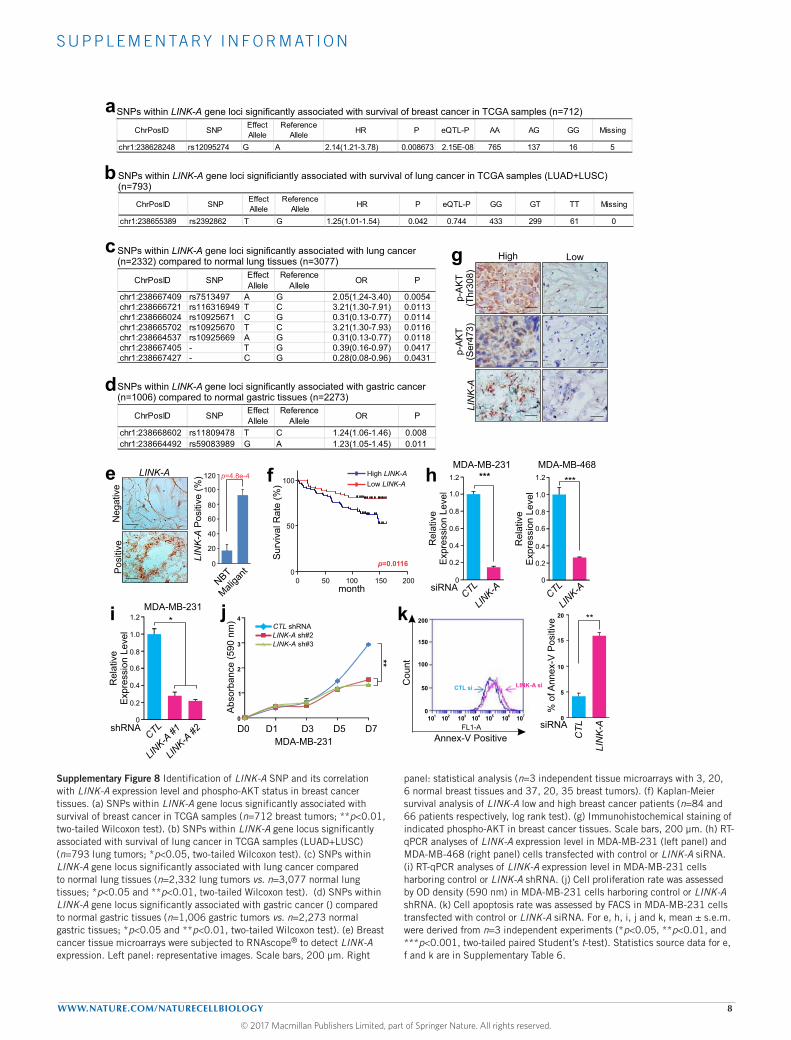
Supplementary Figure 8 Identification of LINK-A SNP and its correlation with LINK-A expression level and phospho-AKT status in breast cancer tissues. (a) SNPs within LINK-A gene locus significantly associated with survival of breast cancer in TCGA samples (n=712 breast tumors; **p<0.01, two-tailed Wilcoxon test). (b) SNPs within LINK-A gene locus significantly associated with survival of lung cancer in TCGA samples (LUAD+LUSC) (n=793 lung tumors; *p<0.05, two-tailed Wilcoxon test). (c) SNPs within LINK-A gene locus significantly associated with lung cancer compared to normal lung tissues (n=2,332 lung tumors vs. n=3,077 normal lung tissues; *p<0.05 and **p<0.01, two-tailed Wilcoxon test). (d) SNPs within LINK-A gene locus significantly associated with gastric cancer () compared to normal gastric tissues (n=1,006 gastric tumors vs. n=2,273 normal gastric tissues; *p<0.05 and **p<0.01, two-tailed Wilcoxon test). (e) Breast cancer tissue microarrays were subjected to RNAscope® to detect LINK-A expression. Left panel: representative images. Scale bars, 200 µm. Right
panel: statistical analysis (n=3 independent tissue microarrays with 3, 20, 6 normal breast tissues and 37, 20, 35 breast tumors). (f) Kaplan-Meier survival analysis of LINK-A low and high breast cancer patients (n=84 and 66 patients respectively, log rank test). (g) Immunohistochemical staining of indicated phospho-AKT in breast cancer tissues. Scale bars, 200 µm. (h) RT-qPCR analyses of LINK-A expression level in MDA-MB-231 (left panel) and MDA-MB-468 (right panel) cells transfected with control or LINK-A siRNA. (i) RT-qPCR analyses of LINK-A expression level in MDA-MB-231 cells harboring control or LINK-A shRNA. (j) Cell proliferation rate was assessed by OD density (590 nm) in MDA-MB-231 cells harboring control or LINK-A shRNA. (k) Cell apoptosis rate was assessed by FACS in MDA-MB-231 cells transfected with control or LINK-A siRNA. For e, h, i, j and k, mean ± s.e.m. were derived from n=3 independent experiments (*p<0.05, **p<0.01, and ***p<0.001, two-tailed paired Student’s t-test). Statistics source data for e, f and k are in Supplementary Table 6.

S U P P L E M E N TA RY I N F O R M AT I O N
WWW.NATURE.COM/NATURECELLBIOLOGY 9
© 2017 Macmillan Publishers Limited, part of Springer Nature. All rights reserved.
Figure 2c
Cell Permeable IPn D
MS
OD
MS
OIn
s(1
,4,5
,6)P
4
Ins(
1,
,4,5
,6)P
53
DM
SO
DM
SO
Ins(
1,4
,5,6
)P4
Ins(
1,
,4,5
,6)P
53
DM
SO
DM
SO
Ins(
1,4
,5,6
)P4
Ins(
1,
,4,5
,6)P
53
GST-MS2BP - + - + - +
IB:GST-tag
Figure 2f
GST-MS2BP - +
WT
- + - + - + -
MS2-LINK-A DP
IP3
WT
DP
IP3
IB:GST-tag
+ - +
WT
DP
IP3
Figure 3f
siRNA CTL LINK-A
EGF 0 15 30 60 min0 15 30 60
IB: p-AKT(Thr308)
IB: p-AKT(Ser473)
IB: AKT
IB: Vinculin
IB: p-GSK-3b
-siRNA CTL LINK-A
EGF + - +
IB: p-AKT(Thr308)
IB: p-AKT(Ser473)
IB: AKT
Control PIP IB:AKT
PIIB:AKT
PI(3)PIB:AKT
PI(4)PIB:AKT
PI(5)PIB:AKT
PI(3,4)P2
IB:AKT
PI(3,5)P2
IB:AKT
PI(4,5)P2
IB:AKT
PI(3,4,5)P3
IB:AKT
-siRNA CTL LINK-A
EGF + - +
Figure 3h
IB: p-AKT(Thr308)
IB: p-AKT(Ser473)
IB: AKT
IB: p-PDK1(Ser241)
IB: p-PTEN(Ser308)
IB: p-c-Raf(Ser259)
IB: Vinculin
shRNA CTL
#2
#3
LINK-A
Figure 3g
Lin, et al, 2016 Supplementary Figure 9
Supplementary Figure 9 Unprocessed original scans of all blots

S U P P L E M E N TA RY I N F O R M AT I O N
WWW.NATURE.COM/NATURECELLBIOLOGY 10
© 2017 Macmillan Publishers Limited, part of Springer Nature. All rights reserved.
Figure 4g
IB:AKT
Strep.-HRP
Inp
ut
Be
ad
s
383G10
WT
D2
-5
3C
4A
6A
LINK-A
Figure 4i
IP:GST-tagIB:GST
IP:IgGIB:GST
IP:GST-tagIB:AKT
InputIB:AKT
- +WT
EGFMS2 DPIP3 3C 4A 6A
- + - + - + - + - +
Figure 5b
EGF - + - +PIK3CA +/+ +/-
IB:p-AKT(Thr308)
IB:p-AKT(Ser473)
IB:AKT
IB:PDK1
IB:GAPDHFigure 5e
EGF - + - + - + - +M
ock
WT
DPC
DPIP
3
IB:p-AKT(Thr308)
IB:p-AKT(Ser473)
IB:AKT
IB:PDK1
IB:GAPDH
LINK-A
Figure 5h
EGF - + - + - + - +
LINK-A PIP3 - - + + - - + +
- - - - + + + +
IB:p-AKT(Thr308)
IB:p-AKT(Ser473)
IB:AKT
IB:PDK1
IB:GAPDH
Figure 5k
LINK-AEGF - + - + - + - +
Moc
k
WT
DPC
DPIP
3
IB:p-AKT(Thr308)
IB:p-AKT(Ser473)
IB:AKT
IB:PDK1
IB:GAPDH
Figure 5l
EGF - + - + - + - +
RP11
-383G10
WT
- +
RNA 3C 4A 6A
LINK-A
PIP3 ++ ++ ++ ++ ++
IB:p-AKT(Thr308)
IB:p-AKT(Ser473)
IB:AKT
IB:PDK1
Figure 5m
IP:AKTIB:AKT
IP:IgGIB:AKT
InputIB:AKT
EGF - + - + - + - +
RP11
-383G10
WT
- +
3C 4A 6A
LINK-A
Supplementary Figure 9 Continued
S U P P L E M E N TA RY I N F O R M AT I O N
WWW.NATURE.COM/NATURECELLBIOLOGY 11
© 2017 Macmillan Publishers Limited, part of Springer Nature. All rights reserved.
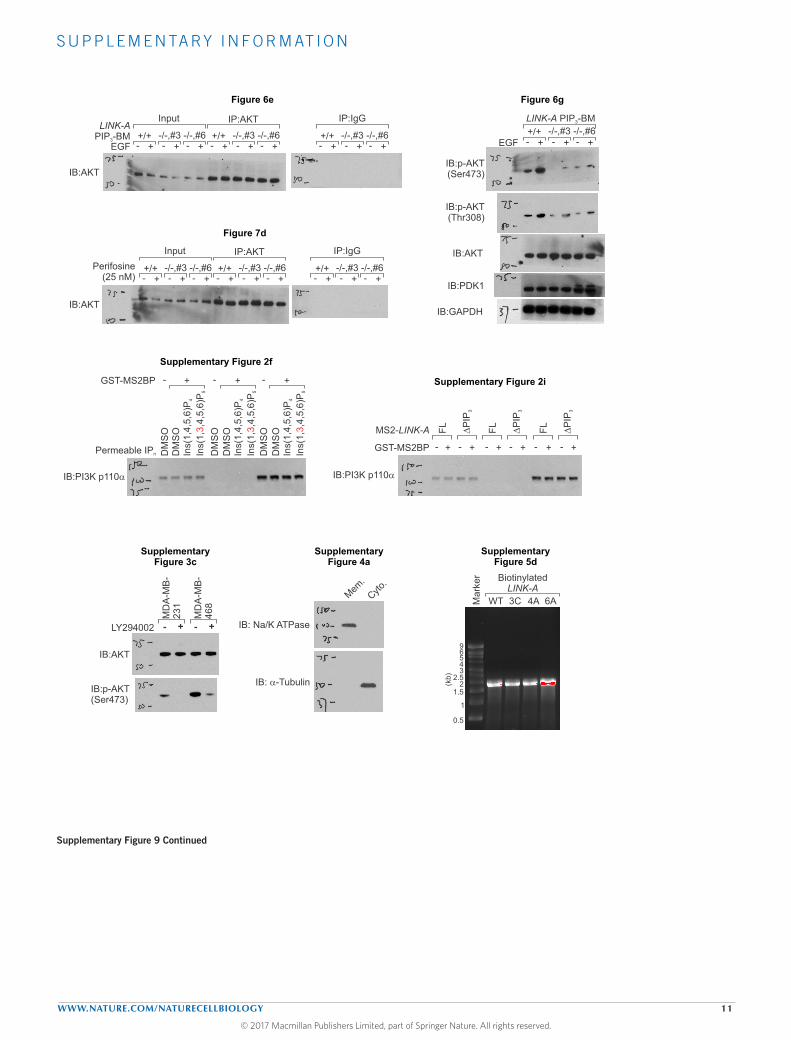
Figure 6e
EGF - + - + - + - + - + - + - + - + - +
IB:AKT
LINK-A PIP -BM3 +/+ -/-,#3 -/-,#6 +/+ -/-,#3 -/-,#6 +/+ -/-,#3 -/-,#6
Input IP:AKT IP:IgG
Figure 6g
EGF - + - + - +
LINK-A PIP -BM3
+/+ -/-,#3 -/-,#6
IB:p-AKT(Ser473)
IB:p-AKT(Thr308)
IB:AKT
IB:PDK1
IB:GAPDH
Figure 7d
Perifosine(25 nM) - + - + - + - + - + - + - + - + - +
+/+ -/-,#3 -/-,#6 +/+ -/-,#3 -/-,#6 +/+ -/-,#3 -/-,#6
Input IP:AKT IP:IgG
IB:AKT
Supplementary Figure 2f
Permeable IPn DM
SO
DM
SO
Ins(
1,4
,5,6
)P4
Ins(
1,
,4,5
,6)P
53
DM
SO
DM
SO
Ins(
1,4
,5,6
)P4
Ins(
1,
,4,5
,6)P
53
DM
SO
DM
SO
Ins(
1,4
,5,6
)P4
Ins(
1,
,4,5
,6)P
53
GST-MS2BP - + - + - +
IB:PI3K p110a
Supplementary Figure 2i
GST-MS2BP - +F
L- + - + - + - + - +
MS2-LINK-A DP
IP3
FL
DP
IP3
FL
DP
IP3
IB:PI3K p110a
Supplementary Figure 3c
LY294002 - + - +
MD
A-M
B-
23
1
MD
A-M
B-
46
8
IB:AKT
IB:p-AKT(Ser473)
Mem
.
Cyto.
IB: Na/K ATPase
IB: a-Tubulin
SupplementaryFigure 4a
0.5
1
1.52
2.534569
(kb)
SupplementaryFigure 5d
Ma
rke
r
WT 3C 4A 6A
Biotinylated LINK-A
Supplementary Figure 9 Continued
S U P P L E M E N TA RY I N F O R M AT I O N
WWW.NATURE.COM/NATURECELLBIOLOGY 12
© 2017 Macmillan Publishers Limited, part of Springer Nature. All rights reserved.
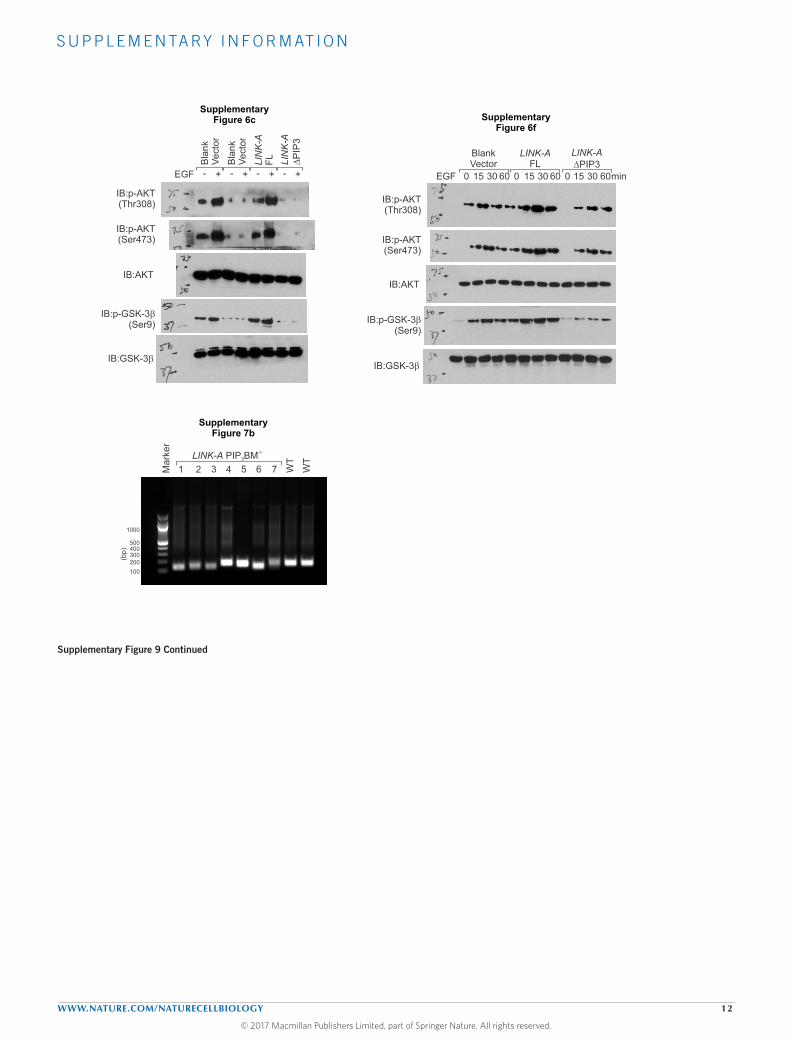
IB:p-GSK-3b(Ser9)
Blank Vector
LINK-A FL
LINK-A�DPIP3
EGF
IB:AKT
IB:p-AKT(Ser473)
IB:p-AKT(Thr308)
IB:GSK-3b
0 15 30 60 min0 15 30 60 0 15 30 60
SupplementaryFigure 6f
100
200300400500
1000
(bp
)
Ma
rke
r
1 2 3 4 5 6 7 WT
WT
-/-LINK-A PIP BM3
SupplementaryFigure 7b
SupplementaryFigure 6c
Bla
nk
Ve
cto
r
Bla
nk
Ve
cto
r
LIN
K-A
F
L
LIN
K-A
DP
IP3
EGF - + - + - + - +
IB:AKT
IB:p-AKT(Ser473)
IB:p-AKT(Thr308)
IB:p-GSK-3b(Ser9)
IB:GSK-3b
Supplementary Figure 9 Continued
S U P P L E M E N TA RY I N F O R M AT I O N
WWW.NATURE.COM/NATURECELLBIOLOGY 13
© 2017 Macmillan Publishers Limited, part of Springer Nature. All rights reserved.
Supplementary Table Legends
Supplementary Table 1 Lipid-bound lncRNA profiling of breast cancers vs. normal adjacent tissues by LncRNA Array 3.0. Raw signal intensities were normalized in quantile method by GeneSpring GX v12.0, and low intensity LncRNAs were filtered (LncRNAs that at least 2 out of 2 samples have flags in Present or Marginal were chosen for further analysis). ProbeName: Probe Name. [1099714F] ~ [1099715F] (raw): Raw intensities of each sample. [1099714F] ~ [1099715F] (normalized): Normalized intensities of each sample (log2 transformed). GeneSymbol: LncRNA symbol name.
Supplementary Table 2 Changes in the LiP pattern of AKT PH domain upon PIP3, LINK-A or PIP3/LINK-A binding detected by LC-MS.Complete mass spectrometry analysis results for LiP assay with recombinant AKT PH domain (a.a. 1-111) in the presence of PIP3 alone or in combination with synthesized with wild-type LINK-A RNA oligonucleotide (nt.1,100-1,117) or indicated mutant. Peptide spectrum match numbers (#PSMs) from each experimental condition were shown.
Supplementary Table 3 Clinipathological parameters of tissue microarrays used in this study.HBre-Duc150Sur-01: Breast carcinoma, 150 cases, 1core/case, clinical stage I, II, III. Survival data followed up 9-12 years (US Biomax).T6235086-5: 37 different breast tumors and 3 corresponding normal control (Biochain);TMA007: Triple negative breast cancer tissue array, including TNM, clinical stage and pathology grade, majority cases with negative of ER, PR, HER-2 in IHC (Indivumed); Nanjing cohort: Breast cancer tissue array containing 20 breast cancer tissues (3 are triple negative), including TNM and clinical stage information, 20 cases/20 cores (Yixing people’s hospital); Duke cohort: 151 Frozen breast tumors samples with recurrence information, obtained 123 RNA isolation samples in all for qPCR assay, and all the breast cancer tissues were performed for tissue array by the core facility of MD Anderson, and 97 tissue samples were available in final for further assays (Duke University).
Supplementary Table 4: List of antibodies used in this study. Commercially available antibodies and their catalogue number, clone number and usage are listed.
Supplementary Table 5: List oligonucleotides used in this study. The sequence for all siRNAs/shRNAs/LNAs, primers for PCR/RT-qPCR/RIP/SNP detection, synthesized LINK-A RNA oligonucleotides are provided in this table.
Supplementary Table 6 Statistics source data. Raw data of the statistical analysis for experiments with representative images are provided.