ukzn resource allocation model presentation to senate 4 th april 2007 glen barnes director,...
TRANSCRIPT


UKZN Resource Allocation Model
Presentation to Senate 4th April 2007
Glen Barnes
Director, Management Information, UKZN
Introduction Revised budgeting process
The need to have an objective-based allocation of resources
To move away from an ‘inherited’ allocation framework Result of the BWG over the last 4-5 months

Components of the model Detailed areas of income Allocations across sectors
Strategic, Contractual, College, Support Allocations within sectors
Strategic initiatives, Contractual obligations, Faculty data & drivers, Benchmarking & best practice
Migration & implementation Not for 2007, towards a 3-5 year budget plan


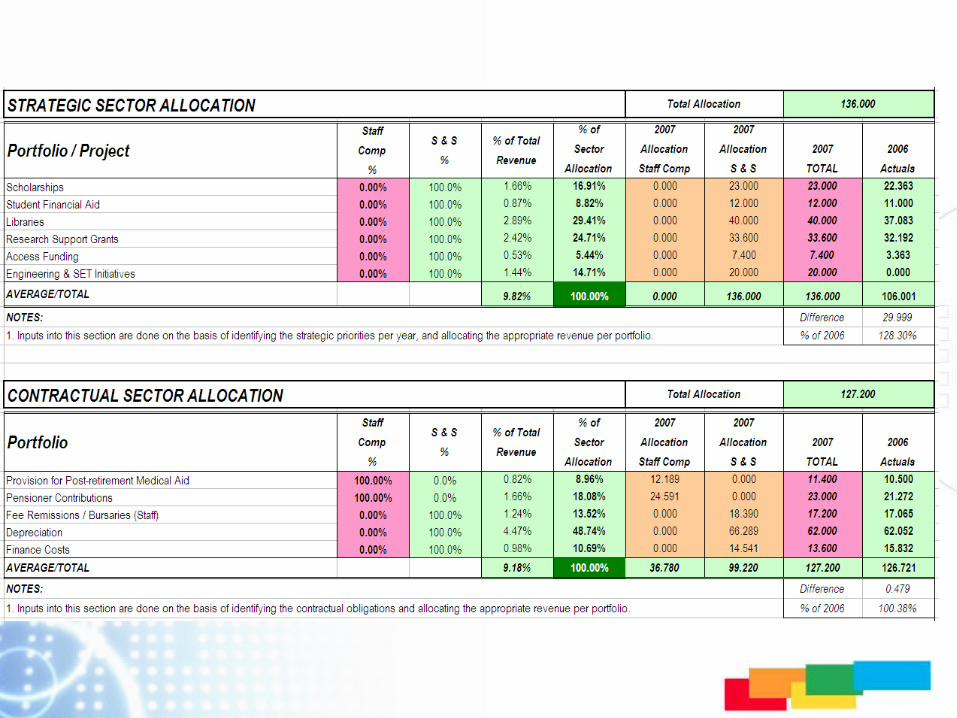
Sector allocations Strategic sector Contractual sector
Actual amounts identified to cover strategic initiatives & contractual obligations …

Sector allocations … College sector
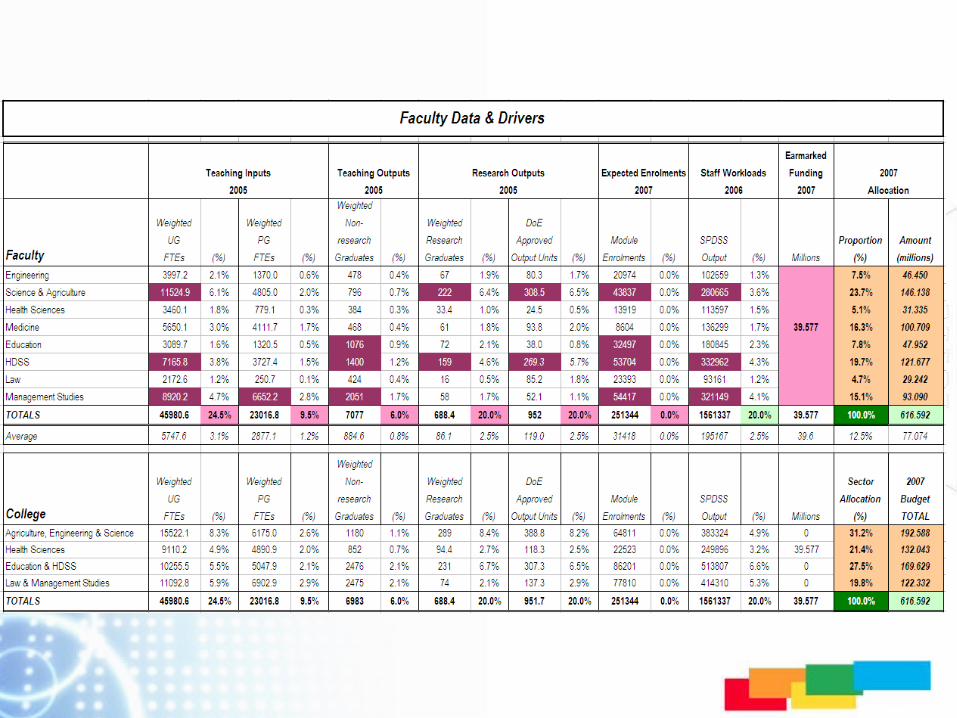
Faculty data & drivers … Support sector
Process of benchmarking & better practice …

Migration & implementation College sector
Align college proportions within the sector Migration over 3 years
Support sector Revisit the ‘contractual’ obligations within portfolios Align the portfolio proportions within the sector
Incorporate into the 3 to 5 year budget plan

Thank you …


Enrolment Planning 2008-2010
Presentation to Senate 4th April 2007
Glen Barnes
Director, Management Information, UKZN

Introduction Response by the DoE on UKZN enrolment plan
and funding for 2007 to 2010 Main points from the DoE, implications ...
Enrolment numbers & FTEs Major fields of study & Qualification types Student success rates Graduates

Student enrolments - subsidised Headcount enrolments to increase from 40700
(2005) to a maximum of 42500 (2010) To-date subsidised enrolments are 33400, a total
of 37681 projected for 2007 An increase of 4% each year to reach the DoE
maximum of 42500 by 2010

Student enrolments - total Headcount enrolments to increase from 40000
(2007 projected) to 44800 (2010) Slight drop in non-subsidised enrolments from
2338 (2006) to 2310 (2007 to 2010) NB: 4% increase per year from 2007 to 2010
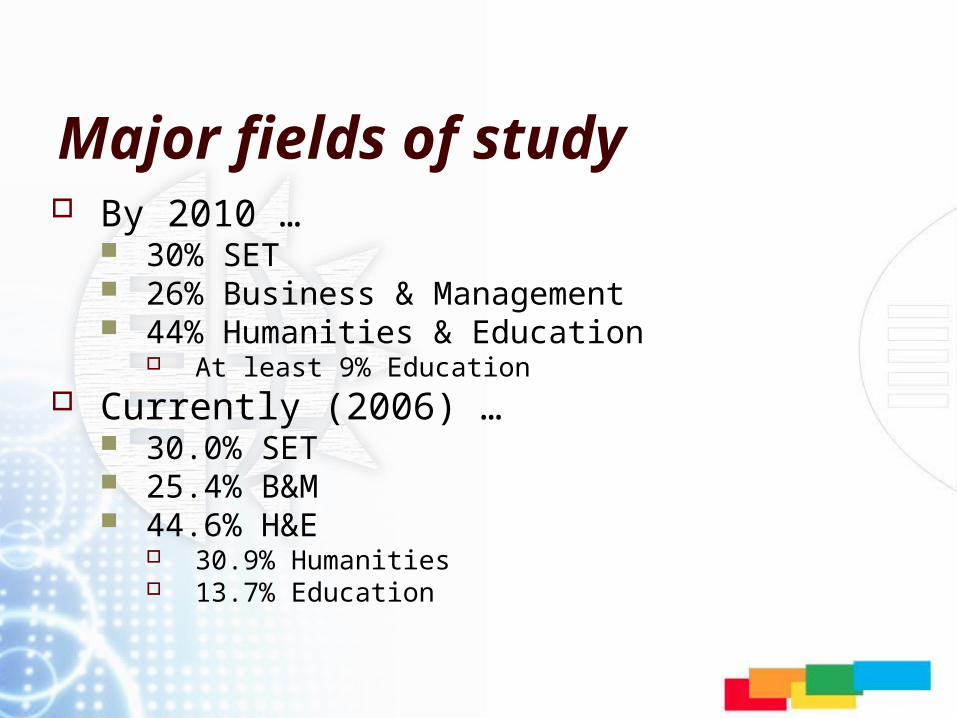
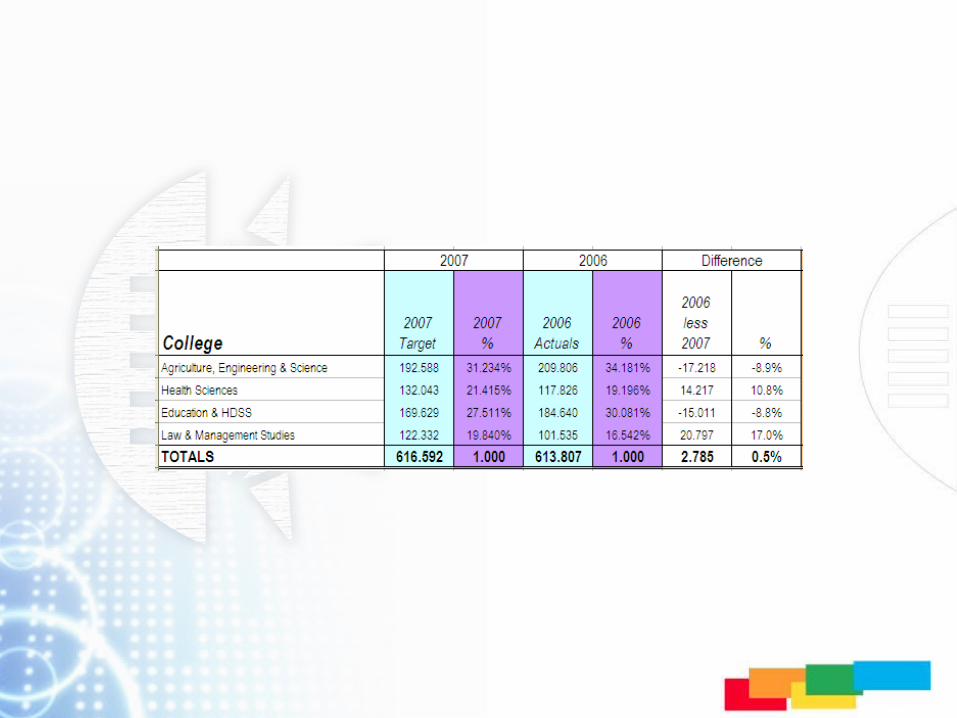
Major fields of study By 2010 …
30% SET 26% Business & Management 44% Humanities & Education
At least 9% Education Currently (2006) …
30.0% SET 25.4% B&M 44.6% H&E
30.9% Humanities 13.7% Education

Qualification types By 2010 …
10% in undergraduate diplomas ?? 62% in undergraduate degrees (72% total UG) 14% in postgraduate below Masters At least 14% in Masters & Doctoral (28% total PG)
Currently (2006) … 7.6% in undergraduate diplomas 64.1% in undergraduate degrees (71.7% total UG) 12.7% in postgraduate below Masters 14.2% in Masters & Doctoral (26.9% total PG) (1.4% occasional students)
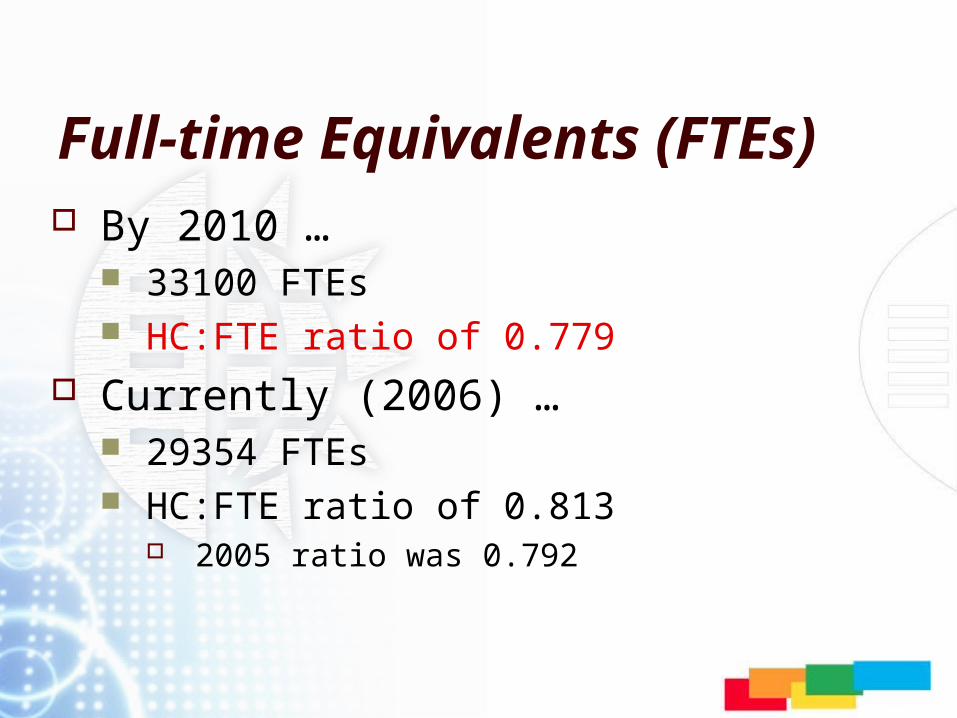
Full-time Equivalents (FTEs) By 2010 …
33100 FTEs HC:FTE ratio of 0.779
Currently (2006) … 29354 FTEs HC:FTE ratio of 0.813
2005 ratio was 0.792

Student success rate The percentage of passed FTEs relative to
enrolled FTEs for subsidized qualifications By 2010 …
78% for both contact & distance Currently (being finalized) …
2005 was 72.90% and reflects a decrease from 76.29% in 2003

SUBSIDISED2003 2004 2005
CONTACT
1a. Undergraduate 80.99% 78.42% 77.55%
2a. Postgraduate less than Masters 85.40% 83.25% 79.09%
3a. Masters 69.35% 69.13% 68.38%
4a. Doctors 56.02% 35.32% 41.91%
Overall Contact success rate 80.36% 77.54% 76.44%
DISTANCE 2003 2004 2005
1a. Undergraduate 66.81% 85.60% 84.34%
2a. Postgraduate less than Masters 47.52% 31.85% 23.14%
3a. Masters 53.33% 86.62% 86.62%
Overall Distance success rate 56.46% 48.02% 43.98%
CONTACT & DISTANCE success rate 76.29% 73.28% 72.90%
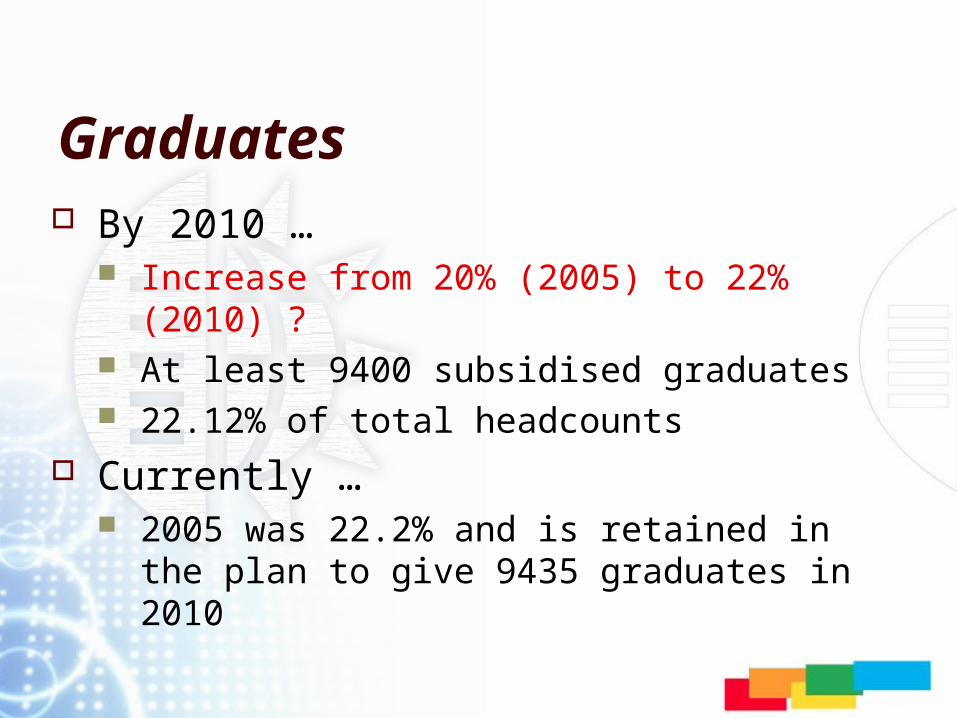
Graduates By 2010 …
Increase from 20% (2005) to 22% (2010) ? At least 9400 subsidised graduates 22.12% of total headcounts
Currently … 2005 was 22.2% and is retained in the plan to give
9435 graduates in 2010
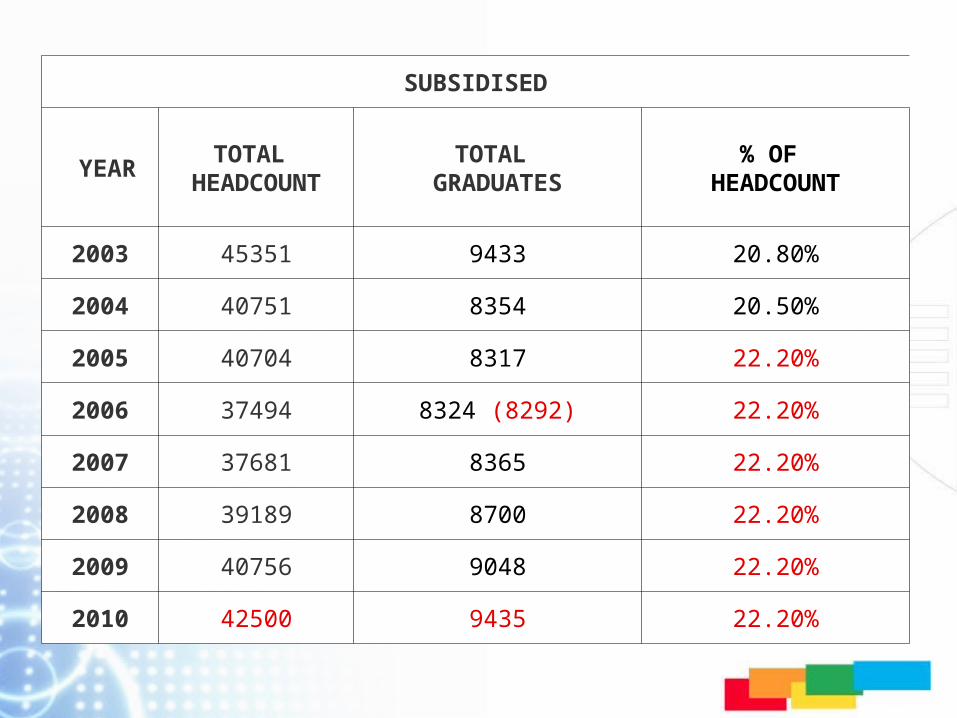
SUBSIDISED
YEARTOTAL
HEADCOUNTTOTAL
GRADUATES% OF
HEADCOUNT
2003 45351 9433 20.80%
2004 40751 8354 20.50%
2005 40704 8317 22.20%
2006 37494 8324 (8292) 22.20%
2007 37681 8365 22.20%
2008 39189 8700 22.20%
2009 40756 9048 22.20%
2010 42500 9435 22.20%

Conclusions Finalize discrepancies in the document Engage with the Deans on adjustments according
to the guidelines Advise the budgeting process and 3-5 year budget
plan Subsidy income projections Student fee income projections

Thank you …