ukmaib – msc napoli structural failure – january 2007 ... · pdf filenavy vessel,...
TRANSCRIPT

Annex A
Control of the main engine

CONTROL OF THE MAIN ENGINE
Control of the main engine speed while on passage, and on standbywhen leaving and entering port was normally from the bridge via theengine telegraph. However, during MSC Napoli’s passage fromFelixstowe to Antwerp, problems were experienced with the mainengine governor1, and it was disconnected. This required engine speedto be controlled by a fuel lever mounted on the side of the engine,which was an emergency method of operation.
A technician was not immediately available to repair the governor inAntwerp. Following discussions between the master, chief engineerand a technical superintendent which included the consideration of theexpected adverse conditions in the English Channel, it was decidedthat it was safe to sail without an operational main engine governor andto arrange for a technician to attend in Sines. The master and deckofficers were made aware that control of the engine was now from theengine room and they could order change of engine speed via thewheelhouse engine telegraph. The master assumed that control of theengine was now from the ECR and, as this was not an uncommonpractice on older ships, the master did not consider it necessary toinform the pilot when entering or departing Antwerp.
Although the vessel had an Unmanned Machinery Space (UMS)capability her engine room had been continually manned in port and atsea during the two months before the accident. The minimum watchcomplement consisted of an engineer officer and an engine rating.
On leaving the River Schelde engine speed was slowly increased to 82RPM, which normally produced a speed of 19 knots. When the shipstarted to pitch as the seas increased overnight, the engine speedbegan fluctuating as the propeller began to cavitate. In order to preventthe engine from over-speeding and tripping, the chief engineer orderedthe watch engineers to stay close to the engine fuel lever so they couldreact quickly to the fluctuations in engine speed. By early morning thewatch engineers were continually adjusting the fuel lever as thepropeller load reduced and the engine revolutions increased as thevessel pitched.
1 The main engine speed governor was an ABB Dego II, electronic speed controlsystem. The speed of the engine is picked up from the flywheel or the crankshaft andsent to the governor. The system will compare the speed setting with the speedsetting value, and will make any necessary adjustments via the fuel rack position.The governor derived engine speed is also used for main engine monitoring andcontrol.

At about 0600 the watch engineer informed the chief engineer that theengine revolutions were fluctuating wildly and a lower average RPMwas required to prevent the engine from tripping. The master wasinformed of the need to reduce speed to which he agreed after he hadassessed the situation from the bridge. The fuel lever was thenadjusted to a setting equating to an engine speed of about 71rpm, anda vessel speed of about 17 knots.
At about 0800, the engineer charged with monitoring the setting of thefuel lever “screwed down” the lever in a position which had generallyproduced an average engine speed of 71rpm. He then left the engineto undertake routine maintenance in other areas of the engine room.

Annex B
Crew details

VESSEL MANNING
MSC Napoli was conventionally manned with a master, chief, second,and third officers. The officers in the engineering departmentcomprised the chief engineer, first, second, and third assistantengineer officers, plus an electrician. The crew consisted of sevendeck, five engine and three galley ratings. There were also two officercadets onboard the vessel. Details of the ship’s senior officers were:
Master
The master was a Bulgarian national and initially served in theBulgarian naval fleet from 1983 to 1991. He joined his first merchantnavy vessel, a bulk carrier, in 1992. After sailing on various vesseltypes as a third and second officer, he was promoted to chief officer oncontainer vessels in 1998. He had sailed as chief officer on MSCNapoli in early 2002 and was promoted to master the same year. Hejoined MSC Napoli in late November 2006.
Chief officer
The chief officer was a Romanian national. He first went to sea in 2000as a deck cadet with a contract with Zodiac Maritime. He waspromoted to third officer in 2001 and, before joining MSC Napoli, hehad completed six contracts on board bulk carriers and containervessels, as a third and second officer. He joined MSC Napoli in earlyNovember 2006 for his first contract as a chief officer and had receiveda three day familiarisation handover period with his predecessor.
Chief Engineer
The chief engineer was a Bulgarian national. Following graduation froma naval academy, he joined his first merchant ship in 1984 and hadsailed on various ship types as an engineering officer. He waspromoted to chief engineer in 2000 and joined MSC Napoli in October2006.

Annex C
Conclusions of metallurgical tests
1
SUMMARY, RECOMMENDATIONS, OPINION ANDCONCLUSIONS IN RESPECT OF TWENTY-ONE SAMPLESREMOVED FROM THE FORWARD HALF OF THE CONTAINERSHIP mv MSC NAPOLI
Client:Marine Accident Investigation Branch
First Floor Carlton House Carlton Place Southampton SO15 2DZ
THE TEST HOUSE (CAMBRIDGE) LTD REPORT REFERENCE: T71927S1REPORT DATE: 1 April 2008
1. INTRODUCTION
The Test House had been instructed by the Marine AccidentInvestigation Branch (MAIB), to examine and test a set of eighteensamples removed from the forward half of the stricken container shipmv MSC NAPOLI. The factual findings from the laboratory work, whichhad been completed to a protocol agreed with owners and charterers,had been published separately in The Test House (TTH) laboratoryreport reference T71927. The contents of the engrossed factuallaboratory report had also been provided to the metallurgical expertsrepresenting the vessel owners and charterers.
A further three samples, which had been removed from the forward halfof the ship by the Vessel Charterers, were also examined by TTH. Theadditional three samples were examined under TTH job numberT80157 as instructed by Charterers, but with later inputs into the workscope from both Owners and TTH acting for MAIB.
The content of this expert’s report, which summarises the two earlierreferenced sets of laboratory test data and observations made duringattending the forward half of the vessel at Harland and Wolff on 23August 2007 and 5 February 2008, is prepared in confidence for theMAIB only.
2
2. SUMMARY
2.1 Inspection, at the Harland and Wolff dry-dock, of the transversebreakage site in the vessels forward recovered half identified noobvious visually apparent corrosion wastage of the steel structure.The transverse breakage site also appeared to be essentially freefrom significant visually apparent fatigue cracking damage.
2.2 The visually apparent fracture path in steel plating appeared tobe largely ductile in nature. The breakage also included fracturethrough the throats of fillet welds attaching internal structuralmembers, and this was particularly so at sites of discontinuouslongitudinal stiffening.
2.3 To confirm the correctness of construction materials and verifythe quality and size of construction fillet welds, a series of sampleswere removed to represent both the parent steel plating andconstruction welding. The sample set specifically included piecesfrom areas exhibiting characteristic differences in either the visuallyapparent mode of fracture or the apparent weld size and detail.
2.4 The steel plating used in construction of the vessel, we wereadvised, was of either Grade A or the tougher and stronger GradeAH32. Twelve samples from parent steel plates were chemicallyanalysed and their conformity to specified grades reviewed.
2.5 The population of steel plates include a number of parent steelcasts, all of which appeared to be silicon killed aluminium treatedand consistent with high quality hot metal practice type virgin steel.The Grade A steel casts had been produced as plain carbon steel,in contrast with the AH32 steel casts which were of Carbon-Manganese type. The analysis of three pieces (PTF2 Floor, PTFL3Tank Top and PTFL3 Floor) was consistent with the higher strengthGrade AH32 material having been substituted for the specifiedGrade A. In the case of the CL5 girder, a plain carbon steel Grade Atype material had been substituted for what should have been astronger and tougher AH32 material.
2.6 The tensile tests of the parent steel plates also confirmed thatsome grade substitution had occurred in the build process, and thetests results followed those of the analysis findings. Three samples(PTF2 Floor, PTFL3 Tank Top and PTFL3 Floor) were over strengthfor the specified grade A, but met the requirements of the strongerAH32 grade. The CL5 girder sample exhibited a proof stress of only254 N/mm2, which failed to meet the minimum AH32 specified proofstress of 315 N/mm2 in the specified transverse test direction. TheUltimate Tensile Strength (UTS) of the CL5 girder plate, however,met the higher AH32 minimum UTS in both test directions
3
2.7 The Single set of Charpy toughness specimen removed from thePBS8 piece just met the minimum AH32 grade toughnessrequirements at the specified test temperature of zero degrees C.The significantly higher prevailing metal temperature at the time ofthe casualty would, however, have given a greater margin ontoughness than was implied by the laboratory test completed.
2.8 Thickness measurements recorded for the first fourteen piecesreceived by the laboratory were generally in line with specifiedrequirements, and the sample PTF2 transverse floor plate wasconfirmed to contain the additional 4mm of thickness requested byoriginal owners.
2.9 Weld metal hardness characterisation values from the first batchof samples appeared reasonably consistent and were in the generalproperty range we would expect them to be. A number of jointsexhibited a small difference in average values for the includedwelds and some exhibited possible evidence of casualty relatedstrain damage (work hardening).
2.10 The more detailed hardness surveys completed on theCharterers three samples identified a wide range of both weld metaland Heat Affected Zone (HAZ) hardness, the recorded valuesreflecting the apparent wide differences in the apparent weldingprocedures and heat input in particular. One weld toe HAZ insample PBS21-B included two hardness readings that were overHV350. The presence of such apparently high hardness readingsand an apparently earlier HAZ suggested that the joint had beenlocally repositioned using an unacceptable weld procedure.
2.11 The two cruciform type tensile test specimens producedrespectably high weld metal UTS values. The value obtained for theCL15 piece was the highest, and this had been achieved eventhough the fractured weld metal of this specimen exhibited asignificant volume of worm-hole type root porosity.
2.12 The fillet welding in the original sample set of eighteen piecesappeared variable in terms of its profile and weld sizes at a givenjoint. All fillet welds exhibited leg lengths greater than the minimumblanket specified size of 5mm. Some fillets, in samples from piecesPTFL3, CL5, ST11, CL15, SLG16 and SLG17, were potentially verymarginally under the minimum location specific required size. TheMAIB is recommended to review the aspect and implications inrespect of the reported weld sizes with its Naval Architects
2.13 Within the original sample set of eighteen pieces a number ofstructural joints were found to have been either repositioned orlocally weld repaired. The samples containing repositioned joints orlocal weld repairs comprised pieces PTFL3, STL7, STL11, SB14,and SLG16.
4
2.14 Visual or metallographic evidence of joint repositioning or localweld repairs was apparent in all three of the Charterers additionalthree samples SG1-19, SG1-20 and BPS21.
2.15 Though the bulk of the plate fractures were entirely ductile innature, some evidence of fast running brittle fracture was apparentin the two fractures contained within sample PBS8. The Charpytoughness of the PBS8 parent steel plate met the AH 32 minimumrequirement at a test temperature significantly lower than wouldhave prevailed at the time of the casualty; consequently it is likelythat the rate of loading was the fracture mode determining issue atthis vessel location. The fracture at this location was also thought tohave followed critical structural failures at other locations of theship.
2.16 The samples examined were confirmed to be largely free fromsignificant fatigue cracking. A definite short sub-critical fatigue crackwas confirmed to have originated from the lightening hole in samplePTFL3. A number of other incipient and shallow probable fatiguecracks were present in a number of the macro specimens. Thecracks were not considered to be significant, they could not beaccurately aged and arguably could have originated post casualty.
3. CONCLUSIONS DISCUSSION AND OPINION
Based on our limited inspections of the forward half of the MSCNAPOLI at the Harland and Wolff dry-dock, we concluded that at thelocation of transverse fracture the vessel was visually free from bothsignificant corrosion wastage and fatigue cracking. The detailedlaboratory examination of both the original eighteen samples and anadditional three Charterers samples subsequently removed from thevessel, served to further confirm a freedom from both significantcorrosion wastage and fatigue cracking at the time of the casualty.
We are not, unfortunately, able to identify the initiation site, or sites, ofthe vessels critical structural failure, and similarly our inspections andtests have not identified an obvious cause of the shell plate bucklingcollapse and fractures.
The vessels plating was found to be largely as specified, or better, interms of grade and strength, and there was no evidence to suggest thatthe construction steel lacked the necessary toughness.
The fillet welding of internal structural members appeared variable interms of its depositional procedure, profile and achieved weld sizes.Local weld repairs or repositioning of structural joints was apparent infive of the original samples and in all three of the Charterers samples.The age of the repositioning or repairs could not be established in the
5
case of five samples and they could, consequently, be associated withoriginal shipyard construction welding.
Three of the samples did, however, exhibit evidence consistent with therepairs or joint repositioning having been completed after a period ofpost build service of the ship. Piece STL11 exhibited a fatigue crackthat had initiated from a region of weld metal exhibiting pre-existingcentre bead segregation, or liquation type hot cracking. The lowerfatigue portion of the crack, by contrast, contained an in-situ corrosionproduct consistent with its formation in a marine environment.Collectively, the evidence suggested that a solidification defect hadbeen present in the throat of the original construction weld. The crackhad grown by a mechanism of fatigue and been open to the elements,during which time the lower crack regions had suffered corrosion. Thecrack had then been partly excavated and a capping weld run appliedover the previously open and corroded crack. The tank top connectionin piece SG1-20 exhibited both repositioning of the weld and localdisturbance of the tank coating, which was again consistent with therepositioning or repairs having been completed some time after thevessel had entered service. The weld in bottom plate sample BPS21also exhibited evidence of repair welding or stiffener repositioning aftera period of in service corrosion. The original fillet weld had initiatedlamellar tearing in the bottom plating HAZ, after which the joint hadbeen repositioned and re-welded. After the repositioning, the weld rootarea had suffered a period of heavy corrosion, before the joint root wasagain sealed with an additional stringer bead of weld metal.
The apparent widespread evidence of local repair welding, some ofwhich was clearly and demonstrably post build, would suggest thatthere had been earlier local structural integrity problems and issues inrespect of fillet weld integrity in particular. The number of repositionedor repaired fillet welds and the apparently indiscriminate local use ofvertically-up positional welding were similarly seen as inconsistent withoriginal construction practice.
Though there was evidence of post delivery repair welding to structuralmembers, it was not possible from the metallurgical evidence, toestablish an age or the period of vessel ownership during which therepairs had been completed.
The apparent need to complete structural weld repairs after the shiphad entered service suggested that there were possible design andlocal structural joint loading issues. The cracking should have flagged-up a possible structural weakness and represented an opportunity, oropportunities, to consider the suitability of the basic design and localstructural integrity. The apparent absence of any records in respect ofthe weld repairs would appear to represent both a possible reportingdeficiency and a missed opportunity to identify any potential localdesign weakness.

6
Though not thought to be casualty critical, a number of the fillet weldsexamined macrographically were found to be potentially verymarginally under the specified minimum required size. The MAIB areconsequently advised to review the aspect of fillet weld sizes with itsNaval Architects.
The cross cruciform joint strength was found on test to be significantlybetter than we would have expected to see in shipyard constructionfillet welding, and the weld strength was not significantly compromisedby the presence of widespread welding defects. This latter observationin respect of the achieved cross joint strength may in reality havenegated any small potential shortfall in weld size.
We conclude that the vessels failure was not attributable to anyidentifiable material or metallurgical deficiencies or issues and thatsteel work was thought to have been in good order, in terms of freedomfrom both corrosion wastage and significant fatigue cracking, at thetime of the casualty. The MAIB is consequently advised to look for acause of the casualty in the vessels Naval Architecture, operation, orboth.

Annex D
Det Norske Veritas report on load and strength assessment
TECHNICAL REPORT
DET NORSKE VERITAS AS
DET NORSKE VERITAS AS
MARITIME TECHNOLOGY AND PRODUCTION CENTRE
MSC NAPOLI REPORT
LOAD AND STRENGTH ASSESSMENTS 18 JANUARY 2007 INCIDENT
REPORT NO. 2007-1928 REVISION NO. 00

DET NORSKE VERITAS
Page -1 Report No. 2007 - 1928, Rev. No. 00
Table of Content Page
1 INTRODUCTION ....................................................................................................................2
1.1 General 2 1.1.1 Objective 2 1.1.2 Input data and main assumptions 4 1.1.3 Method 4 1.1.4 Report content 5
2 SHIP MAIN DATA ..................................................................................................................6
2.1 General 6
2.2 Main Dimensions and General data 6
3 METHOD OF ANALYSES - OVERALL................................................................................8
4 WAVE LOAD ANALYSIS......................................................................................................9
4.1 General 9
4.2 Wave load sensitivity study 10
4.3 Hull girder load assessment for the incident 11 4.3.1 Ship loading condition – onboard loading computer 11 4.3.2 Environmental data – definition of sea states for wave load analyses 11 4.3.3 Wave load assessments 13 4.3.4 Whipping effects 14 4.3.5 Load results summary 15
5 LINEAR STRESS ANALYSES.............................................................................................17
5.1 Basic model description 17
5.2 Results 18
6 NON-LINEAR ANALYSES – COLLAPSE AND FAILURE ASSESSMENTS..................21
6.1 Model description 21 6.1.1 Mesh density and properties 22 6.1.2 Geometrical shape imperfections (tolerances) 25 6.1.3 Material properties and yield stress variations 26 6.1.4 Load applications 28
6.2 Results 28 6.2.1 General 28 6.2.2 Hull girder capacity 29 6.2.3 Hull girder failure mechanism 30
7 SUMMARY............................................................................................................................32
7.1 General 32
7.2 Discussion 33
REFERENCES.......................................................................................................................................34
DET NORSKE VERITAS
Page -2 Report No. 2007 - 1928, Rev. No. 00
1 INTRODUCTION
1.1 General
On request by DNV Maritime/Technical Director, the Section for Hydrodynamics, Structures and Stability has carried out a wave load and strength assessment of the 4400 TEU Container Vessel, MSC Napoli, DNV id. no. 24568.
The background is the incident that took place in French waters 70km south-east of the Lizard Point in the English Channel at about 10.30 am, on the 18th of January 2007.
1.1.1 Objective
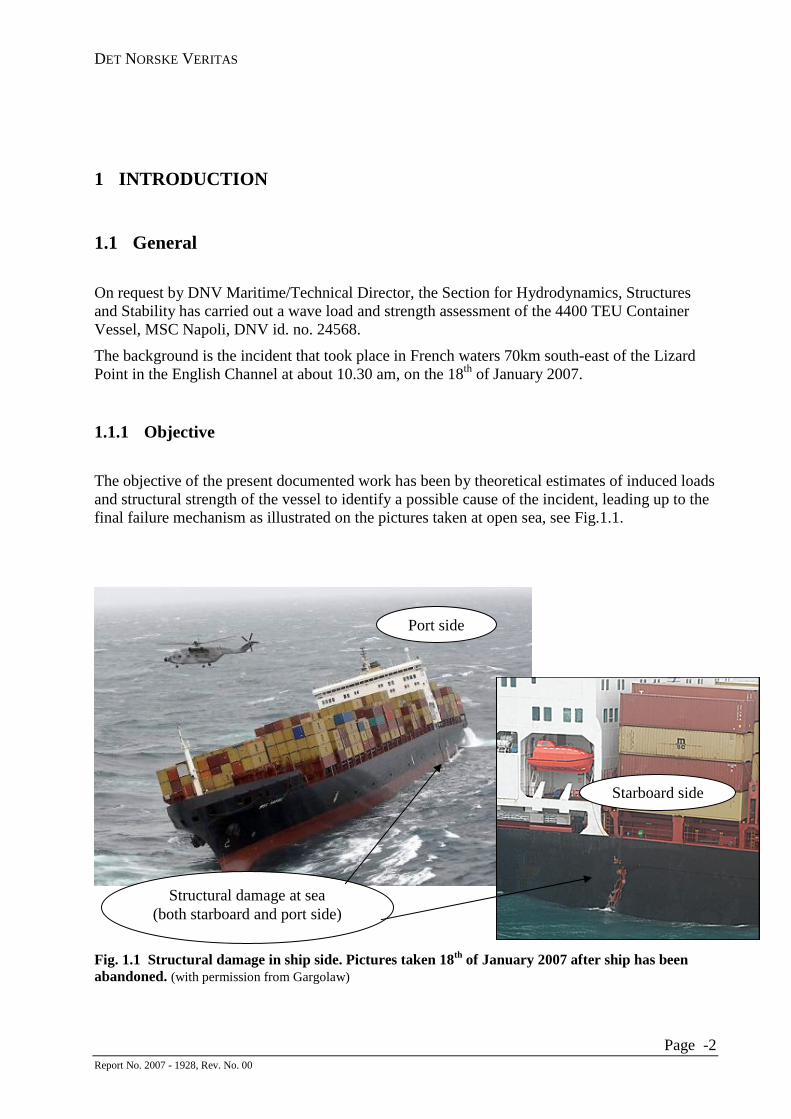
The objective of the present documented work has been by theoretical estimates of induced loads and structural strength of the vessel to identify a possible cause of the incident, leading up to the final failure mechanism as illustrated on the pictures taken at open sea, see Fig.1.1.
Fig. 1.1 Structural damage in ship side. Pictures taken 18th of January 2007 after ship has been abandoned. (with permission from Gargolaw)
Structural damage at sea (both starboard and port side)
Port side
Starboard side
DET NORSKE VERITAS
Page -3 Report No. 2007 - 1928, Rev. No. 00
The first step was to go through ship records to see if any relevant information from previous incidents could be of interest. The most relevant information found was a grounding accident on the Helene Mar Reef in Singapore Strait in 2001, with damages in the forward half of the vessel. This case was assessed to see if there could be possible links to the present incident. Simple grounding simulations and theoretical strength assessments were carried out concluding that no such links were likely and the 2001 grounding was ruled out as a possible implicit cause to actual 2007 incident.
Other failure scenarios related to fatigue, engine vibrations etc. have been evaluated but not found relevant for this incident and therefore not documented herein.
Documented scenario:
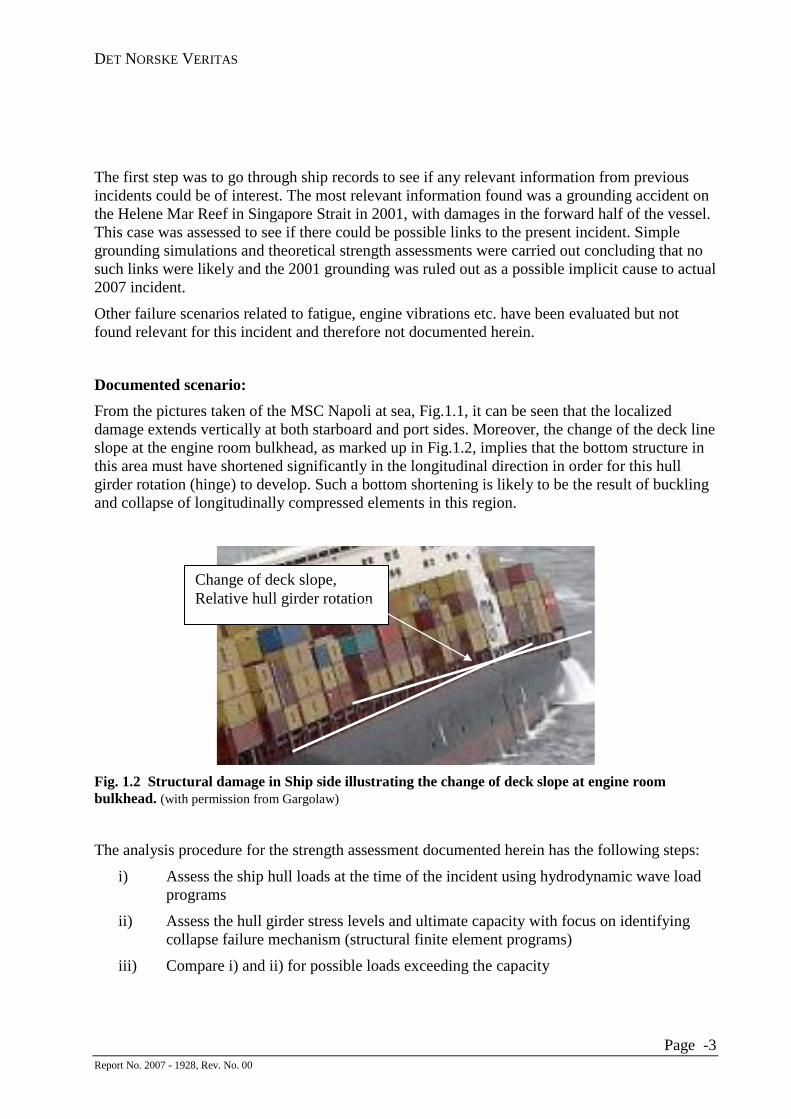
From the pictures taken of the MSC Napoli at sea, Fig.1.1, it can be seen that the localized damage extends vertically at both starboard and port sides. Moreover, the change of the deck line slope at the engine room bulkhead, as marked up in Fig.1.2, implies that the bottom structure in this area must have shortened significantly in the longitudinal direction in order for this hull girder rotation (hinge) to develop. Such a bottom shortening is likely to be the result of buckling and collapse of longitudinally compressed elements in this region.
Fig. 1.2 Structural damage in Ship side illustrating the change of deck slope at engine room bulkhead. (with permission from Gargolaw)
The analysis procedure for the strength assessment documented herein has the following steps:
i) Assess the ship hull loads at the time of the incident using hydrodynamic wave load programs
ii) Assess the hull girder stress levels and ultimate capacity with focus on identifying collapse failure mechanism (structural finite element programs)
iii) Compare i) and ii) for possible loads exceeding the capacity
Change of deck slope, Relative hull girder rotation

DET NORSKE VERITAS
Page -4 Report No. 2007 - 1928, Rev. No. 00
The main focus is on the hull sections in way of the engine room area, from around sea chest area (# 81) to engine room bulkhead (#88) since this area covers the collapsed hull plates with cracks, as seen and documented in Fig.1.1 above.
1.1.2 Input data and main assumptions
An important assumption and input for the analyses has been the actual loading condition and longitudinal mass distribution for the vessel at the time of the incident. In this respect, the data from the onboard loading computer as provided by MAIB-UK, has been used, ref./1/.
Environmental data like wave heights, wave periods etc. at the location and time of the incident also constitutes an important input to the wave load simulations. Thus a broad collection of data from different sources such as the media, Ocean Systems Incorporated (OSI), Argoss, UK Met office and others was initiated.
Based on these data and considering variation of the reported parameters, two relevant sea states were chosen (“high” and “low”) and both analysed with respect to hull girder sectional loads in way of the engine room area (#88), see Chapter 4 for more details.
The basis and main assumptions for the linear (SESAM) and non-linear (ABAQUS) structural finite element (FE) models are
- scantlings with “as built” dimensions
- no corrosion margins deducted
- FE model made according to drawings provided by builder
- normal fabrication tolerances implemented as geometrical imperfections in the non-linear structural analyses (ABAQUS)
1.1.3 Method
The computer analyses presented herein have three main elements:
i) Hydrodynamic wave load analyses using DNV’s tool WASIM, ref./2/ ii) Global FE linear stress analyses of complete ship with a standard element mesh for
most of the ship hull, and with a fine mesh model in engine room area (#64 - #106), see Fig. 5.1 and Fig. 5.2. The linear stress analyses is done using DNV’s SESAM FE system, ref./2/
iii) Advanced non-linear stress and ultimate capacity analyses: Global FE model with non-linear (ABAQUS) sub-model i.w.o. engine room ( #79 - # 92 ), ref./3/.
DET NORSKE VERITAS
Page -5 Report No. 2007 - 1928, Rev. No. 00
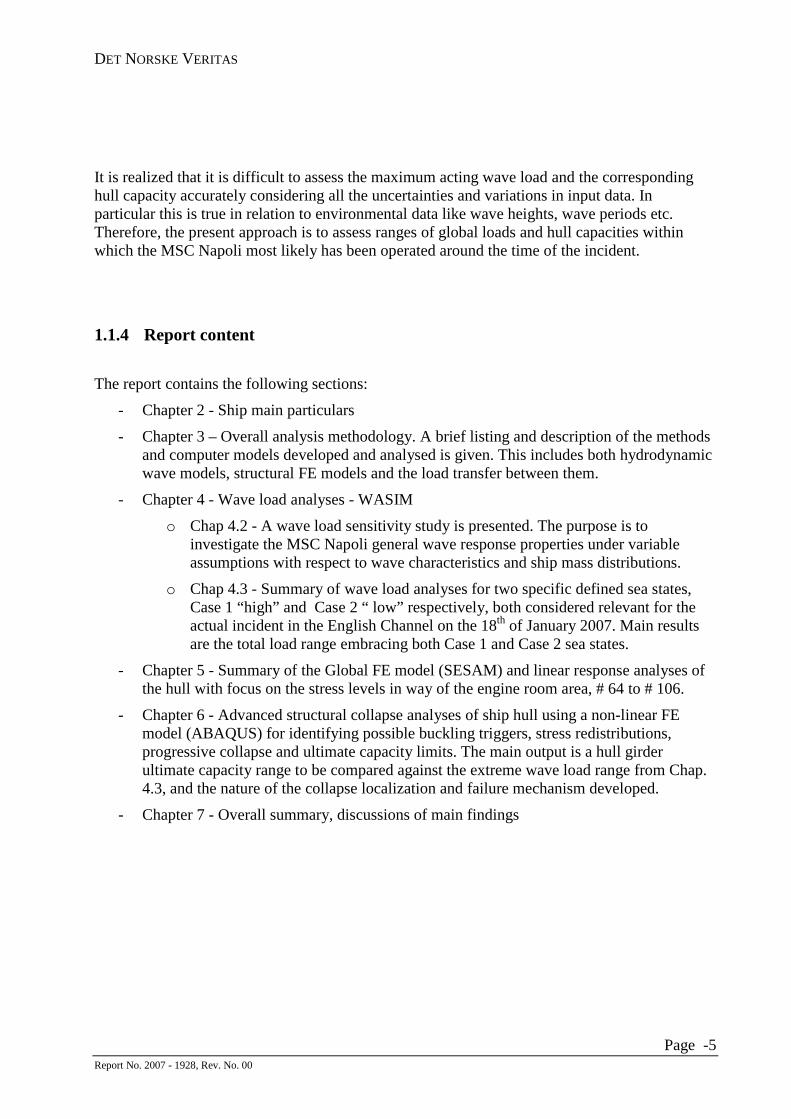
It is realized that it is difficult to assess the maximum acting wave load and the corresponding hull capacity accurately considering all the uncertainties and variations in input data. In particular this is true in relation to environmental data like wave heights, wave periods etc. Therefore, the present approach is to assess ranges of global loads and hull capacities within which the MSC Napoli most likely has been operated around the time of the incident.
1.1.4 Report content
The report contains the following sections:
- Chapter 2 - Ship main particulars
- Chapter 3 – Overall analysis methodology. A brief listing and description of the methods and computer models developed and analysed is given. This includes both hydrodynamic wave models, structural FE models and the load transfer between them.
- Chapter 4 - Wave load analyses - WASIM
o Chap 4.2 - A wave load sensitivity study is presented. The purpose is to investigate the MSC Napoli general wave response properties under variable assumptions with respect to wave characteristics and ship mass distributions.
o Chap 4.3 - Summary of wave load analyses for two specific defined sea states, Case 1 “high” and Case 2 “ low” respectively, both considered relevant for the actual incident in the English Channel on the 18th of January 2007. Main results are the total load range embracing both Case 1 and Case 2 sea states.
- Chapter 5 - Summary of the Global FE model (SESAM) and linear response analyses of the hull with focus on the stress levels in way of the engine room area, # 64 to # 106.
- Chapter 6 - Advanced structural collapse analyses of ship hull using a non-linear FE model (ABAQUS) for identifying possible buckling triggers, stress redistributions, progressive collapse and ultimate capacity limits. The main output is a hull girder ultimate capacity range to be compared against the extreme wave load range from Chap. 4.3, and the nature of the collapse localization and failure mechanism developed.
- Chapter 7 - Overall summary, discussions of main findings
DET NORSKE VERITAS
Page -6 Report No. 2007 - 1928, Rev. No. 00
2 SHIP MAIN DATA
2.1 General
The basis for the computer analyses herein are ship drawing as provided by builder January 2007.
2.2 Main Dimensions and General data
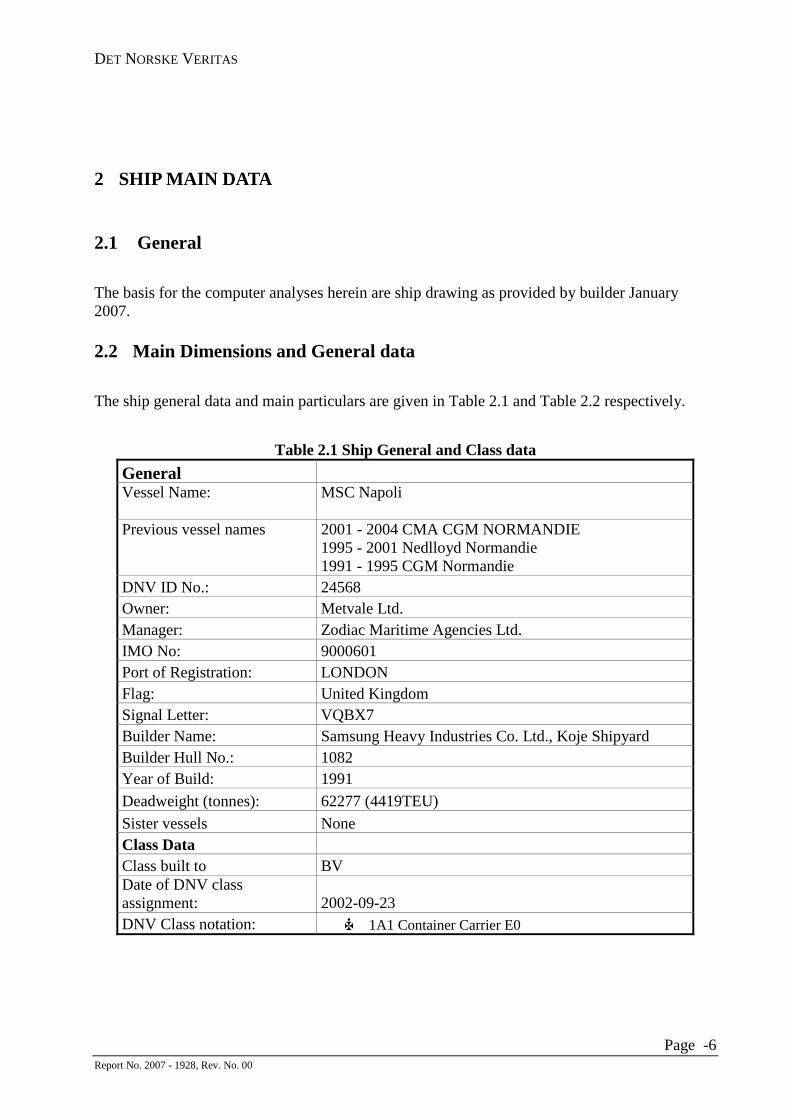
The ship general data and main particulars are given in Table 2.1 and Table 2.2 respectively.
Table 2.1 Ship General and Class data
General Vessel Name: MSC Napoli
Previous vessel names 2001 - 2004 CMA CGM NORMANDIE
1995 - 2001 Nedlloyd Normandie 1991 - 1995 CGM Normandie
DNV ID No.: 24568 Owner: Metvale Ltd. Manager: Zodiac Maritime Agencies Ltd. IMO No: 9000601 Port of Registration: LONDON Flag: United Kingdom Signal Letter: VQBX7 Builder Name: Samsung Heavy Industries Co. Ltd., Koje Shipyard Builder Hull No.: 1082 Year of Build: 1991
Deadweight (tonnes): 62277 (4419TEU)
Sister vessels None Class Data Class built to BV Date of DNV class assignment: 2002-09-23
DNV Class notation: 1A1 Container Carrier E0
DET NORSKE VERITAS
Page -7 Report No. 2007 - 1928, Rev. No. 00
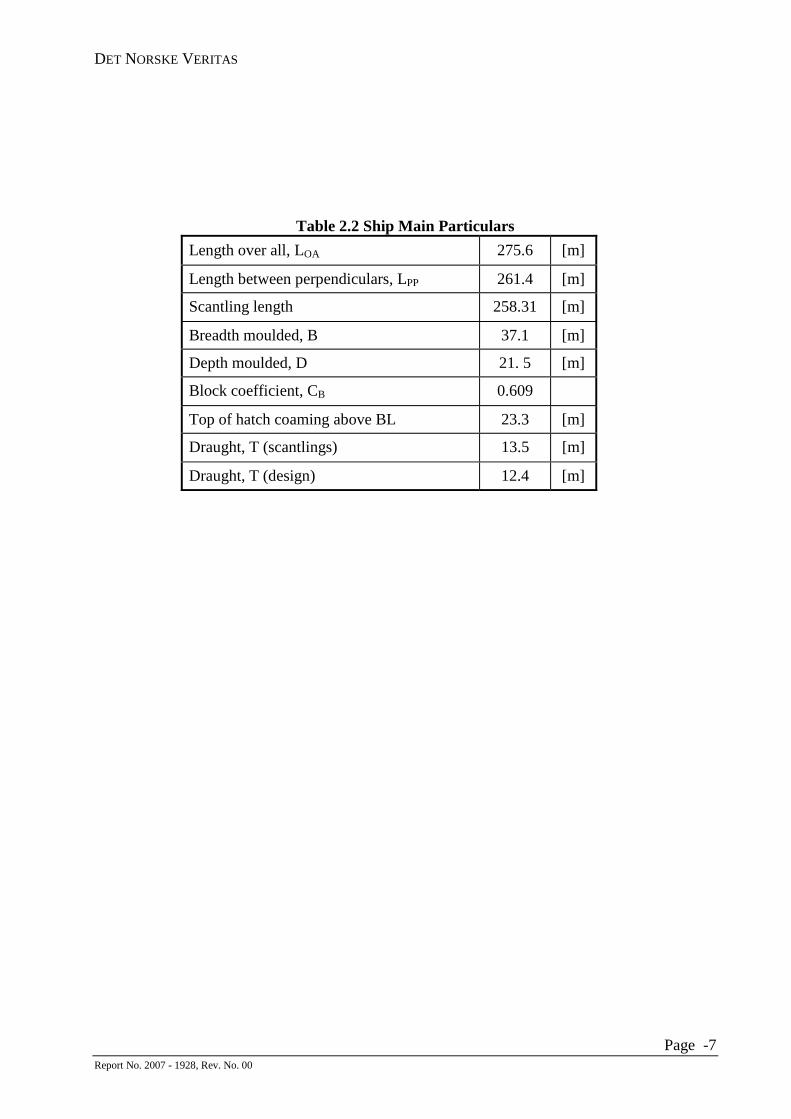
Table 2.2 Ship Main Particulars
Length over all, LOA 275.6 [m]
Length between perpendiculars, LPP 261.4 [m]
Scantling length 258.31 [m]
Breadth moulded, B 37.1 [m]
Depth moulded, D 21. 5 [m]
Block coefficient, CB 0.609
Top of hatch coaming above BL 23.3 [m]
Draught, T (scantlings) 13.5 [m]
Draught, T (design) 12.4 [m]
DET NORSKE VERITAS
Page -8 Report No. 2007 - 1928, Rev. No. 00
3 METHOD OF ANALYSES - OVERALL
Different analysis tools have been used in order to assess the loads and hull strength. The stability program system NAPA, ref./4/ has been used for the hydrostatic and still water load assessments while the DNV- WASIM hydrodynamic software package has been used for the wave load assessments, ref./2/. The DNV-SESAM FE program suite has been used for the linear stress analyses, ref./2/, and the non-linear finite element program ABAQUS, ref./3/ for the non-linear collapse, failure and capacity assessments.
A brief description of the adopted methods and computer models developed are given below:
i) Still-water loads. The hydrostatic properties of the vessel are established using the NAPA software suite. The basis is the loading condition logged on the onboard loading computer before the incident, ref./1/.
ii) Wave loads. Wave loads are assessed using the DNV-WASIM hydrodynamic software package, ref. /2/. Wave load ranges are assessed for two set of environmental conditions referred to a as Case 1 “high” and Case 2 “low”. Based on these results a total load range is identified, which includes Case 1 and Case 2. Both sea states are considered relevant and based on the available metrological data around the time of the incident. The wave load procedure has two steps:
a) Linear wave load estimates. This approach follows well established procedures assuming Rayleigh distributed wave loads for the short term statistics. Thus probability distributions for the wave loads at the engine room bulkhead (# 88) are found for the two defined sea states separately.
b) Non-linear load estimates. For slender ships like container vessels the linear ratio between hull response and wave amplitude is violated due to non-linear effects from large wave amplitudes in interaction with the hull shape. WASIM provides non-linear assessments of the hull bending moment using time series analyses in irregular sea states.
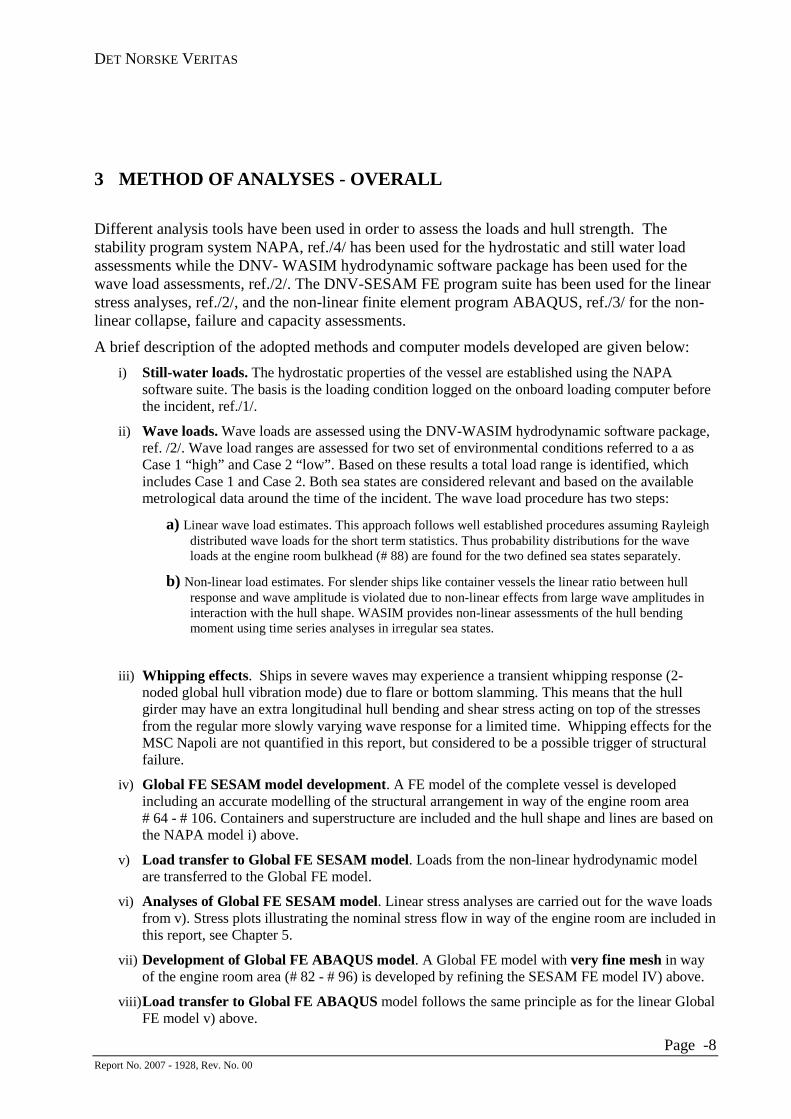
iii) Whipping effects. Ships in severe waves may experience a transient whipping response (2-noded global hull vibration mode) due to flare or bottom slamming. This means that the hull girder may have an extra longitudinal hull bending and shear stress acting on top of the stresses from the regular more slowly varying wave response for a limited time. Whipping effects for the MSC Napoli are not quantified in this report, but considered to be a possible trigger of structural failure.
iv) Global FE SESAM model development. A FE model of the complete vessel is developed including an accurate modelling of the structural arrangement in way of the engine room area # 64 - # 106. Containers and superstructure are included and the hull shape and lines are based on the NAPA model i) above.
v) Load transfer to Global FE SESAM model. Loads from the non-linear hydrodynamic model are transferred to the Global FE model.
vi) Analyses of Global FE SESAM model. Linear stress analyses are carried out for the wave loads from v). Stress plots illustrating the nominal stress flow in way of the engine room are included in this report, see Chapter 5.
vii) Development of Global FE ABAQUS model. A Global FE model with very fine mesh in way of the engine room area (# 82 - # 96) is developed by refining the SESAM FE model IV) above.
viii) Load transfer to Global FE ABAQUS model follows the same principle as for the linear Global FE model v) above.

DET NORSKE VERITAS
Page -9 Report No. 2007 - 1928, Rev. No. 00
ix) Global FE ABAQUS analyses. The complete global FE model is imported into the ABAQUS program and analysed for non-linear structural response, hull girder ultimate capacity and failure mechanism identification. The Global FE ABAQUS model is analysed by scaling the wave loads until the hull girder collapse limit has been identified. Several non-linear analyses are carried out in order to find a range in the hull girder capacity reflecting possible uncertainties and variations in material yield stresses.
4 WAVE LOAD ANALYSIS
4.1 General
The wave conditions around the time of the incident constitute a significant source of uncertainty. In the present assessments data have been logged and analysed from different sources such as the media, Ocean Systems Incorporated (OBI), Argos and the UK Met office.
The data have been carefully examined and evaluated in order to define realistic environmental parameters to be used as input for the WASIM wave load assessment. These analyses have been carried out in the following steps:
- Chapter 4.2 - Wave sensitivity study: Systematic variation of environmental and ship loading parameters in order to quantify the MSC Napoli general wave response characteristics
- Chapter 4.3 - Hull load assessment applicable for the incident
o Chapter 4.3.1 Loading condition at departure River Schelde, Antwerp 17th of January: Description of loading condition as logged by onboard loading computer, ref. /1/.
o Chapter 4.3.2 Environmental data – definition of sea states for wave analyses. Two sea states, Case 1 “high” and Case 2 “low” are defined, both considered relevant and based on actual environmental data as reported around the time of the incident 18th of January.
o Chapter 4.3.3 Wave load assessments. Wave load ranges of vessel for the two defined sea states Case 1 “high” and Case 2 “low” are documented. A total load range including both Case 1 and Case 2 is defined, Table 4.3.
o Chapter 4.3.4 Whipping effects. A discussion of the whipping phenomena in general terms and its relevance for MSC Napoli incident.
DET NORSKE VERITAS
Page -10 Report No. 2007 - 1928, Rev. No. 00
4.2 Wave load sensitivity study
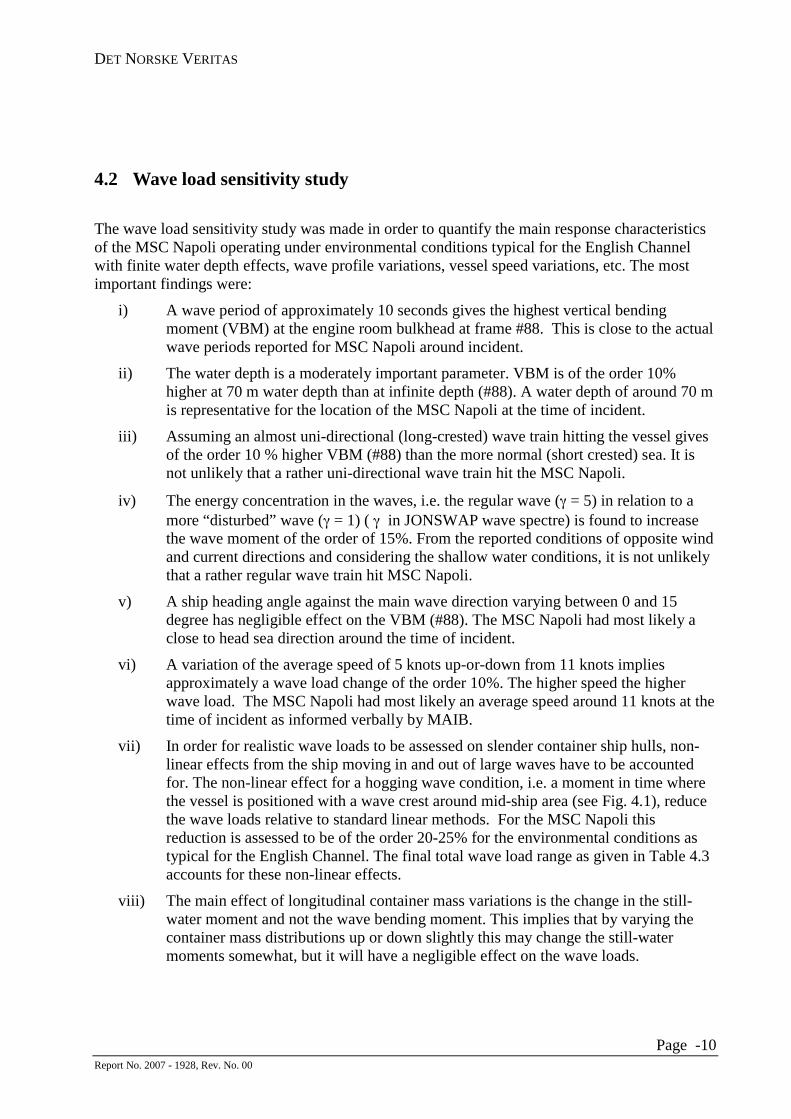
The wave load sensitivity study was made in order to quantify the main response characteristics of the MSC Napoli operating under environmental conditions typical for the English Channel with finite water depth effects, wave profile variations, vessel speed variations, etc. The most important findings were:
i) A wave period of approximately 10 seconds gives the highest vertical bending moment (VBM) at the engine room bulkhead at frame #88. This is close to the actual wave periods reported for MSC Napoli around incident.
ii) The water depth is a moderately important parameter. VBM is of the order 10% higher at 70 m water depth than at infinite depth (#88). A water depth of around 70 m is representative for the location of the MSC Napoli at the time of incident.
iii) Assuming an almost uni-directional (long-crested) wave train hitting the vessel gives of the order 10 % higher VBM (#88) than the more normal (short crested) sea. It is not unlikely that a rather uni-directional wave train hit the MSC Napoli.
iv) The energy concentration in the waves, i.e. the regular wave (γ = 5) in relation to a more “disturbed” wave (γ = 1) ( γ in JONSWAP wave spectre) is found to increase the wave moment of the order of 15%. From the reported conditions of opposite wind and current directions and considering the shallow water conditions, it is not unlikely that a rather regular wave train hit MSC Napoli.
v) A ship heading angle against the main wave direction varying between 0 and 15 degree has negligible effect on the VBM (#88). The MSC Napoli had most likely a close to head sea direction around the time of incident.
vi) A variation of the average speed of 5 knots up-or-down from 11 knots implies approximately a wave load change of the order 10%. The higher speed the higher wave load. The MSC Napoli had most likely an average speed around 11 knots at the time of incident as informed verbally by MAIB.
vii) In order for realistic wave loads to be assessed on slender container ship hulls, non-linear effects from the ship moving in and out of large waves have to be accounted for. The non-linear effect for a hogging wave condition, i.e. a moment in time where the vessel is positioned with a wave crest around mid-ship area (see Fig. 4.1), reduce the wave loads relative to standard linear methods. For the MSC Napoli this reduction is assessed to be of the order 20-25% for the environmental conditions as typical for the English Channel. The final total wave load range as given in Table 4.3 accounts for these non-linear effects.
viii) The main effect of longitudinal container mass variations is the change in the still-water moment and not the wave bending moment. This implies that by varying the container mass distributions up or down slightly this may change the still-water moments somewhat, but it will have a negligible effect on the wave loads.

DET NORSKE VERITAS
Page -11 Report No. 2007 - 1928, Rev. No. 00
4.3 Hull girder load assessment for the incident
4.3.1 Ship loading condition – onboard loading computer
The loading condition used herein is based on the on-board loading computer data at departure River Schelde Antwerp, ref. /1/. The still-water loads for this loading condition are summarized in Table 4.1 below, giving both the vertical hogging bending moment (VBMSW) and corresponding shear force (VSFSW) at the engine room bulkhead position (#88).
Table 4.1 Still-water loads (NAPA) at engine room bulkhead (# 88)
Loading condition Still-water moment (MNm)
Hogging VBMSW
Still-water shear force (MN)
VSFSW
Departure River Schelde, ref./1/ 2243 20
4.3.2 Environmental data – definition of sea states for wave load analyses
The wave and environmental conditions around the time of the incident constitute a significant source of uncertainty and the available reports from different metrological offices give rather large variations in data. However, in order to assess wave loads some basic assumptions regarding wave heights, wave periods, water depth, vessel speed etc are needed. Based on a thorough examination of the existing data, judgement of possible sources of uncertainties and using in-house experience in combination with the wave sensitivity output result from Chap. 4.2, two sea states were defined:
1) Case 1 “high””
2) Case 2 “low”
The complete set of environmental parameters used for each of the two sea states are summarized in Table 4.2 below.
DET NORSKE VERITAS
Page -12 Report No. 2007 - 1928, Rev. No. 00
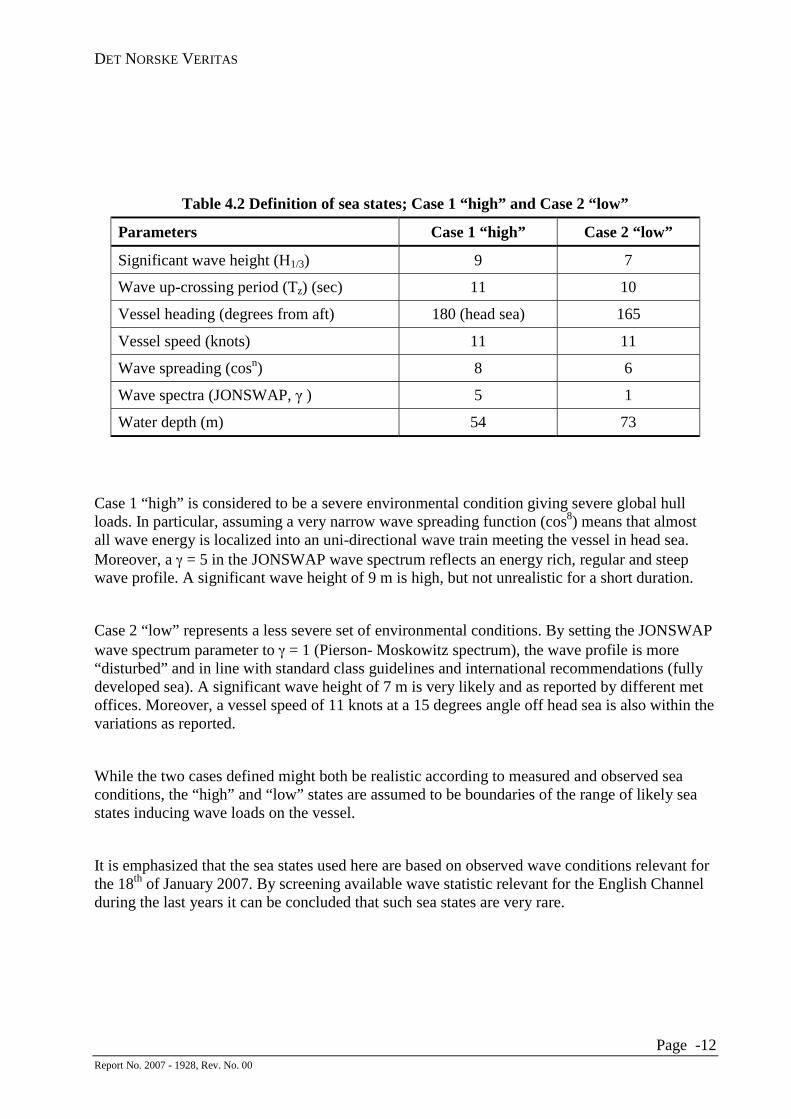
Table 4.2 Definition of sea states; Case 1 “high” and Case 2 “low”
Parameters Case 1 “high” Case 2 “low”
Significant wave height (H1/3) 9 7
Wave up-crossing period (Tz) (sec) 11 10
Vessel heading (degrees from aft) 180 (head sea) 165
Vessel speed (knots) 11 11
Wave spreading (cosn) 8 6
Wave spectra (JONSWAP, γ ) 5 1
Water depth (m) 54 73
Case 1 “high” is considered to be a severe environmental condition giving severe global hull loads. In particular, assuming a very narrow wave spreading function (cos8) means that almost all wave energy is localized into an uni-directional wave train meeting the vessel in head sea. Moreover, a γ = 5 in the JONSWAP wave spectrum reflects an energy rich, regular and steep wave profile. A significant wave height of 9 m is high, but not unrealistic for a short duration.
Case 2 “low” represents a less severe set of environmental conditions. By setting the JONSWAP wave spectrum parameter to γ = 1 (Pierson- Moskowitz spectrum), the wave profile is more “disturbed” and in line with standard class guidelines and international recommendations (fully developed sea). A significant wave height of 7 m is very likely and as reported by different met offices. Moreover, a vessel speed of 11 knots at a 15 degrees angle off head sea is also within the variations as reported.
While the two cases defined might both be realistic according to measured and observed sea conditions, the “high” and “low” states are assumed to be boundaries of the range of likely sea states inducing wave loads on the vessel.
It is emphasized that the sea states used here are based on observed wave conditions relevant for the 18th of January 2007. By screening available wave statistic relevant for the English Channel during the last years it can be concluded that such sea states are very rare.
DET NORSKE VERITAS
Page -13 Report No. 2007 - 1928, Rev. No. 00
4.3.3 Wave load assessments
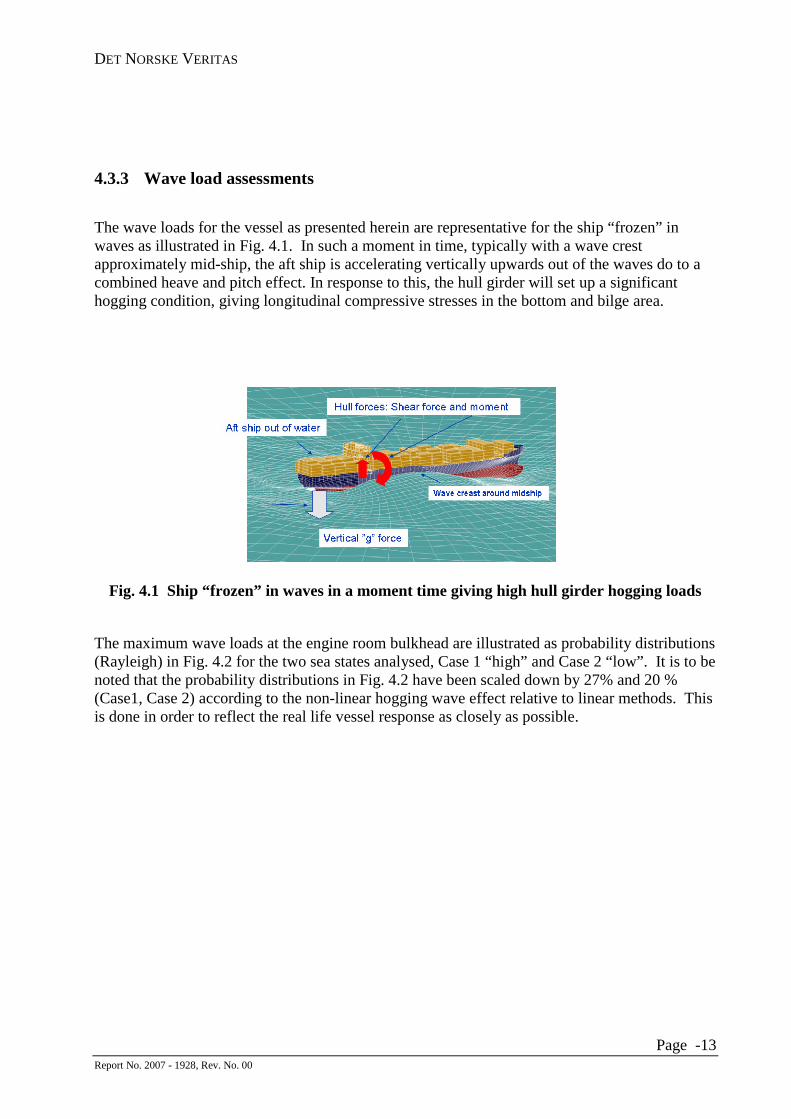
The wave loads for the vessel as presented herein are representative for the ship “frozen” in waves as illustrated in Fig. 4.1. In such a moment in time, typically with a wave crest approximately mid-ship, the aft ship is accelerating vertically upwards out of the waves do to a combined heave and pitch effect. In response to this, the hull girder will set up a significant hogging condition, giving longitudinal compressive stresses in the bottom and bilge area.
Fig. 4.1 Ship “frozen” in waves in a moment time giving high hull girder hogging loads
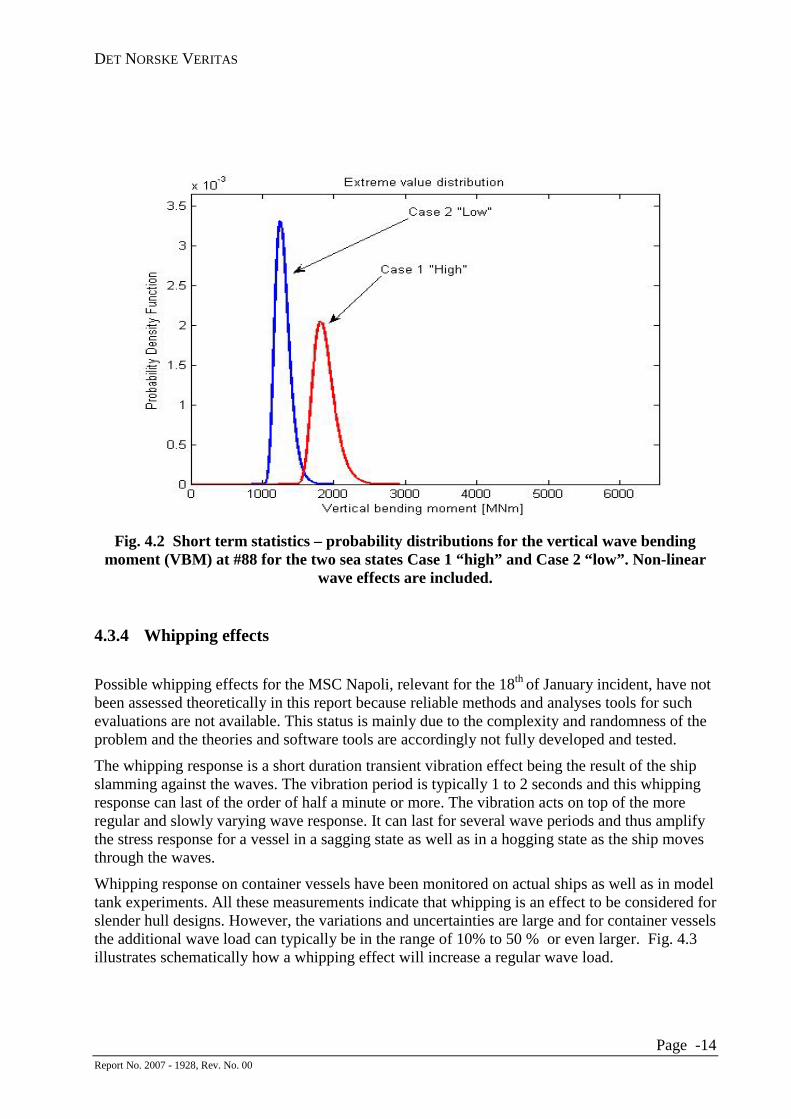
The maximum wave loads at the engine room bulkhead are illustrated as probability distributions (Rayleigh) in Fig. 4.2 for the two sea states analysed, Case 1 “high” and Case 2 “low”. It is to be noted that the probability distributions in Fig. 4.2 have been scaled down by 27% and 20 % (Case1, Case 2) according to the non-linear hogging wave effect relative to linear methods. This is done in order to reflect the real life vessel response as closely as possible.
DET NORSKE VERITAS
Page -14 Report No. 2007 - 1928, Rev. No. 00
Fig. 4.2 Short term statistics – probability distributions for the vertical wave bending moment (VBM) at #88 for the two sea states Case 1 “high” and Case 2 “low”. Non-linear
wave effects are included.
4.3.4 Whipping effects
Possible whipping effects for the MSC Napoli, relevant for the 18th of January incident, have not been assessed theoretically in this report because reliable methods and analyses tools for such evaluations are not available. This status is mainly due to the complexity and randomness of the problem and the theories and software tools are accordingly not fully developed and tested.
The whipping response is a short duration transient vibration effect being the result of the ship slamming against the waves. The vibration period is typically 1 to 2 seconds and this whipping response can last of the order of half a minute or more. The vibration acts on top of the more regular and slowly varying wave response. It can last for several wave periods and thus amplify the stress response for a vessel in a sagging state as well as in a hogging state as the ship moves through the waves.
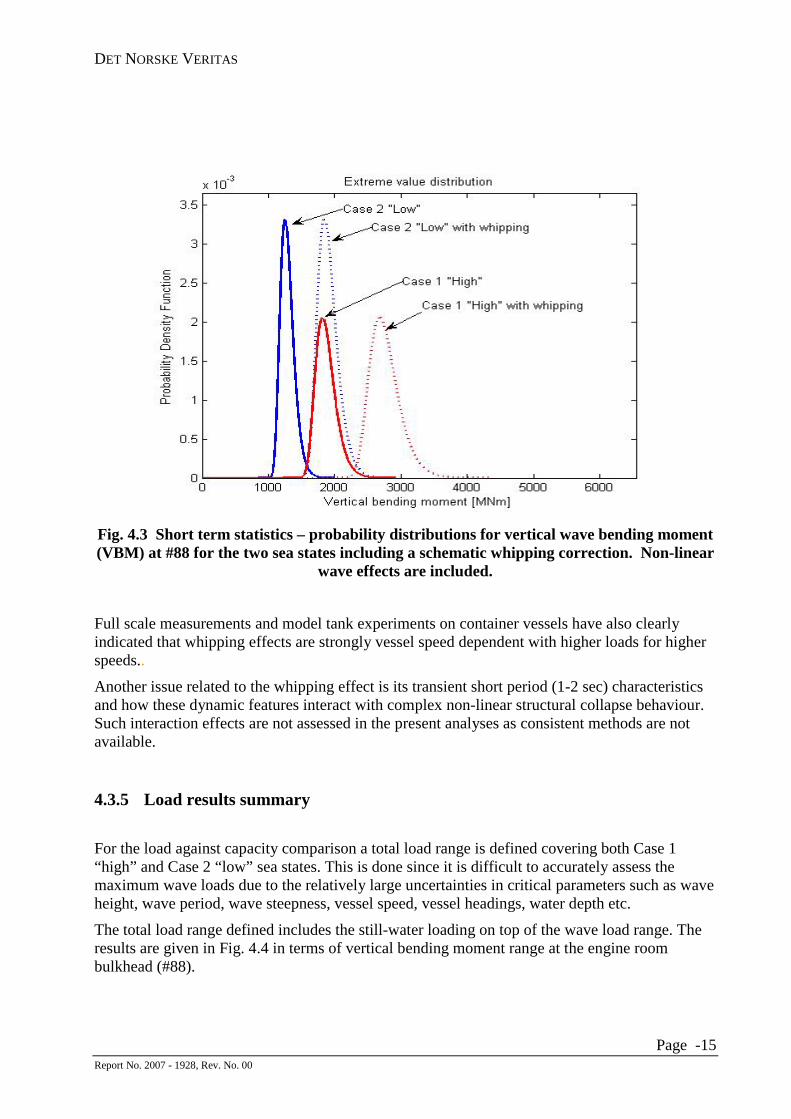
Whipping response on container vessels have been monitored on actual ships as well as in model tank experiments. All these measurements indicate that whipping is an effect to be considered for slender hull designs. However, the variations and uncertainties are large and for container vessels the additional wave load can typically be in the range of 10% to 50 % or even larger. Fig. 4.3 illustrates schematically how a whipping effect will increase a regular wave load.
DET NORSKE VERITAS
Page -15 Report No. 2007 - 1928, Rev. No. 00
Fig. 4.3 Short term statistics – probability distributions for vertical wave bending moment (VBM) at #88 for the two sea states including a schematic whipping correction. Non-linear
wave effects are included.
Full scale measurements and model tank experiments on container vessels have also clearly indicated that whipping effects are strongly vessel speed dependent with higher loads for higher speeds..
Another issue related to the whipping effect is its transient short period (1-2 sec) characteristics and how these dynamic features interact with complex non-linear structural collapse behaviour. Such interaction effects are not assessed in the present analyses as consistent methods are not available.
4.3.5 Load results summary
For the load against capacity comparison a total load range is defined covering both Case 1 “high” and Case 2 “low” sea states. This is done since it is difficult to accurately assess the maximum wave loads due to the relatively large uncertainties in critical parameters such as wave height, wave period, wave steepness, vessel speed, vessel headings, water depth etc.
The total load range defined includes the still-water loading on top of the wave load range. The results are given in Fig. 4.4 in terms of vertical bending moment range at the engine room bulkhead (#88).

DET NORSKE VERITAS
Page -16 Report No. 2007 - 1928, Rev. No. 00
Fig. 4.4 Total load ranges: still-water + wave load (VBM) at engine room bulkhead (#88). Non-linear wave effects are included in all curves while whipping is excluded.
In Table 4.3 the total likely load range is summarized for overview. The total moment range defined includes the likely span of the extreme wave loads assuming Rayleigh distributed short term statistics. For the Case 1 “high” a 10% probability of exceedence value has been used for the upper limit wave load. This limit corresponds to a total moment of 4300 MNm. A similar definition of 10% probability is used for the Case 2 “low” giving a lower bound value of 3400 MNm.
Table 4.3 Total load range at #88; still-water + wave load (no whipping)
Load range
Lowest load
Hogging VBM (MNm)
Highest load
Hogging VBM(MNm)
Vertical bending moment at # 88 3400 4300
Global shear loads are also assessed corresponding to the VBM ranges. The shear loads are typical in the range 30 - 40 MN for a VBM range of 3400 - 4300 MNm.
Total moment range: 3400 – 4300 MNm
DET NORSKE VERITAS
Page -17 Report No. 2007 - 1928, Rev. No. 00
5 LINEAR STRESS ANALYSES
5.1 Basic model description
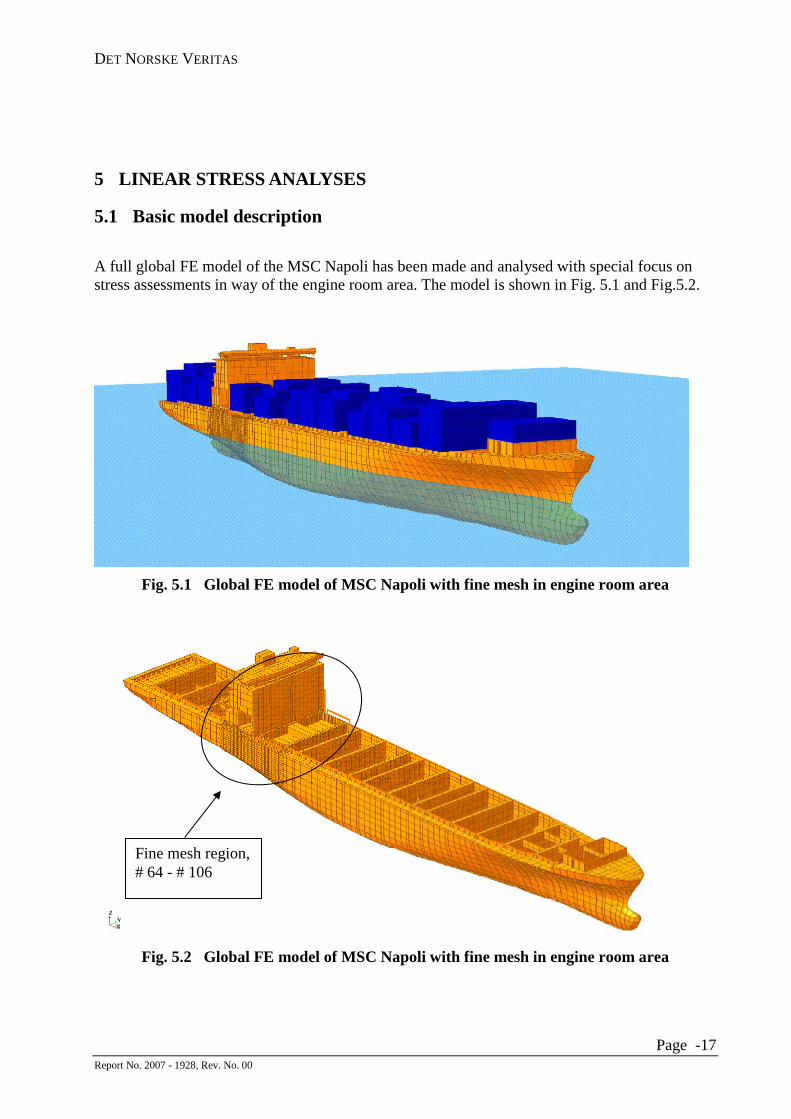
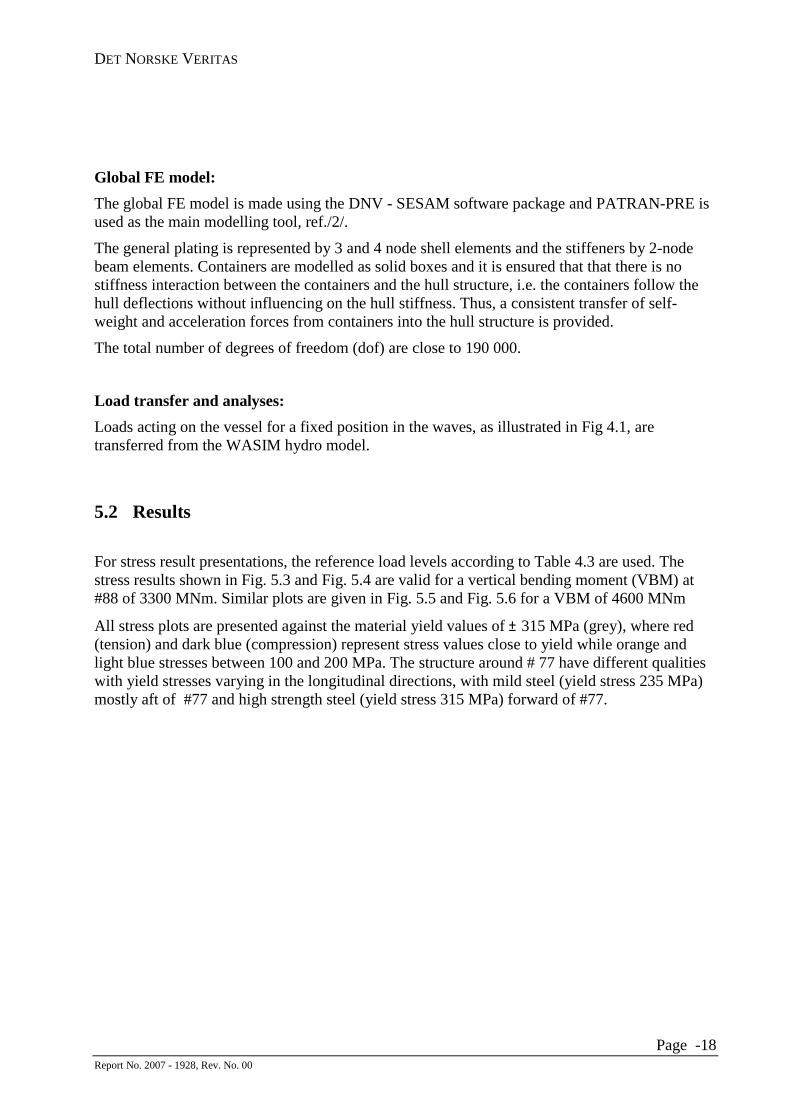
A full global FE model of the MSC Napoli has been made and analysed with special focus on stress assessments in way of the engine room area. The model is shown in Fig. 5.1 and Fig.5.2.
Fig. 5.1 Global FE model of MSC Napoli with fine mesh in engine room area
Fig. 5.2 Global FE model of MSC Napoli with fine mesh in engine room area
Fine mesh region, # 64 - # 106
DET NORSKE VERITAS
Page -18 Report No. 2007 - 1928, Rev. No. 00
Global FE model:
The global FE model is made using the DNV - SESAM software package and PATRAN-PRE is used as the main modelling tool, ref./2/.
The general plating is represented by 3 and 4 node shell elements and the stiffeners by 2-node beam elements. Containers are modelled as solid boxes and it is ensured that that there is no stiffness interaction between the containers and the hull structure, i.e. the containers follow the hull deflections without influencing on the hull stiffness. Thus, a consistent transfer of self-weight and acceleration forces from containers into the hull structure is provided.
The total number of degrees of freedom (dof) are close to 190 000.
Load transfer and analyses:
Loads acting on the vessel for a fixed position in the waves, as illustrated in Fig 4.1, are transferred from the WASIM hydro model.
5.2 Results
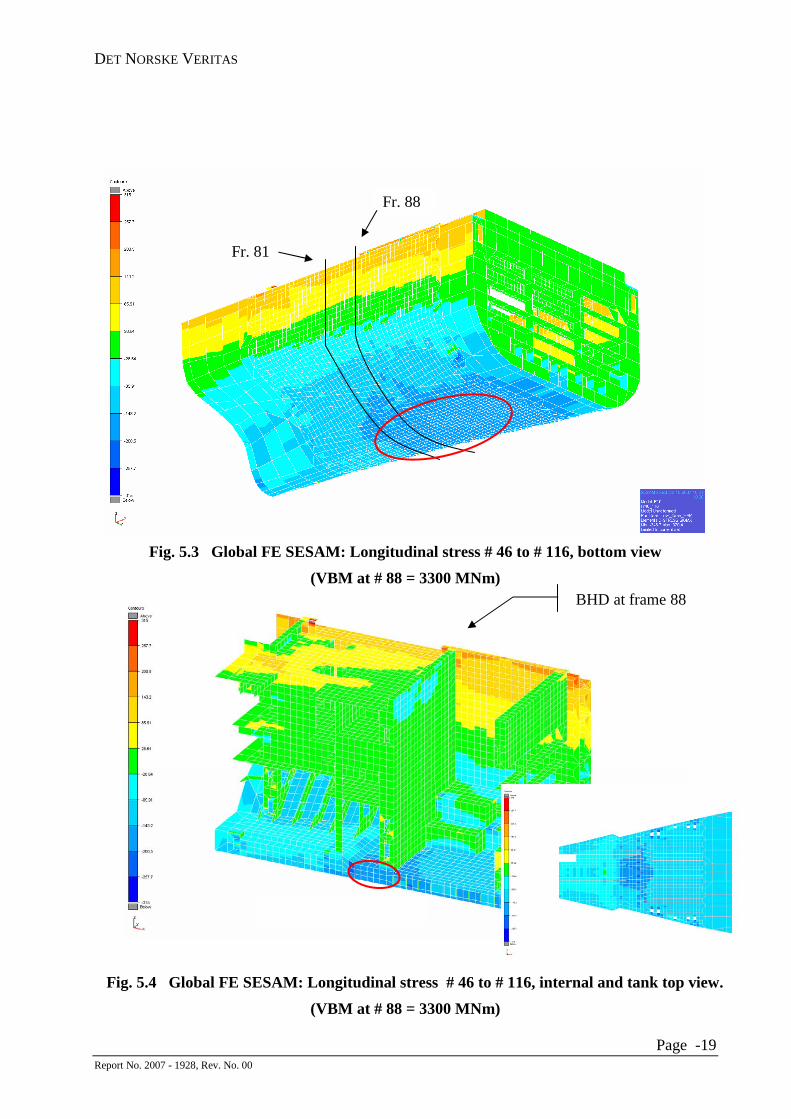
For stress result presentations, the reference load levels according to Table 4.3 are used. The stress results shown in Fig. 5.3 and Fig. 5.4 are valid for a vertical bending moment (VBM) at #88 of 3300 MNm. Similar plots are given in Fig. 5.5 and Fig. 5.6 for a VBM of 4600 MNm
All stress plots are presented against the material yield values of ± 315 MPa (grey), where red (tension) and dark blue (compression) represent stress values close to yield while orange and light blue stresses between 100 and 200 MPa. The structure around # 77 have different qualities with yield stresses varying in the longitudinal directions, with mild steel (yield stress 235 MPa) mostly aft of #77 and high strength steel (yield stress 315 MPa) forward of #77.
DET NORSKE VERITAS
Page -19 Report No. 2007 - 1928, Rev. No. 00
Fig. 5.3 Global FE SESAM: Longitudinal stress # 46 to # 116, bottom view
(VBM at # 88 = 3300 MNm)
Fig. 5.4 Global FE SESAM: Longitudinal stress # 46 to # 116, internal and tank top view.
(VBM at # 88 = 3300 MNm)
Fr. 88
Fr. 81
BHD at frame 88

DET NORSKE VERITAS
Page -20 Report No. 2007 - 1928, Rev. No. 00
Fig. 5.5 Global FE SESAM: Longitudinal stress # 46 to # 116, bottom view
(VBM at # 88 = 4600 MNm)
Fig. 5.6 Global FE SESAM: Longitudinal stress # 46 to # 116, internal and tank top view.
(VBM at # 88 = 4600 MNm)
Fr. 88
Fr. 81
BHD at frame 88
DET NORSKE VERITAS
Page -21 Report No. 2007 - 1928, Rev. No. 00
6 NON-LINEAR ANALYSES – COLLAPSE AND FAILURE ASSESSMENTS
6.1 Model description
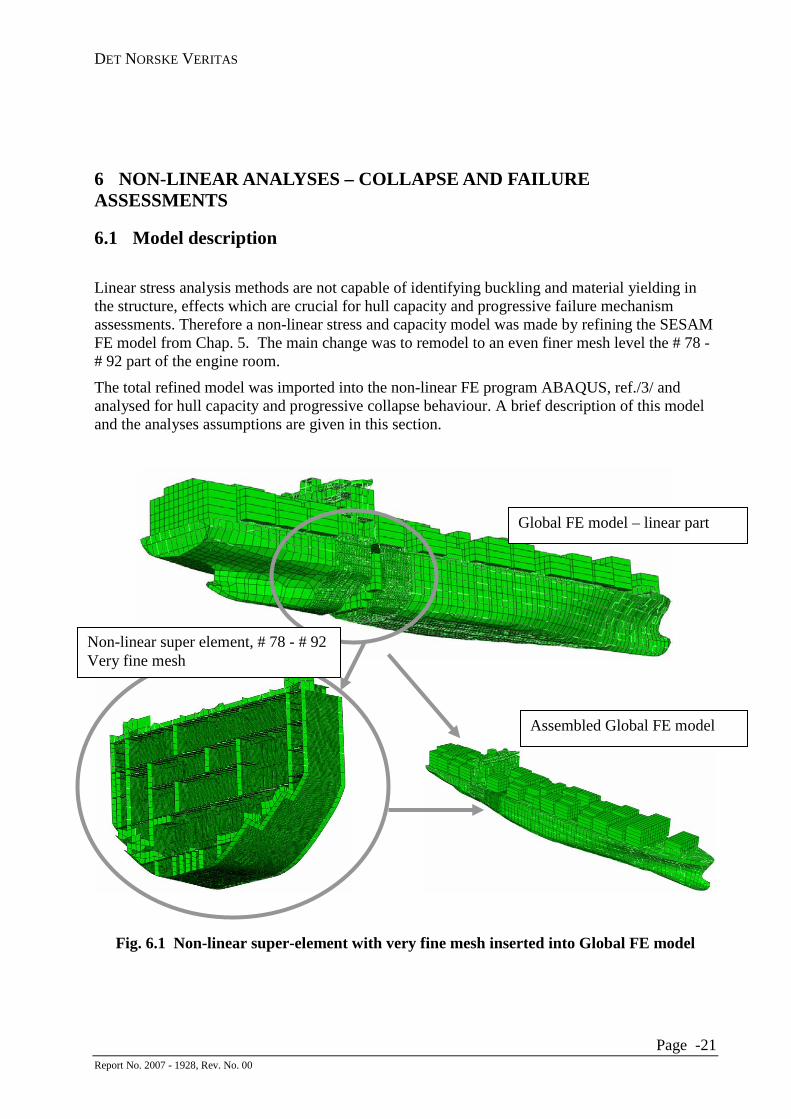
Linear stress analysis methods are not capable of identifying buckling and material yielding in the structure, effects which are crucial for hull capacity and progressive failure mechanism assessments. Therefore a non-linear stress and capacity model was made by refining the SESAM FE model from Chap. 5. The main change was to remodel to an even finer mesh level the # 78 - # 92 part of the engine room.
The total refined model was imported into the non-linear FE program ABAQUS, ref./3/ and analysed for hull capacity and progressive collapse behaviour. A brief description of this model and the analyses assumptions are given in this section.
Fig. 6.1 Non-linear super-element with very fine mesh inserted into Global FE model
Non-linear super element, # 78 - # 92 Very fine mesh
Global FE model – linear part
Assembled Global FE model
DET NORSKE VERITAS
Page -22 Report No. 2007 - 1928, Rev. No. 00
6.1.1 Mesh density and properties
The global FE model used in this analysis consists of two super-elements:
- A local, very fine mesh super-element representing the area between frame 78 and frame 92. Here both non-linearity in geometry and material behaviour is included. It is referred to as the non-linear super-element.
- A global super-element representing the rest of the vessel. This is constrained to behave linearly elastic and it is referred to as the linear super-element.
The non-linear super-element is modelled using 4-node plate element (ABAQUS, S4 ) for both plating, stiffeners, girder webs etc. The meshing is very fine with typically
- 5 to 6 elements between stiffeners
- 3 elements across a stiffener height
- quadric element shape is chosen for the most of the structure
- element size is of the order 150 mm
- openings, cut-outs and local secondary stiffeners are modelled in detail
This mesh density is capable of describing very localized buckling and collapse behaviour of plating, stiffeners and girder structures.
The model size is
- non-linear super element; 1.06 mill degrees of freedom (dof)
- total model; 1.22 mill degrees of freedom (dof), linear + non-linear super-element
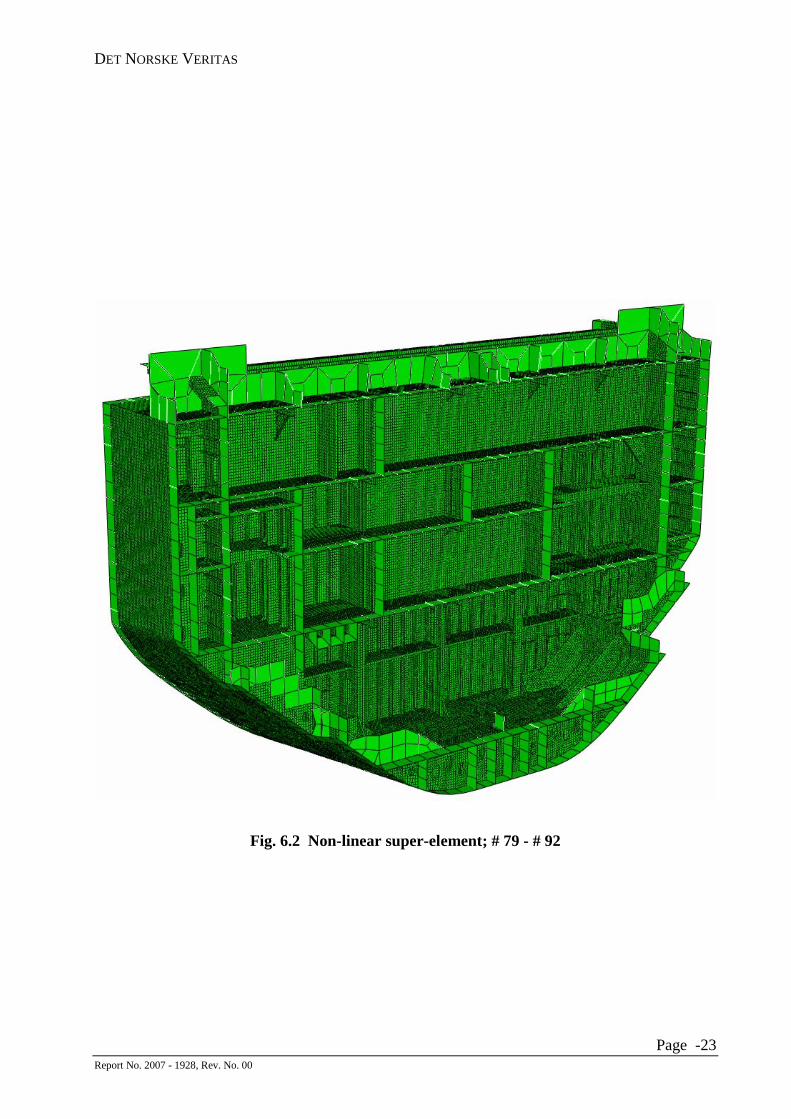
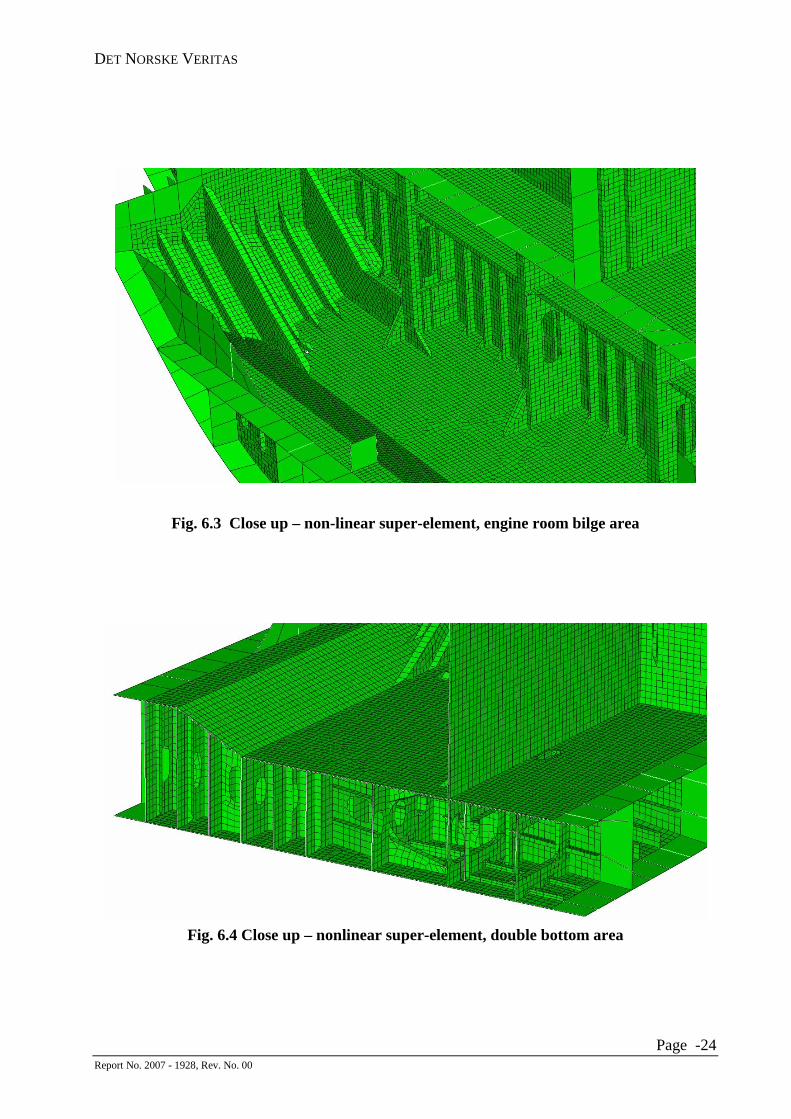
Fig. 6.2 show the non-linear super-element, while Fig 6.3 and Fig. 6.4 show some close up views of bilge and double bottom parts respectively.
DET NORSKE VERITAS
Page -23 Report No. 2007 - 1928, Rev. No. 00
Fig. 6.2 Non-linear super-element; # 79 - # 92
DET NORSKE VERITAS
Page -24 Report No. 2007 - 1928, Rev. No. 00
Fig. 6.3 Close up – non-linear super-element, engine room bilge area
Fig. 6.4 Close up – nonlinear super-element, double bottom area
DET NORSKE VERITAS
Page -25 Report No. 2007 - 1928, Rev. No. 00
6.1.2 Geometrical shape imperfections (tolerances)
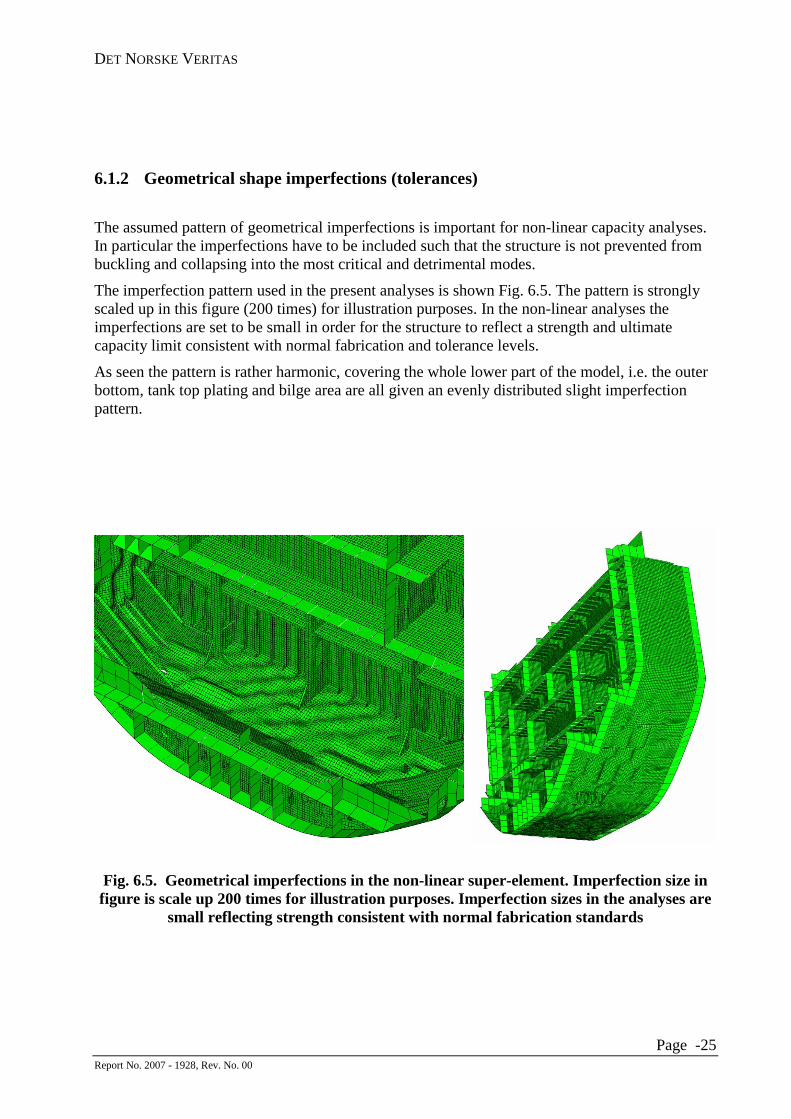
The assumed pattern of geometrical imperfections is important for non-linear capacity analyses. In particular the imperfections have to be included such that the structure is not prevented from buckling and collapsing into the most critical and detrimental modes.
The imperfection pattern used in the present analyses is shown Fig. 6.5. The pattern is strongly scaled up in this figure (200 times) for illustration purposes. In the non-linear analyses the imperfections are set to be small in order for the structure to reflect a strength and ultimate capacity limit consistent with normal fabrication and tolerance levels.
As seen the pattern is rather harmonic, covering the whole lower part of the model, i.e. the outer bottom, tank top plating and bilge area are all given an evenly distributed slight imperfection pattern.
Fig. 6.5. Geometrical imperfections in the non-linear super-element. Imperfection size in figure is scale up 200 times for illustration purposes. Imperfection sizes in the analyses are
small reflecting strength consistent with normal fabrication standards
DET NORSKE VERITAS
Page -26 Report No. 2007 - 1928, Rev. No. 00
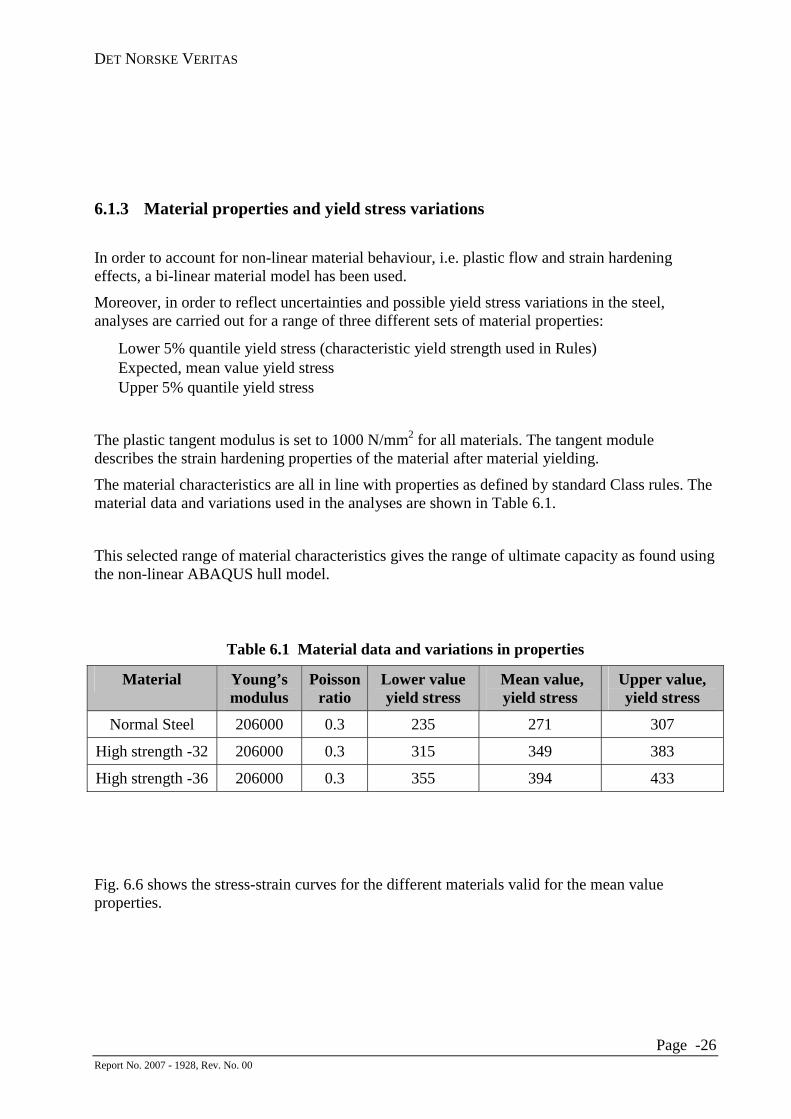
6.1.3 Material properties and yield stress variations
In order to account for non-linear material behaviour, i.e. plastic flow and strain hardening effects, a bi-linear material model has been used.
Moreover, in order to reflect uncertainties and possible yield stress variations in the steel, analyses are carried out for a range of three different sets of material properties:
• Lower 5% quantile yield stress (characteristic yield strength used in Rules) • Expected, mean value yield stress • Upper 5% quantile yield stress
The plastic tangent modulus is set to 1000 N/mm2 for all materials. The tangent module describes the strain hardening properties of the material after material yielding.
The material characteristics are all in line with properties as defined by standard Class rules. The material data and variations used in the analyses are shown in Table 6.1.
This selected range of material characteristics gives the range of ultimate capacity as found using the non-linear ABAQUS hull model.
Table 6.1 Material data and variations in properties
Fig. 6.6 shows the stress-strain curves for the different materials valid for the mean value properties.
Material Young’s modulus
Poisson ratio
Lower value yield stress
Mean value, yield stress
Upper value, yield stress
Normal Steel 206000 0.3 235 271 307
High strength -32 206000 0.3 315 349 383
High strength -36 206000 0.3 355 394 433

DET NORSKE VERITAS
Page -27 Report No. 2007 - 1928, Rev. No. 00
0
100
200
300
400
500
0.00 0.01 0.02 0.03 0.04 0.05 0.06
Total strain
Str
ess
36-Steel
32-Steel
NS-Steel
Fig. 6.6 Bi-linear material stress-strain curves, all steel qualities. Curves valid for mean
yield stress values
Most of the critical and important load bearing structures within the engine room has a material grade of high strength steel 32. Stress-strain curve for this material is shown in Fig. 6.7, illustrating the range of possible variations according to the Table 6.1 data.
0
100
200
300
400
0.00 0.01 0.02 0.03 0.04 0.05
Total strain
Str
ess
Upper 5% quartile
Mean value
Lower 5% quartile
Fig. 6.7 Bi-linear material stress-strain curves for high strength 32 steel with assumed variation range
Variations in yield stress, 32 - steel

DET NORSKE VERITAS
Page -28 Report No. 2007 - 1928, Rev. No. 00
6.1.4 Load applications
Load transfer:
The loads applied to the ABAQUS super-elements are transferred from the hydrodynamic WASIM analyses and the loading is based on a split into two load categories
i) still water loading
ii) loads on the vessel in waves, Fig. 4.1
Hull sea pressures and mass forces representative for both load categories are included.
Load application:
The non-linear analyses are performed in steps as follows (load-history):
i) First the still-water load set is applied
ii) Next the wave load set is added
iii) If global collapse is not achieved as the sum of load i) and ii), the wave load ii) is scaled further until the collapse limit is found. If the collapse limit is lower than the sum of load i) and ii), this will be automatically identified by the procedures used in ABAQUS.
This way of splitting the loads into two sets will take care of the differences in sea pressures and mass forces along the ship length for the still-water and wave load contribution respectively.
6.2 Results
6.2.1 General
The main results from the non-linear ABAQUS analyses are the estimates of the global vertical bending moment and shear load when the hull girder finally collapses. This load level is called the ultimate capacity limit or just capacity limit.

DET NORSKE VERITAS
Page -29 Report No. 2007 - 1928, Rev. No. 00
For consistency when comparing acting max loads from Chap. 4.3.5 against the corresponding capacity limit, the vertical bending moment (VBM) at the engine room bulkhead position (# 88) is used. The final capacity results are summarized in Chap. 6.2.2 for the three different material characteristics analysed.
Before the ultimate capacity limit is reached, non-linear effects are observed in the form of initial buckling in the bilge area with subsequent stress redistributions to longitudinal stiff areas (“hard corners”). The development of this progressive failure mechanism is described in more detail in Chap. 6.2.3.
6.2.2 Hull girder capacity
The non-linear relation between vertical moment (VBM) at engine room bulkhead (#88) and the vertical deflection at ship bow is shown in Fig. 6.8. For practical purposes it is the maximum point along the moment-deflection curve that is the most interesting parameter. This max point is the capacity of the structure, called also the ultimate collapse moment of the hull girder (Mu), and it is tabulated separately, see Table 6.2.
Three separate non-linear analyses are run, each corresponding to a selected set of material characteristics according to Table 6.1. All results are shown in Fig. 6.8.
0
1000
2000
3000
4000
5000
0 500 1000 1500 2000
Vertical displacement of bow [mm]
Ben
din
g m
om
ent,
fra
me
88 [
MN
m]
Upper yield
Mean yield
Lower yield
Fig. 6.8 Non-linear moment- displacement relation (Moment at # 88 against vertical bow
deflection). Ultimate capacity is the max load indicated for the lower, mean and upper material properties according to Table 6.1.
Ultimate moment capacity range (Mu)
4200- 4950 MNm

DET NORSKE VERITAS
Page -30 Report No. 2007 - 1928, Rev. No. 00
Table 6.2 gives the ultimate moment capacities summarized for each of the material categories analysed. From this the capacity range is seen to span from 4200 MNm as the lowest level to 4950 MNm as the highest level.
Table 6.2 Results; vertical bending moment (VBM) at # 88 at hull girder collapse
Yield stress used in ABAQUS model
acc. to Table 6.1
Vertical moment at #88 at collapse (Mu, MNm)
Lower yield stress 4200
Mean yield stress 4560
Upper yield stress 4950
6.2.3 Hull girder failure mechanism
Associated with the total collapse of the hull girder is the development of a local progressive failure mechanism. The characteristics of this is that it starts with “elastic” buckling in the hull skin plating in the bilge area in way of # 81 to # 88. From here it gradually develops and progress into the bottom, double bottom and up into the ship side. It finally ends up as a localized collapse pattern across the whole hull section, from bottom to ship side, see Fig. 6.9.
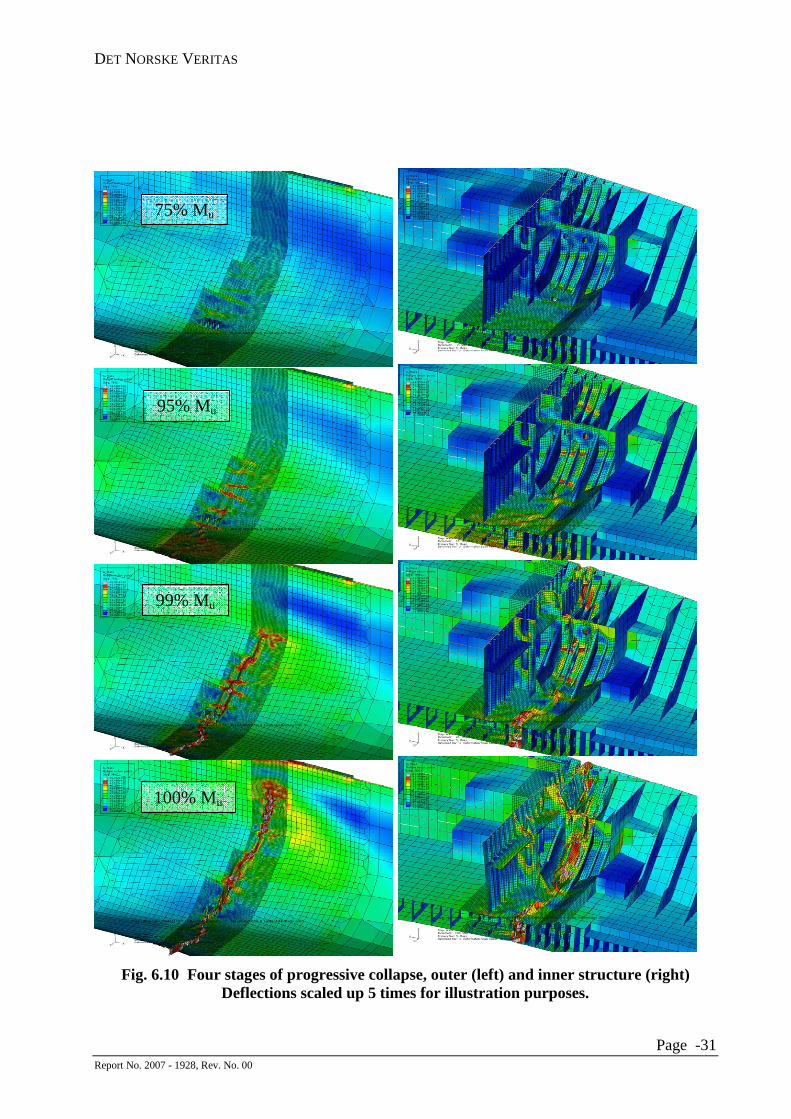
The progressive development of the failure mechanism is illustrated in more detail in Fig. 6.10, showing the stepwise development for four subsequent load levels; external and internal view.
Fig. 6.9 Final failure mechanism as predicted by ABAQUS. Deflections scaled up 5 times for illustration purposes.
DET NORSKE VERITAS
Page -31 Report No. 2007 - 1928, Rev. No. 00
95% Mu
99% Mu
100% Mu
75% Mu
Fig. 6.10 Four stages of progressive collapse, outer (left) and inner structure (right)
Deflections scaled up 5 times for illustration purposes.

DET NORSKE VERITAS
Page -32 Report No. 2007 - 1928, Rev. No. 00
7 SUMMARY
7.1 General
The computer analyses demonstrate that a very high vertical hull girder moment, close to or exceeding the corresponding capacity limit, may lead to a type of structural failure between #81 to #88, as is observed on MSC Napoli in open sea. This is evident from a comparison between a photo taken of the vessel’s starboard side, before it is beached with the failure visible, and a computer simulation image of the same area, see Fig. 7.1. This is further supported by diving surveys while beached and also later from surveys of the forward part in dry dock.
Fig. 7.1 Comparison of real life failure mode with computer simulations (ABAQUS FE model)
( with permission from Gargolaw)
Given the assumptions and uncertainties as described earlier in this report, the computer analyses carried out and documented herein indicate that the total hull girder loads in way of the engine room area may have been on the limit or have exceeded the corresponding hull capacity for MSC Napoli, see Fig. 7.2.

DET NORSKE VERITAS
Page -33 Report No. 2007 - 1928, Rev. No. 00
It is also documented that the overlap in load and capacity is very narrow indicating that such a failure scenario has a very low probability of occurrence for the assumed severe sea states.
By screening available wave statistic relevant for the English Channel during the last years it can be concluded that the assumed severe sea states are very rare. This reflects a very low probability for such events to take place in the future.
Fig. 7.2 Calculated load and capacity ranges with overlap comparison (no whipping effects). Vertical bending moments (VBM) at engine room bulkhead #88
7.2 Discussion
The non-linear FE computer analyses (ABAQUS) document a localized plate buckling mechanism developing between # 81 and # 88 across the whole ship section, i.e. in the bottom structure as well as far up into the shipside. Such large plate bending and folding deformations lead to large plastic strains also in a tension mode. This may lead to sudden ductile plate fracture and cracking with subsequent water ingress and compartment flooding as a consequence.
The exact nature and sequence of the structural failure and plate fracture taking place is difficult to judge, but it is a possibility that not only one severe wave but several subsequent high waves hit the MSC Napoli. This typically will lead to a loading, unloading and reloading again as the ship move through the waves. This again gives locally a plastic straining of the hull plating at
0
1000
2000
3000
4000
5000
0 500 1000 1500 2000
Vertical displacement of bow [mm]
Ben
din
g m
om
ent,
fra
me
88 [
MN
m]
Upper yield
Mean yield
Lower yield
DET NORSKE VERITAS
Page -34 Report No. 2007 - 1928, Rev. No. 00
one instant, and then in the next moment having a strain relief followed by a new large plastic straining. Such hysteresis behaviour in the large plastic strain region may lead to plate fracture and locally open up large cracks. However, due to the large and localized plate bending deformations initiated from buckling, only one severe wave may be enough to strain the hull plating beyond its fracture limit and thereby generate rupture and large cracks.
A major uncertainty is linked to the wave response characteristics, i.e. the wave response could have had a whipping (vibration) contribution on top of the regular wave load, the former being the result of the vessel slamming into a severe wave train. However, as discussed in Chapter 4.3.4 the whipping effects for the MSC Napoli is not assessed explicitly as no consistent analyses tools are available. Accordingly, whipping effects may have been a triggering factor, but they are of an unknown magnitude and may not have been decisive for the incident.
REFERENCES
/1/
MV MSC Napoli, W05 Spl. TD Voy. 27a - Departure from Antwerp to Sines, Date 16/01/07, MSC. (Onboard Loading Computer) (MAIB 98%)
/2/
DNV SESAM User Manuals 2007 (FE and WASIM)
/3/
ABAQUS User Manual 2007, version 6.7-1
/4/
NAPA User Manual 2006, version 2006.2
- o0o -