uk renal registry 9 th annual report 2006 fig 13.1 erf patients below 15 years of age, by year of...
TRANSCRIPT
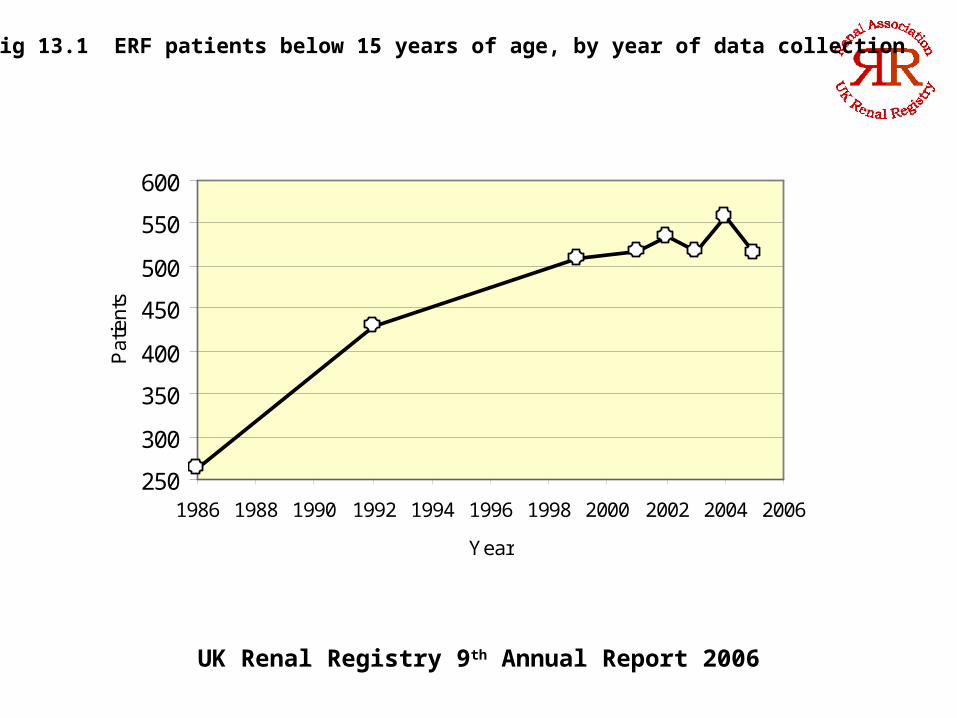
UK Renal Registry 9th Annual Report 2006
Fig 13.1 ERF patients below 15 years of age, by year of data collection
250
300
350
400
450
500
550
600
1986 1988 1990 1992 1994 1996 1998 2000 2002 2004 2006
Year
Pat
ient
s

UK Renal Registry 9th Annual Report 2006
Fig 13.2 ERF population in 4 year age bands
0%
10%
20%
30%
40%
50%
60%
70%
80%
90%
100%
2002 2003 2004 2005
Year
Per
cent
age
of p
atie
nts
16 - 19.99
12 - 15.99
8 - 11.99
4 - 7.99
0 - 3.99

UK Renal Registry 9th Annual Report 2006
Fig 13.3 Gender distribution of the ERF population, according to age
0%10%20%30%40%50%60%70%80%90%
100%
0 - 3 4 - 7 8 - 11 12 - 15 16 - 19
Age group (yrs)
Gen
der
dist
ribut
ion
Females
Males

UK Renal Registry 9th Annual Report 2006
Fig 13.4 Age distribution of the White and Ethnic minority patients
0%
20%
40%
60%
80%
100%
0 - 3 4 - 7 8 - 11 12 - 15 16 - 19
Age group (yrs)
Per
cent
age
of p
atie
nts
Ethnic minority
White

UK Renal Registry 9th Annual Report 2006
Figure 5. Gender distribution and ethnicity in the paediatric population
0
10
20
30
40
50
60
70
80
90
100
0 - 3 4 - 7 8 - 11 12 - 15 16 - 19
Age group (yrs)
Mal
es, a
s a
perc
enta
ge
of th
e po
pula
tion
White
South Asian

UK Renal Registry 9th Annual Report 2006
Fig 13.6 Prevalence of ERF according to gender
0
20
40
60
80
100
120
0 - 3 4 - 7 8 - 11 12 - 15 16 - 19
Age group (yrs)
Pre
vale
nce
(pm
p)
Males
Females

UK Renal Registry 9th Annual Report 2006
Fig 13.7 Prevalence of ERF according to ethnicity.
0
15
30
45
60
75
90
105
120
135
150
White South Asian Black Other
Ethnicity
Pre
vale
nce
(p
mp
)

UK Renal Registry 9th Annual Report 2006
Fig 13.8 Take on rate of children with ERF according to gender
0
2
4
6
8
10
12
0 - 3 4 - 7 8 - 11 12 - 15
Age group (yrs)
Tak
e on
rat
e (p
mp)
Males
Females

UK Renal Registry 9th Annual Report 2006
Fig 13.9 Take on rate of children with ERF according to ethnicity

UK Renal Registry 9th Annual Report 2006
Figure 10. Gender distribution of the ERF population, according to diagnostic group
0% 20% 40% 60% 80% 100%
Dysplasia
Glomerular
Obstructive
Interstitial
Reflux
CNS
Metabolic
Renovascular
Uncertain
PKD
Drug toxicity
MalignancyD
iagn
ostic
gro
upin
g
Percentage
Males
Females

UK Renal Registry 9th Annual Report 2006
Fig 13.11 Percentage of inherited disease, according to ethnicity
0%
10%
20%
30%
40%
50%
60%
70%
80%
90%
100%
White South Asian Black Other
Ethnicity
Non-inherited
Inherited

UK Renal Registry 9th Annual Report 2006
Fig 13.12(a) Percentage of patients with renal dysplasia, obstructive uropathy, glomerular diseases and reflux nephropathy presenting in
each age band
0
10
20
30
40
50
60
0 - 3 4 - 7 8 - 11 12 - 15Age group (yrs)
Per
cent
age
of p
atie
nts
Dysplasia
Obstuctive
Glomerular
Reflux

UK Renal Registry 9th Annual Report 2006
Fig 13.12(b) Percentage of patients presenting in each age band with renal dysplasia
0
5
10
15
20
25
30
35
40
0 - 3 4 - 7 8 - 11 12 - 15Age group (yrs)
Pe
rce
nta
ge
of p
atie
nts
Dysplasia
Obstuctive
Glomerular
Reflux

UK Renal Registry 9th Annual Report 2006
Fig 13.13(a) Percentage of patients with tubulo-interstitial diseases, metabolic diseases, congenital nephrosis and polycystic disease
presenting in each age band
0
10
20
30
40
50
60
70
0 - 3 4 - 7 8 - 11 12 - 15Age group (yrs)
Per
cent
age
of p
atie
nts
Tubular/Interstitial
Metabolic
CNS
PKD

UK Renal Registry 9th Annual Report 2006
Fig 13.13(b) Percentage of patients presenting in each age band with tubulo-interstitial or metabolic disease, congenital nephrosis
or polycystic kidneys as the cause
0
5
10
15
20
0 - 3 4 - 7 8 - 11 12 - 15
Age group (yrs)
Pe
rce
nta
ge
of p
atie
nts
Tubular/Interstitial
Metabolic
CNS
PKD

UK Renal Registry 9th Annual Report 2006
Fig 14.14(a) Percentage of patients with renovascular diseases, malignant diseases, drug nephrotoxicity and uncertain aetiology
presenting in each age band
0
10
20
30
40
50
60
70
0 - 3 4 - 7 8 - 11 12 - 15Age group (yrs)
Per
cent
age
of p
atie
ntsRenovascular
Malignant
Drug toxicity
Uncertain

UK Renal Registry 9th Annual Report 2006
Fig 14.14(b) Percentage of patients presenting in each age band with renovascular or malignant disease, drug nephrotocicity as the cause
or uncertain aetiology
0
2
4
6
8
10
0 - 3 4 - 7 8 - 11 12 - 15
Age group (yrs)
Pe
rce
nta
ge
of p
atie
nts
Renovascular
Malignant
Drug toxicity
Uncertain

UK Renal Registry 9th Annual Report 2006
Figure 15. Distribution of modalities in paediatric patients on 1st April 2005
0
10
20
30
40
50
60
70
80
Transplant PD HD Other
Treatment
Per
cent
age
of p
atie
nts
LRD
Cadaveric
CAPD
APD

UK Renal Registry 9th Annual Report 2006
Fig 13.16 Percentage of patients with renal allografts whose graft came from a living rather than cadaveric donor
16
18
20
22
24
26
28
30
2001 2002 2003 2004 2005 2006
Year
Per
cent
age
of tr
ansp
lant
pat
ient
s w
ith a
livi
ng d
onor

UK Renal Registry 9th Annual Report 2006
Fig 13.17 Distribution of treatments according to ethnicity
0
10
20
30
40
50
60
70
80
Transplant PD HD Other
Treatment
Per
cent
age
of p
atie
nts
White
South Asian
Black
Other

UK Renal Registry 9th Annual Report 2006
Fig 13.18 ERF treatment modality changes from 2004 to 2005
81
530
73No previous ERFtreatment
No change intreatment
Treatmentchanged 2004 to2005

UK Renal Registry 9th Annual Report 2006
Figure 13.19 Distribution of treatments in those unchanged from 2004 to 2005
84%
9%7%
Transplant
PD
HD

UK Renal Registry 9th Annual Report 2006
Fig 13.20 ERF treatment changes from 2004 to 2005
1%5%
14%
4%
15%
23%
38%
Grafted from PD
Grafted from HD
Graft to PD
Graft to HD
PD to HD
HD to PD
Recovered

UK Renal Registry 9th Annual Report 2006
Fig 13.21 ERF treatment in April 2005 for those starting after April 2004