uk renal registry 17th annual report figure 3.1. transplant prevalence rate per million population...
TRANSCRIPT
UK Renal Registry 17th Annual Report
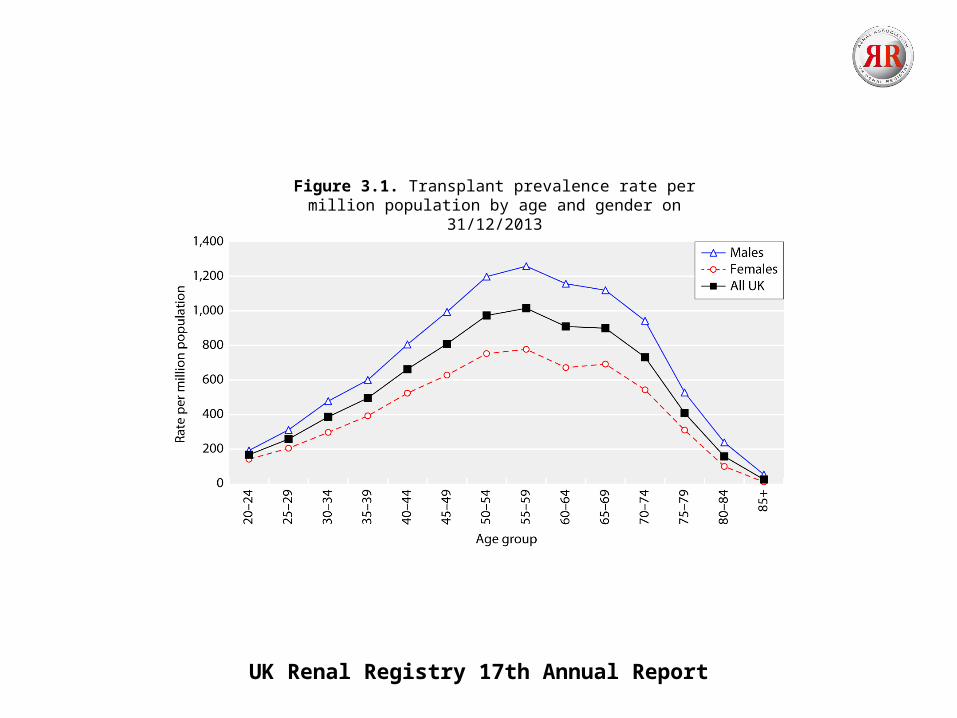
Figure 3.1. Transplant prevalence rate per million population by age and gender on 31/12/2013
UK Renal Registry 17th Annual Report
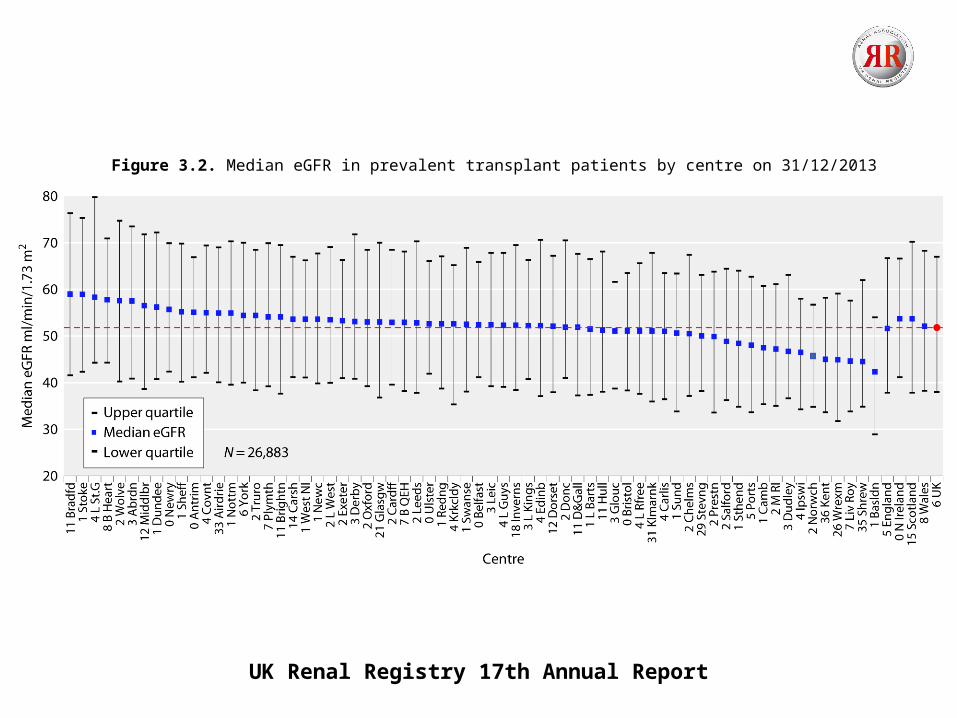
Figure 3.2. Median eGFR in prevalent transplant patients by centre on 31/12/2013
UK Renal Registry 17th Annual Report
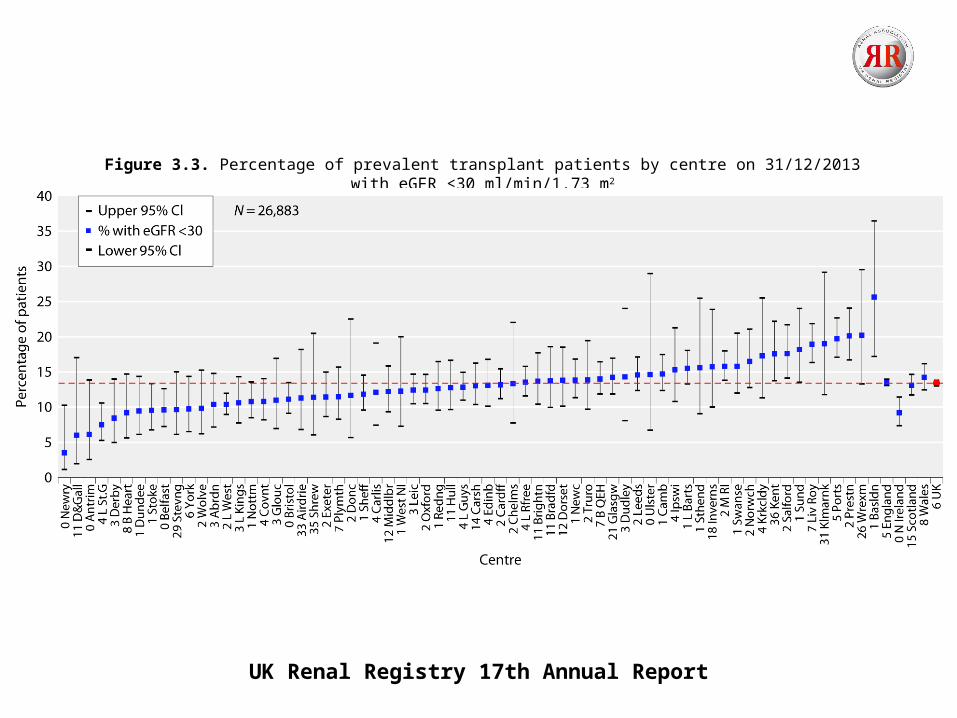
Figure 3.3. Percentage of prevalent transplant patients by centre on 31/12/2013 with eGFR <30 ml/min/1.73 m2
UK Renal Registry 17th Annual Report
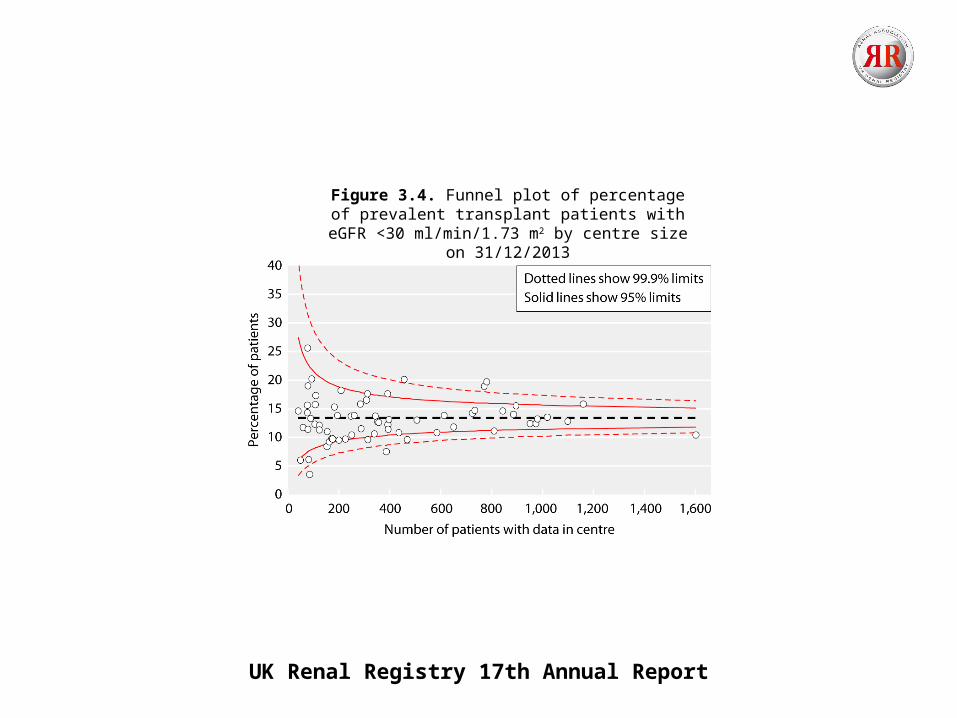
Figure 3.4. Funnel plot of percentage of prevalent transplant patients with eGFR <30 ml/min/1.73 m2
by centre size on 31/12/2013
UK Renal Registry 17th Annual Report
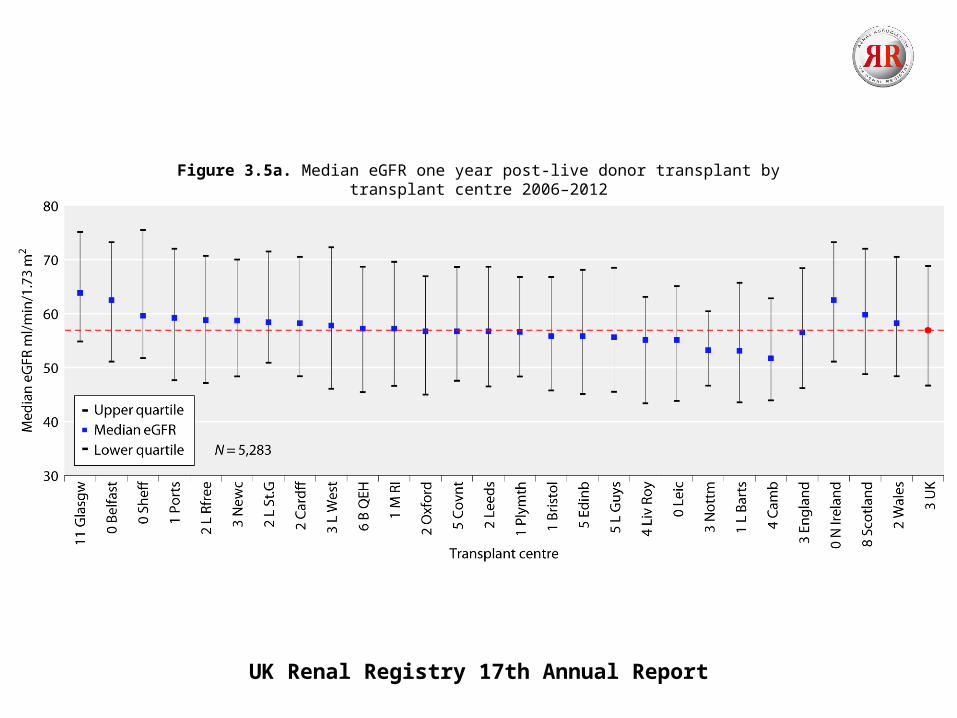
Figure 3.5a. Median eGFR one year post-live donor transplant by transplant centre 2006–2012
UK Renal Registry 17th Annual Report
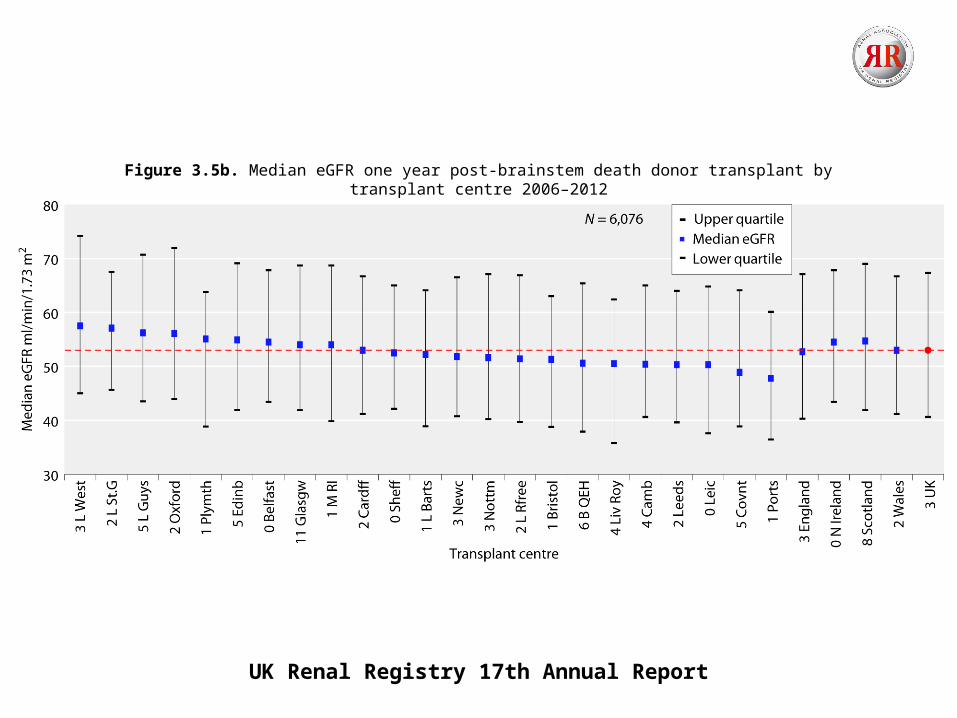
Figure 3.5b. Median eGFR one year post-brainstem death donor transplant by transplant centre 2006–2012
UK Renal Registry 17th Annual Report
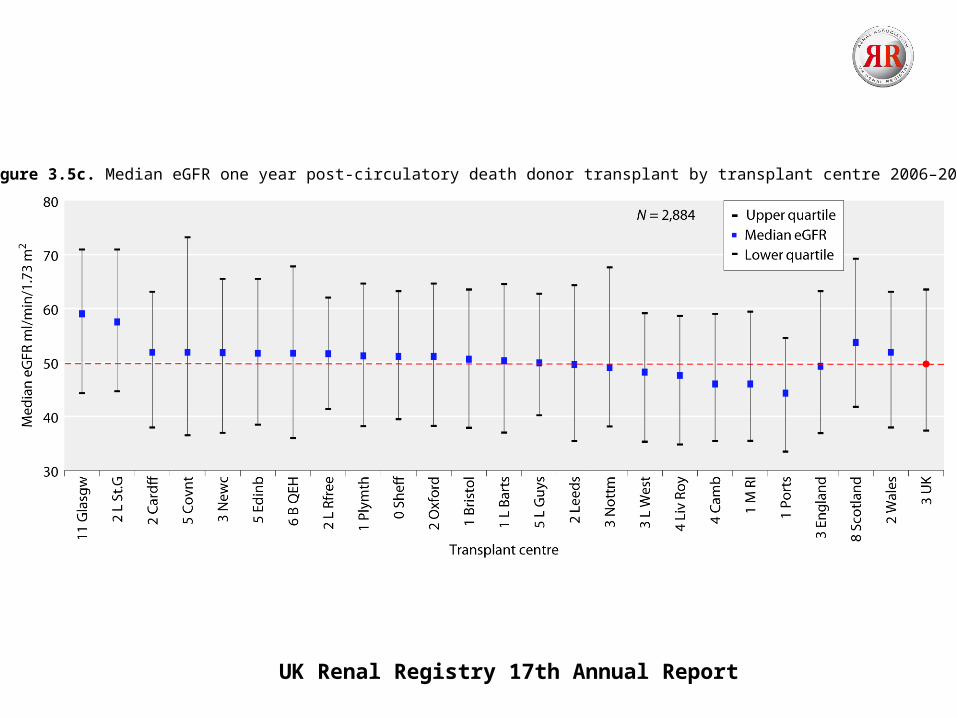
Figure 3.5c. Median eGFR one year post-circulatory death donor transplant by transplant centre 2006–2012
UK Renal Registry 17th Annual Report
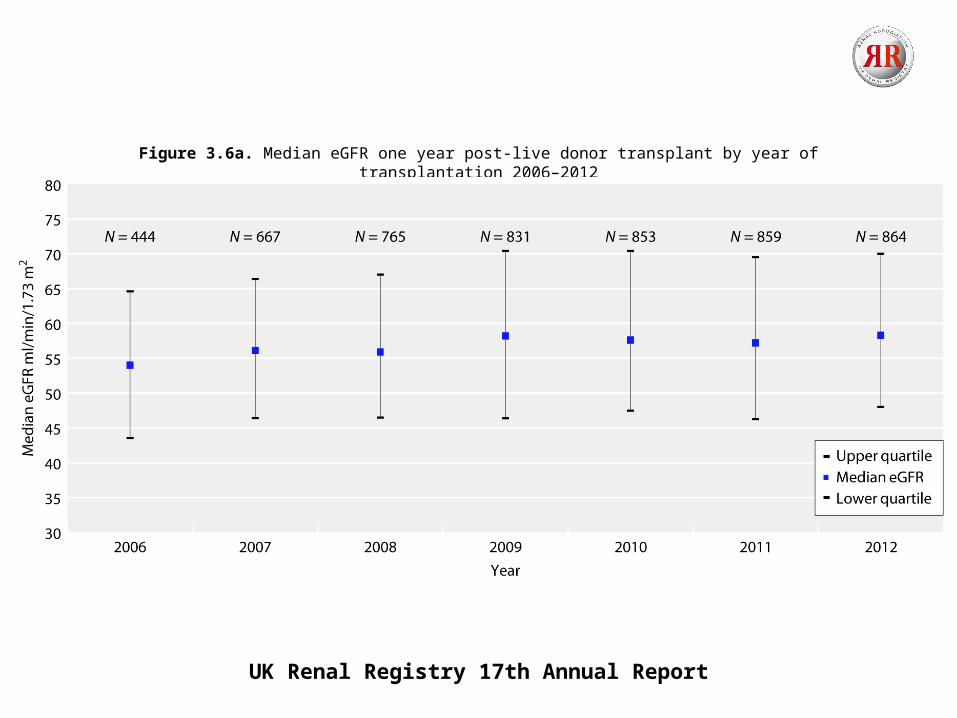
Figure 3.6a. Median eGFR one year post-live donor transplant by year of transplantation 2006–2012
UK Renal Registry 17th Annual Report
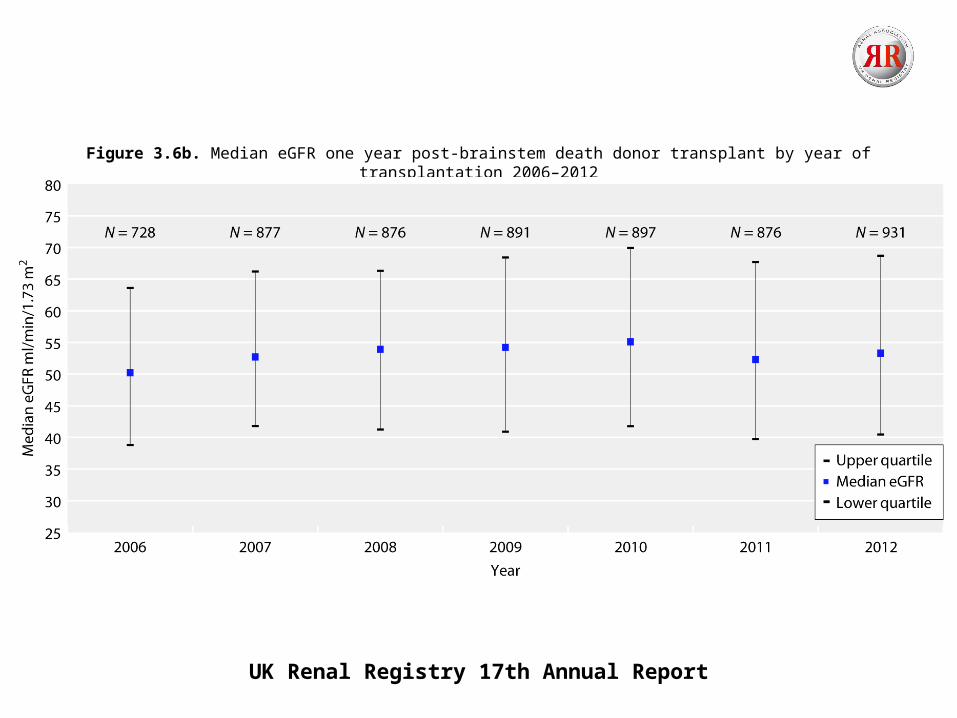
Figure 3.6b. Median eGFR one year post-brainstem death donor transplant by year of transplantation 2006–2012
UK Renal Registry 17th Annual Report
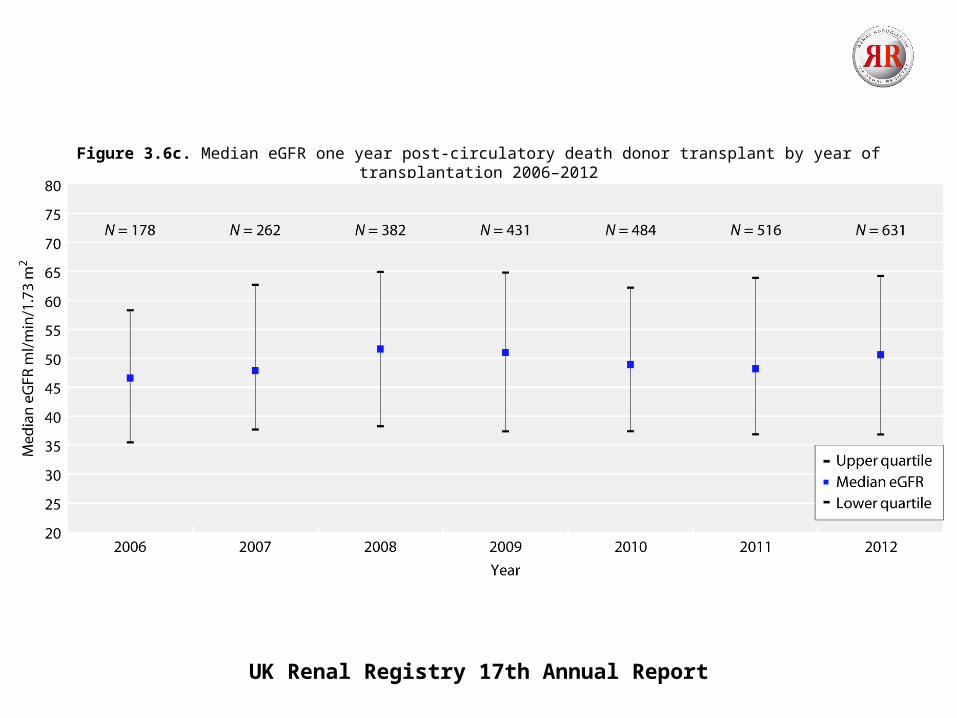
Figure 3.6c. Median eGFR one year post-circulatory death donor transplant by year of transplantation 2006–2012
UK Renal Registry 17th Annual Report
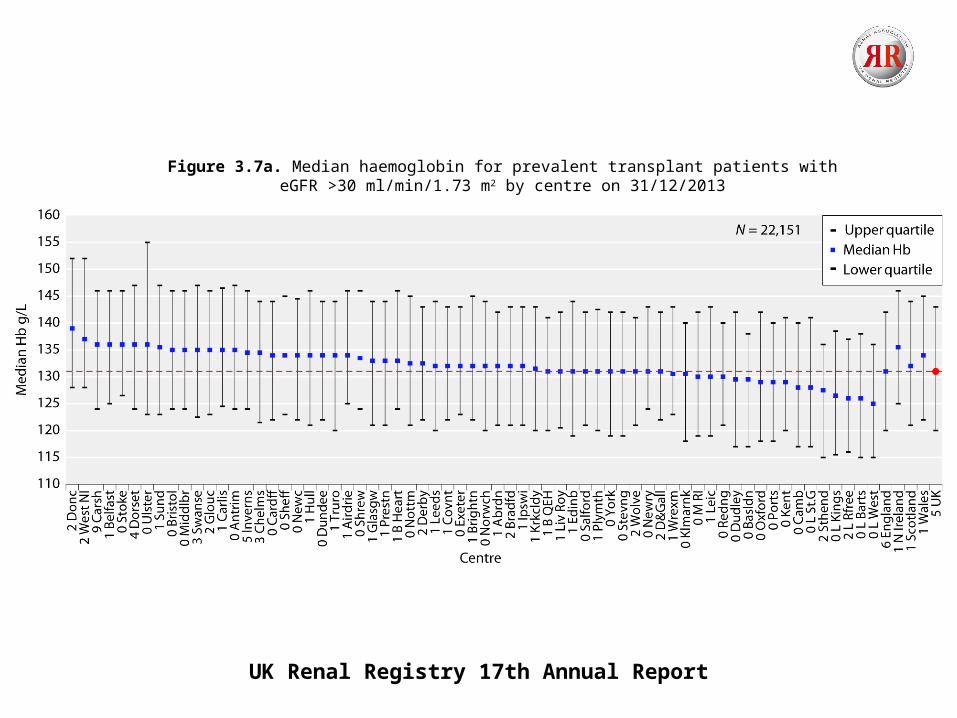
Figure 3.7a. Median haemoglobin for prevalent transplant patients with eGFR >30 ml/min/1.73 m2 by centre on 31/12/2013
UK Renal Registry 17th Annual Report
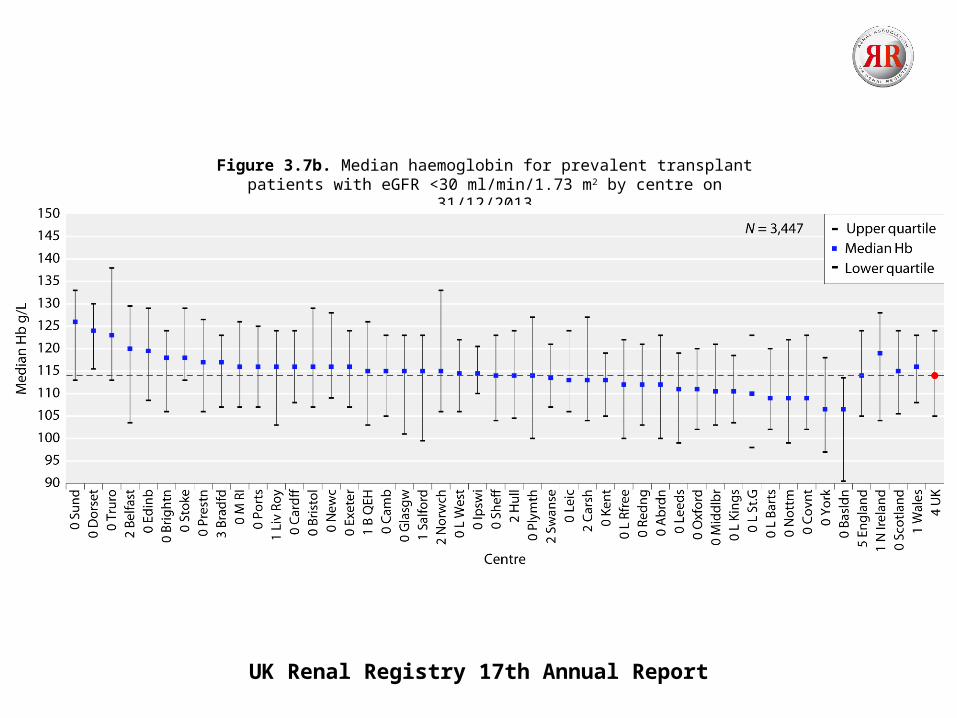
Figure 3.7b. Median haemoglobin for prevalent transplant patients with eGFR <30 ml/min/1.73 m2 by centre on 31/12/2013
UK Renal Registry 17th Annual Report
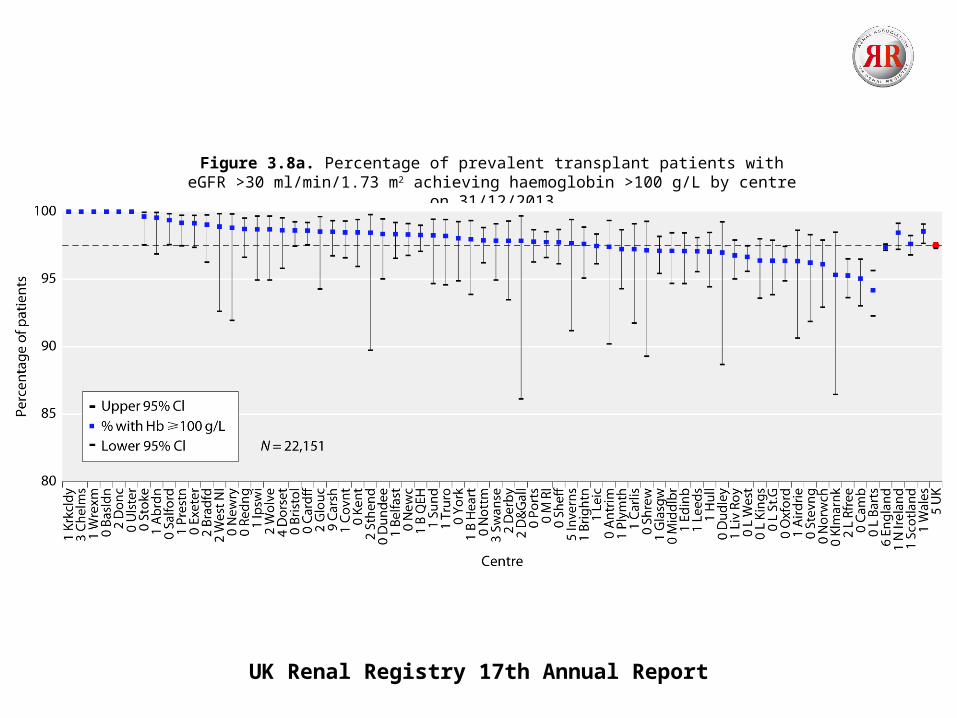
Figure 3.8a. Percentage of prevalent transplant patients with eGFR >30 ml/min/1.73 m2 achieving haemoglobin >100 g/L by centre on 31/12/2013
UK Renal Registry 17th Annual Report
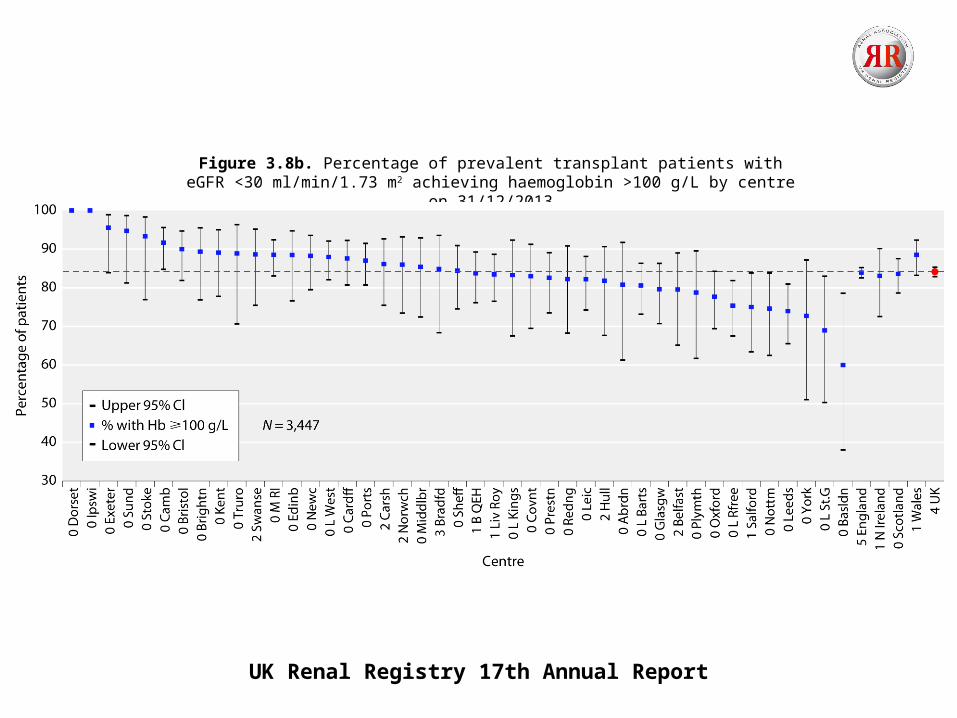
Figure 3.8b. Percentage of prevalent transplant patients with eGFR <30 ml/min/1.73 m2 achieving haemoglobin >100 g/L by centre on 31/12/2013
UK Renal Registry 17th Annual Report
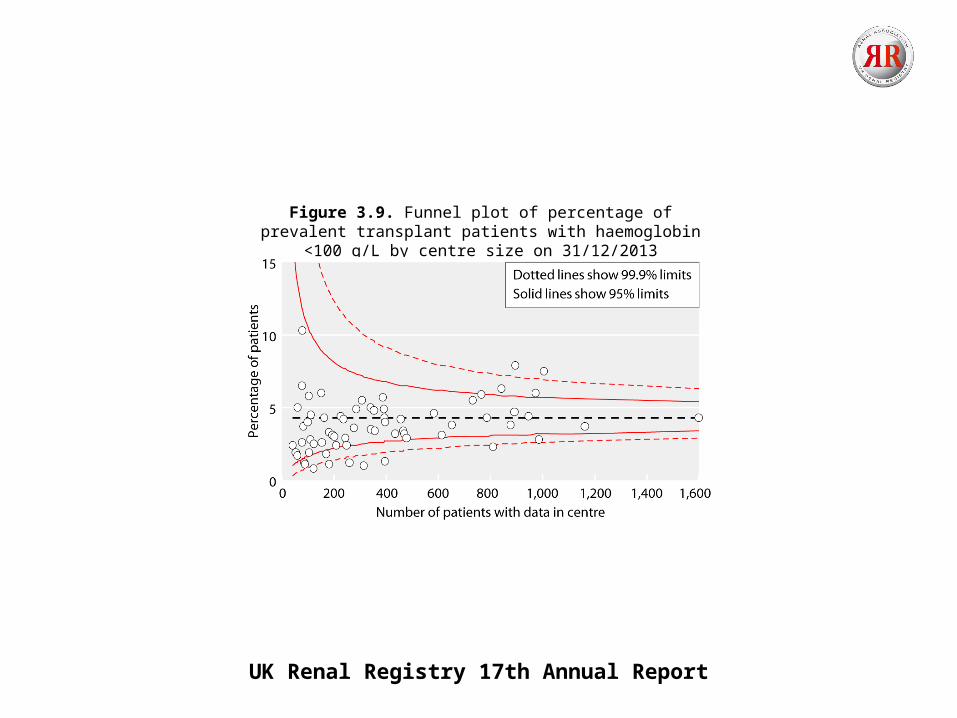
Figure 3.9. Funnel plot of percentage of prevalent transplant patients with haemoglobin <100 g/L by centre size on 31/12/2013
UK Renal Registry 17th Annual Report
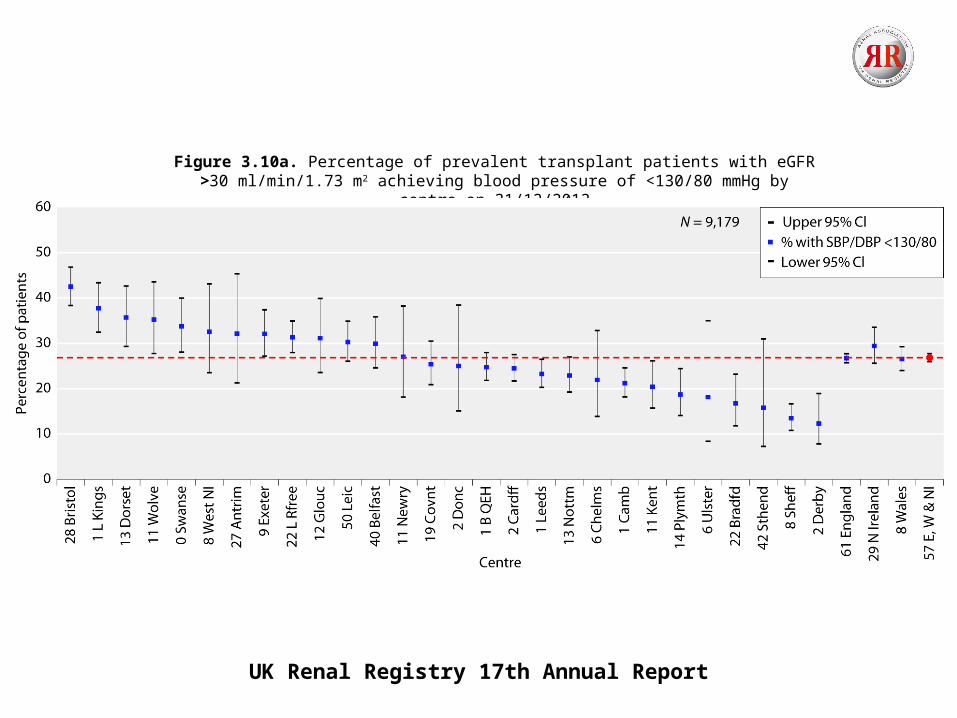
Figure 3.10a. Percentage of prevalent transplant patients with eGFR >30 ml/min/1.73 m2 achieving blood pressure of <130/80 mmHg by centre on 31/12/2013
UK Renal Registry 17th Annual Report
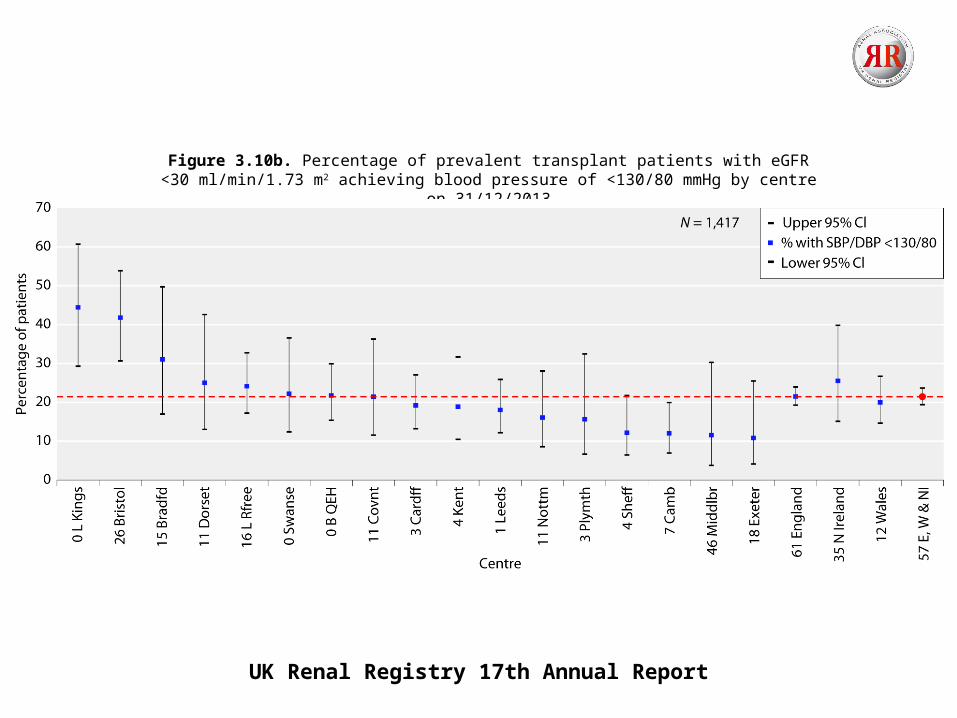
Figure 3.10b. Percentage of prevalent transplant patients with eGFR <30 ml/min/1.73 m2 achieving blood pressure of <130/80 mmHg by centre on 31/12/2013
UK Renal Registry 17th Annual Report
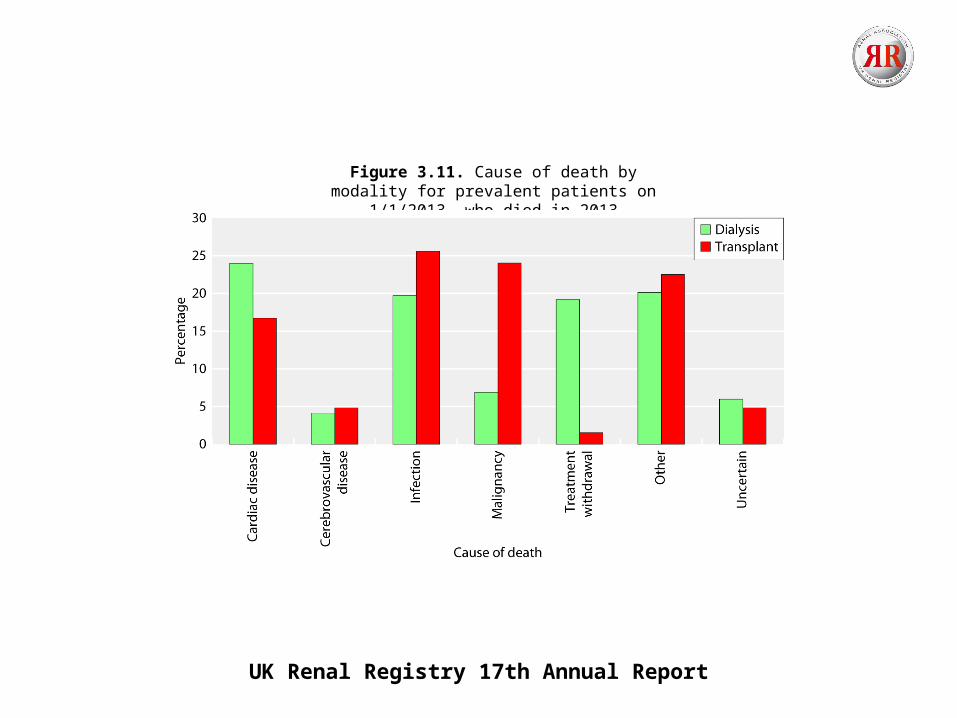
Figure 3.11. Cause of death by modality for prevalent patients on 1/1/2013, who died in 2013