uk growth a new chapter - lse · pdf fileuk growth a new chapter. spinnaker tower, ... the tax...
TRANSCRIPT

UK GROWTH A New Chapter

Spinnaker Tower, Gunwharf Quay, Portsmouth, Hampshire, England, United Kingdom, Europe
11
Jobs and skills
In a world of rapidly changing technologies and labour markets it is essential to develop systems of lifelong learning to promote greater security and adaptability for workers. Britain’s tax system should be reformed to support companies’ investment in skills. At present the tax system tilts the economy in favour of self-employment over employee status, and towards investing in buildings and machines over staff. Tax reforms for the self-employed and a skills and training tax credit system are recommended. Boosting skills and wages in this way is key to supporting inclusive growth.
Industrial strategy
The government is right to focus here but there are gaps between this vital area and monetary, fiscal and competition policy. Industrial strategy decisions should be based on a new British State Aid law, clear operational rules and competitive tendering, independent oversight, and statutory publication of the analysis supporting decisions. The new industrial strategy should include an overarching plan on infrastructure, innovation and tackling shortages at all skill levels – including a focus on particular demographic groups.
Openness
The UK’s long-standing commitment to openness should be maintained as the UK forges new relationships with the EU and rest of the world. Britain’s strength is in services, and two-thirds of the country’s trade is with the US and EU. Negotiations must focus here: a trade deal with the US is needed, as is a new EU trade agreement with a “services passport” at its core. The UK must continue to engage strongly in international institutions for trade, investment, aid and public goods. Visa reforms must ensure that the UK’s skills shortages do not intensify.
Finance and growth
Despite the overall strengths in the UK’s financial services sector, there are longstanding issues in the provision of finance to innovative firms and for infrastructure projects. Government should launch a set of financial reforms based on promoting access, competition and long-termism in finance. Reforms should focus on improving access to finance for businesses and innovation, including flexible regulation of challenger banks, increased support for the FinTech sector, improving incentives for equity investment, a boosted role for the British Business Bank and a new infrastructure bank.
A blueprint for growth in 2017 and beyond

2
The LSE Growth Commission Research is funded by the Economic & Social Research Council and the
LSE Higher Education Innovation Fund

3
Executive Summary
The UK Economy is at a critical juncture. Leaving the EU creates economic challenges that necessitate widespread policy change. But this also generates an opportunity to tackle some of the long-standing challenges which have resulted in the UK’s productivity lagging behind our major competitors. Decisions made in the next year will have a lasting impact on the UK’s economic trajectory for years to come. If the government gets these decisions right, the economy will be more productive, more equitable and more environmentally sustainable.
The LSE Growth Commission belongs to a long-standing tradition of engagement between research, business and policy-making which has been the hallmark of the LSE since its foundation. The report draws on evidence and analytical arguments to make a range of concrete policy recommendations affecting labour markets, industrial strategy, trade, immigration and finance. Together they form a blueprint for growth which should command support across the political spectrum.
The UK faces a number of growth challenges in the coming years.
The issues outlined in the first report of the LSE Growth Commission
concerning the UK’s chronic underinvestment in skills, infrastructure
and innovation remain. The economy is growing, but this is largely
accounted for by increases in employment rather than productivity.
In the long run productivity is what drives prosperity, but the UK
lags behind its peers with UK workers around 30% less productive
on average than their counterparts in the US, Germany and France.
Improving our productivity performance therefore must be central
to government’s economic strategy.
Much has changed since our first report was published in 2013,
most notably the result of the UK’s referendum on EU membership.
As Brexit becomes a reality and the UK begins to define a new
relationship with the EU and the rest of the world, many of the
assumptions behind the UK growth strategy of the past quarter
century are open to debate. The UK has relied heavily on skilled
migrant labour as a means of plugging the deficiencies of the
education and training systems. At the same time, the strength of
the higher education system has attracted some of the best global
talent. The UK’s commitment to open markets and trade has been
underpinned by its membership of the Single Market which provides
the basis of a competitive environment for firms and has opened
up market opportunities for UK-based businesses. Although the
contribution of the financial sector to the UK’s success over the
quarter century leading up to the financial crisis has often been
exaggerated, it remains one of the UK’s core strengths. Further, the
business services sector, and the services sector more broadly, have
played a key role in generating UK growth.
The Brexit vote and a general rise of anti-globalisation sentiment in
the US and other Western democracies have brought into sharp relief
the importance of ensuring that the benefits of economic growth
are distributed across society. The evidence points to the importance
of technological change, not only in creating job opportunities for
some, but also disrupting them for others, a process which deserves
closer attention from policy makers than it has received in the past,
if more inclusive growth is to be realised.
In addition to the evolving political and economic landscape at
home, a range of international developments have implications for
UK growth. The world economy has been slow to pick up after the
financial crisis and the view that the industrialised world is entering
a period of “secular stagnation” has gained currency. This, coupled
with continued instability in the Euro area and the prospect of a
slowdown in China, creates an uncertain global outlook from which
the UK will not be insulated.
The year 2015 was remarkable in its efforts to forge a global agenda
with agreement on sustainable development goals and climate
change. There is arguably more consensus on this agenda than at any
time since the early years after the Second World War, and whether
this will be undone by the new administration in Washington DC
remains to be seen. Sustainable infrastructure will be key to this
agenda in the next 15-20 years. Having been a major player in both
agreements, the UK is well-placed to carry this agenda forward with
a new industrial strategy and through reshaping UK infrastructure.
The Commission has made recommendations in four areas to reflect
Brexit issues and new government structures.

4
Labour markets and inclusive growth
The fact that employment in the UK has risen to record levels despite
the echoes of the financial crisis and the slowdown in global growth is
a great achievement. But the other side of Britain’s high-employment
economy is low pay, and the rise of fragile employment status
including self-employment and on-call (so called “gig”) workers.
The Commission does not support proposals that would clamp
down on these new forms of employment. At the same time,
British policy – tax, regulatory and skills – should be tilted in favour
of employees in low-skill sectors. At present the system is biased
against them. The Commission recommends consulting on
fundamental reform of the tax and minimum wage system
so that it is neutral on forms of employment, and neutral
between investing in machines and in people. In particular:
• Lifelong learning and adaptable skills. Rapidly changing
technologies and labour markets make it essential for governments
to promote a labour market with greater security and adaptability
for workers, including lifelong learning.
• Eliminate biases against employment. The advantages for firms
and employees using self-employment as a means of avoiding
payroll taxes and circumventing minimum wage legislation should
cease. The classification of employment versus self-employment is
in need of clarification and reform.
• Eliminate biases that favour physical capital and new
technology over human capital. Tax breaks and allowances
for capital should be extended to a generalised tax break for “skills
investment”. This should place investment in staff training, courses
and education on the same footing as investment in plant and
machinery. In nature this could be a Skills and Training tax credit,
akin to the R&D tax credit that currently exists.
Industrial strategy
Supporting UK business requires continued investment in skills,
infrastructure and innovation as emphasised in our first report. These
horizontal policies support business across the board, and there is
also a need to continue developing policies focused on particular
sectors, technologies or places. The current government has rightly
put industrial strategy at the top of its policy agenda. There is a huge
opportunity here: this area of policy is opaque, unaccountable and
changeable and requires root and branch reform. The UK’s recent
economic history including the reform of monetary and competition
policy in the late 1990s, and fiscal policy (with the establishment
of the OBR in 2010) show that huge improvements are possible
in a short period of time. The Commission proposes a new
institutional architecture for delivering the government’s
emergent industrial strategy. The new system should include
the key elements that other areas of British economic policy benefit
from, including:
• Law and mandate. A new law or long-lasting mandate, including
a state aid law, and an institutional framework to implement it;
• Policy guidelines everyone understands. A set of publicly stated
guidelines for intervention in particular sectors, technologies or
places, with competitive tendering where possible;
• Independent oversight. The ultimate objective is a long-
term industrial strategy that is isolated from political cycles. An
independent body should strive to overcome fragmentation across
different levels of government.
• Transparency, accountability and scrutiny. Government should
publish a long-term plan. The body responsible for industrial strategy
should publish a standardised Industrial Strategy Report each year
on the state of British business, setting out policy decisions, their
rationale, cost and impact.
The Commission sets out six key priorities that the new industrial
strategy framework should pursue in its first long-term plan. They
include tackling skills shortages at all levels (in particular basic skills
deficiencies and ensuring the UK utilises and invests in female talent),
a focus on the low-wage, low-productivity sectors that employ large
numbers of UK workers; new steps for financial support for firms with
high growth potential; enhanced collaboration between universities,
government and the private sector; continued devolution of power
and support to local leaders; and developing a set of wider public
goals industrial strategy will support, including green technologies,
health and social care.

5
Openness
The result of the June 2016 referendum on EU membership will
change the way goods, services, capital and people cross the UK’s
borders. The main task for policy makers is to find a set of trade,
investment and immigration arrangements that are best for the UK.
The UK’s long-standing commitment to openness should be
maintained as the UK forges new relationships with the EU
and rest of the world. This means low tariff and non-tariff barriers,
facilitating Foreign Direct Investment (FDI) and openness to global
talent. In particular:
• Focus on big deals. While progress with Canada and Australia
is welcome, the UK must prioritise deals with its largest trading
partners – the EU and the US. Striking a free trade agreement with
the US with a focus on reducing non-tariff barriers could provide
a blueprint for other bilateral negotiations. Government should
also be mindful of the medium term potential of fast growing
emerging markets.
• A new EU Free Trade Agreement (FTA) built on services trade.
The new deal with the EU must prioritise market access for services,
the UK’s key area of comparative advantage.
• Maintain openness to investment. Trade and FDI must be
considered in tandem. Many of the sectors where the UK is a
strong exporter are also host to high levels of FDI and are often
engaged in global value chains.
• Continue strong engagement in international institutions.
This is essential for fostering constructive internationalism and
the context for world trade at a time when they are under threat.
The UK must preserve its status as a magnet for talented people
from around the world. An open approach to international talent
complements the natural advantages – including language, time zone
and legal system – that make the UK a good place to study, work
or build a business. The Commission proposes that government
should seek to:
• Attract more skilled workers. Rather than pursuing a net
migration target and limiting the numbers of visas for skilled
workers granted, the UK should aspire to an increase in the stock
of foreign-born (EU and non-EU) skilled workers living in the UK.
Finance and growth
The UK is a world-leading financial centre, and financial services
are an important source of jobs, tax revenues and exports. Brexit
poses a threat to the pre-eminence of the City of London and the
associated supply chain of business services which have benefited
from EU membership. This could have negative implications across
the UK, since half of all financial services jobs are outside London.
In order to avoid these, the Commission proposes:
• A services passport. Develop a near-equivalent to the EU services
passport (to include financial services) as a matter of urgency.
• Opening up to new markets. Foster new links with non-EU global
financial centres, especially in fast-growing emerging and frontier
markets, such as China, India, Nigeria and Kenya. The Financial
Services Trade and Investment Board (FSTIB) should continue to
aim to strengthen the UK’s position as the centre of emerging
market finance.
Despite the overall strengths of the financial services sector, there are
long-standing issues in the provision of finance to firms with high
growth potential and for infrastructure projects. The Commission
proposes steps to support competition in the banking sector,
and measures to promote long-term investment (“patient
capital”) that can help alleviate financing constraints for fast
growing, productive firms. In particular, the Commission proposes:
• Challenger banks. Support the development of challenger banks
by utilising flexibility on capital requirements that will be possible
outside the EU.
• FinTech. Support the FinTech sector by granting investors access
to tax relief schemes, such as the Equity Investment Scheme (EIS)
and the Seed Equity Investment Scheme (SEIS).
• SME securitisation. Create a corporate bond market for SMEs,
including efforts to kick-start SME loan securitisation.
• Equity culture. Design corporate governance requirements,
including reporting and investor engagement, to create incentives
for long-term equity investment.
• The British Business Bank. Expand the role of the BBB using
flexibilities not possible under EU rules. This added flexibility could
give the BBB a pivotal role in supporting the UK’s Industrial Policy.
• A new infrastructure bank. This would help address problems
raising finance for infrastructure projects. It is also important to
ensure that the Green Investment Bank continues to operate
effectively as a development bank.

6
The Commissioners
The Commission’s twelve members have wide experience in academia,
policy and the corporate sector:
Co-chairs:
Timothy Besley, School Professor of Economics and Political Science,
LSE
Stephen Machin, Professor of Economics and Director of the Centre
for Economic Performance, LSE
Lord Nicholas Stern, IG Patel Chair of Economics and Government,
LSE
Members:
Philippe Aghion, Professor of Economics, LSE and Collège de France
Tera Allas, Visiting Fellow, McKinsey Global Institute
Lord John Browne, former CEO, BP plc
Francesco Caselli, Norman Sosnow Professor of Economics, LSE
Sir Richard Lambert, Chairman, British Museum
Rachel Lomax, Non-Executive Director, HSBC and Heathrow Airport
Gianmarco Ottaviano, Professor of Economics, LSE
Sir Christopher Pissarides, Regius Professor of Economics, LSE
Xavier Rolet, Chief Executive, London Stock Exchange Group
Staff:
Richard Davies, Research Director and Chief of Staff
Isabelle Roland, Research Director
Anna Valero, Research Director
Acknowledgements
The Commission has drawn on a team of research assistants at the
LSE’s Centre for Economic Performance including Aniket Baksy, Sandra
Bernick, Novella Bottini, Pawel Bukowski, Benjamin Clayton, Rui
Costa, Nikhil Datta, Niklas Grimm, Ivelina Hristova, Amartya Menon,
Frank Pisch and Jean-Christophe Spiliotis-Saquet. The Commissioners
and research team would like to thank Thorsten Beck, Jo Cantlay,
Swati Dhingra, Monique Ebell, Alan Manning, Veronica Rappoport,
Nigel Rogers, Thomas Sampson, Catherine Thomas and Jonathan
Wadsworth for their inputs; and the policy makers, business people
and members of the public who attended the five open sessions held
during November and December 2016.
These public sessions were filmed and are available on the LSE Growth
Commission web page. The Commissioners thank EconFilms for their
work on this. The sessions were:
• What Next for Growth in the UK? Panel discussion with Stephanie
Flanders (JP Morgan), Vince Cable, Alistair Darling, and George
Osborne. 2 November 2016.
• Labour Markets and Inclusive Growth. Evidence session
with David Autor (MIT), Richard Blundell (UCL & IFS), Gavin Kelly
(Resolution Foundation) and Rain Newton Smith (CBI). 17 November
2016.
• Openness, Trade and FDI. Evidence session with Karolina Ekholm
(Ministry of Finance, Sweden); Karen Helene Ullveit-Moe (University
of Oslo and Bank of Norway); Lionel Fontagné (CEPII), Paola
Conconi (ECARES); Will Page (Spotify); Tim Sarson (KPMG). 21
November 2016.
• Industrial Policy and Growth. Evidence session with Mariana
Mazzucato (Sussex University); Kate Collyer (Competition and
Markets Authority); Gary Elliottt (Aerospace Technology Institute);
Mark Littlewood (Institute of Economic Affairs); Alan Overd (Charles
Rivers Associates). 22 November 2016.
• Finance and the City of London. Evidence session with David
Miles (Imperial); Huw Evans (ABI); Charles Bean (LSE); Jenny Tooth
(UKBAA); Adam Jackson & David Morrey (Grant Thornton); Angus
Canvin (Investment Association); Lindsey Naylor (Oliver Wyman);
Peter Smith (Blockchain). 6 December 2016.
The vast majority of the analytical work undertaken for this report
used public data sources. The Commission’s research team would
like to thank staff at the ONS, OECD and the Bank of England for
their assistance with data requests. This work contains statistical data
from the ONS which is Crown Copyright. The use of ONS statistical
data does not imply the endorsement of the ONS in relation to the
interpretation or analysis of the data. This work uses research datasets
which may not exactly reproduce National Statistics aggregates.

7
1. A New Chapter in the Story of UK Growth ......................................................................................................................................... 9
2. Labour Markets and Inclusive Growth ....................................................................................................................................................... 19
3. Industrial Strategy ........................................................................................................................................................................................................................................... 33
4. Openness ................................................................................................................................................................................................................................................................................ 51
5. Finance and Growth .................................................................................................................................................................................................................................. 69
References ............................................................................................................................................................................................................................................................................................... 82
Contents
See the website for further information http://lse.ac.uk/growthcommission

8
£450-£800£400-£450£350-£400£300-£350£240-£300NO DATA
£500-£920£450-£500£400-£450£350-£400£290-£350NO DATA
1997 2016
Source: ONS.
Weekly Wages in Britain, 1997 and 2016

9
1. A New Chapter in the Story of UK Growth
Much has changed since the Growth Commission’s first report, published in 2013. Since then the government has adopted new policies on skills, infrastructure and regional devolution. But June 2016 marked a more fundamental shift: the result of the referendum on EU membership will fundamentally re-define the UK’s trading relationships both with the EU and rest of the world, and the “Brexit” vote led to a new Prime Minister and Chancellor with new economic priorities. This chapter provides the background for our new report. It starts by reviewing the impact of our 2013 publication, before summarising the important changes that have taken place in the UK economy since then.
The 2013 report – recommendations and impact
The LSE Growth Commission’s first report, “Investing for
Prosperity,” contained recommendations in three main areas of UK
underperformance: skills, infrastructure and innovation. Since then a
number of our recommendations – notably on infrastructure – have
been adopted. Other areas have seen little movement, or the UK fall
further behind our advanced-economy peers (see Table 1.1).
Skills
Strong human capital is critical for sustainable growth. The first
Growth Commission focused on an area where the UK has persistently
underperformed: inadequately educated young people emerging into the
world of work. This is widely cited as one of the key factors underlying
our longstanding productivity gap with other large economies.
The core recommendations for improving human capital in the
UK related to schools and included measures to improve teacher
quality; to create a more flexible system (through greater autonomy
for schools, parental choice, and easier growth of successful schools)
and a greater focus on outcomes for disadvantaged pupils.
Since 2013 government policy has continued its earlier trend, with
specific reforms implemented both in terms of the administration of
schools and curricula. The coalition government pursued a number
of policies to raise the quality of teaching and school leadership
through changes to training for new and current teachers, raising
the status of the teaching profession to attract higher calibre teachers
and improving the quality of school leadership. There were reforms
to link teachers’ pay to performance, and new tougher skills tests for
trainees. Reforms continued on a similar track under the Conservative
government of 2015-2016.
The government has continued to drive academisation of primary and
secondary schools. We supported academisation, but suggested
that expansion should be focused on underperforming schools
with identified problems serving disadvantaged children.
Today over 60% of secondary schools are academies, compared with
around 15% of primary schools. Full academisation (or close to it)
could occur by 2020.
While there is evidence that the secondary academies in disadvantaged
areas set up in the early 2000s had a strong effect on pupil intake
and on pupil performance, ongoing research on the effectiveness
of the much larger-scale policy, including the conversion of high-
performing schools and extending the policy to primary schools since
2010, suggests that it has no effect on students after conversion
in most schools.1 Since restructuring the system is costly and
potentially irreversible, the government should focus on poorly
performing schools. Improving education is crucial for raising growth
and reducing inequality.
More recently, the Prime Minister has announced plans to expand
grammar schools, and they received additional funds in the Autumn
Statement. Those in favour of such policies argue that grammar schools
improve the opportunities for poorer children. However children from
disadvantaged backgrounds are under-represented in grammar
schools and evidence suggests that education in non-selective schools
is likely to suffer as the number of selective schools rises.2
1 See Eyles and Machin (2015) and Eyles, Machin and McNally (2016).2 See Atkinson et al. (2006).

10
The pupil premium (a grant for disadvantaged pupils, introduced in
2011) was supported in our first report but the Commission suggested
that the indicators used to identify “disadvantaged” pupils should be
widened to include more than free school meal status. Since then,
the level of funding per pupil has increased and eligibility for deprived
children has been extended to those that have been in receipt of free
school meals in the past 6 years. We also proposed that the progress
of disadvantaged children should be given more prominence in school
inspections. There has been progress here: Ofsted now report on how
schools’ use of the pupil premium funding affects the attainment
of their disadvantaged pupils, and a number of related metrics are
included in performance tables.
Underperforming schools in disadvantaged areas find it hard to
attract high-quality teachers. To date, school revenue allocations are
heavily influenced by historical funding levels – the so-called “spend
plus” methodology, which does not adequately reflect different
local conditions, nor challenges in recruitment and retention. The
government has been consulting on a new funding formula,
and in December 2016 announced proposals that would
see historically lower-funded local authorities increase their
allocations, at the expense of schools in London and other urban
areas that have historically received higher funds. Importantly, these
reallocations are set against a background of real-terms cuts in
school spending estimated at 8% per pupil by 2019-20.3 This will
be the first time since the mid-1990s that school spending has fallen,
and the real-terms cut is the largest since the 1970s.
These budgetary pressures risk harming educational outcomes, at a time
when there are already concerns about the UK’s performance compared
to other countries’.4 Despite the large-scale reforms undertaken in
recent years, and the government’s stated aims for England to get
the highest scores in Europe by 2020, the latest data from the OECD’s
international student assessment (PISA) show that little has changed:
the UK is below the OECD average in maths, and lags European
peers, including Germany, in reading.5 In a resource constrained
environment it is especially important to understand what works in
terms of improving outcomes. A good example is the availability to
researchers of data sources like the National Pupil Database which
enables robust policy evaluation, a pre-requisite for the effective design
of evidence-based policy.
3 IFS (2016).4 NAO (2016).5 England has the best scores of the UK nations, and is just above average across PISA countries in science and reading, and below average in maths, see https://www.gov.uk/government/publications/pisa-2015-national-report-for-england
The first Growth Commission highlighted vital shortcomings in
effective pre-school education in the UK. Children’s centres,
introduced by the last Labour government’s Sure Start programme,
are one way to do this and the Commission recommended that
resources should be focused on the disadvantaged with an emphasis
on evaluating best practice and propagating it throughout the system.
Children’s centres have been successful at improving outcomes for
disadvantaged children and parents, but budget cuts since 2010 have
led many local authorities to close down or reduce children’s
centres services. On the other hand it is encouraging that government
has doubled the number of free childcare hours for 3 and 4
year olds from 15 to 30 hours per week, and is providing additional
support for children from disadvantaged backgrounds. This type of
policy should not only allow more children to benefit from pre-school
learning, but also support working mothers.
Our 2013 report highlighted worrying inadequacies in technical
education and shortages in technical skills. The quality of vocational
qualifications needs to be improved so that they represent a real
alternative to university for school leavers, and add value for employers.
The problems discussed in the 2011 Wolf report remain. There are
still numerous vocational qualifications on offer, and the potential
routes to be followed post-16 are much less well known than A-levels.
Qualifications are awarded by many different bodies, and the quality
of expected outcomes following vocational options is often unclear
to school leavers, teachers and employers.

11
TABLE 1.1: POLICY PROGRESS AGAINST CORE RECOMMENDATIONS OF THE FIRST GROWTH COMMISSION
Recommendation Progress
Hu
man
cap
ital
Schools Improving teacher quality, “flexible ecology”, accountability for disadvantaged pupils
Pre-schools Improving effectiveness for disadvantaged children
Further Education Improving the quality of technical education and apprenticeships
Higher Education Protecting and building on strengths in universities
Infr
astr
uct
ure Infrastructure Planning Independent “Infrastructure Strategy Board”, Independent “Infrastructure Planning
Commission”, improved compensation schemes
Infrastructure Finance “Infrastructure Bank”, accounting rules, road pricing
Inve
stm
ent
and
In
nova
tio
n
SME Finance Policies to increase competition in retail banking
Business Bank to prioritise young innovative firms
Long-termism Regulation and tax policy for long-termism
Industrial policy for key sectors
Management practices Targeted managerial training and support
Oth
er Inclusive Growth Publishing median income alongside GDP
Good progress Some progress Little progress
The 2015 “Productivity Plan” set out policies to raise the prestige of
vocational qualifications, and the 2016 “Post-16 Skills Plan” includes
wide-ranging reforms that would simplify and improve the post-16
system of vocational training, for example through the creation of a
small number of full-time technical routes with a single awarding body.
While this plan appears promising, it is necessary that reforms to the
further education sector are aligned with the government’s industrial
strategy. For example, the retail sector is notably absent and there is a
strong case for government action to address obstacles to productivity
growth in this low-pay, low-productivity sector (see Chapter 3).
Another challenge for the further education sector is that planned
reforms will not be met with additional funds: education spending
for 16-19 year olds fell by 14% in real terms between 2010/11 and
2014/15, and is protected only in nominal terms going forward.6
The new Apprenticeship Levy is due to take effect in 2017, which is
expected to raise £2.8 billion by 2020.
6 See IFS (2015).
The UK has longstanding strengths in higher education which
our first report suggested protecting and building on. It is essential that
leading universities are able to recruit international talent (as faculty,
research staff and students), and there were already signs in 2013 that
this was becoming difficult for non-EU nationals. High quality students
and researchers from abroad can not only contribute to the economy
directly, but international students also increase resources available
for domestic students.7 Government policy has gone backwards
in this area. The visa system for non-EU nationals has not
improved and there are new concerns around the status of EU
students and academics following the Brexit vote. There are also
new risks to the HE sector with respect to cross-border collaboration
in research projects and their funding, a large portion of which has
come from the EU. The Commission also suggested further improving
the framework of rules and accountability in teaching and research.8
7 See Machin and Murphy (2014).8 Stern Review (2016).

12
The funding of higher education has changed since our last report.
In 2012 the coalition government raised the cap on tuition fees
for undergraduate courses to £6,000 for all universities. But an
allowance to charge £9,000, designed for use only in exceptional
circumstances, is now being used by the vast majority of
universities. The first Commission concluded that these changes
would create a more stable funding environment allowing universities
to make long-term investments in their facilities and programmes.
However continued increases in the total costs of university
education are likely to create a tension with opening up access to
poorer families. Evidence suggests that the conversion of maintenance
grants to loans (a more recent policy, which took effect from September
2016) is likely to hurt applications from poorer students.9
There have been positive developments too: new loans for postgraduate
and MBA study were announced in the Productivity Plan, with the
latter aiming to improve management practices in UK firms, which are
a key determinant of productivity. In addition, the Higher Education
and Research Bill is currently being pushed through Parliament, which
announced the expansion of the sector with the aim of fostering
growth and social mobility. In addition, an extra £2 billion annually
was promised to the science budget in the Autumn Statement (from
the new National Productivity Investment Fund, NPIF). This increase
will take total (government and business) R&D spending as a share of
GDP to 1.8% (from the current 1.7%). This is a welcome increase,
but leaves the UK spending a lower share of GDP on R&D than
most other advanced economies.
Infrastructure
Infrastructure is a vital component in sustainable growth. The first
Growth Commission outlined persistent inadequacies in all areas of
UK infrastructure and made a number of recommendations aimed
at stimulating infrastructure investment. The core recommendations
were to create a new institutional architecture: an independent body
to guide strategic priorities, a commission to implement those priorities
and an infrastructure bank to crowd in private sector investment.
The aim of these suggestions was to eradicate short-termism,
often politically driven, from long-term infrastructure decisions.
9 See Dearden et al. (2014) and Dynarski (2003).
There has been good progress in this area, with the establishment
of an independent National Infrastructure Commission (NIC)
which was announced in autumn 2015. In March 2016 the NIC
published its first set of reports, setting out advice on Crossrail 2,
Northern connectivity and smart power. In November and December
2016 it also published further reports on growth in the Oxford-Milton
Keynes-Cambridge corridor and 5G telecommunications connectivity.
Its charter was published in 2016, and has come into force in January
2017. The NIC is a positive development, and should tackle a number
of problems set out in our first report, but its lack of statutory powers
creates concern about its long-term independence.
Britain has a longstanding shortage of housing supply, with house
prices rising by 45% since 2005. Independent estimates indicate that
around 250,000 new houses are needed each year in order to moderate
house price inflation. The lack of affordable housing is a concern in
terms of both productivity and inequality, preventing people from
moving to high growth regions, and meaning that poorer families
spend a large share of their income on mortgage payments or rent.
Progress has been much slower in other areas. An independent planning
commission, charged with handling planning appeals and national
applications (making decisions according to National Policy Statements)
was in existence. However, in 2012, the coalition government brought
its operations back into government as the “Planning Inspectorate”.
Our first report discussed obstacles in obtaining local community
consent for projects considered to generate an aggregate gain. There
is a need for a more consultative process, involving communities early
on, and designing creative mechanisms (over and above monetary
compensation) in order to share the gains of development. There is an
opportunity for the new NIC to work with the Planning Inspectorate
in this area.

13
Infrastructure finance is a longstanding problem in the UK. The
first Commission developed a blueprint for a National Infrastructure
Bank to facilitate the provision of finance for infrastructure projects,
reduce and manage risk, and attract private sector investment. There
are a number of international examples that show the potential benefits
of such a bank (including Germany’s KfW, and the European Bank for
Reconstruction and Development). To date there has been no indication
that government might set up an infrastructure bank. In part, this may
be due to restrictions on government spending, or issues around how
such a bank would be accounted for on national balance sheets. The
current policy environment creates an opportunity here, both in terms
of the loosening of the fiscal stance in recent months, and the fact
that post-Brexit the UK will be able to formulate its own state aid rules
rather than having to obtain approval from the European Commission
for this kind of institution.
There have been some efforts to raise funds for infrastructure projects.
In autumn 2015 the government committed to sell state owned assets
and reinvest the proceeds in infrastructure. There is also ongoing work to
ensure that a portion of local authority pension funds capital – currently
around £217 billion – is pooled and invested in infrastructure. Both of
these policy developments are welcome, but will take time to materialise.
In the 2016 Autumn Statement, the new NPIF was announced, a fund
worth £23 billion to be used on infrastructure and R&D, and financed
through additional government borrowing. Again this is a positive step,
but infrastructure spending remains low by international standards and
there is still a gap between spending and estimated infrastructure needs.10
Investment and innovation
Our 2013 report made a series of recommendations to improve the
financing of investment, in particular addressing barriers for high growth
potential SMEs in accessing finance. These included policies to increase
competition in retail banking and a business bank that would
prioritise young, innovative firms using a variety of financing tools.
10 McKinsey (2016).
The coalition government introduced a number of measures
aimed at restructuring the retail banking market and stimulating
investment, in particular, removing barriers to entry and separating
retail and investment banking. There were also a number of policies
to improve effective competition: a new seven-day current-account
switching service was introduced in 2013 and a new project was launched
to give customers standardised information to enable comparison of
account services. The SME sector has been a particular focus, with a
number of policies aimed at helping them raise finance measures to
improve comparison of services, and to match SMEs that have been
rejected for finance with other lending opportunities from challenger
banks/alternative finance providers (for example, “Funding for Lending”).
Despite these positive steps, the UK’s independent competition
regulator recently concluded there are shortfalls in competition. 11
The British Business Bank, a publicly owned enterprise that provides
credit and other forms of finance via private sector partners to SMEs,
has expanded since our first report. By 2015-16 its total stock of finance
(which includes funds directly deployed and funds that its participation
has unlocked) reached £7.5 billion, up 45% on the previous year, and in
the 2016 Autumn Statement, the Chancellor announced that it would
receive additional funding. While this is a welcome development, it is
important to note that the Business Bank represents a very small share
of the total finance provided to the UK corporate sector.
Our first report identified financial short-termism as a longstanding
problem in the UK and suggested regulatory or tax changes to promote
a longer-term perspective. In particular, it proposed linking equity
voting rights to investment duration to give long-term shareholders
more power. The 2015 Productivity Plan highlighted the problems
surrounding short-termism in business and financial markets but
stated that government would leave it to institutional investors and
businesses to push for more long-termism themselves, rather than
introducing changes to corporate governance rules.
Since taking office, the Prime Minister has discussed potential regulatory
changes to corporate governance, such as worker involvement in setting
executive pay. Government has also launched a Patient Capital Review,
led by HM Treasury, to understand the barriers faced by innovative
firms accessing long-term investment.
11 CMA (2016).

14
Our 2013 report advocated the development of a modern industrial
strategy, supporting industries where the UK has comparative
advantage and there exists growth potential. Progress on industrial
strategy has reflected the pattern in Britain for the past 20
years – government policy is often fragmented and lacking in
coherence and continuity. The coalition government launched an
“Industrial Strategy” which included support for eleven Key Sectors
and eight Key Technologies. This strategy was not explicitly maintained
following the 2015 general election, though elements of the work
continued. The Prime Minister has indicated a commitment to this
type of framework, and government has set out a Green Paper in
January 2017. The CEP will respond formally to the Green Paper. In
this report we provide a description of industry, across sectors and
regions, and consider lessons from international case studies to make
recommendations on a modern industrial policy for the UK.
Inclusive growth policy
Growth is a precondition for economic wellbeing but does not
guarantee it, particularly if the gains from growth are not shared.
Our first report recommended publishing of median household income
alongside the latest data on GDP in order to focus more attention on
inclusive growth and distributional issues. Coverage on these issues
in the UK is particularly weak, in part due to a lack of timely data.
While our proposals have not been adopted, the lack of inclusiveness
in the growth process has become increasingly salient in public debate:
largely due to a realisation of the political implications of ignoring it.
This topic has been explored in more detail in this report.
The UK economy at the start of 2017
Like other advanced economies, the UK was hit hard by the 2008
financial crisis. Since then, across the rich world, growth has been
subdued. Relative to its main comparators, UK GDP growth has been
strong (Figure 1.1).
FIGURE 1.1: GDP GROWTH
115
110
105
100
95
90
FRANCE GERMANY UK
2008
2009
2010
2011
2012
2013
2014
2015
2016
US
GD
P (2
00
8 Q
2=10
0)
Notes: Volume measure, 2008 Q2=100. Sources: INSEE, Statistisches Bundesamt, ONS, FRED.
The drivers of growth have varied across countries. In the UK, the
principal growth driver has been employment. As Figure 1.2
shows, the employment rate has held up, remaining above 70% since
2008, and is now at 74.5%, an all-time high since comparable records
began in 1971.
However, productivity growth has lagged far behind other
countries. GDP per hour stands at 17% below its trend between 1980
Q1 and 2008 Q2, and only just exceeds the level it was pre-crisis. This
poor performance has been labelled the “Productivity Puzzle” because
economists have been unable to fully account for it.12
12 Barnett et al. (2014).

15
Since our last report the simultaneous emergence of low growth, inflation
and interest rates across many advanced economies has led many to
argue that we are witnessing a permanent “Secular Stagnation”.13
Others argue that this is temporary, relating to the cycle. It is likely that
a combination of factors are at work. While the puzzle is international,
on the whole our main peers have fared better since the financial crisis
and therefore the longstanding gap in productivity levels has become
ever wider: output per hour in the UK is now 35 percentage
points lower than that in Germany and 30 percentage points
below the US.
High levels of employment and low levels of productivity are two sides
of the same coin. It is arguably desirable for more people to be in work
with a lower average productivity, compared to an alternative of high
unemployment but higher productivity where less skilled workers are
excluded from the workforce. The challenge for policy makers is to
achieve productivity growth via innovation, investment, and upskilling
the workforce, rather than through the composition of the labour force.
FIGURE 1.2: UK EMPLOYMENT RATE
75
74
73
72
71
70
69
68
67
66
65
1971
1973
1975
1977
1979
1981
1983
1985
1987
1989
1991
1993
1995
1997
1999
2001
2003
2005
2007
2009
2011
2013
2015
2008
EMPL
OY
MEN
T R
ATE
(%)
Source: ONS, UK Employment rates (aged 16 to 64), seasonally adjusted.
13 Summers (2016).
Over the long run, there tends to be a relationship between productivity
and pay. Reflecting poor productivity performance, wage growth
in the UK has also been weak. The median worker’s pay is still
around 5% lower than its pre-crisis peak. This corresponds to almost
a 20% deficit relative to the trend in real wage growth from 1980
to the early 2000s. Moreover, UK wages have fallen by more than in
other OECD countries: with only Greece experiencing a larger fall in
wages over the period 2007 to 2015.
There are three other key concerns. First, the UK current account
deficit is far larger than in any other advanced economy – and
the largest in UK history. Second, the UK has a longstanding
investment shortfall. Gross fixed capital formation as a share of GDP
has been consistently lower in the UK than its main peers (Figure 1.3).
The same is true for investment in R&D. Key factors that hold back
business investment are policy uncertainty, short-termism in business
and financial markets and associated problems accessing finance
(especially for young, innovative firms).
Primary school pupils take part in experiments at Imperial College London science lab. Thomas Angus/Imperial College London.

16
Publicly financed R&D is an important source of UK innovation.
Moreover, there is extensive evidence that this type of research
“spills over” to the private sector, and leverages-in further private
sector investment. The UK has comparative advantage in its
university and research system, yet government financed R&D as
a proportion of GDP is lower than in other advanced economies
and this has been declining over time. Only recently did government
commit additional funds to the science budget.
In an economy that specialises in services it is helpful to take a wider
view of investment to include intangible assets (such as brands and
organisational practices). Such assets are not measured in conventional
output statistics. The UK generally does better in this area, and
intangible investment has actually risen since the financial crisis.
However, adjusting output to include intangibles appears to explain
only a small amount of the productivity puzzle.14
FIGURE 1.3: INVESTMENT RATE
24
22
20
18
16
14
FRANCE GERMANY UK
2000
2001
2002
2003
2004
2005
2006
2007
2008
2009
2010
2011
2012
2013
2014
2015
US
% O
F G
DP
Notes: Gross Fixed Capital Formation, % of GDP, series in constant prices, national base year. Source: OECD.
14 See for example Goodridge et al. (2015).
Finally, there are concerns that the supply of finance to the real
economy is still impaired following the financial crisis: lending
to business has been slower to recover than lending to households
(Figure 1.4). Business surveys show that over 60% of SMEs use no
external finance at all, and of those who do, bank finance (overdraft,
loans and credit cards) is most common. Participants at our evidence
sessions reported that other sources of finance that are more conducive
to innovation where returns are longer term and uncertain (for example,
private equity, crowdfunding or business angels) are less widespread in
the UK compared to the US.
The referendum on the UK’s membership of the EU should be seen
in light of these pre-existing challenges. Analysis from the CEP has
shown that under different Brexit scenarios, trade and foreign direct
investment (both of which are important for productivity growth) are
likely to suffer.15 Moreover, given the skill shortages already faced by
many firms in the UK, restricting the movement of labour from the EU is
likely to have a negative impact on productivity – both directly through
firms finding it harder to fill vacancies, but also indirectly through the
impact on innovation if our innovative firms, universities and research
labs are less able to attract and retain international talent.
15 See Dhingra et al. (2016a, 2016b).

17
FIGURE 1.4: LENDING GROWTH
20
15
10
5
0
-5
COMPANIES HOUSEHOLDS
1999
2000
2001
2002
2003
2004
2005
2006
2007
2008
2009
2010
2011
2012
2013
2014
2015
2016
LEN
DIN
G G
RO
WTH
(%)
Source: Bank of England.
The effect of low investment on both human and physical capital has
been a slowdown in productivity and wages. While pay at the very
bottom has been rising, median workers’ wages are lower in inflation-
adjusted terms than a decade ago. This pay stagnation has drawn
attention to inequality which, while falling in recent years in the UK, is
high by international standards.
The immediate impact of the EU referendum
The first GDP releases from the ONS following the referendum show
that the pattern of growth is broadly unchanged. GDP increased by
0.6% in Q4 2016, the same rate of growth as the previous two quarters.
This has been driven by a strong performance in the service sector. In
addition, the domestically focused FTSE midcap index is above its pre-
referendum level.
The impact on the value of the pound has been greater. Immediately
following the referendum result, the pound depreciated dramatically,
and then declined further upon announcement of the timetable for
Brexit negotiations. Today, the exchange rate is around 15% below its
level before the referendum. Driven by the growing price of imports,
inflation has risen to a two-year high.
The referendum result caused significant movements in other financial
markets too. The price of UK banks’ shares dropped dramatically in the
days after the referendum. At the same time their cost of funding, proxied
by Credit Default Swap (CDS) premia, rose. Since then funding concerns
have eased but the share prices of the UK’s two state-owned banks
remain significantly below their pre-crisis levels. .
Participants in our evidence session on Finance and the City of London
suggested that Brexit was starting to have an impact. Venture capital
fundraising dropped sharply in late 2016, with London falling behind
New York for the first time on some measures. In line with this, the
latest official forecasts suggest Brexit will have a significant impact.
The OBR assumes Britain will leave the EU in 2019; due to lower trade,
investment and immigration this will imply a 2.4 percentage point
cumulative reduction to growth over the next five years and additional
borrowing of nearly £60 billion.

18
Workers unpack suppliers’ goods at the ‘Inbound Receive’ area of Amazon’s distribution centre in Swansea, South Wales.

19
2. Labour Markets and Inclusive GrowthThe UK labour market has seen significant changes in recent years. A decade ago real wages were growing as pay increases outstripped price inflation. Following the 2008 crash, unemployment rose sharply and real wages fell significantly. Since then, the UK has experienced fast employment growth, but no growth of the typical worker’s pay. In fact, median real wages were lower in 2016 than they were in 2006 – a lost decade. This chapter examines wage stagnation and tracks the important changes in the way the UK labour market works. The Growth Commission proposes a range of specific measures designed to diminish the risk that the UK gets stuck in a low wage, low-skill rut.
Productivity, pay and compensation
Productivity growth provides potential for the growth of living standards.
As Figure 2.1 shows, it has followed two very different patterns over the
past 35 years. Between 1980 and 2007 productivity (measured as output
per worker, or output per hour) rose consistently year-on-year. The 2008
crash saw a drop in productivity: this has lasted, surprising academic
economists and professional forecasters alike. By 2016 Q3 productivity
had only just recovered back to 2008 levels; it is around 17% below the
level it would have achieved had the pre-crisis trend been maintained.
TABLE 2.1: KEY FACTS ON THE UK LABOUR MARKET, 2016
Labour force (m) 41
Employment (m) 25.8
Self-employment (m) 4.8
Unemployment (m) 1.6
Inactive (m) 8.9
Average number of weekly hours 31.9
Average weekly wage (FT) £644
Median weekly wage (FT) £539
National Living Wage (weekly FT) £252
90th percentile (weekly FT) £1058
10th percentile (weekly FT) £309
Notes: All numbers apart from wages refer to September 2016, from ONS Labour Market Statistics, January 2017. Wages from Annual Survey of Hours and Earnings, April 2016. FT stands for full-time workers.
FIGURE 2.1: PRODUCTIVITY TRENDS
120
100
80
60
40
1980
1984
1988
1992
1996
2000
2004
2008
2012
2016
PRO
DU
CTI
VIT
Y (
2007
Q3
= 1
00)
OUTPUT PER HOUR, Y/HY/H 1980/2007 TREND
OUTPUT PER WORKER, Y/LY/L 1980/2007 TREND
Notes: Output per worker and output per hour numbers are provided by ONS, and indexed to 2007 Q3 = 100. Trend is calculated by fitting a linear trend between 1980 Q1 and 2007 Q3, the predictions are calculated out of sample for time periods after 2007 Q3.
Until recently productivity and workers’ pay have tended to move in
tandem in the UK.1 This ended in 2008. Since then there has been nearly
a decade of slowdown. For many workers, total compensation is higher
than base pay, due to pensions, bonuses and other allowances like health
insurance. Compensation represents the total cost to a firm of hiring a
worker, and this has grown at almost the same rate as productivity in
Britain since 1990 (Figure 2.2). Thus the labour share of income has not
fallen as much as in other countries.2
Wages have followed a different growth pattern to compensation and
productivity (Figure 2.2).3 While the average (mean) and median wage
did grow in real terms until 2008, they grew by less than productivity and
compensation, and both have fallen considerably since then. This has
created a gap between productivity and wage growth that economists
refer to as “decoupling”.4 Decoupling intensified in the UK around the
time of the financial crisis; it is evident that in terms of wages alone, the
median worker has not shared equally in the gains from growth, and
that this trend predates the downturn.
1 Castle and Hendry (2014).2 See Karabarbounis and Neiman (2014).3 Bukowski et al. (2017).4 See Pessoa and Van Reenen (2013).

20
Decoupling has been driven by a number of factors. Until 2008 median
wages lagged productivity due to growing wage inequality and a widening
wedge between wages and compensation. The average wage grew
faster than the wage of the median worker. This pattern has changed
dramatically since 2008 and real wages have fallen. At the same time the
non-wage components of earnings – especially pensions – have become
more important. And since these benefits are not available to the self-
employed whose numbers have increased, their position has deteriorated.
FIGURE 2.2: PRODUCTIVITY, WAGES, AND COMPENSATION
170
160
150
140
130
120
110
100
1990
1991
1992
1993
1994
1995
1996
1997
1998
1999
2000
2001
2002
2003
2004
2005
2006
2007
2008
2009
2010
2011
2012
2013
2014
2015
2016
MEDIAN WAGE (CPI)PRODUCTIVITY (GVA) COMPENSATION (GVA)
IND
EXED
TO
100
IN 1
990
MEAN WAGE (CPI)
Notes: Growth rates of real productivity, real compensation (deflated by the GVA deflator), real average and median wages per hour (deflated by the CPI). Source: OECD National Accounts, ONS.
Wages and inflation
Between 2008 and 2014, and despite productivity having returned to close
to its pre-crisis level, real wages in the UK fell by 8%, a drop unprecedented
in modern history. Their slight recovery since 2014 (reducing the drop
since 2008 to 5%) was due to the fall in price inflation.
FIGURE 2.3: ANNUAL MEDIAN REAL WEEKLY EARNINGS
475
450
425
400
375
350
325
300
275
1980
1984
1988
1992
1996
2000
2004
2008
2012
2016
CPI CPIH RPIJ
MED
IAN
REA
L W
EEK
LY E
AR
NIN
GS,
£ 2
016
PRIC
ES
Notes: Weekly earnings deflated by CPI, CPIH and RPIJ. Source: Annual Survey of Hours and Earnings (ASHE).
These shifts in real wages are due to a change in the pattern of both
pay and prices. While between 2002 and 2008 average weekly
earnings rose at an average of 4% a year and prices at just 2%, from
July 2008 onwards the opposite occurred: pay growth fell to 2%, whilst
inflation exceeded this.5 The increase in real wages since 2014 (Figure
2.4) occurred because of a decrease in price inflation. However, this is
unlikely to continue because of the inflation rise predicted after Brexit.
5 There were two exceptions, March and April 2010, these two months show growth because of the large fall in the corresponding months of the previous year, which was driven by bonuses falling that year (Taylor et al., 2014).

21
Since the result of the June 2016 referendum on EU membership real
wages have been affected by rising inflation. Sterling has depreciated by
15% against the dollar since the eve of the vote and according to the
Bank of England’s most recent Inflation Report, the sterling depreciation
will lead to higher import costs, raising consumer price inflation above
target, hitting 2.7% in the next two years.6 Unless nominal wage rises
offset this rise in prices, inflation associated with sterling depreciation
threatens to undo recent improvements in real wage growth.
FIGURE 2.4: PAY GROWTH AND PRICE INFLATION
7
6
5
4
3
2
1
0
-1
-2
-3
2002
2004
2006
2008
2010
2012
2014
2016
% A
NN
UA
L G
RO
WTH
CPI TO JUNE 2008 CPI FROM JULY 2008
3 MONTH NOMINAL AWE 3 MONTH CPIMEAN AWE TO JUNE 2008 MEAN AWE FROM JULY 2008
Source: Average weekly Earnings (AWE) and CPI (three month averages) from ONS.
Placed in international context, UK real wage performance has
been very poor. Since the financial crisis, real wages have fallen by
more than in almost all other OECD countries. Figure 2.5 shows
comparable average real wage growth data for 2007 to 2015 for
28 countries. The UK’s relative performance is poor, placing it 27th,
the only country below it being Greece.
6 Bank of England, Inflation Report, November 2016.
FIGURE 2.5: INTERNATIONAL AVERAGE REAL WAGE GROWTH, 2007-15
REA
L H
OU
RLY
WA
GE
GR
OW
TH (
%)
20
10
0
-10
-20
GR
EEC
EU
NIT
ED K
ING
DO
MPO
RTU
GA
LIT
ALY
SLO
VEN
IAC
ZEC
H R
EPU
BLI
CJA
PAN
BEL
GIU
MU
NIT
ED S
TATE
SSP
AIN
IREL
AN
DN
ETH
ERLA
ND
SFI
NLA
ND
LATV
IAH
UN
GA
RY
DEN
MA
RK
AU
STR
ALI
AFR
AN
CE
LUX
EMB
OU
RG
AU
STR
IASW
ITZE
RLA
ND
SWED
ENK
OR
EAC
AN
AD
AG
ERM
AN
YN
OR
WA
YSL
OV
AK
REP
UB
LIC
POLA
ND
ESTO
NIA
Notes: Average real wages defined by the ratio between total wage bill and average hours worked. Source: OECD Stats, 2016.
The distribution of real wage changes in the UK
The decline in real wages in the UK since 2008 has varied considerably
across different groups (Table 2.2). Men have seen larger falls in real wages
(8%) than women (2%). Those at the top and in the middle (the 90th
and 50th percentiles) have seen wages fall, while those on the lowest
wages (the 10th percentile) have seen rises. This is consistent with the
fact that wage inequality did not rise during the downturn, and has
started to fall slightly in recent years. This contrasts with long-run wage
inequality trends since 1980, which peaked at the start of the downturn.7
7 See, for examples, Machin (2011).

22
Whilst the downturn experience of falling real wages for men has been
worse than for women, the gap in hourly wages between men and
women is currently 18%, a level which is greater than the OECD average.
The overall gap has been falling in recent years, but it has risen for the
most educated women. These patterns are not driven by innate gender
differences in talent or preferences: when they enter the labour market,
women in the UK have similar occupational patterns and pay as their
male counterparts. Rather, the wage gap is explained by career breaks
and a prevalence of part-time work among women with children who
often return to work at a lower skill level.8
Young people have suffered a considerable loss in their wages. Those
aged 18 to 21 have seen a 16% fall in real weekly earnings (Figure
2.7). A significant fraction of this change can be attributed to a fall in
the number of those in full-time employment and in hours worked. In
contrast, the hourly and weekly wages of those in full-time work only
decreased by a small amount, at 1% and 3% respectively.
TABLE 2.2: CHANGES IN MEDIAN REAL WEEKLY WAGES BY GROUP SINCE 2008
Changes in Real Wages, 2008-2016
Weekly Hourly
Median -5% -4%
Male Median -8% -7%
Female Median -2% -1%
Age 18-21 Median -16% -1%
10th Percentile 1% 2%
90th Percentile -7% -6%
NMW Adult Rate 5%
Notes: Using CPI deflator. Updated CPI deflated numbers from Gregg et al. (2014b). Source: ASHE. 2016 figures are based on the Provisional ASHE estimates published by ONS in October.
8 See Bandiera and Valero (2016) for further discussion.
For those at the bottom, the introduction of the National Minimum Wage
by the Labour Government in 1999 and the Conservative introduction
of the National Living Wage in April 2016 have helped drive pay up,
resulting in those at the 10th percentile recovering at a considerably
faster rate since 2014.9 As we shall see in the next section, however, the
coincidental increase in self-employment takes these individuals outside
the remit of minimum wage legislation.
The picture for those at the top is different: whilst these workers enjoy
significantly higher pay (a worker at the 90th percentile is on gross
earnings of around £1050 per week) their real-terms living standards
are lower than a decade ago (Figure 2.6).
FIGURE 2.6: REAL HOURLY WAGES
REA
L H
OU
RLY
WA
GES
(20
08=
100)
MEDIAN 10TH PERCENTILENMW/NLW90TH PERCENTILE
105
100
95
90
2008
2009
2010
2011
2012
2013
2014
2015
2016
Notes: NMW stands for National Minimum Wage and NLW stands for National Living Wage. Source: Annual Survey of Hours and Earnings (ASHE) hourly earnings, all workers. 2008=100.
9 See Low Pay Commission (2016) and Bell and Machin (2016a).
A waitress places dishes on a tray carried by a robot couple at a restaurant in Jinhua, Zhejiang.

23
FIGURE 2.7: MEDIAN REAL WEEKLY WAGES BY AGE
REA
L W
EEK
LY W
AG
ES (2
008=
100)
18–21 22–2950–5940–49
100
90
80
70
2008
2009
2010
2011
2012
2013
2014
2015
2016
30–3960>
Source: Annual Survey of Hours and Earnings (ASHE) weekly earnings, all workers. 2008=100.
Self-Employment Earnings
The composition of the labour market has been affected by a substantial
increase in self-employment and alternative working arrangements since
the economic downturn, with an increase in both the proportions of
self-employed individuals without employees as well as the share of
workers employed under zero hour contracts. We can see from Figure
2.8 that the self-employed have fared considerably worse than other
workers with a drop by 2014/15 of close to 20% of their 2007/2008
real weekly income.
FIGURE 2.8: EMPLOYEES AND SELF-EMPLOYED REAL WEEKLY INCOME
EMPLOYEES SELF-EMPLOYED
MED
IAN
REA
L W
EEK
LY IN
CO
ME
(200
7/08
=10
0)
2007
/08
2008
/09
2009
/10
2010
/11
2011
/12
2012
/13
2013
/14
2014
/15
100
90
80
70
Notes: 2007/08=100. Source: Family Resources Survey (FRS).
Employment, self-employment and the gig economy
At the same time as real wage growth has been weak, the unemployment
and employment position has, at least at first glance, been far stronger.
The trade-off between real wages and unemployment from 1980 to 2016
is set out in Figure 2.9. In the most recent downturn, unemployment
did not rise anywhere near as much as in the recessions of the early
1980s and 1990s.

24
FIGURE 2.9: MEDIAN REAL WAGES AND UNEMPLOYMENT, 1980 TO 2016
475
450
425
400
375
350
325
300
275
MED
IAN
REA
L W
EEK
LY W
AG
E (£
201
6 PR
ICES
)
5 6 7 8 9 10 11
UNEMPLOYMENT RATE (%)
4 12
80 81 82
838485
8687
88
8990 91 92 93949596
9798
99
00
01
0203
0405
060708 09
10
111213
1415
16
8
Source: Median wages from ASHE, ILO unemployment rates from ONS.
The most recent experience was striking not just in its magnitude, but
in the way the labour market reacted, resulting in a “high employment,
low pay” cycle. However, other important compositional changes have
occurred in the labour market at the same time, notably the rise in
self-employment, more part-time workers wanting full-time work and
insecure forms of employment. We focus on each of these in turn.
Insecure Working Arrangements
Employment and unemployment rates alone do not fully explain the
recent labour market adjustment. It is the shift in types of contract with
reductions in hours and an increase in self-employment which partially
helps explain the low unemployment rate. There is increasing concern
that the UK’s strong labour market is coming at the expense of wages
and that the “quality” of jobs on offer has declined with the rise of
new insecure working arrangements in the so-called “gig economy”.
Since the Commission’s 2013 report insecure working arrangements,
including zero hour contracts and short-term self-employment via one-
off jobs (“gigs”) have received a large amount of attention in the media,
Parliament and, more recently, the courts. There is an ongoing debate
as to whether these flexible new ways of working enhance workers’
options or simply reduce job stability, pay and legal rights. We expect
these debates to be important in future policy discussions.
Part-time work, often involuntary, has become an important feature of
the UK labour market (Figure 2.10). Since the start of the recession, the
proportion of workers who are in part-time work has increased from
26% to 28%. For some of these workers, including young parents,
students and retirees, part-time employment is a voluntary choice. For
many others it is not – a significant number of those workers in part-
time jobs want full-time jobs. As shown in Figure 2.10 the percentage
of the workforce who were in part-time work but wanting full-time
work doubled from 2.4% at the start of the recession to a peak of
4.8% in 2013. So while unemployment did not reach the levels seen
in previous recessions, the associated slack is still occurring through the
“underemployment”of workers. With a ready supply of workers eager
for more hours, the bargaining power of workers may have fallen, in
part explaining lower pay growth.
FIGURE 2.10: PERCENTAGE OF WORKERS WHO ARE PART-TIME
28.5
28
27.5
27
26.5
26
25.5
25
24.5
24
23.5
1993
1994
1995
1996
1997
1998
1999
2000
2001
2002
2003
2004
2005
2006
2007
2008
2009
2010
2011
2012
2013
2014
2015
2016
PART-TIME WORKERSPART-TIME WORKERS WHO WANT FULL-TIME WORK
5
4.5
4
3.5
3
2.5
2
1.5
% O
F WO
RKERS %
OF
WO
RKER
S
Source: QLFS, ONS.
Zero Hour Contracts
Zero hour contracts are legal agreements in which the employer is not
obliged to offer work; nor are workers obliged to accept any offer made.
Prior to the introduction of Working Time Regulations and the National
Minimum Wage Act 1998, zero hour contracts were used to maintain
workers onsite during quiet periods while being able to avoid paying
them as they were officially “off the clock”. While such practices have
been banned and companies are legally required to pay workers the
minimum wage for all onsite time (aside from breaks) zero hour contacts
are still characterised for many as an insecure working arrangement.
They are prevalent in other countries, including Australia and Canada.

25
FIGURE 2.11: PERCENTAGE OF WORKERS ON ZERO HOUR CONTRACTS
3
2.6
2.2
1.8
1.4
1
0.6
0.2
200
2
2003
2004
200
5
2006
2007
2008
200
9
2010
2011
2012
2013
2014
2015
2016
% O
F W
OR
KER
S
Source: QLFS, ONS.
Figure 2.11 shows that between April 2012 and April 2016 the proportion
of workers on zero hour contracts increased approximately six times. It
has been suggested that part of the reason for the very quick increase in
the figure from the onset of the recession was due to growing awareness
from the media of the existence of such contracts and increased self-
reporting by individuals under this new employment status.10
10 For more information see ONS (2014b).
FIGURE 2.12: PERCENTAGE OF WORKERS ON NON GUARANTEED HOUR CONTRACTS
SURVEY OF BUSINESSES NOVEMBER 2015LFS OCTOBER – DECEMBER 2015
TRANSPORT AND STORAGEARTS ENTERTAINMENT
AND RECREATION
HEALTH AND SOCIALWORK ACTIVITIES
EDUCATION
PUBLIC ADMINISTRATION
ADMINISTRATIVE ANDSUPPORT SERVICES
INFORMATIONCOMMUNICATION
AND FINANCE
ACCOMMODATION ANDFOOD SERVICES
WHOLESALE AND RETAIL
CONSTRUCTION
AGRICULTURE FORESTRYAND FISHING AND
PRODUCTION
0 5 10 15 20 25 30PERCENTAGE
Source: ONS.
These kind of contracts appear most prominently in industries with lower
wages, such as health and social work, and the accommodation and food
services sectors (Figure 2.12). Figure 2.13 shows that the median zero
hour wage rate for these workers is approximately 35% less than that for
all workers. Furthermore, the median wage rate for zero hour contract
workers has fallen in real terms by around 12.5% over the past five years
while the median hourly rate for all workers has stayed relatively flat.
Deliveroo courier at Piccadilly Circus, London.

26
Figure 2.14 shows that workers on zero hour contracts are more likely
to say they want more hours (around 31% in comparison to 10% for all
workers) and approximately 6 times the proportion of workers on zero
hour contracts would like either a replacement job with longer hours or
an additional job, in comparison to those not on a zero hour contract
(12% compared to 2%).
FIGURE 2.13: MEDIAN REAL WAGES OF ZERO HOUR CONTRACT WORKERS AND ALL WORKERS
2002
2003
2004
2005
2006
2007
2008
2009
2010
2011
2012
2013
2014
2015
2016
MED
IAN
HO
UR
LY W
AG
ES (
£ 20
14 P
RIC
ES)
MEDIAN HR ZH MEDIAN HR ALL
12
11
10
9
8
7
6
Notes: HR stands for hourly and ZH stands for zero hours. Source: QLFS, ONS.
FIGURE 2.14: DESIRE FOR HOURS BY CONTRACT TYPE
NOT ZH
ZH
0% 20% 40% 60% 80% 100%
WANTS ADDITIONAL JOB
WANTS REPLACEMENT JOBWITH LONGER HOURS
WANTS MORE HOURSIN CURRENT JOB
DOES NOT WANTMORE HOURS
Notes: ZH stands for zero hours. Source: QLFS, ONS.
These insecure jobs do generate increased work experience for individuals
and it is likely that some workers will prefer the flexible arrangement,
particularly those whose wage is not their only source of income. However,
recent evidence from the US has demonstrated that most workers do not
value flexible scheduling.11 In particular estimates show that the average
worker is willing to take a 20% pay cut in order to avoid a schedule
set by an employer at short notice – exactly the circumstances that can
arise when entered into a zero hour contract. Research into zero hour
contracts is in a relatively early stage but if the UK is the same, then it
would indicate that some workers are getting the worst of both worlds
– lower wages as well as flexible working arrangements over which
they have little control.
Firms and governments are turning against zero hour contracts. Firms
such as Sports Direct (81% of whose staff were on zero hour contracts
at one stage12), Curzon Cinemas and McDonalds have announced plans
to phase out zero hour contracts or to offer their workers alternative
arrangements, while New Zealand passed a ban outlawing zero hour
contracts in 2016.
11 See Mas and Pallais (2016).12 See Reynolds Porter Chamberlain (2016).

27
Self-Employment and the “Gig Economy”
The “gig economy” – short-term self-employment – is growing in
importance. It is estimated that 20-30% of the working age population
in the US and EU-15 are engaged in “independent work” of this type.13
Examples include the outsourcing of IT contracts to overseas experts;
web developers and consultants receiving jobs through websites such
as Upwork; transport services with taxi drivers and food delivery workers
working for firms such as Uber and Deliveroo. There has also been a rise
in more traditional “gig” work, in the form of temporary agency staff
who operate on self-employment contracts.
While for some such working arrangements may be preferable, especially
those performing more specialist skilled tasks where the pay rate is
high (e.g. consultants and programmers), other workers whose main
source of income is derived from such work would benefit from a more
secure working arrangement. In addition self-employed workers are not
afforded the same rights as employees. Examples include the right to
be paid the National Living Wage, sick pay, holiday pay, employment
security and pensions. The loss of valuable non-wage benefits such as
pensions may help explain the large difference between wages and total
compensation set out above.
FIGURE 2.15: PERCENTAGE OF SELF-EMPLOYED WORKER TYPES
% O
F W
OR
KER
S
1975
1984
1989
1992
1994
1995
1996
1997
1999
2000
2001
2002
2004
2005
2006
2007
2009
2010
2011
2012
2014
2015
PERCENTAGE SELF-EMPLOYED
PERCENTAGE SELF-EMPLOYED WITHOUT EMPLOYEES
16
14
12
10
8
6
4
2
PERCENTAGE SELF-EMPLOYED WITH EMPLOYEES
Notes: Gaps in series denote missing data. Source: QLFS, ONS.
13 See Manyika et al. (2012).
Despite the loss of rights and security, workers can be better off self-
employed, particularly in the short-term. First, the main National Insurance
rate for self-employed workers is only 9%, in comparison to a rate of
12% for employees (while gig economy “employers” avoid altogether
the 13.8% National Insurance contribution paid by worker employers).
It should be noted however that for those self-employed earning nearer
the bottom of the distribution (between £5965 and £8060), there exists
a National Insurance rate of £145 per annum. This tax does not have
an employee equivalent and is a regressive feature of the self-employed
tax setup. Second, the self-employed are eligible to claim certain costs
as expenses which in turn reduces their tax liability. These include office,
uniform and travel costs as well as costs of business premises. As a result
a self-employed individual who has a home-office is able to claim a
proportion of their residential housing costs as an expense, thus making
it tax deductible.
Unsurprisingly, self-employment has been on the rise for years. The
proportion of independent self-employed has been steadily increasing
since the 1980s and since 2000 the proportion has increased from 9%
to 13% of all workers (Figure 2.15). This rise has also gone hand in
hand with a lack of earnings growth for the self-employed. Earnings
have fallen sharply since 2008, and before then they were not rising to
the same extent as employee earnings. Figure 2.16 shows that median
earnings for the self-employed were 4% lower in 2014-15 than twenty
years earlier in 1994-95. By contrast, full-time employees have seen a
17% gain over this period. This suggests that a significant proportion of
the increase in self-employment is due to lower income earners shifting
from employee to self-employed status.

28
FIGURE 2.16: MEDIAN WEEKLY EARNINGS: EMPLOYEES AND SELF-EMPLOYED
1994
/95
1995
/96
1996
/97
1997
/98
1998
/99
1999
/00
2000
/01
2001
/02
2002
/03
2003
/04
2004
/05
2005
/06
2006
/07
2007
/08
2008
/09
2009
/10
2010
/11
2011
/12
2012
/13
2013
/14
2014
/15
MED
IAN
WEE
KLY
EA
RN
ING
S (£
201
5 PR
ICES
)
SELF EMPLOYED EMPLOYEES
450
400
350
300
250
200
Notes: 2015 prices. Source: Family Resources Survey, DWP.
International evidence suggests that new flexible work arrangements
are used by those at the top and bottom of the income distribution.
A recent study in the US found that independent contractors were
more likely to be prevalent in highly paying jobs; but that on-call
workers (equivalent to zero hour contracts) were more likely to be
employed in lower paying jobs.14 There is also evidence that the
major concern for workers in the gig economy is how to manage
highly variable income.15 This is more problematic for gig economy
workers on low pay, whose ability to deal with expenditure shocks
by building up a buffer stock of savings is likely to be limited.
The early evidence on the gig economy is thus mixed – it appears
that this is a “tale of two workers”. While some self-employed
workers are likely to prefer a more flexible work arrangement, it
is evident that in certain sectors workers feel they have diminished
rights and poorer working conditions. There has been a surge in
industrial action and cases being brought against firms who employ
low-paying contractors.16
14 See Katz and Krueger (2016).15 See Upwork and Freelancers Union (2016).16 Examples include Uber, Hermes, Deliveroo, Courier Cycles and Yodel.
In the longer term, the gig economy may erode employers’ incentives
to invest in their workers’ skills. It is unlikely that short-term workers
will receive extensive on-the-job training, and thus in the long run
this may have an impact on the make-up of the skill set of the UK
workforce. While it is too early to test this, the UK’s productivity gap
suggests this is a risk that should be taken seriously, and one that can
act to exacerbate already low levels of skills provisions for UK workers.
The UK’s regional labour markets
Wage growth over the past 20 years has differed greatly across the UK,
with workers in London and the South East having consistently higher
median weekly wages (See the maps in the Executive Summary). Another
striking feature of the distribution of wages in the UK is the importance
of cities. Outside London and the South East it is mainly metropolitan
areas where workers earn above the national average. In smaller towns
and rural areas, wages are consistently below this level. In geographic
terms, wage growth in the UK has not been inclusive in recent decades.
Regional Pay and Productivity
The UK’s regional labour markets show interesting patterns of productivity
and pay (Figure 2.17). In Scotland and the North East productivity
continued to grow; these regions experienced relatively low wage falls.
The most striking “decoupling” of pay and productivity was in London,
the South East and Wales. In these regions productivity continued to rise
but wages fell significantly below their 2005 inflation-adjusted levels.
In other places productivity has stagnated. In each region where this
occurred – including Yorkshire and the Humber, the East of England
and the North West – real wages also fell. These were also regions with
the highest percentage of leave votes during the referendum on EU
membership.17
17 See the empirical analysis on predictors of the Brexit vote in Langella and Manning (2016), and on real wages and trends in particular see Bell and Machin (2016b).

29
FIGURE 2.17: GROWTH DECOUPLING IN THE UK REGIONS
NORTH EAST
SOUTH EAST
110
100
90
110
100
90
110
100
90
2005
2010
2015
NORTH WEST
EAST
SOUTH WEST
NORTHERN IRELAND
EAST MIDLANDS
WALES
LONDON
SCOTLAND
WEST MIDLANDSYORKSHIRE AND
THE HUMBERIND
EXED
TO
100
IN 2
005
YEAR
MEDIAN WAGE (CPI)MEAN WAGE (CPI)PRODUCTIVITY (GVA)
2005
2010
2015
2005
2010
2015
2005
2010
2015
Source: ASHE-NOMIS.
Wage changes have contributed to varying regional patterns of inequality
(Figure 2.18). In Scotland, the North East and the West Midlands the
impact of the economic downturn has been spread more evenly across
workers at all income levels. In other areas, where higher wages are more
prevalent (including London, the South West and the East of England)
those with higher pay have seen sharper falls. In these regions the
median pay of highly paid workers (the 90th percentile) is still significantly
below its 2008 inflation-adjusted level. Workers on lower pay have fared
better, with wages driven up by the national minimum wages. In every
region except London workers at the bottom of the distribution (the
10th percentile) have seen their wages recover to above their pre-crisis
levels in real terms.
FIGURE 2.18: REGIONAL PERCENTILES OF REAL HOURLY WAGE AND NMW/NLW
105
100
95
90
85
2008
2012
2016
105
100
95
90
85
105
100
95
90
85
NORTH WEST
EAST
SOUTH WEST
2008
2012
2016
NORTHERN IRELAND
EAST MIDLANDS
WALES
2008
2012
2016
LONDON
SCOTLAND
WEST MIDLANDS
YEAR
NORTH EAST
SOUTH EAST
YORKSHIRE AND THE HUMBER
2008
2012
2016
10TH PERCENTILE 90TH PERCENTILEMEDIAN NMW/NLW
IND
EXED
TO
100
IN 2
008
Source: ASHE-NOMIS.
Skills and wages
It is widely recognised that Britain has a significant skills gap. Evidence
of this is set out in detail in Chapter 3. In summary:
• Higher education. The UK scores well on measures of graduate level
education, but poorly on upper secondary and non-tertiary training,
including vocational qualifications.
• Skills shortages. The UK faces long-term skills shortages with businesses
reporting concern about recruitment of high skilled employees (see
e.g. Figure 3.5, Chapter 3): including the STEM subjects, languages,
technical skills and basic numeracy and literacy.
• Schools. Poor results in terms of adult literacy and numeracy at the
bottom end of the education distribution compared to advanced
economy peers, particularly for those growing up in disadvantaged
backgrounds.
Britain does have programmes that seek to help reduce adult skill
deficiencies, usually based on accreditation using the Qualifications and
Credit Framework. They include the New Deal and Employment, Retention
and Advancement (ERA) programmes. These programmes provide a
broad range of services, including training and career advice, aimed at
the activation of the unemployed and the improvement of employee-job

30
match. The focus is not only on jobseekers, but also on workers in low-
paid and part-time jobs. There has been a large amount of evaluation of
the New Deal and ERA programmes, and while generally positive, it has
focused mostly on employment outcomes. One evaluation of the ERA
found positive effects on both reducing unemployment while increasing
short-term earnings, though the earnings gains were specifically due to
an increase in the proportion of participants who worked full-time.18
While such gains are promising, they do not necessarily achieve the goal
of skill upgrading to improve productivity and thus wages.
The shortcomings in the UK’s current skill development programmes are
well-known.19 These include insufficient collaboration with employers
in identifying crucial skills for the local labour market and failure to
design relevant courses. Courses are too basic, general and only part-
time with low weekly hours. Furthermore, the overall amount spent by
colleges and providers on learners in receipt of jobseekers allowance and
employment support allowance in the UK is considerably lower than in
other OECD countries. In 2011 spending on such programmes in the UK
was approximately 0.02% of GDP, while the OECD average was 0.15%.
It has been argued that other countries’ policies on training and skill
upgrading are better designed than those in the UK. For example, in
Australia there is an emphasis on competition between training providers.
Administrative data is used to produce a performance-based measure
for providers of training, and better providers are able to win a greater
share of training contracts. Other countries, including the US, also place
a greater focus on incorporating employers into skill identification and
course design.
In recent years government policy has sought to improve vocational
training. For example, in the 2015 Summer Budget the Government
announced the Apprenticeship Levy, a new policy designed to address
increasing employee training outside the workplace. Entering into force
in April 2017 the levy will require employers with more than a £3 million
pay bill to pay a 0.5% levy of their total pay bill into a fund which will
then be used for apprenticeships and training. Employers who have paid
the levy will be able to access funding using a voucher system through
a digital apprenticeship service account. While likely to have positive
long-term gains this is likely to result in a short-term cost for large firms.
This, combined with the rise in the national living wage, which is set
to rise to £9 (or 60% of median wages if lower) by 2020 has led some
businesses to warn that these labour market policies might pose risks
to corporate profitability, and employment.
18 See De Giorgi (2008), Riley and Young (2001), Blundell et al. (2004) and Hendra et al. (2011).19 See Wolf (2011) and OECD (2014).
Corporate Profitability
At the same time as real wages have not grown, firms’ profits and cash
holdings are currently close to or above an historic high over the past
twenty years. Gross corporate profits have recovered since the recession,
and in 2015 were in fact approximately 3% higher than their 2008
peak (Figure 2.19). Corporate cash holdings relative to GDP have been
increasing for the past two decades. By the end of 2015 corporate cash
holdings had risen to record levels, amounting to £587 billion. The return
on capital has been rising steadily and shareholders have gained in the
era of very low interest rates and lower corporate tax rates.
FIGURE 2.19: CORPORATE GROSS PROFITS & CASH HOLDINGS
GR
OSS
PR
OFI
TS (
£bn
201
5 PR
ICES
)
CO
RPO
RA
TE C
ASH
HO
LDIN
GS
TO G
DP
300
290
280
270
260
250
240
230
220
0.34
0.32
0.30
0.28
0.26
0.24
0.22
0.20
0.18
1995
1996
1997
1998
1999
2000
2001
2002
2003
2004
2005
2006
2007
2008
2009
2010
2011
2012
2013
2014
2015
REAL GROSS PROFITS CASH HOLDINGS/GDP
Source: National Balance Sheet, ONS.
Tax biases affecting the UK labour market
It is a core principle of good tax policy design that the system should
be neutral and not bias one form of economic activity versus another.20
The UK tax code exacerbates some of the problems set out above and
has a number of biases.
The system incentivises self-employment. There are a number of tax-
based reasons why both firms and employees can gain by opting for
self-employed status over contractual employee status. Workers have
an incentive to become self-employed due to the reduction in National
Insurance payments and ability to claim certain tax-deductible expenses.
There is an even greater incentive for individuals to self-incorporate and
20 See discussion in Mirrlees et al. (2011).
31
pay themselves through a combination of a low basic salary (meeting
basic NI contributions) and dividends (which do not face any such National
Insurance taxation). In addition, firms gain by not having to pay National
Insurance contributions of 13.8% to non-employee members of their
workforce, as well as having no obligation to adhere to regulations
including the National Living Wage, sick pay and holiday pay.
The current tax system also favours investment in physical capital,
computers and machines, but offers few incentives for investment in
human capital. In recent years the substitutability of workers with machines
in the face of technological change and increased job automation has
gained much coverage. The current tax system contains a number of
relief schemes designed to create incentives for investment in capital:
• Enhanced capital allowances. The UK tax code provides enhanced
tax depreciation allowances against investment in certain types of
capital. For example, “green” technologies generate a full tax write-
off. In general there are allowances for energy saving equipment,
plant and machinery that is certified to be environmentally efficient
and low emission vehicles.
• Annual investment allowances. Companies can claim 100% of
their first £200,000 of capital expenditure incurred.
• R&D tax breaks. Expenditure on R&D by small and medium sized
enterprises generate a tax deduction equal to 230%. Alternatively, SMEs
can take a cash payment (£33.35 for every £100 of R&D expenditure)
if the company is loss making, or has not yet started to trade. Large
companies are given a tax credit of 11% of R&D expenditure, which
similarly can be claimed as a cash payment if the firm is loss making.
• The “patent box”. When a firm can prove that its profits are related
to patents, a lower rate of tax applies: 11% in 2016/17, falling to 10%
from April 1st 2017.
Whilst part of both R&D and patent investments may cover salaries of
(high-wage) R&D workers, by comparison the tax incentives to invest in
the human capital of the majority of workers are currently far smaller
and often non-existent.21 Indeed, the UK has a long history of poor
delivery of intermediate and basic skills, which both track back to the
schooling and vocational education system. A widespread misalignment
between skills provision and employers’ needs is a key feature of the
issue of poor delivery.
21 See Costa, Datta and Machin (2017) for a descriptive factsheet on R&D tax credits and on human capital tax breaks that operate in other countries.
Conclusions and policy recommendations
In many ways the UK labour market has outperformed other advanced
economies in recent years: employment is at record highs and has had a
progressive impact on labour market inequality. This is something that
policy should seek to protect, since evidence suggests that unemployment
can lead to medical problems, including depression, and exerts significant
labour market scarring effects. While there is concern about the “quality”
of some forms of employment, an economy at record employment
highs is something to build on.
But there remains the problem of weak wage growth, with median
workers losing at least a decade, and real wage falls the worst in Europe
with the exception of Greece. Meanwhile the UK, relative to its rich
world peers, is also falling further behind in terms of skills. Moreover,
whilst low-wage workers have been doing better in terms of wage
growth than their counterparts further up the wage distribution, the
likelihood of being stuck in a zero hour contract or minimum wage job
with less prospect of career progression than in the past has increased.
Therefore policy needs to be aimed towards improving skills, facilitating
career progression and boosting wages.
The Commission proposes:
Aspriring to a tax and minimum wage system that is neutral
with regard to forms of employment. The government should
eliminate advantages to firms and employees using the self-employment
classification to avoid payroll taxes and minimum wage legislation.
Attention to classification of employed versus self-employed is especially
important for low-wage workers who are losing entitlements to minimum
wages and other employee benefits as a result.
Lifelong learning and adaptable skills. Continuous skill development
can help workers gain greater security and adaptability in a world of
rapidly changing technologies and labour market structures. Improving
both the education and training system, and the ability of individuals
and firms to finance this are crucial.
A new system of tax breaks for skills investment. Tax breaks and
allowances for capital should be extended to skills investment. This should
place investment in staff training, courses and education on the same
footing as investment in plant and machinery. This could take the form
of a Skills and Training tax credit which is similar in spirit to the existing
R&D tax credit. The policy would need to be carefully designed to ensure
additionality and that money was spent on high quality skills provision
that adds to employability, career progression prospects, and to worker
productivity. Such a skills development and training strategy requires
close interaction between employers and well-resourced technical/adult
education colleges.

32
Production operator soldering circuit boards at Axiom Manufacturing, Newbridge Gwent, South Wales.

33
3. Industrial Strategy
Britain’s extended period of poor productivity growth has revived interest in developing a more active industrial strategy. This chapter outlines some of the market failures which justify a new approach in the UK, highlighting the challenges in its design. We begin by outlining the principles and priorities. We then set that in the context of the landscape and performance of UK firms. We review lessons from the experience of the UK and other contexts. Based on this analysis the Commission recommends a new industrial strategy framework, including a new legal footing, the introduction of independent decision-making or oversight, and steps to enhance transparency and analysis of the industrial interventions that are needed and are made in the UK.
The need for an industrial strategy
The term “industrial strategy” has a chequered history often associated
with a desire to steer the economy from the centre, subverting the
dynamic forces of creative destruction which power modern capitalist
economies. But every government has an industrial strategy however
it chooses to articulate it: the government influences the investment
climate for business, establishes national priorities, chooses tax and
regulatory structures, invests in skills, infrastructure and research and
procures outputs from the private sector, all of which influence the
evolution of the private economy. What varies through history is
how far governments have been willing to spell out their strategy and
the arguments which underpin it. The aim of this chapter is to offer
a blueprint for a modern industrial strategy informed by extensive
evidence on the structure of UK business and experience with such
policy both in the UK and other countries.
One key policy priority is to improve UK productivity which lags behind
its international peers. This longstanding gap has been exacerbated by
the weak productivity performance since the financial crisis. According
to the latest data, UK output per hour is 35 percentage points lower
than in Germany (Figure 3.1). This gap is explained by weaker
productivity across all industrial sectors, rather than by differences in
the sectoral composition of the economy. Every sector in the UK has
a large number of unproductive firms, and a similar pattern exists
for businesses in different size bands. Productivity growth is crucial
for sustainable growth in living standards, and addressing this gap is
therefore the central challenge for industrial strategy design.
FIGURE 3.1: G7 CURRENT PRICE GDP PER HOUR WORKED, UK=100
140
120
100
80
160
CANADAFRANCEGERMANY ITALY
60
40
20
JAPANUKUS
100
127
135
109
84
100
130
G7 AVERAGE
0
Notes: ONS, 2015, Current price GDP per hour worked. UK=100. G7 average=118.
Since the first Growth Commission there have been a number of
policies aimed at raising productivity. Most recently, the UK government
released a Green Paper including a number of proposals on Industrial
Strategy. The challenge to government is to set out a long-term,
overarching strategy to raise business performance in the UK. These
industry-focused policies form part of a wider growth strategy that
uses economy-wide policies which apply to all UK firms.1
Here, we argue that more selective policies targeted towards specific
sectors and firms must be underpinned by transparent reasoning as
well as a new institutional framework. Attempting to “pick winners”,
as the experience of the 1970s showed, often resulted in subsidising
losers. The framework in place while the UK has been part of the EU
has heavily circumscribed the potential for the use of such policies.
Hence Brexit opens up some policy opportunities. And whether the
UK makes heavy use of selective industrial policy or not, there
will be a need for a guiding framework to replace the EU State
Aid regime.
1 Policies which focus on individual industries or regions are sometimes referred to as “vertical” industrial policies. By contrast economy-wide policies are sometimes referred to as “horizontal”.

34
Improving productivity is not the only policy priority. The government’s
aim to create an economy that works for everyone emphasises the
need for growth which is equitable and regionally balanced. Sustainable
growth also requires an appreciation of the environmental impact of
economic activity. The government’s legally binding climate change
targets should play a key role in shaping industrial strategy. The
dynamics of cities and successful agglomeration of economic activity
through urban regeneration is also central, requiring an institutional
framework which achieves the right balance between local initiative
and national coordination.
To date, UK industrial policy has fallen short of these goals. It is
fragmented, with teams in different government departments often
working separately. Regular re-branding or changing of business
policies and departments, a long-standing problem in the UK policy
environment, creates uncertainty for investors. The system of local
governance is fragmented with a lack of spending power and autonomy
over relevant policy-levers.
Principles of Industrial Strategy
Government policies should be based on an understanding of
why free markets may not deliver the most effective outcomes.
The role of government is to assess the wider societal benefits from
economic activity and this, above all, should guide industrial strategy.
For example, green technologies, healthcare technologies, or regional
policies that improve local standards of living may not be taken into
account by firms when making their investment decisions in isolation.2
Government can also promote the diffusion of information, acting as
a co-ordinator, for industry, researchers, regulators and investors who
might not otherwise come together. It can also share risk, providing
funding for high growth-potential firms that would find it difficult to
access market finance. Via funding of R&D it can address the well-
known failure that markets do not internalise the positive externalities
from research and under-invest.
In some sectors or places, adoption of existing technology or
practices can be more important for raising productivity than
new innovation. Government can address obstacles that prevent
firms investing, such as information frictions or high set-up costs. The
market process works best when there is exit of unsuccessful firms
along with entry of new firms and growth of successful firms. The latter
requires a financial system which is effective at channelling support to
high-quality firms. Pro-active efforts to promote best practice along
with facilitating entry and exit is needed to move core sectors of the
2 This can create spatial externalities. In markets where size matters, there may be gains from policy interventions that facilitate the expansion of an agglomeration or, indeed, the establishment of a successful cluster.
FIGURE 3.2: R&D AS A SHARE OF GDP – INTERNATIONAL
FRANCE USUK
3.0
2.5
2.0
1.5
1.0
2000
2001
2002
2003
2004
2005
2006
2007
2008
2009
2010
2011
2012
2013
2014
GERMANY
% O
F G
DP
Notes: General expenditure on R&D (GERD) (includes both business and government funded activity) as a percentage of GDP. Source: OECD MSTI.
economy such as construction, retailing and personal services towards
the global frontier in terms of performance. These sectors are important
in UK employment and raising their productivity and wages will
therefore have large benefits for the UK economy. Industrial strategy
should not be focussed on high-tech sectors alone.
It is vital that competitive processes influence decisions about industrial
strategy. EU State Aid rules have tied ministers’ hands in a helpful
way, effectively protecting them from pressures to intervene
and limiting the subsidisation of uncompetitive sectors. Post
Brexit, it will be necessary to have equivalent laws in the UK. One of
the greatest dangers of activist industrial policy is favouring specific
firms within a sector and compromising benefits from competition.
Successful sectors of the economy are frequently characterised by open
entry and exit by failing firms to ensure that only the most successful
businesses survive.
Investment
The UK has poor infrastructure compared to its international peers
and large-scale investments are required in all areas. In recent decades
Britain has found it hard to make informed decisions on infrastructure
needs, hard to stick to them, and harder still to implement them due
to problems accessing finance and/or planning permissions. The lack of
a coherent, long-term infrastructure strategy and the associated policy

35
risk has also led to a high cost of capital and difficulty raising finance
from the private sector. The government has made some progress in this
area in recent years, with the establishment of the National Infrastructure
Commission – an independent institution that should help to reduce
policy uncertainty and also be the hub of rigorous analysis to establish the
UK’s infrastructure needs. There have also been moves to channel more
public-sector investment into infrastructure, such as the pooling of local
authority pension funds and the new National Productivity Investment
Fund. These developments are welcome but there is still much to be
done. The policy climate in many areas is still uncertain and a deterrent
to long-term private investment. And there is, as yet, no clearly articulated
strategy which joins up housing, transport and energy needs.
The UK’s housing supply crisis is longstanding and well-known: we do
not cover it in detail in this report. Acute housing shortages in some
areas and rising prices (in London in particular) distort incentives to
invest in other types of assets and restrict labour market flexibility.
This is holding back productivity growth and harming the quality of life
in the UK. It has major implications for the intergenerational distribution
of income as housing assets are increasingly held by older age groups.
Improving the supply of affordable, environmentally sustainable, high
quality housing should be a central plank of government policy. The
root cause of the housing crisis is government policy. Given the failure
of the local planning system to deliver over decades, progress can only
be achieved with a properly articulated and executed plan by central
government. This should be central in any industrial strategy which
mobilises the resources for housing investment.
A range of sectors need to innovate to stay on the global technology
frontier. The standard measure of innovation input is Research and
Development (R&D) expenditure. Government and business R&D are
consistently lower than our main peers as a share of GDP (Figure
3.2). Publicly financed R&D is an important source of UK innovation,
and it is also important since there is extensive evidence that this type
of research “spills over” to the private sector, and stimulates further
private sector investment.3
While the UK excels in terms of the quality and impact of its
research, it is worse than other countries at commercialising ideas.4
A standard measure of innovation output is patents and the UK is below
the OECD average in patents per person.5 There are also well-documented
problems with collaboration between business and Universities.6
3 See Moretti et al. (2014), Haskel and Wallis (2013), Goodridge et al. (2015), Hausman (2012) and Kantor and Whalley (2014).4 See for example BIS (2014) or Elsevier (2013).5 The UK came 15th among OECD countries in terms of its Triadic patent families (corresponding patents filed at the EPO, USPTO and JPO for the same invention, by the same applicant or inventor) per million inhabitants in 2013, see OECD (2016).6 See the Dowling Review (2015).
The UK does better in its investment in intangible assets, for
example new business practices and software. These types of asset
are particularly important in an economy like the UK which is service-
dominated. Total intangible investment has been increasing over time
and it has been greater than tangible investment since the early 2000s.7
Moreover, the UK does well compared to other advanced economies,
investing more on intangibles as a share of GDP than France and
Germany, though less than the US (Figure 3.3).
FIGURE 3.3: INTANGIBLE INVESTMENT RATE (2010)
12
SOFTWARE INNOVATIVEPROPERTY
ECONOMICCOMPETENCIES
FRANCE GERMANY UK US
10
8
6
4
0
2
% O
F G
DP
Source: Corrado et al. (2012), OECD.
7 See Goodridge et al. (2016).
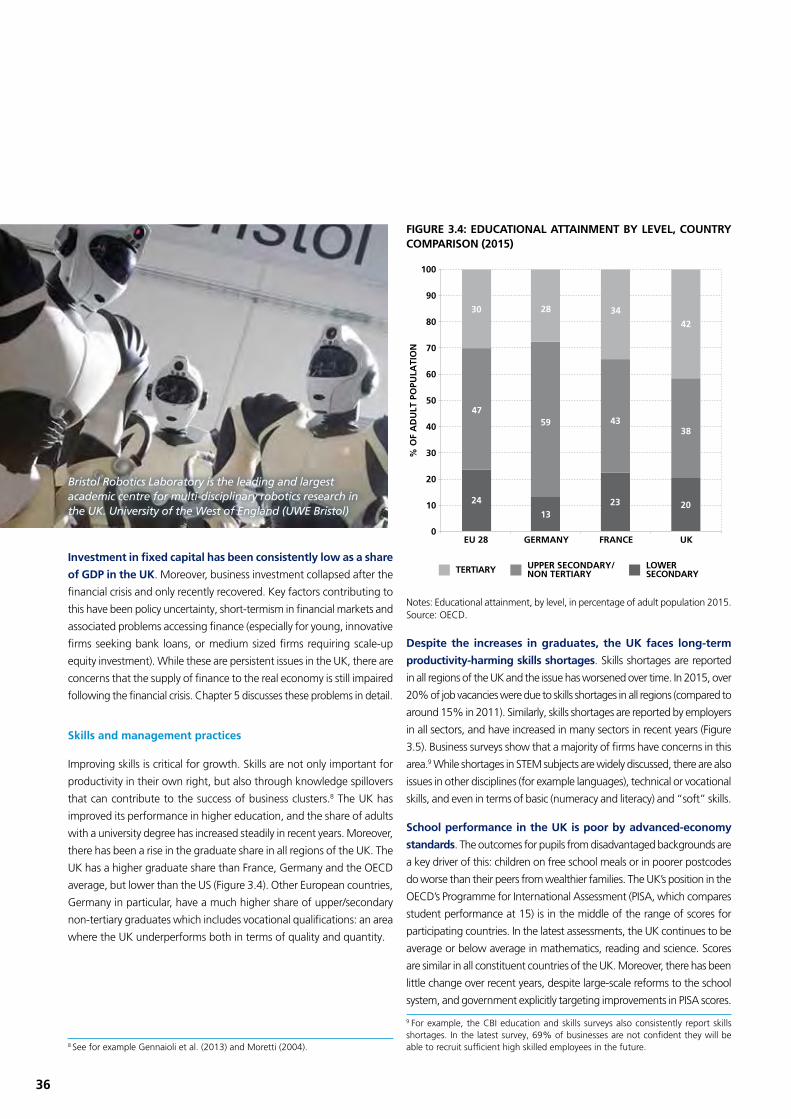
36
Investment in fixed capital has been consistently low as a share
of GDP in the UK. Moreover, business investment collapsed after the
financial crisis and only recently recovered. Key factors contributing to
this have been policy uncertainty, short-termism in financial markets and
associated problems accessing finance (especially for young, innovative
firms seeking bank loans, or medium sized firms requiring scale-up
equity investment). While these are persistent issues in the UK, there are
concerns that the supply of finance to the real economy is still impaired
following the financial crisis. Chapter 5 discusses these problems in detail.
Skills and management practices
Improving skills is critical for growth. Skills are not only important for
productivity in their own right, but also through knowledge spillovers
that can contribute to the success of business clusters.8 The UK has
improved its performance in higher education, and the share of adults
with a university degree has increased steadily in recent years. Moreover,
there has been a rise in the graduate share in all regions of the UK. The
UK has a higher graduate share than France, Germany and the OECD
average, but lower than the US (Figure 3.4). Other European countries,
Germany in particular, have a much higher share of upper/secondary
non-tertiary graduates which includes vocational qualifications: an area
where the UK underperforms both in terms of quality and quantity.
8 See for example Gennaioli et al. (2013) and Moretti (2004).
FIGURE 3.4: EDUCATIONAL ATTAINMENT BY LEVEL, COUNTRY COMPARISON (2015)
50
100
TERTIARY UPPER SECONDARY/NON TERTIARY
LOWERSECONDARY
90
80
70
60
EU 28 GERMANY FRANCE UK
40
30
20
0
10
30
47
24
28
59
13
34
43
23
42
38
20
% O
F A
DU
LT P
OPU
LATI
ON
Notes: Educational attainment, by level, in percentage of adult population 2015. Source: OECD.
Despite the increases in graduates, the UK faces long-term
productivity-harming skills shortages. Skills shortages are reported
in all regions of the UK and the issue has worsened over time. In 2015, over
20% of job vacancies were due to skills shortages in all regions (compared to
around 15% in 2011). Similarly, skills shortages are reported by employers
in all sectors, and have increased in many sectors in recent years (Figure
3.5). Business surveys show that a majority of firms have concerns in this
area.9 While shortages in STEM subjects are widely discussed, there are also
issues in other disciplines (for example languages), technical or vocational
skills, and even in terms of basic (numeracy and literacy) and “soft” skills.
School performance in the UK is poor by advanced-economy
standards. The outcomes for pupils from disadvantaged backgrounds are
a key driver of this: children on free school meals or in poorer postcodes
do worse than their peers from wealthier families. The UK’s position in the
OECD’s Programme for International Assessment (PISA, which compares
student performance at 15) is in the middle of the range of scores for
participating countries. In the latest assessments, the UK continues to be
average or below average in mathematics, reading and science. Scores
are similar in all constituent countries of the UK. Moreover, there has been
little change over recent years, despite large-scale reforms to the school
system, and government explicitly targeting improvements in PISA scores.
9 For example, the CBI education and skills surveys also consistently report skills shortages. In the latest survey, 69% of businesses are not confident they will be able to recruit sufficient high skilled employees in the future.
Bristol Robotics Laboratory is the leading and largest academic centre for multi-disciplinary robotics research in the UK. University of the West of England (UWE Bristol)

37
This poor performance of UK school leavers, coupled with an inadequate
further education sector contributes to a large fraction of jobs being
low-skill and low-pay. At the same time, the UK does not fare well in
terms of the lower end of the basic skills distribution among adults.
In the OECD’s 2012 international survey of adult skills in 24 countries
(the Programme for International Assessment of Adult Competencies,
PIAAC), the nations of the UK have a sizable number of individuals with
poor literacy and numeracy skills.10 Moreover, when younger people
are compared with older people, there is scant evidence of progress,
unlike in the majority of other PIAAC countries where younger people
have superior levels of literacy and numeracy. The UK is clearly losing,
and dropping further back, in the international race in basic skills. The
position is reasonably good at the top end of the basic skills distribution,
but dire at the bottom.
Female talent is misallocated in the UK. Gender gaps in participation and
wages are high compared to other OECD countries, largely explained
by career breaks and part-time work after women have children. Other
countries have introduced policies (for example, Sweden’s “daddy
months”) that encourage parents to share work and home responsibilities.
Studies suggest large productivity gains would be possible from tackling
skill misallocation, and point to wider societal gains from policies that
encourage parents to share home and work responsibilities.11
FIGURE 3.5: SKILLS SHORTAGES ACROSS SECTORS
25
20
15
10
0
2013
5
40
35
30
2015
CONST
RUCT
ION
TRANSP
ORT A
ND COM
MUNIC
ATIO
NS
MANUFA
CTURI
NG
ELEC
TRIC
ITY, G
AS AND W
ATER
AGRICU
LTURE
BUSI
NESS
SERV
ICES
FINANCE
AND IN
SURA
NCE
HEALT
H AND S
OCI
AL W
ORK
ARTS
AND OTH
ER S
ERVIC
ES
RETA
IL A
ND WHO
LESA
LE T
RADE
HOTE
LS A
ND FO
OD
EDUCA
TIO
N
PUBL
IC A
DMIN
ISTR
ATIO
N
% O
F TO
TAL
VA
CA
NC
IES
Notes: Skills shortage vacancies as a percentage of total vacancies by sector. Source: Employer Skills Survey (2015).
10 See http://www.oecd.org/site/piaac/11 See Bandiera and Valero (2016).
Management practices matter for productivity and UK firms on
average are worse managed than those in the US and Germany.12
A key driver of this is the poor management practices in smaller, family
run firms, who tend to use primogeniture to choose their CEO.13 This
is encouraged by UK tax laws on the inheritance of business assets.
Managers of family firms tend to lack information on best practice. It
has also been found that firms with more skilled workers are better
managed. This “complementarity” between management practices
and skills may be another avenue through which improvements in
human capital can raise productivity over and above the direct impact
on a worker’s own efficiency.
Industrial civil society
Britain’s industrial civil society is weaker than our peers’. The community
of business leaders could benefit by deepening their collaboration and
sharing of expertise to develop a stronger industrial “civil society”.
Lessons can be learned in this respect from “coordinated market
economies” such as Germany.14 In 2010, the coalition government
set up 39 Local Enterprise Partnerships (LEPs). These are voluntary
partnerships between local authorities and businesses, and replaced the
9 Regional Development Agencies (RDAs) that existed before. However,
LEPs have much smaller budgets than RDAs impairing their ability to
hire experienced staff, organise events and invest in local civil society.
British Industry: a bird’s-eye view
It is relatively easy to set up a company in Britain, taking just
five days. The UK leads the US in terms of ease of doing business
ranking 7th overall while the US ranks 8th. The “enterprise birth rate”
(new firms as a percentage of total active firms) was 14% in 2014,
putting the UK 5th of the 28 members of the EU less Greece (Figure
3.6). This has increased from 10% in 2010.
12 Bloom et al. (2016).13 See Bloom et al. (2014) and ONS (2017a).14 Hall and Soskice (2001).

38
FIGURE 3.6: NEW FIRMS IN BUSINESS ECONOMY
25
20
15
10
5
0
LITH
UA
NIA
SLO
VA
KIA
LATV
IAPO
RTU
GA
LU
KPO
LAN
DB
ULG
AR
IAM
ALT
AD
ENM
AR
KSL
OV
ENIA
ESTO
NIA
MA
CED
ON
IAR
OM
AN
IAN
ETH
ERLA
ND
SLU
XEM
BO
UR
GH
UN
GA
RYFR
AN
CE
EU28
SPA
INC
ZEC
H R
EPU
BLI
CN
OR
WA
YFI
NLA
ND
CR
OA
TIA
SWED
ENG
ERM
AN
YIT
ALY
AU
STR
IAC
YPR
US
IREL
AN
DB
ELG
IUM
% O
F FI
RM
S
Notes: Number of newly born enterprises as a % of the total number of active enterprises. Source: Eurostat.
Start-ups are mainly in the services sector (which represented 96% of
the newly created enterprises from 2010 to 2015). While most regions
are quite similar, a large share (39%) of start-ups are in London and
the South East, with relatively low numbers of new firms set up in
Northern Ireland (Figure 3.7). It does not appear that barriers to starting
up firms are at the heart of the UK’s productivity shortfall.
FIGURE 3.7: NEW FIRMS BY REGION
20
18
16
14
12
10
8
6
4
2
02010 2011 2012 2013 2014 2015
ALL OTHER REGIONS (RANGE) LONDONNI
% O
F FI
RM
S
Notes: Birth rates by region, 2010-2015. Source: ONS.
The dominance of small firms
The size distribution of UK firms is illuminating. In the most recent
data for 2016, there were 5.5m businesses in the UK.15 They fall
under three main legal categories: sole traders, ordinary partnerships
and actively trading companies. By far the most common were the
3.3m sole traders.16 There were 1.8m actively trading companies and
421,000 ordinary partnerships.
Small firms dominate the British business landscape. Across the
UK 96% of businesses are classed as “micro” sized (having under 10
employees) (Figure 3.8). The vast majority of these (80%) actually
have no employees other than the self-employed owner-manager, or
an owner-director. This type of business accounts for nearly a third of
private sector employment and 20% of sales.
15 BIS (2016b). 16 Sole trader status means there is no legal divide between the business and the individual running it. Importantly, this means that the businesses debts are legally regarded as the debts of the individual. Partnerships are another arrangement where there is no separation between the individual and the firm. In a limited trading company here the company is a separate legal entity from its owners, and is responsible for its own debts.

39
FIGURE 3.8: BUSINESS LANDSCAPE BY FIRM SIZE (2016)
120
100
80
60
40
20
0
FIRMS EMPLOYMENT TURNOVER
MICRO(0–9)
SMALL(10–49)
MEDIUM (50–249)
LARGE(250+)
96%
32%
19%15%15%
3.7%0.6%
12%14%
0.2%
40%
53%
% O
F TO
TAL
Notes: Private sector businesses only. Source: BIS, 2016.
Small firms are dominant across sectors – with the median firm in all
sectors having under 5 employees (Figure 3.9).
FIGURE 3.9: EMPLOYMENT DISTRIBUTION BY SECTOR
70
60
50
40
30
20
10
0
IT
REAL E
STAT
E
AGRICU
LTURE
PROFE
SSIO
NAL, SC
IENTI
FIC
AND TEC
HNICAL
ARTS,
OTH
ER S
ERVIC
ES
ADMIN
ISTR
ATIV
E SE
RVIC
ESRE
TAIL
AND
WHOLE
SALE
TRA
DEHOTE
LS A
ND FOOD
TRANSP
ORT
MIN
ING, E
LECT
RICI
TY A
ND
GAS, W
ATER
AND W
ASTE
MANUFA
CTURI
NG
HEALT
H AND S
OCIAL W
ORKED
UCATI
ON
CONST
RUCT
ION
50TH PERCENTILE
NU
MB
ER O
F EM
PLO
YEE
S
Notes: 10th and 90th percentiles are ends of thin error bars, 25th and 75th are end points of thick bars. Source: ONS.
There is a conspicuous gap in the middle. Small businesses that
employ between 10 and 49 people account for 4% of firms, and
15% of employment. But mid-sized firms represent less than 1%
of firms and only 12% of employment. The dearth of mid-sized
businesses has long been a concern, with much discussion about the
success of Germany’s “Mittelstand”, the specialist and export oriented
medium sized companies that have contributed to Germany’s strong
performance since the financial crisis. While 99% of German firms are
small or medium sized – a similar headline figure to the UK – micro-
enterprises represent a smaller share of employment (20%), and small
and medium sized firms (which include the Mittlestand) employ over
40% of the workforce.
Large businesses on the other hand represent a tiny fraction of total
UK firms, but employ 10.4m people (40% of all employment) with
around 1,450 workers per firm on average. These firms accounted
for 53% of turnover in 2015.
While the total number of businesses in the UK has risen by
59% since 2000, 90% of this increase can be explained by non-
employing businesses which have seen the fastest growth of all
categories (Figure 3.9). The number of large businesses actually fell
after 2002 and only started to recover more recently. Micro and small
businesses tend to dominate all sectors in terms of firm numbers but
are even more common in sectors such as agriculture, education,
construction, and “other services”. Large firms are more common in
finance, mining and utilities, retail and administration.
Tormore distillery workers moving barrels to aging store. Whiskey remains one of the UK’s most successful exports, worth almost £4billion per year.

40
FIGURE 3.10: GROWTH IN PRIVATE SECTOR BUSINESSES BY SIZE BAND
180
170
160
150
140
130
120
110
100
90
80
2000
2001
2002
2003
2004
2005
2006
2007
2008
2009
2010
2011
2012
2013
2014
2015
2016
NO EMPLOYEES SMALL (10–49)MICRO (1-9)
MEDIUM (50-249) LARGE (250+)
2000
= 1
00
Notes: 2000=100. Source: BIS (2016b).
The dominance of small firms has implications for productivity and
pay. On average large firms are more productive and are more likely
to export goods. After controlling for size they pay higher wages and
more taxes than their smaller counterparts. There are a number of
reasons for this: small businesses are not able to take advantage of
economies of scale, are more likely to face constraints on investment
due to problems accessing finance, offer less scope for specialisation,
and tend to have weaker organisational practices and technologies.
A particular problem holding back high growth potential start-ups
in the UK has been a lack of scale-up capital, a problem explored in
Chapter 5. In addition, policy distortions can prevent small companies
scaling up where it would be more efficient for them to do so. For
example, there is a plethora of government schemes targeted at SMEs.
The rationale for such schemes is often unclear. Because SMEs have
lower productivity and pay lower wages, a concern is that firms have
incentives to stay small to take advantage of these subsidies and this
could depress aggregate productivity. Similar incentives are created
by the tax code and regulatory structures.17 18
Another phenomenon since the financial crisis which might have
contributed to poor aggregate productivity growth has been the lack
of poorly performing businesses shutting down. The company “death
rate” has fallen from 12% in 2009 to 9% in 2015, in spite of the fact
17 See, for example, Garicano et al. (2012).18 Mirrlees et al. (2011).
that the number of loss making firms rose from around 22% to 35%
between 1997 and 2011.19 This has been attributed to an extended
period of low interest rates and the reluctance of banks to write off
loans for poorly performing companies, granting them instead interest
payment holidays (a phenomenon known as “forbearance”). It was
estimated that this applied to around 6% of SMEs in 2013.20 Most
analyses find that this has had only a moderate impact on productivity
growth since 2008.
A Sectoral Perspective
The services sector has become increasingly central to the British
economy, representing around 77% of firms, and over 80%
of employment and value added (Figure 3.11). There is a similar
pattern of services sector dominance in other advanced economies
though manufacturing takes a larger share of output in Germany, and
the public sector (non-market services) is larger in France.
FIGURE 3.11: NUMBER OF BUSINESSES, EMPLOYMENT AND GVA BY SECTOR (2015)
AGRICULTUREAND MINING
MANUFACTURING
CONSTRUCTION
UTILITIES ANDTRANSPORT
RETAIL ANDWHOLESALE TRADE
PROFESSIONAL,FINANCE, IT ANDADMIN SERVICES
REAL ESTATE
NON MARKETSERVICES
OTHER SERVICES
100
90
80
70
60
50
40
30
20
10
0FIRMS EMPLOYMENT GVA
% O
F TO
TAL
Notes: GVA stands for Gross Value Added. Source: ONS.
19 Barnett et al. (2014).20 Arrowsmith et al. (2013).

41
In order to compare the relative productivity level in different sectors,
we calculate gross value added (GVA) per worker. The most productive
sectors also tend to have a smaller employment share (Figure 3.12).
Real estate is an outlier because GVA in this industry mostly reflects
imputed housing rents rather than the sales of firms. But electricity
and gas, finance and IT which have high output per worker, each
represent under 4% of the workforce. In contrast, wholesale and retail
trade stands out as having low measured productivity but employing
nearly 16% of the workforce. Other market economy sectors with
particularly low productivity include hotels and food, administrative
services, agriculture and arts.
While there are differences across sectors in terms of average
productivity, there is a “long-tail” of unproductive firms in all industry
groups and firm size bands. Two-thirds of workers are employed
in businesses where productivity is below average for their size
and sector, significantly more than in Germany. This suggests
economy-wide policies are vital in tackling the UK’s productivity
challenge.
FIGURE 3.12: SECTORAL PRODUCTIVITY DIFFERENCES (2015)
900
800
700
600
500
400
300
200
100
MIN
ING
WAT
ER A
ND WAST
E
REAL
ESTA
TE
ELEC
TRIC
ITY A
ND GAS IT
CONST
RUCT
ION
MANUFA
CTURI
NG
PUBL
IC A
DMIN
ISTR
ATIO
N
OTH
ER S
ERVIC
ETR
ANSPO
RT
PROFE
SSIO
NAL SCI
ENTI
FIC A
ND TEC
HNICAL
RETA
IL A
ND WHO
LESA
LE T
RADE
EDUCA
TIO
N
HEALT
H AND S
OCI
AL W
ORK
ARTS
ADMIN
ISTR
ATIV
E SE
RVIC
ES
HOTE
LS A
ND FO
OD
AGRICU
LTURE
PRO
DU
CTIV
ITY
REL
ATI
VE
TO A
VER
AG
E (%
)
EMPL
OY
MEN
T SH
ARE
(%)
FINANCE
AND IN
SURA
NCE
18
16
14
12
10
8
6
4
2
0
RELATIVEPRODUCTIVITY
EMPLOYMENTSHARE (%)
Notes: GVA/employment relative to average=100. Source: ONS.
Moreover, differences in sectoral productivity are reflected in differences
in pay: high productivity sectors tend to pay more to the average
worker and vice versa. Broadly, the sectors that have the largest share
of UK profits, also record the highest share of total wage bill. Shares
of profit and pay are closely aligned for manufacturing and retail,
but profits far exceed pay in finance, professional services and IT. By
their nature, non-market services record little or no profit, but take
a large share of pay.
In the years before the financial crisis UK productivity growth was
strong – averaging around 2.6% per annum in the market economy.21
Professional and administrative services, IT and finance explained
over half of the growth in this period. Since then while productivity
growth has been close to zero, one of the only sectors to hold up
in its contribution has been professional services (Figure 3.13). The
largest reductions have been in the contribution of manufacturing
and finance to productivity. In the case of manufacturing this has
been due to a fall in productivity and a fall in the share of output. In
the case of finance, productivity has fallen, but the sector has actually
grown in terms of its share of market economy GVA.
21 Corry et al. (2011).

42
FIGURE 3.13: SECTORAL DECOMPOSITION OF AGGREGATE PRODUCTIVITY GROWTH
MINING ANDQUARRYING
ARTS
REALLOCATION
AGRICULTURE,FORESTRY ANDFISHING
CONSTRUCTION
ELECTRICITY, GASAND WATER
HOTELS AND FOOD
TRANSPORT
RETAIL ANDWHOLESALE TRADE
3.0
2.5
2.0
1.5
1.0
0.5
0.0
-0.5
-1.02000–2007 2007–2014
PROFESSIONALAND ADMIN
IT
FINANCE ANDINSURANCE
MANUFACTURING
GRO
WTH
RA
TES
(PER
CEN
TAG
E PO
INTS
)
Notes: Average annual growth rate of GVA per worker by sector, weighted by its average share in GVA. Market economy only. Source: EU KLEMS.
This analysis reveals that while services dominate the UK economy,
the services sector itself has a mixed performance. It contains high-
performance, high-growth sectors such as finance, business services
and IT, but also low productivity sectors that tend to employ a larger
share of the workforce. An effective industrial strategy will have
different policy prescriptions for these sectors.
In terms of the UK’s “revealed comparative advantage” (RCA),
finance, insurance and other business services consistently stand
out as strengths. The UK also possesses comparative advantage in
some areas of manufacturing: those most commonly highlighted
include aerospace and pharmaceuticals. In high growth-potential
and innovative sectors, the principle for intervention should be to
address market failures that prevent growth. This varies by sector, or
even within sector, by location (for example skills shortages). This was
the thinking behind the coalition’s industrial strategy that identified
sectors and technologies where the UK has strengths and created
various frameworks to support them.
Other sectors present different challenges. In the market economy,
retail and wholesale trade, hotels and food, and administrative services
all have low average productivity and pay, and account for over 30%
of total employment. Raising productivity in low-productivity
low-pay sectors could have large aggregate effects and also
help to reduce wage inequality. It has been estimated that if the
productivity of these sectors were raised to match levels in France,
Germany and other European countries, the UK could close a third of
its aggregate productivity gap with those countries. 22
Problems in these sectors include inadequate adoption of existing
technologies and a low skill base relative to other sectors and the
same sectors in other countries. The relatively poor performance of
school leavers, coupled with weak further education contribute to
low productivity here. Low labour costs might have contributed to
a lack of investment in productivity-enhancing technologies or staff
training, and the introduction of the new “national living wage”
might change this.
An industrial strategy for these sectors must therefore overcome the
specific barriers to investment in both existing technologies and people.
Enhanced technical education is needed, and this highlights the overlap
between industrial strategy and skills policy. In the government’s current
Post-16 Skills Plan, the retail sector is notably absent.
A Regional Perspective
Economic activity in the UK is skewed towards London and the South
East. These areas account for nearly 40% of total GVA and 33% of
firms, but just 27% of the population. London is the densest area,
with 1,464 businesses per 10,000 people, compared to just 679 in
the North East.23 London and the South East are the most productive
regions and also have the highest employment shares. The North
West has low average productivity despite being the third largest
employer (Figure 3.14).
22 Spencer et al. (2016).23 BIS Business Population Estimate (2016).

43
FIGURE 3.14: REGIONAL PRODUCTIVITY DIFFERENCES (2015)
LONDO
N
SCO
TLAND
SOUTH
EAST
EAST
NORT
H WES
T
WES
T M
IDLA
NDS
EAST
MID
LANDS
YORK
SHIR
E AND T
HE HUM
BER
NORT
H EAST
NORT
HERN IR
ELAND
WALE
S
PRO
DU
CTIV
ITY
REL
ATI
VE
TO A
VER
AG
E (%
)
EMPL
OY
MEN
T SH
ARE
(%)
SOUTH
WES
T
18
16
14
12
10
8
6
4
2
0
RELATIVEPRODUCTIVITY
EMPLOYMENTSHARE (%)
160
140
120
100
80
60
40
20
Notes: GVA/employment relative to average=100. Excludes the mining sector (1% GVA) as Extra Regio activity is not apportioned across regions. Source: ONS Regional Gross Value Added (Income Approach) and Business Register and Employment Survey.
Recent analysis from the ONS suggests that differences in productivity
between regions are not driven by differences in industry composition,
but are explained by firms being less productive across regions even
within the same sector.24 For example, firms in London have higher
median levels of productivity in most industry sectors when compared
with other regions.
There is considerable variation in regional innovation within the UK
(Figure 3.15). The highest share of R&D expenditure takes place in the
East of England, London and the South East.25 Investigating patterns
of regional innovation in depth, the government’s recent Science and
Innovation Audits have shown that there are many strong clusters of
research and innovation across the UK. These include transport, medical
food and energy in the Midlands, advanced engineering in South West
England and South Wales, and advanced manufacturing in Sheffield.
24 ONS (2017b).25 This represents a much larger share of regional GDP in the East. The share of GDP devoted to R&D has actually fallen substantially in the East since the financial crisis, which has also occurred in the North.
Regional imbalances have grown much faster in the UK than
in other major European countries. The increase in regional GDP
disparities is much higher than in France, Germany, Spain and Italy,
and also (at state level) than in the USA.26 The underlying causes of
these disparities are differences in the distribution of growth drivers
including innovation, infrastructure and education, set out previously.
FIGURE 3.15: R&D AS A SHARE OF GDP – REGIONAL (2014)
4.5
4.0
3.5
2.5
2.0
1.5
1.0
0.5
0
NORTH E
AST
WES
T M
IDLA
NDS
NORTH W
EST
YORKSH
IRE
& THE
HUMBE
R
EAST
OF E
NGLAND
LONDON
SOUTH
EAST
SOUTH
WES
TW
ALES
SCOTL
AND
NORTHER
N IREL
AND
R&
D A
S A
SH
AR
E O
F G
DP
(%)
REG
ION
SH
AR
E O
F TO
TAL
UK
R&
D, 2
014
(%)
EAST
MID
LANDS
25
20
15
10
5
0
2008 2014 SHARE OF TOTAL (2014)
Notes: Gross Domestic Expenditure on R&D as a share of GDP. Source: Eurostat.
A programme of decentralisation to city regions, including the “Northern
Powerhouse” has sought to address regional disparities, giving cities
with elected mayors revenue-raising powers and more decision-making
powers over local planning and infrastructure development. Part of
the challenge is to get the right balance between local initiative and
central direction. In addition, the structure of local government is an
impediment to the success of such policy, as it does not encompass
natural economic units. The recent report by the NIC on the Oxford-
Milton Keynes corridor highlights these issues, also emphasising the
need for a joined up approach to housing, jobs and infrastructure.27
26 See for example, Gardiner et al. (2013).27 https://www.gov.uk/government/publications/the-national-infrastructure-commissions-interim-report-into-the-cambridge-milton-keynes-oxford-corridor

44
Given these regional imbalances, another challenge is to develop
new arrangements for regional support when the UK leaves
the EU. The EU has played an important role in balancing UK regional
disparities through the subsidies provided by EU structural funds.
Following Brexit, similar support will have to be funded directly by
the UK taxpayer and similar frameworks will need to be put in place
for guiding it.
Industrial strategy in practice
Unlike other areas of macroeconomic policy there is no single
international “best practice” industrial strategy. At different levels of
government – national, regional and city-level – different countries
have historically experimented with a variety of interventions to actively
promote growth, address market failures and improve competitiveness.
From a focus on exports as the criterion for state-support in Korea and
Taiwan, to Finland’s focus on ICT investment as an enabler, different
countries have sought to develop competitive advantages through
the interaction of government and business.
The history of Industrial policy
British Prime Ministers have a rich tradition when it comes to
industrial strategy. The country’s first Prime Minister was an early
pioneer: Robert Walpole’s 1721 reforms included subsidies and taxes
designed to support Britain’s wool manufacturers, and as a result the
industry became Britain’s main export, which in turn did much to pay
for the imports which powered the industrial revolution. Walpole wrote
into the King’s speech (1721) that: “it is evident that nothing so much
contributes to promote the public well-being as the exportation of
manufactured goods and the importation of foreign raw material.”
In the US, interventions to protect infant industries and promote
exporting businesses formed the basis of the policies that Alexander
Hamilton, the first Secretary of the Treasury, set out in the 1840s.28
A subsequent period characterised by laissez-faire capitalism and free
trade came to end with the advent of the First World War. The post-
World War II period heralded a pivot towards more interventionist
industrial policy across most European countries.29 Between 1948 and
1952, recipients of the Marshall Plan funds (including the UK, France,
West Germany and a further fifteen European countries) were obligated
to establish long-term investment plans for national recovery. In 1961,
the UK established the National Economic Development Office to bring
together industrialists, academics, trade unions and government to
design industrial modernisation programmes.
The UK’s industrial policy of the 1960s and particularly 1970s
consisted of a number of policy mistakes with the government
heavily subsidising individual firms which eventually failed.30
The period was also characterised by poor economy-wide decisions
including costly investment subsidies, misdirected R&D spending,
protectionism, weak competition policy and a tax system which
discouraged enterprise.
There were also policy successes during this period, particularly
in pharmaceuticals and aerospace. The procurement policies of the
NHS encouraged R&D, and government supported medical research
at UK universities. In aerospace Rolls-Royce was nationalized in 1971
and then privatized in 1987; the company went on to become highly-
profitable as one of the largest producers of civil-aircraft engines in
the world.31
With the election of Margaret Thatcher in 1979, industrial strategy
swung out of vogue once again. Thatcher pared industrial strategy
back, phasing out both industry-focused and economy-wide policies.
Selective industrial policy fell out of favour due to the failures of the
1960s and 1970s, and also because EU rules on state aid constrained
policy. From this period, UK productivity growth began to pick up,
reversing a century of relative economic decline. Increased competition
appears to have been the key driver of this, together with improved
labour market flexibility, privatisation and lower marginal tax rates.32
When Tony Blair’s Labour government instigated wide-ranging
economic reforms, most were economy-wide including a new emphasis
on R&D, public capital investment, and a long-term commitment to
28 Grabas and Nutzenadel (2013).29 Britain incubated the notion of industrial strategy before transitioning to free trade in 1860, signified by the signing of the Cobden-Chevalier Treaty between Britain and France.30 See Crafts and Hughes (2013).31 See Lazonick and Prencipe (2005).32 See Crafts (2012) and Corry et al. (2011).
A seamstress at Barbour’s factory in South Shields. The company now sells clothing in over 40 countries worldwide. Bethany Clarke.

45
public education and expenditure on science. Importantly, there were
a number of reforms that significantly strengthened competition policy
during this period.33 While the Blair government was different
from its Conservative predecessor in many respects, the lack
of industry-focused policy was common to both.
The financial crisis of 2008 changed this, rekindling political interest
in industrial strategy in the UK and abroad. Faced with falling or
stagnating growth, high debt levels (constraining fiscal policy) and
the limits of monetary policy (as central bank reserve rates fell rapidly
towards zero), many countries looked to industrial strategy as a potential
lever. As the UK’s 2010 Liberal-Conservative coalition government
developed its industrial strategy, Japan, Germany, China and others
were stepping up their industrial intervention. At the start of 2017
industrial strategy, perhaps the most mercurial area of economic
thinking, is on a new upswing – both in the UK and overseas.
International Case Studies
Successful industrial policy has often been characterised by countries
learning from others before them: the US and Germany built on Britain’s
industrial policy in the eighteenth and nineteenth centuries; in the late
nineteenth and early twentieth century, Japan leveraged success stories
from Germany; and in the twentieth century China and Korea applied
Japan’s learnings to their own strategies.34 Looking to other countries
or settings is thus a crucial building block in designing a new industrial
strategy for Britain. There is no single international “best practice”
industrial strategy. The success of a strategy – and associated industrial
policy interventions – is a function of each country or region’s own
strengths and weaknesses, historical and economic context.
Government funded R&D: US
It is well established that the private sector underinvests in R&D, due
to its failure to internalise the wider social benefits from inventions
and the uncertain, long-term nature of potential payoffs. Moreover,
as previously discussed there is robust empirical evidence suggesting
that government-financed R&D spills over to the private sector. Such
considerations have led governments around the world to finance
basic and applied research.
33 The 1998 Competition Act and the 2002 Enterprise Act both strengthened the competition authorities. In particular there was an enhanced role and greater autonomy for the Competition Commission, a depoliticisation of merger reviews and tougher punishments for cartels.34 Chang and Adreoni (2014).
The US provides an important example of the success of
government financed research, which has been the source of
some of the most significant post-war innovations. A commonly
cited example is that all the technologies that have gone into the iPhone
were initially government funded: the Internet, GPS, its touch-screen
display and voice-activation.35
Some of these successes are by-products of a wider research “mission”.
A key example is the internet, the origins of which trace back to the US
government’s efforts to build spy-resistant communication networks
in the 1960s. The first incarnation of the internet, “ARPAnet” was
created by the Advanced Research Projects Agency (later DARPA),
a section of the military devoted to secret weapon systems. In fact
there is wider evidence that military spending in the US has been an
important source of private sector innovation which is likely to be a
function of its scale over the decades since WWII and its high-tech
nature.36 It has been argued that in addition to the funding that
enabled basic research, credit should also go to the competitive and
market-oriented nature of the university system in the US, and the
fact that DARPA did not tightly control the projects, encouraged wide
dissemination of research, and involved small firms.37 38
The US experience suggests that when a government mission, motivated
by political or societal concerns involves significant R&D, efforts should
be made to maximise spillovers via promoting information flow and
collaboration between universities and the private sector.
Other discoveries are the direct result of targeted research. An example
here is Google’s search algorithm which was originally based on
research financed by the National Science Foundation (NSF), via its
“Digital Library Initiative” which was interested in more accessible
interfaces for data collections.39 One of the first related grants went
to Stanford University, where Larry Page, then a graduate student,
and Sergey Brin invented “PageRank” which survives as one of the
main components of Google today.
This case illustrates the importance of government funding for basic
research. By its nature, the applications of early-stage basic research
are uncertain, but it is important that funding allocations are based
on a competitive process using independent expert reviewers. The
UK Research Councils have a similar model. The success of the US in
inventing ground-breaking technologies which are then commercialised
successfully illustrates the importance of links between universities
and businesses.
35 See Mazzucato (2015).36 See Draca (2013). 37 Rosenberg (2000).38 Fishback (2007). 39 The NSF is an independent federal agency which supports basic research in US universities.

46
Setting out a clear and co-ordinated plan: Korea
South Korea, one of the “East Asian Tigers”, is a well-known case
of successful catch–up growth, fuelled by exports and fast-paced
industrialisation. Between the 1960s and 1980s, Korean industrial
strategy was centrally planned, protectionist, and highly interventionist.
Policies included import protection, export promotion, credit and foreign
exchange rationing. These types of policy are rarely used by Western
democracies like the UK, but Korean industrial strategy provides
lessons on the importance of strong and joined-up institutions
and a long-term strategy with government monitoring its
success against pre-determined targets.
Industrialisation was meticulously planned by the Economic Planning
Board (EPB), a government department which co-ordinated policy
across different levels of government. The EPB created a series of
rolling five-year plans from 1962 to 1992, which worked down from
overriding objectives, to targets, to proposed policy interventions
and business actions, to allocation of resources (the EPB, unlike most
business departments around the world, had budgetary powers).
Korea’s policies were sequenced and coherent; long-term plans provided
a policy road map that business leaders understood. Co-ordination was
also enabled by “deliberation councils” in key industries, a concept
borrowed from Japan. These consisted of government officials, industry
representatives, and more “objective” observers such as academics
or journalists.40
Key to the effectiveness of policies aimed at boosting human capital
was that they sought to anticipate future demand for skills. For
example, in the 1960s education policy prioritised literacy, but since
the 1970s it has developed to promote research excellence as Korea
has sought innovation-led growth.41 The Korean government has also
consistently spent heavily on R&D, and provided R&D incentives to
the private sector. In 2015, Korea ranked 6th in terms of patents per
capita, up from 11th place in 2010.
40 See Chang et al. (2013).41 OECD (2012).
Targeted Subsidies: Germany’s energy transition
In 2010, a new commitment to decarbonised energy supplies was
passed into German legislation. This energy transition – Energiewende
– involves a stated target to generate 40-45% of electricity from
renewables by 2025, rising to over 80% by 2050. Energy affordability
and reliability over the long-term and reducing import dependency
have also been drivers of this policy. Energiewende provides a
useful example of how a government “mission” can have
implications for specific sectors and industry as a whole.
The policy works through targeted subsidies worth around €20 billion
each year. The government guarantees investors in non-carbon forms
of energy that: (i) their energy will go into the grid before carbonised
sources and (ii) at prices fixed for twenty years (a recent reform
will involve auctions to set these prices). While this implies a rise in
energy costs, intensive users (mainly in manufacturing) qualify for
exemptions in order to preserve their international competitiveness.
There are a number of problems with the policy, for example high
energy costs for consumers and the businesses not benefiting from
exemptions, and less progress cutting overall emissions, but Germany
has made good progress in terms of the stated target of raising the
share of renewables in electricity generation, which reached 30%
in 2015 (compared to 3.6% in 1990).42
A key beneficiary has been the German green industry which is now
a world leader (accounting for over half of European inventions
in climate change mitigation technologies).43 This could lead to
wider economic benefit since there is evidence that R&D in green
technologies has greater spillovers to the rest of the economy than
environmentally “dirty” technologies, and can boost productivity.44
Competitive procurement: UK television
The UK’s public-service broadcasters – the BBC and Channel 4 –
provide an example of a hybrid system, in which government support
has allowed the private sector to flourish. The BBC is the world’s
oldest and largest broadcaster with 21,000 full-time employees,
broadcasting in 28 languages. It is quasi-public, raising funds using
a “licence-fee” that all UK television owners must pay. Reflecting
the competition and supply-chain implications of its influence, the
BBC is subject to government-agreed supply arrangements. Channel
4 is wholly owned by the UK government but independently run,
buying content from private sector providers using revenues from
advertising sales. This set up has stimulated private industry in
42 See Rutten (2014).43 See Climate Change Mitigation Technologies in Europe - evidence from patent and economic data (2015). Report for the European Patent Office.44 See Dechezlepretre et al. (2013).

47
an interesting way, with potential lessons for wider industrial
strategy.
The BBC operates under clear rules. The Broadcast Act (1990) and
the Communications Act (2003) require it to commission 25% of
its television programmes from the independent sector each year.
A further 25% of productions must be commissioned through a
competitive process in which both in-house BBC and independent
producers can compete. The rules limit the extent to which the BBC
can crowd-out the private market – it makes the corporation part
competitor, part customer.
The BBC also has regional targets. These specify that 50% of television
production spend must come from companies located outside of
London, with 17% to come from Scotland, Wales and Northern
Ireland. Similar arrangements apply to radio and online. These regional
rules limit the dominance of London-based companies.
Private companies in the UK are global leaders in the provision of
independent television. The sector is led by the so-called “super-
indies” (for example All3Media and Shine Group), and a satellite of
smaller firms that supply to both the BBC and these large players.
The BBC spent £441 million on external commissions across all its
channels in 2015. Channel 4 is not far behind (spending £403 million
in 2015) as it does not have an in-house production division.45 In total,
2,700 creative suppliers provided content to the BBC, of which 80%
were small or micro-sized.46 While it is difficult to precisely determine
a causal impact of the BBC on the UK economy some estimates of
its value-added suggest that it generates £2 of economic value for
every £1 of licence fee.47
There are differing opinions about the value of the BBC to the UK
economy, with some arguing that it over-reaches in today’s increasingly
fragmented media landscape. Despite these tensions the BBC
provides an example of how public sector procurement can
support private sector growth and reduce regional imbalances.
Central to the success have been efforts to ensure a competitive
commissioning process with the BBC subject to a “Fair Trading”
audit. This safeguards the wider industry from potentially unfair
arrangements between the BBC and its subsidiaries, or negative
market impacts from its activities. This transparent and competitive
process, with regular external review is one that wider UK policies
could learn from.
45 See Ofcom (2016).46 See BBC (2015).47 See BBC (2013).
Modern Industrial Strategy in the UK
In 2010, thirty-one years after Prime Minister Margaret Thatcher
ushered in an era of free markets and privatisation, the Conservative-
Liberal Democrat coalition government turned to industrial strategy
as a potential lever to stimulate and redistribute growth. In 2013,
the government published its industrial strategy, which contained
support for eleven key sectors and eight key technologies. The sectors
were all judged to be strategically important, “tradable” and with a
“proven commitment to innovation”. Support has involved forums
for industry leaders and government to discuss barriers to growth;
the development of specific training institutions or initiatives within
the sector; and some match-funded financial commitments to certain
aspects of the sectors. The technologies all had established roots in
the UK and high growth potential. Funding for the development of
R&D centres for these technologies has been provided, some of which
has been used to set up or enlarge Catapult centres. Following the
2015 general election, the industrial strategy was downplayed but the
frameworks have remained in place. Early evaluations of elements of
these policies have found them to be successful.48 However evidence
set out above suggests the coalition’s industrial strategy was too
narrow, focusing mainly on high growth, high tech sectors, or those
where the UK possesses comparative advantage, rather than on
larger low-productivity sectors which employ a large section of the
workforce and where large gains can be made. Regional industrial
policies, particularly the development of the north of England have
been a focus of recent years.49
Theresa May’s government has committed to a new industrial
strategy in order “to get the whole economy firing” – with a focus
on infrastructure, house-building and measures to raise Britain’s
stagnating productivity. As part of this, the government has set out
a Green Paper asking for recommendations. The CEP will be happy to
provide evidence as part of the Green Paper process, beginning with
the recommendations in the next section.
48 See the Hauser Review (2014). 49 During this period George Osborne, Chancellor of the Exchequer, also began exploring place-based policies such as the Northern Powerhouse and wider devolution to City-regions with elected Mayors – these are to be carried forward by his successor as Chancellor, Philip Hammond.

48
Recommendations
The UK has strong frameworks governing monetary, fiscal and
competition policy (Table 3.1). Objectives are defined and enshrined
in law. Independent agents play a role in offering advice and in some
cases taking policy decisions. The remit of such bodies is transparent,
with justifications for their advice presented in statutory publications.
This has the potential to create a more stable framework and promotes
open government with external scrutiny by think-tanks, journalists
and academics. British industrial strategy lacks every element
of this general framework. Its focus, existence, and even the name
of the department implementing it are subject to the whims of Prime
Ministers or Business Secretaries. This creates political uncertainty
and hampers long-term decision making. The lack of transparency
undermines scrutiny and creates uncertainty for private investors.
The Commission recommends that industrial strategy should
be put on the same footing as other areas of economic policy.
This should include:
• A new law or long-lasting mandate, including a new state aid
law. The existing EU State Aid framework has prevented arbitrary
forms of political intervention in the economy. Developing a new
legal framework to replace it is essential once the UK leaves the EU.
This will help to ensure that the new industrial strategy is competitive
and contestable.
• A set of public guidelines for intervention. The development of a
set of transparent (and preferably quantifiable) rules and guidelines for
intervention in particular sectors, technologies or places are required.
Competitive processes should be used wherever possible to ensure
that government support is channelled to its most beneficial use.
• Independent decision making or oversight. The ultimate objective
should be a long-term industrial strategy that is isolated from political
cycles. There is a menu of options to choose from – from the Bank
of England’s Monetary Policy Committee, to Britain’s independent
budget, antitrust and infrastructure bodies. Any one of these would
be better than the current ad hoc set up. This independent body
should strive to overcome the fragmentation of authority within
central government and between local and central government.
• Enhanced transparency and accountability. The government
should therefore publish a long-term plan setting shared objectives
and aligning decision-makers across government, industry and
other stakeholders.
• External debate and scrutiny. The body responsible for industrial
strategy should publish a standardised Industrial Strategy Report every
year on the state of British business. (In line with the OBR’s Economic
and Fiscal Outlook, or the Bank of England’s Financial Stability Report).
This would provide regular material on the productivity of UK firms,
with updates on industry- or location-specific policies, together with
their costs and measured impacts.
With this new framework in place the government should pursue six
key priorities. These are:
• Skills shortages. A plan to tackle shortages in skills at all levels is
needed, in particular addressing basic skills deficiencies and ensuring
that the UK utilises and invests in female talent.
• Low-productivity sectors. Significant market failures are holding
back productivity in low-wage, low-productivity sectors that employ
large numbers of UK workers. Industrial Strategy must tackle these
problems through improving skills and technology adoption.
• Small firms. Focus financial support towards high growth potential
firms that face financing constraints, rather than small firms in general.
Expand the role of the British Business Bank (BBB). Review whether
tax and regulatory frameworks are distorting firm size, incentivising
firms to stay small. Address obstacles to small firms improving their
management practices.
• Universities and the private sector. Enhance collaboration between
universities, government and the private sector, building on existing
government frameworks, for example the Catapult model, and
continue to increase support for R&D into technologies of the future
where the UK has comparative advantage.
• City-growth policies. Cities are central to the UK’s success. Continue
to devolve power and support local leaders to create smart, connected
cities. Invest in digital infrastructure and environmentally friendly
transport structures. Ensure that housing supply matches demand
in growing cities.
• Growth, environment and wellbeing. Define a series of focused
public goals or missions that industrial strategy will support. These
should include environmental sustainability and improving health
and social care outcomes. Progress in these areas is important in its
own right, and is also likely to have a positive impact on growth in
the long run. Government should support innovative companies that
work in these areas, ensuring that the tender process is competitive
and knowledge diffusion is promoted.

49
TABLE 3.1: EXAMPLES OF UK POLICY FRAMEWORKS
Monetary Policy Fiscal Policy Competition Policy
Policy tool • Bank Rate
• Asset Purchases
• Tax and spending • Merger clearance and remedies
• Market investigations,
• Penalties for anti-competitive behaviour
Legal framework • Bank of England Act 1998
• Bank of England and Financial Services Act 2016
• Budget Responsibility & National Audit Act 2011
• Charter for Budget Responsibility
• Competition Act 1998
• Enterprise Act 2002
• Enterprise and Regulatory Reform Act 2013
Independent decision-maker or oversight
• Bank of England’s Monetary Policy Committee (MPC): external members
• Office for Budget Responsibility (OBR)
• Competition and Markets Authority (CMA) Board independent panel members
Mandate or guidelines • Inflation target • Fiscal rules • Duty to promote competition for the benefit of consumers.
Transparent publication • Inflation Report • Budgets
• Economic and Fiscal Outlook (EFO)
• Merger inquiry findings
• Market investigation findings

50
The Port of Felixstowe is Britain’s biggest and busiest container port, and one of the largest in Europe. It welcomes approximately 3,000 ships each year.

51
4. Openness
The UK is one of the most open countries in the world. In 2015 goods and services worth over £1 trillion (60% of GDP) flowed in and out of the UK as it traded with over 190 economies across the globe. Capital flows freely, with the result that British citizens and companies have around £10 trillion in overseas investments while foreigners have invested a similar amount here. People are also mobile; Britain welcomed some 36 million tourists in 2015, and there are currently around 5.6 million foreign nationals living in the UK, while around 5 million British citizens live overseas.
The result of the June 2016 referendum on EU membership will change the way goods, services, capital and people cross the UK’s borders. The main task for policymakers is to find a set of arrangements that foster opportunities, competitiveness and sustainable growth for the UK. This chapter reviews the UK’s experience of the movement of goods, capital and people to provide evidence-based recommendations about how the UK can make a success of its new relationships with the EU and rest of the world.
The background: The UK current account
International trade and finance have been important elements of the
UK economy for centuries. In the 1700s cotton, coffee and other
raw materials were imported from the colonies, refined in the UK
and exported to overseas buyers, many in mainland Europe. By the
early 1800s British investors were active overseas, sending funds to
buy stakes in American railroads and Argentinian mines. The British
diaspora is longstanding too. In all these ways the UK has reaped the
benefits of openness.
Over the past 20 years the UK went from a current account balance to
a current account deficit: The UK now buys more goods and services
from abroad than it sells as exports. Income on UK investments made
abroad is lower than foreigners’ income earned on investments here.
This has resulted in a large current account deficit (Figure 4.1). A
current account deficit (like a budget deficit) is not necessarily a bad
sign, especially if an economy is borrowing from abroad to invest in a
way that underpins future growth. But the fact that UK exports and
investment are falling short provides an important background for
upcoming trade negotiations.
FIGURE 4.1: UK CURRENT ACCOUNT
6
4
2
0
-2
-4
-6
-8
PRIMARY INCOME TRADE
SECONDARY INCOME CURRENT ACCOUNT
1955
1959
1963
1967
1971
1975
1979
1983
1987
1991
1995
1999
2003
2007
2011
2015
% O
F G
DP
Notes: Quarterly data, % of GDP. Source: ONS Balance of Payments Statistics.
Postgraduate student, Gang Wu, and Professor Anne Dell are conducting research into immune disorders at the Department of Life Sciences. Thomas Angus/Imperial College London.

52
Trade
In 2015, the UK exported goods and services worth £517 billion, or
around 28% of GDP. Imports were £547 billion, with a resulting trade
deficit of almost £30 billion. This deficit is longstanding – the last time
UK trade was in balance was in the late 1990s. The headline figures
reveal important differences between the UK’s trade performance in
terms of goods and services, industries and different parts of the world.
FIGURE 4.2: UK GOODS TRADE
IMPORTS EXPORTS BALANCE
1955
1959
1963
1967
1971
1975
1979
1983
1987
1991
1995
1999
2003
2007
2011
2015
30
20
10
0
-10
-20
-30
% O
F G
DP
Notes: Quarterly data, % of GDP. Source: ONS Balance of Payments Statistics.
FIGURE 4.3: TOP 20 GOODS MARKETS
ELECTRICAL MACHINERY
MECHANICAL MACHINERY
CARS
MEDICINAL & PHARMA
OTHER MANUFACTURES
REFINED OIL
VEHICLES
CLOTHING
SCIENTIFIC & PHOTO
AIRCRAFT
CRUDE OIL
UNSPECIFIED GOODS
ORGANIC CHEMICALS
METAL MANUFACTURES
PLASTICS
BEVERAGES
NON-FERROUS METALS
CLEANING
WORKS OF ART
IRON & STEEL60 40 20 0 20 40 60
IMPORTS EXPORTS
£BN
Notes: Imports and exports (goods only), 2015, £bn. Source: ONS.
Exports are a source of foreign income, and firms that export tend
to be more productive and pay higher wages. As a share of GDP
UK goods exports have been stable for the past 60 years, despite a
number of large swings in the exchange rate over this period. Goods
imports have gradually increased over time, creating a persistent and
widening deficit in goods trade (Figure 4.2).
Data on trade of goods by type shows that the UK suffers from a
shortfall across the board (Figure 4.3). The biggest deficits are on
electrical machinery and clothing. While cars are a key export, there
is still a £6 billion deficit on trade in the sector overall. Where the UK
does have surpluses they are much smaller: machinery, aircraft and
works of art all recorded surpluses of around £2 billion.
Trade in services is very different. There has been a marked change
in UK services exports over the past 60 years, with a large increase
in services trade starting in the early 1990s. Since then exports have
risen more quickly than imports, creating a persistent surplus on trade
in services (Figure 4.4).
Since the EU referendum, there have been reports of potential future
trade deals with a number of non-EU countries, for example Australia
and New Zealand. These are positive developments – but it is
important to take into account the importance of larger and
closer markets to UK trade.Burberry’s flagship store in Beijing. Burberry has invested heavily in the Chinese retail market.

53
International trade is highly concentrated. For example, while the UK
trades with over 190 countries, the top 20 trade partners account for
80% of all goods trade. Over 60% of total trade (goods and services)
is with the EU and US alone (Figure 4.5). The crucial deals that the
UK must strive for over the next two years are therefore with the EU
and the US.
The EU accounts for 44% of the UK’s exports and 53% of imports.
Europe is the UK’s natural trading partner due to its economic proximity
(geographical location and output mix) and market size, these are
referred to as “gravity forces” in economic models of international
trade.
The pattern of trade with EU partners has shifted over the past 20
years. In 1997 trade with Germany and France was broadly balanced.
Since then the UK has developed a sizeable deficit with France and
a much larger one with Germany. The balance of trade with every
large EU nation is in deficit. The lone exception is Ireland. Trade with
non-EU partners shows a much less regular pattern. Trade with the
US results in a large surplus: almost £14 billion in 2015. Trade with
the UK’s second most important non-EU partner, China, generates a
substantial deficit. Overall, trade with non-EU generated a small surplus
over the past 5 years, this narrowed at the end of 2016 leaving trade
broadly balanced.
FIGURE 4.4: UK SERVICES TRADE
15
10
5
0
-5
-10
IMPORTS EXPORTS BALANCE
1955
1959
1963
1967
1971
1975
1979
1983
1987
1991
1995
1999
2003
2007
2011
2015
% O
F G
DP
Notes: Quarterly data, % of GDP. Source: ONS Balance of Payments Statistics.
FIGURE 4.5: THE UK’S 20 LARGEST TRADING PARTNERS, GOODS
AND SERVICES
GERMANY
UNITED STATES
CHINA
NETHERLANDS
FRANCE
BELGIUM & LUX
REP. IRELAND
ITALY
SPAIN
SWITZERLAND
HONG KONG
JAPAN
SWEDEN
INDIA
CANADA
SOUTH KOREA
UAE
SAUDI ARABIA
AUSTRALIA
SINGAPORE
80 60 40 20 0 20 40 60
IMPORTS EXPORTS
£BN
Notes: Imports and exports of goods and services, 2015, £bn. Source: ONS, UK Trade Quarterly data.
Benchmarking performance against other countries
Comparing this export performance against that of other advanced
economies helps clarify the UK’s strengths and weaknesses. As an
exporter of goods, the UK is performing poorly compared to
its advanced economy peers. In terms of its share of global goods
exports, the UK is only just ahead of Italy (a country whose economy
is nearly 20% smaller than Britain’s) and is selling less abroad than
France. German export performance is stronger still (Figure 4.6).
In assessing export performance, it is useful to look beyond the
headline figures and consider how much “value-added” is retained
in the UK economy. For example, if a UK manufacturer produces a
good domestically using raw materials predominantly sourced from
the UK, the share of domestic value added will be high. On the other
hand, where manufacturers import a high share of their inputs and
do little to modify them, the share of value added retained in the UK
is smaller and also sensitive to import prices. The UK retains a lower
share of the value-added in goods exports than the largest exporting
countries (Figure 4.6).

54
FIGURE 4.6: COUNTRY SHARE OF GLOBAL EXPORTS, AND SHARE OF DOMESTIC VALUE ADDED, GOODS
100
95
90
85
80
75
70
65
60
20
18
16
14
12
10
8
6
4
2
0
CHIN
A
KORE
AUSGER
MANY
HONG K
ONG
FRANCE
NETHER
LANDS
UK
ITALY
JAPA
N
SHARE OF GLOBAL GOODS EXPORTS
DOMESTIC VALUE ADDED (VA) SHARE OF EXPORTS, INDUSTRY
% O
F G
LOBA
L G
OO
DS
EXPO
RTS
SHA
RE O
F D
OM
ESTI
C V
A IN
GO
OD
S EX
PORT
S
Notes: The left hand axis shows the share of global goods exports, and the right hand axis shows the share of domestic value added in exports. Source: Comtrade (data for 2014) and OECD (data for 2011).
An industrial perspective pinpoints the UK’s weaknesses. In both the
US and Germany two sectors – machinery and chemicals – account for
more than 50% of goods exports (Figure 4.7). The scale of the UK’s
shortfall next to Germany here is striking: German machinery exports
are much larger than the entirety of UK goods exports.
There is no single answer to the UK’s export shortfall, but research
points to a number of factors. One explanation is the size distribution
of UK firms (see Chapter 3). Larger businesses are more likely to be
exporters: around 40% of large businesses export goods or services,
compared to around 10% of small businesses.1 When compared to
advanced-economy peers the UK suffers from a gap in mid-sized
companies – the “Mittelstand” in Germany is made up of small to
mid-sized businesses with a strong export orientation.
Limited access to finance can hold back exports too. Recent research into
what explains firms’ propensity to export suggests that financial factors
– including the availability of equity finance – play an important role.
Exporting can imply fixed start-up costs, meaning that entrepreneurs
unable to access capital cannot finance their exports.2 CBI analysis
points also to a lack of consistency across government policies that
support exporters and a lack of awareness amongst businesses with
1 ONS (2014a). 2 See Manova (2013) and Chaney (2016).
regard to the government support that is on offer.3
The UK does fare better when benchmarked in the global services
trade, both in terms of share in total exports where it comes second
to the US, and also in the domestic share in value added (Figure 4.8).
Much of this is driven by financial and business services exports, which
account for nearly 70% of UK services exports (Figure 4.9). Given this
pattern of specialisation, the UK is particularly vunerable to non-tariff
barriers, such as licensing and regulatory constraints, which are the
main obstacles to services exports.
FIGURE 4.7: SECTORAL SHARE OF EXPORTS, GOODS
1,600
1,400
1,200
1,000
800
600
400
200
0US GERMANY FRANCE
OILS, FATS, WAXES
BEVERAGES ANDTOBACCO
CRUDE MATERIALS
FUELS ANDLUBRICANTS
OTHERCOMMODITIES
MANUFACTURERSMISC
MANUFACTUREDGOODS
CHEMICALS
MACHINERY ANDTRANSPORTEQUIPMENT
UK
$bn
Notes: Data for 2014. Source: Comtrade.
A useful measure of a country’s specialisation in a particular sector
is “revealed comparative advantage” (RCA). This is calculated by
comparing the sector’s share in a country’s exports to that sector’s share
in global exports. If the ratio of these two measures is greater than 1,
a country is said to have a revealed comparative advantage in a sector.
3 CBI (2015).

55
FIGURE 4.8: COUNTRY SHARE OF GLOBAL EXPORTS, AND SHARE OF DOMESTIC VALUE ADDED, SERVICES
100
95
90
85
80
75
70
65
60
20
18
16
14
12
10
8
6
4
2
0
US
CHIN
AUKGER
MANY
NETHER
LANDS
JAPA
N
INDIA
SINGAPO
REIR
ELAND
FRANCE
SHARE OF GLOBAL SERVICE EXPORTS
DOMESTIC VALUE ADDED (VA) SHARE OF EXPORTS, SERVICES
% O
F G
LOBA
L SE
RVIC
ES E
XPO
RTS
SHA
RE O
F D
OM
ESTI
C V
A IN
SER
VIC
ES E
XPO
RTS
Notes: The left hand axis shows the share of global goods exports, and the right hand axis shows the share of domestic value added in exports. Source: Comtrade (data for 2014) and OECD 2015 (data for 2011).
There are a number of sectors in both goods and services where the UK
does well in terms of RCA. In goods, 18 out of 110 sub-sectors have
an RCA larger than one; the highest RCA being in Aerospace (Figure
4.10, which shows the top 18 sectors in terms of RCA). In services,
RCA is calculated at a more aggregated level; in 5 sectors the UK has
an RCA larger than one, including insurance, finance, other business
and cultural/recreational services (Figure 4.11). A number of these
sectors have been the focus of the government’s recent industrial
strategy, discussed in Chapter 3.
Even without the EU referendum, significant policy changes are needed
in the UK: these have two fundamental planks. First, the number of
UK exporting companies needs to be boosted. Second, steps need to
be taken via international fora, including the World Trade Organisation
(WTO), to increase the share of services in world trade. The first would
eliminate UK weaknesses, the second play to our strengths.
FIGURE 4.9: SECTORAL SHARE OF EXPORTS, SERVICES
800
700
600
500
400
300
200
100
0US UK GERMANY
PERSONAL,CULTURAL AND REC
CONSTRUCTION
GOVERNMENT
COMMUNICATIONS
INSURANCE
COMPUTER ANDINFORMATION
FINANCE
ROYALTIES ANDLICENSE FEES
TRANSPORT
FRANCE
TRAVEL
OTHER BUSINESS
$bn
Notes: Data for 2014. Source: Comtrade.

56
FIGURE 4.10: UK RELATIVE COMPARATIVE ADVANTAGE, GOODS
AEROSPACE
BEVERAGES
BASIC PRECIOUS ANDNON-FERROUS METALS
PHARMACEUTICALS
INSTRUMENTS FOR MEASURING
PRINTING
JEWELLERY ANDRELATED ARTICLES
DETERGENTS, CLEANING AND POLISHING, PERFUMES
QUARRYING OF SAND AND CLAY
MOTOR VEHICLES
PAINTS, COATINGS, PRINTING INK
FISHING AND FISHERIES
PREPARED ANIMAL FEEDS
PESTICIDES, OTHERAGRO-CHEMICAL PRODUCTS
OTHER CHEMICAL PRODUCTSAGRICULTURAL AND
FORESTRY MACHINERYOTHER NON-METALLIC
MINERAL PRODUCTSMACHINERY FOR PRODUCTION
0 0.5 1.0 1.5 2.0 2.5 3.0 3.5 4.0 4.5
Source: World Bank. Data for 2015.
The impact of Brexit on trade
Open trade allows the UK to specialise in industries in which it has a
comparative advantage. It benefits consumers through lower prices
and by increasing the variety of goods and services available. Trade
therefore raises output, incomes and living standards.
EU membership has increased trade between the UK and the EU
through the removal of tariff barriers and reductions in non-tariff
barriers via the Single Market. Prior to the UK joining the European
Economic Community (EEC) in 1973, around one third of UK trade
was with the EEC. By 2015, the 27 other EU members accounted for
44% of the UK’s exports and 53% of imports.
Whatever model is adopted, trade costs with the EU are likely to increase
post-Brexit, and trade with the EU to diminish as a consequence.
Previous CEP analysis of the effects of Brexit from reduced trade
(accounting also for the saving from reduced contribution to the
EU budget) estimates that there would be fall in income per capita
of between 1.3% and 2.6%.4 The lower estimate assumes that the
UK remains part of the EEA, and the upper estimate assumes that
the UK would trade with the EU under WTO rules. The effect would
be substantially higher once long run effects of reduced trade on
productivity are included. The analysis suggests that the loss in income
would be widely shared across society. A series of other estimates
have been made by HM Treasury, the Office for Budget Responsibility
and the Bank of England. While estimates vary due to differences in
assumptions and methods, they all suggest that Brexit will lead to a
substantial fall in real income, and therefore living standards.
FIGURE 4.11: UK RELATIVE COMPARATIVE ADVANTAGE, SERVICES
FINANCE
PERSONAL, CULTURAL ANDRECREATION
COMMUNICATIONS
OTHER BUSINESS
ROYALTIES AND LICENSE FEES
COMPUTER AND IT
TRANSPORT
TRAVEL
CONSTRUCTION
0 0.5 1.0 1.5 2.0 2.5 3.0 3.5 4.0
INSURANCE
GOVERNMENT SERVICES
Source: World Bank. Data for 2012.
4 Dhingra et al. (2016a).

57
Previous CEP analysis also calculates the likely impact if the UK were
to unilaterally remove all tariffs on imports into the UK from anywhere
in the world. The estimated loss in income per capita does not change
much and is in the range 1% to 2.3%. The reasons for this is that
WTO tariffs are already low, so further reductions do not make much
difference. Non-tariff barriers are likely to be more important and
have a greater bearing on trade costs in future.
Foreign Direct Investment
The impact of the referendum result could also have a deterrent effect
on Foreign Direct Investment (FDI) and lead to a further fall in national
income. FDI refers to international investments made by residents and
businesses from one country into another, in the form of establishing
a new business, or acquiring an existing business. Inward FDI tends
to raise productivity which increases output and wages.5 FDI
has a direct impact as foreign owned firms in the UK are typically
more productive and pay higher wages compared to their domestic
counterparts. FDI also has an indirect impact as the technologies or
management practices in foreign owned firms can be adopted by
domestic firms, often through the supply chain of multinationals.6
FIGURE 4.12: SHARE OF OECD FDI STOCKS
35
30
25
20
15
10
5
0
US
UK
IREL
AN
D
GER
MA
NY
CAN
AD
A
SWIT
ZERL
AN
D
NET
HER
LAN
DS
FRA
NCE
AU
STRA
LIA
SPA
IN
% O
F TO
TAL
Notes: OECD FDI Stocks, 2015, share of total (total OECD inward FDI stock $16.3 trilion). Source: OECD.
5 See for example Bloom et al. (2012) and and Haskel et al. (2007).6 Harrison and Rodriguez-Clare (2009).
The UK has been successful at attracting inward FDI, and is host to
nearly 10% of the inward FDI stocks across the OECD, surpassed only
by the US (Figure 4.12). UK inward FDI stocks have been consistently
high as a share of GDP compared to the UK’s main peers, at around
55% of GDP since 2012 (Figure 4.13). The bulk of this investment has
come from EU countries (48%) and the US (24%). Inward FDI from
the EU has nearly doubled since 2005 (Figure 4.14).
FIGURE 4.13: INWARD FDI STOCKS
60
55
50
45
40
35
30
25
20
15
10
UK GERMANYFRANCE
2005
2006
2007
2008
2009
2010
2011
2012
2013
2014
2015
US
% O
F G
DP
Source: OECD.
These patterns are consistent with the “gravity” models of trade flows
whose theoretical foundations apply equally to factor input flows such
as capital. The greatest FDI capital flows occur between geographically
close and / or large economies. Of the total inward FDI from the EU,
86% is explained by investment from the Netherlands, Luxembourg,
Germany, France and Spain.
Almost two-thirds of UK inward FDI stocks relate to services, and
26% to financial services alone. Manufacturing is the next largest
receiver of inward FDI at 20%. A key difference in composition is with
Germany that has a much smaller share of FDI in its manufacturing
sector (Figure 4.15).

58
FIGURE 4.14: INWARD FDI STOCKS BY AREA/COUNTRY OF ORIGIN
AFRICA
AUSTRALASIA AND OCEANIA
ASIA
OTHERAMERICAS
OTHEREUROPE
USA
EU
1,200
1,000
800
600
400
200
02005 2014
$bn
Source: ONS, Inward Foreign Direct Investment (FDI) Involving UK Companies, 2014 (Directional Principle).
Around 14% of UK private sector employment is in foreign owned
firms. Affiliates owned by EU and US corporations account for 7%
and 4% of UK’s total employment respectively. The sectors with
the highest shares are manufacturing, utilities and financial services
(Figure 4.16).
Demand and supply side considerations motivate FDI decisions,
and the UK has historically done well on both. On the demand
side, the UK has offered investors access to a large domestic market
of 60 million consumers. But while the UK is a member of the EU,
firms have border-free access to a further 440 million consumers
via the European Single Market. This holds for both manufacturing
and services sectors. Moreover, “passporting rights” have allowed
financial services firms to operate seamlessly across country borders
within the EU.
The UK has flexible labour markets, a skilled workforce and a strong
rule of law – all of which make it attractive for FDI. Access to EU markets
has made the UK particularly attractive for firms with “Global Value
Chains”.7 Shipping of goods along the value chain is facilitated by the
single market, with firms able to purchase inputs straightforwardly
from other EU countries. Member countries do not need to comply
with “rules of origin” concerning the inputs used in production (these
are the criteria which determine the national source of a product,
7 The process through which firms seek to optimise their production processes through locating different stages of production in different locations.
and hence the level of customs duty), trade is tariff-free within the
EU, and it is subject to minimal non-tariff barriers. Moreover, the UK
attracts highly skilled workers from the entire EU market.
The UK has also had high levels of outward FDI, though this has been
declining as a share of GDP (Figure 4.17). This decline has coincided
with decreasing returns on foreign investment. The patterns of outward
FDI are similar to inward FDI in terms of international partners and
sectors. Nearly 40% of outward FDI is into the EU, and 50% relates
to the services sector.
FIGURE 4.15: INWARD FDI STOCKS BY INDUSTRY (2012)
OTHER
CONSTRUCTION
ELECTRICITY, GAS, WATER
AGRICULTURE, FOREST AND FISHING
MINING AND QUARRYING
MANUFACTURING
FINANCIAL SERVICES
SERVICES (EXCL OTHER)
100
90
80
70
60
50
40
30
20
10
0UK US GERMANY FRANCE
% O
F TO
TAL
Notes: US data are for 2011, Other includes public corporations, property data, bank holdings and monetary financial institutions (MFI). Source: ONS.
The impact of Brexit on FDI
There are three reasons why Brexit might reduce inward FDI. First, being
in the Single Market makes the UK an attractive export platform for
multinational firms. Second, multinationals have complex supply chains
and face co-ordination costs between their headquarters and local
branches which would become more difficult to manage if the UK left
the EU. For example, component parts would be subject to different
regulations and costs; and intra-firm staff transfers would become
more difficult with tougher migration controls. Third, uncertainty over
the shape of the future trade arrangements between the UK and the
EU would also tend to dampen FDI flows.

59
FIGURE 4.16: SHARE OF EMPLOYMENT IN FOREIGN OWNED FIRMS (EU, NON-EU)
40
35
30
25
20
15
10
5
0
AG
RICU
LTU
RE,
MIN
ING
EU OWNED NON-EU OWNED
MA
NU
FACT
URI
NG
UTI
LITI
ES
CON
STRU
CTIO
N
WH
OLE
SALE
AN
D R
ETA
IL
TRA
NSP
ORT
ATI
ON
ACC
OM
MO
DA
TIO
N,
FOO
D A
ND
TO
URI
SMM
EDIA
AN
D
PUBL
ISH
ING IT
FIN
AN
CE A
ND
INSU
RAN
CE
REA
L ES
TATE
PRO
FESS
ION
AL
ACT
IVIT
IES
EDU
CATI
ON
AN
DRE
SEA
RCH
HEA
LTH
OTH
ER
% O
F EM
PLO
YM
ENT
Source: ONS. Data for 2014.
Based on a statistical model of bilateral FDI flows between 34 OECD
countries from 1985 to 2013, Bruno et al. (2016) estimated that there
is a positive effect of being in the EU of between 14% and 38%
higher FDI inflows.8 Since leaving the EU is likely to have a smaller
proportionate effect than joining, this suggests that leaving the EU
will reduce FDI inflows to the UK by about 22%. The same analysis
finds that membership of the European Free Trade Association
(EFTA) is not sufficient to restore the FDI benefits of being in the EU.
It suggests that when it comes to FDI flows, a comprehensive free
trade deal after Brexit is a poor substitute for full EU membership.
This fall in FDI flows is likely to translate into a fall in national income
of around 3.4%.
The car industry and the finance sector provide two useful case
studies of how high FDI sectors might be impacted by Brexit.
Cars are a recent success story for UK manufacturing. In 2014, the
car industry employed nearly 300,000 workers and contributed
around 5.1% to total UK exports; 40% of its car exports were to
the EU. It is therefore useful to understand how Brexit might impact
on international car company decisions on where to locate their
production, as well as levels of car production and prices. Analysis
described in Dhingra et al (2016b) assumes that Brexit would lead
to an increase in trade costs (via tariff and non-tariff barriers), and
8 Dhingra et al. (2016b).
coordination costs (for example if transfers of staff are more difficult
due to immigration controls, or different regulatory standards make
it more difficult to work across borders).9
It is estimated that total UK car production could fall by 12% or almost
180,000 cars per year, as car manufacturers move some production
away from the UK. Prices faced by UK consumers also rise by around
2.5% in this scenario as the cost of imported cars and their components
increase. The potential impact would be much smaller if the UK faced
no trade barriers on cars and car components with the rest of the EU
(for example, if it joined EFTA). Prices would be stable in this scenario,
but coordination costs could lead to some firms relocating plants (the
fall in car production in this scenario is around 2%).
FIGURE 4.17: OUTWARD FDI STOCKS
80
70
60
50
40
30
20
10
UK GERMANYFRANCE
2005
2006
2007
2008
2009
2010
2011
2012
2013
2014
2015
US
% O
F G
DP
Source: OECD.
9 Head and Mayer (2015).

60
The finance sector accounts for over a quarter of inward FDI stocks,
and represents a high share of employment and GVA in the economy.
Crucial for the cross border operations of this sector has been the
“passporting” regime enjoyed by EU member states. This allows a
financial institution located in the UK to provide services across the
EU subject only to UK regulations. Even with such rights as those
enjoyed by Norway, which as a member of the EEA has access to
the Single Market, there still seem to be greater difficulties in doing
business with the EU.
Outside the EEA, passporting rights seem unlikely. Switzerland (in
EFTA) has no passporting rights, so Swiss financial institutions mostly
get access to the EU via special bilateral treaties with the EU, which
still require permissions to set up branches in EU member countries.
This is one of the reasons that Swiss financial institutions have often
set up subsidiaries in the UK. The Swiss example shows that while
trade with the EU will still be possible it will be more costly after the
UK leaves the EU.
The likely impact of Brexit on outward FDI is less clear. UK investors
might increase investments in the EU (for example through setting up
subsidiaries that can benefit from the Single Market), but this could
displace investments to the rest of the world.
The likelihood that access to the EU market will be more difficult
following Brexit underlines the need to strengthen the business
environment in the UK in a range of policy areas as outlined
throughout this report. We now discuss the different trade options
facing the UK post-Brexit.
Trade options outside the EU
The political and legal landscape surrounding Brexit is evolving at a
fast pace and there is still a high degree of uncertainty over its likely
form. A number of options appear to have been largely ruled out
(these are shaded in grey in Table 4.1 which shows the key attributes
of different Brexit models). In its recent White Paper on the UK’s exit
from the EU, Government has stated that border control will be a
priority and that therefore, the UK cannot remain in the EU’s Single
Market.10 Moreover, staying in the Customs Union appears unlikely
as this limits the UK’s capacity to negotiate its own trade deals which
is another of the government’s key objectives.
10 Norway, Liechtenstein and Iceland are not EU members, but have access to the Single Market via membership of the European Economic Area (EEA).
This implies that the UK will need to find a bespoke trade agreement
with the EU. One option - which may be difficult politically - is re-joining
EFTA, which would provide tariff-free trade in goods. The other option
is to negotiate a bespoke deal of the type recently agreed with Canada.
Neither would guarantee free trade in services, and would still result
in significant non-tariff barriers in goods markets such as complying
with rules of origin. The UK must therefore aim for a better deal than
either of these options, in particular with respect to the services sectors
where the UK has comparative advantage, acknowledging that there
is likely to be some cost or concession to achieve it.
In order to revert to World Trade Organization (WTO) membership, the
UK would first have to become an independent member of WTO. If
this did happen and became the default, then under WTO rules, each
member must grant the same ‘most favoured nation’ (MFN) market
access, including charging the same tariffs, to all other WTO members.
The UK would then have the same trading relationship with the EU as
any other country. In the absence of any bilateral trade agreements
with the EU (or any other countries) the UK would have to determine
a universal set of tariff rates to apply with all trading partners. If tariffs
are too high, imports will be more expensive, harming UK consumers
and businesses which use significant imported inputs. While lowering
tariffs would make imports cheaper, there is no guarantee that this
would be reciprocated, and the UK will lose bargaining power: once
duty-free access to the UK market has been offered, other countries
will have no incentive to give the UK preferential access to their own
markets.
It is crucial that the system replacing EU membership is able to maintain
low tariffs with the EU. But equally crucial is the need to constrain non-
tariff barriers to trade which add substantially to trade costs. Adherence
to EU rules and regulations have been an essential component of
reduced non-tariff barriers. So even outside the EU, it is likely that
harmonised rules will be required in any deal that preserves high
levels of market access.
There are some areas that could be particularly problematic. For firms
participating in global value chains, with high shares of imported inputs,
the bureaucratic cost of complying with EU rules of origin are high
and may reduce the UK’s attractiveness as a location for production
processes. Moreover, the financial costs associated with expediting
tax (VAT) and customs clearance are especially important for small
exporters. As previously discussed, small and medium enterprises do not
typically export and those that do currently focus on the EU market.11
11 9% of SMEs export and a further 15% are in the supply chains of other businesses that export. Most of this relates to the EU. See BIS (2016a).

61
It has been argued that leaving the EU provides the UK with more
freedom in designing domestic policies and regulatory frameworks
aimed at increasing firms’ profitability, which may compensate
for the rise in administrative costs implied by Brexit. The UK
would have the freedom to redesign all areas currently under the
authority of the EU, including competition policy, international
trade regulations, and areas that rely on EU funding like regional
development and research. However, any new subsidies or
regulations that do not comply with EU or WTO normative
standards may result in the imposition of further market restrictions
from global trading partners. More generally, a lack of coordination
in competition policies with the EU will provide more freedom for
domestic policy design, but will leave UK firms vulnerable to anti-
dumping measures and less able to export. Moreover, it is worth
noting that any country that exports goods to the EU has to comply
with EU product standards.
TABLE 4.1: BREXIT OPTIONS
Current UK EFTA plus EEA: Norway
EFTA plus EEA: Liechtenstein
EFTA plus bilateral agreements: Switzerland
EFTA only Trade deal: Canada
WTO
Free trade in goods? yes yes yes yes yes mostly MFN tariffs, non tariff barriers WTO compliant
Free trade in services?
yes yes yes limited access limited access limited access limited access
Ability to negotiate own trade deals with rest of world?
no yes yes subject to EU consent
yes yes yes
Immigration control?
no no subject to EU consent
no yes yes yes
Subject to EU rules and regulations?
yes yes some some EU product standards on exports
EU product standards on exports
EU product standards on exports
Subject to EU policies and programmes?
opt out from some EU programmes
opt out from some EU programmes
opt out from some EU programmes
opt out from some EU programmes
no no no
Payments to EU? Budget contribution
Budget contribution
Budget contribution
Budget contribution
no no no

62
New relationships with the rest of the world
By exiting the EU, the UK will be allowed control over trade deals
with non-EU countries. While the UK will now be able to seek trade
agreements tailored to UK interests, it will have reduced bargaining
power with large trade partners like the US and China once it is outside
the largest trading bloc in the world. There is a risk, therefore, that
the UK will have less power to negotiate deals that are in its long-
term interest.
Exploratory talks have already taken place with a number of countries,
most recently the US, but also New Zealand, Australia and Gulf nations.
The analysis of UK trade above shows that while all such deals are
positive developments, the UK must prioritise deals with the US and EU.
Currently the UK and the US trade under WTO terms. Tariffs are
already relatively low, and the largest gains would be from reducing
non-tariff barriers, for example through regulatory harmonisation.
This may now be more difficult. Under the previous US government,
a wide-ranging deal was being negotiated with the EU (the TTIP) ,
but the general consensus so far is that President Trump will be more
protectionist than his predecessor.
In the coming years there are opportunities to increase exports to China
and India. Both have rapidly growing middle classes with a preferences
for goods and services where the UK has comparative advantage.
It is important to note that deepening international integration
with non-EU countries – in particular emerging markets - implies
different challenges than those faced in current partnership with the
EU. European economies are relatively similar to the UK in terms of
education, labour costs, and environment regulations. As a result,
much of the gains from trade within the EU are based on economies
of scale and access to broader varieties of goods and inputs. The gains
from trade with labour-abundant economies such as China or India
are based on complementary patterns of factor abundance.
Immigration
Having discussed flows of goods and services, we now consider flows
of people.
Immigration to the UK has increased significantly over the past 20
years. There are now around 9 million individuals (and 7.4 million
working age adults) living in the UK who were born abroad; 5.6 million
of these are foreign nationals. As a share of the UK population this is
14.1%, and has risen from 5.8% in 1975.
Around half of the change has been from other EU countries. Following
the UK’s vote to join the EU in 1973, immigration from France and
Germany more than doubled.12 The pace of EU immigration increased
after 2004 and the accession of eight Eastern European countries
(known as the “A8”).13 The number of immigrants from other EU
countries living in the UK has tripled from 0.9 million to 3.3 million
over this period.
FIGURE 4.18: IMMIGRATION – SHARES OF TOTAL POPULATION
0% 10% 20% 30% 40% 50%
MEXICOPOLAND
CHILEFINLANDGREECE
CZECH REPUBLICRUSSIAN FEDERATION
PORTUGALDENMARK
ITALYNETHERLANDS
ICELANDFRANCE
OECDSPAIN
GERMANYUNITED STATES
UNITED KINGDOMNORWAYBELGIUMIRELANDSWEDENAUSTRIACANADA
NEW ZEALANDAUSTRALIA
LUXEMBOURG
Source: OECD. Data for 2014.
This pattern has been seen by many OECD countries. The UK does
not stand out from its advanced economy peers with regard to its
share of immigrants in the population or with regard to the rate of
new inflows. The UK is, and has been for some time, a middle ranking
country in terms of its foreign-born population share (Figure 4.18).
12 1971 Census estimates 157,000 German-born and 36,000 French born. ONS in 2013 estimates 297,000 German-born and 150,000 French-born.13 The A8 comprises Czech Republic, Estonia, Hungary, Latvia, Lithuania, Poland, Slovakia and Slovenia.

63
Immigration fluctuates over time, often reflecting divergences in
economic growth between economies. For example, following
Portugal’s 2011 recession emigration more than doubled in a single
year 2011-2012, with remittances from Portuguese nationals that
had relocated to Angola increasing by 84% in this same year. UK
immigration has seen ebbs and flows. When the A8 joined the EU
in 2004, immigration from the EU rose significantly. It then fell back
during the 2008 financial crisis and recession that followed, resuming
shortly thereafter, as the UK returned to growth. In 2016, the 3.3 million
EU immigrants living in the UK represent 5.3% of the population and
make up 35% of all immigrants living in the UK.
Poland is now the largest source country of immigrants – at around
940,000 – followed by India (760,000) and Pakistan (480,000) (Figure
4.19). Lithuania supplies the most migrants per head of its own
population: the 180,000 Lithuanian nationals living in the UK represent
around 6% of Lithuania’s total population.
Immigration is unevenly dispersed across the UK regions, with a much
greater concentration of immigrants in London than in the rest of the
country (Figure 4.20).
FIGURE 4.19: IMMIGRANTS BY COUNTRY OF ORIGIN
0 200,000 400,000 600,000 800,000 1,000,000
POLAND
INDIA
PAKISTAN
IRELAND
GERMANY
ROMANIA
ITALY
BANGLADESH
NIGERIA
SOUTH AFRICA
LITHUANIA
UNITED STATES
Source: ONS LFS.
Almost 40% of London’s population was born abroad and more than
a third (37%) of all migrants to the UK live in London. In contrast, less
than 5% of those living in the North-East (excluding Tyne and Wear)
were born abroad. Migrants from the EU are more evenly distributed
across the UK, though again London accounts for the largest fraction.
The rate of change of immigration is however greater outside London.
While immigration has risen considerably, opinion polling suggests
the public perception is that it is higher still, with UK nationals over-
estimating the size of the immigrant population.14 Immigration was a
key factor behind the EU referendum vote, and it seems highly unlikely
that Britain’s new relationship with the EU will preserve the freedom
of movement in its current form. Given public concern it is important
to investigate and clarify the evidence on immigration’s effects on the
UK labour market and wider economy.
FIGURE 4.20: IMMIGRATION – SHARES OF UK LOCAL POPULATION
0% 10% 20% 30% 40% 50%
NORTHERN IRELAND
SCOTLAND
STRATHCLYDE
WALES
NORTH WEST
MERSEYSIDE
GREATER MANCHESTER
WEST MIDS.
WEST MIDS. MET.
SOUTH WEST
SOUTH EAST
LONDON
EAST ANGLIA
EAST MIDLANDS
YORKSHIRE
WEST YORKSHIRE
SOUTH YORKSHIRE
NORTH EAST
TYNE & WEAR
EU IMMIGRANTS
ALL IMMIGRANTS
Source: ONS LFS.
14 https://www.ipsos-mori.com/researchpublications/researcharchive/3466/Perceptions-are-not-reality-10-things-the-world-gets-wrong.aspx

64
Immigration and the labour market
Employment opportunities are an important driver of immigration.
About 70% of EU immigrants say they come to the UK for work-related
reasons, as opposed to study or joining their families.15 Even though
immigration increases the total number of people in work or looking for
employment, this does not necessarily mean that the opportunities of
UK workers have been harmed. Since immigrants consume local services
and goods, this increases demand and so improves the job prospects
of those who produce those goods and services. In general, there is
no fixed stock of jobs in the economy – over the past 100 years, the
UK population has grown by around 50% while the unemployment
rate has not trended upward.
Immigrants do not take the majority of new jobs (jobs that are three
months old or less). The latest data show that immigrants account
for around 1 in 5 of all new hires. The immigrant share in new jobs
follows the same trend as the share of immigrants in the working age
population (Figure 4.21).
15 See ONS Migration Statistics Quarterly Report, Dec 2016.
FIGURE 4.21: IMMIGRATION AND JOBS
1985
1986
1987
1988
1989
1990
1991
1992
1993
1994
1995
1996
1997
1998
1999
2000
2001
2002
2003
2004
2005
2006
2007
2008
2009
2010
2011
2012
2013
2014
2015
2016
IN NEW JOBS
25
20
15
10
5
0
IN WORKING AGE POPULATION
IMM
IGRA
TIO
N S
HA
RE (%
)
Source: ONS LFS.
FIGURE 4.22: IMMIGRATION AND UNEMPLOYMENT
8
6
4
2
0
-2
-4
-6
-8
UN
EMPL
OY
MEN
T CH
AN
GE
(%)
CHANGE IN EU IMMIGRATION (%)
-4 -2 0 2 4 6 8 10 12 14
Source: ONS LFS.
Alonzi’s Harbour Bar in Scarborough, Yorkshire. The Alonzi family have been selling ice cream in Scarborough since Giulian Alonzi emigrated there from Monte Cassino, Southern Italy, in the early 1900s.

65
A disaggregated analysis, looking at individual local areas suggests
immigration is unlikely to have increased unemployment among the
UK-born population. This is illustrated in Figure 4.22 where each dot
represents one of the UK’s 201 local unitary authorities, plotting the
changes in unemployment rates of the UK-born against changes in
EU immigration between 2008 and 2015. The line summarises the
relationship: there is no statistically significant relationship – negative
or positive – between changes in EU immigration and changes in
unemployment rates of those born in the UK. The same is true for
pay. There is no systematic link between changes in the real wages of
UK-born workers and changes in EU immigration. Thus immigration
appears not to have had either a systematic positive or negative
impact on unemployment or wages.
This is not to say that immigration is cost free. One group that does
seem to lose out from new immigration are other recent immigrants.
One study in particular, examining male wages in the UK from the
mid-1970s to the mid-2000s, found that immigration reduced the
wages of other immigrants who had previously settled in the UK, with
the strongest effect being found on university educated immigrants.16
There were little discernible effects on the wages of the native-born.
If the analysis above is repeated for less skilled UK-born workers a
similar lack of association emerges. Some studies however have found
evidence of small wage losses for UK-born workers in the bottom
10% of the pay distribution alongside wage gains for those in the
middle of the pay ladder as a result of immigration.17 However, these
wage changes are very small; EU immigration between 2004 and
2015 reduced wages for the bottom 10% of UK-born workers by
only around 1% and raised wages for the average (median) worker
by around 1.2%.
Another study has found small wage losses for all workers in particular
occupations when immigration to the occupation increases.18 The main
result is that all EU immigration since 2004 (over a period of 8 years)
has reduced semi/unskilled services sector wages by less than 1%.
This effect is likely to have been outweighed by other labour-market
factors such as minimum wages which have increased by 4% over
the same period.19
16 Manacorda et al. (2011).17 Dustmann et al. (2013).18 Nickell and Saleheen (2015). 19 CER (2016).
Immigration and public finances
Immigration has had a positive impact on public finances
although the size of the effect is small. A larger population means
a bigger tax base. EU immigrants are young – their average age is
3820 (compared to the UK average age of 40), they are more likely
to work and less likely to be on benefits.21 The UK also gains when
adult immigrants arrive, since UK taxpayers have not had to finance
the childhood schooling and healthcare costs as they would do for a
UK-born adult. In short, immigrants contribute more to fiscal revenues
than they take up in expenditure.22 By contrast, UK nationals, as a
whole, received more in benefits than they paid in taxes.
Access to benefits is a major public concern according to YouGov
polling although, just like UK nationals, immigrants are not eligible
for contributory-related benefits until they have worked full-time for
two years.23 Furthermore, in 2016, government reduced access to
benefits for immigrants from the EU. A further concern is that the
large planned rises in the UK’s minimum wage – the National Living
Wage – would draw in many more immigrants. However, it is unclear
how big a draw this will be since it depends, in part, on what other
countries do to their own wages and on the relative cost of living.
Empirical studies have found no clear link between increased
immigration and access to public services. In education, there is
evidence of a positive effect from Polish children on UK-born pupils
(with the disadvantages from having English as a second language
seemingly outweighed by a stronger immigrant push to work hard
at school).24 Studies of the NHS find no greater usage of doctors and
hospitals by immigrants relative to the UK-born; and little effect on
NHS waiting times.25 Moreover, immigration has helped on the supply
side: the UK-born are more likely to be cared for by an immigrant
than be behind one in the queue. Studies that investigate the links
between migration and competition for social housing or crime also
do not find significant effects on average.26
20 The average age of immigrants from the A10 countries such as Poland and Latvia, is even lower at 32.21 CER (2016).22 Dustmann and Frattini (2014) find between 2001 and 2011 European migrants had a net fiscal contribution of £20 billion.23 They are, however, eligible for means-tested benefits. HMRC estimates that around 6% of tax-credit claims are from households that include an EU national; this is in line with the share of EU nationals in the UK (House of Commons, 2014).24 Geay et al. (2013).25 See Wadsworth (2013) and Giuntella et al. (2015) 26 See Battiston et al. (2013) and Bell et al. (2013).

66
The impact of Brexit on immigration
The government has stated that controlling migration is a key priority
in any new deal with the EU. EU membership puts migration decisions
solely in the hands of EU citizens, as a precondition of access to the
Single Market is the free movement of people. The previous section
shows that while there might have been localised costs associated with
this (in particular areas or occupations), in aggregate the costs and
benefits to the UK workforce and economy were broadly balanced.
Post Brexit, all migration and not just that for non-EU citizens will
be based on UK policy decisions. While this is a change of direction,
it puts the UK government on a par with most other countries
around the world, few of which give unilateral free movement to
the citizens of other countries. Moreover, this is not inconsistent
with being a “pro-immigration” country in the spirit of Canada,
Australia or New Zealand whose policies are intended to select the
characteristics of migrants.
It is important that UK immigration policy post-Brexit should be
based on a set of clearly defined criteria which reflect a coherent
view of what type of immigration is desirable. Although not the only
criterion, contributing to the skills-base and talent pool needed for
the UK economy to flourish is a central consideration if immigration
is to support economic growth effectively.
A starting point would be to extend the visa scheme that applies to
non-EU immigrants to EU nationals. Current rules effectively exclude
non-EU immigrants from all but graduate jobs and limit numbers
arriving on work visas each year to around 55,000.27 This could result
in skills shortages. Some employers already find it hard to recruit and
retain highly skilled and mobile non-EU workers which contributes
to the skills shortages that are consistently reported by entrepreneurs
and managers. It is essential that the visa system processes
applications in a timely way and is properly resourced in order
to enable businesses to attract the skilled labour that they need.
In the year to September 2016, the UK granted almost 94,000 high-
skilled (Tier 2) visas to non-EU immigrants, a 1% increase on the year
before.28 Immigration from EU countries has not been dependent on
skills, qualifications or educational attainment. Nevertheless, many of
the EU migrants have been highly educated: of the EU migrants in the
working age population 45% have high and 42% have a medium level
of educational attainment. Around 48% of EU migrants were working
in skilled jobs in 2016, according to ONS Labour Force Survey data.
27 Non-EU migrants must apply for the Tier visas in a points based system. 28 57% of these applications came from Indian nationals; and US nationals were the second largest group accounting for 10% of the total. The main sectors employing these recent migrants were IT (42%), professional, scientific and technical activities (19%) and finance (12%). See ONS Migration Statistics Quarterly Report, Dec 2016.
Given the current free movement of workers within the EU, the system
post-Brexit will pose a new administrative burden on businesses
seeking visas for EU workers. This is likely to make it harder to recruit
and retain top talent and might also put off skilled EU migrants from
wanting to come to the UK in the first place. The potential impact of
Brexit on the university sector is of particular concern. The students
and academics that have contributed to the success of UK universities
come from all over the world, and the sector is a source of skills,
innovation and exports in its own right. Parliament has established a
Select Committee on the topic and evidence presented so far suggests
that applications (from both EU and non-EU students) have fallen since
the EU referendum, and that academics now consider the UK a less
attractive place to work and conduct their research.
The low end of the skill distribution is also a challenge. The prosperity
of many industries depends on access to low-skilled EU workers. EU
migrants constitute 31% of employment in food manufacturing,
23% in domestic personnel and 21% in accommodation.29 Unless
firms can easily find native workers to fill these jobs, the output and
competitiveness of these sectors is likely to fall due to staff shortages,
and/or higher staff costs. When the criteria for visas are set, this
should be based on a wide assessment of the labour market needs
of UK businesses.
Policy recommendations
The UK has a long-standing commitment to openness and this should
be maintained as the UK forges new relationships with the EU and rest
of the world. This means low tariff and non-tariff barriers, facilitating
FDI (including welcoming foreign ownership of UK based business)
and openness to global talent.
Brexit could be interpreted as a reversal of this traditional commitment
to openness and the government has the opportunity to signal that it
is not. The UK’s long-standing current account deficit underlines the
importance of market access for exporters and protecting UK consumers
and businesses from large increases in import prices. Research shows
that Brexit will imply significant economic costs, but the “type” of
Brexit will determine how large these costs are.
29 Resolution Foundation (2016).

67
The political and legal frameworks governing Brexit are evolving
quickly. At this stage, it seems that the UK will be seeking a bespoke
deal with the EU. Though it is quite unlikely that the EU will offer
the UK a similar arrangement, the government should look carefully
at the Liechtenstein model where some of the economic benefits of
market access are maintained, while retaining the capacity to control
immigration and negotiate deals outside the EU. In particular:
• The government should prioritize trade deals with its largest
trade and investment partners – the EU and the US. Striking a
free trade agreement with the US with a focus on reducing non-tariff
barriers could provide a blueprint for other bilateral negotiations.
Government should also be mindful of the medium term potential
of fast growing emerging markets.
• The UK must negotiate market access for services, its key area
of comparative advantage. This is likely to require maintaining
most EU rules and regulations in this area. Mutual recognition of the
importance of regulations affecting services underlines the importance
of minimising non-tariff barriers to trade and should be on the table
in any negotiation. The costs associated with such regulations should
be weighed against the benefits from maintaining some preferential
access to the single market. Negotiating a comprehensive deal is likely
to take time. A temporary agreement, like EEA membership, has the
attraction that it may mitigate the uncertainty among businesses and
would also buy time to work out a permanent settlement.
• Trade and FDI must be considered in tandem. Many of the sectors
where the UK is a strong exporter are also host to high levels of
FDI and are often engaged in global value chains. Barriers to trade
(tariff and non-tariff) could lead firms to relocate activity into the
single market in order to access intermediate goods more cheaply, as
well as sell products more competitively. To counter these forces, an
effective industrial strategy, improving the supply side environment
through infrastructure, skills promotion, investment in science and
coordinating government support for exporters will ensure that the
UK continues to be an attractive location for firms in key sectors.
• Continued strong engagement in international institutions.
To foster constructive internationalism and the context for world
trade at a time when they are under threat, the UK must continue
to engage strongly in international institutions for trade, investment,
aid and public goods.
The UK must preserve its status as a magnet for talented
individuals from around the world. An open approach to newcomers
complements the natural advantages – including language, time zone
and legal system – that make the UK a good place to study, work
or build a business. The combined effect of immigration to date
has been to create a stock of 7.4m working-age migrants, 3.4m of
whom are highly educated. Yet the UK still faces skills shortages. The
Commission proposes that:
• Rather than pursuing a net migration target and limiting the
numbers of visas for skilled workers granted, the UK should
aspire to increase the stock of foreign-born skilled workers.
A stock of foreign-born skilled labour below its current level is likely
to constrain UK growth. After the UK leaves the EU, we will need
to ensure that the new visa system for skilled workers is properly
resourced and operates on a timely basis so as not to discourage
such workers coming to the UK.
• The government should clarify the immigration rights (and right
to remain) of those who will become leading entrepreneurs,
scientists, professionals and skilled practitioners. A dynamic
economy relies on such people, refreshing the talent pool from those
with a range of educational and cultural backgrounds as well as
varied life experiences. At present, government policy is unclear on
this issue which risks doing permanent damage to the economy. It
is particularly important to maintain openness to bona fide students
many of whom, if they stay in the UK after graduation, enhance the
talent pool available to UK businesses.

68
The Bank of England’s main site on Threadneedle Street in London. The Bank was established in 1694.

69
5. Finance and Growth
The UK financial system has been in a process of transition since the financial crisis of 2008. Fundamental reforms of bank regulation, including new capital requirements and the separation of retail and commercial banking from wholesale and investment banking, have made the system safer. The banking sector remains large – with assets 3.6 times annual GDP in 2016 – and an influential sector of the economy. Financial services are an important source of jobs and tax revenues, and a major component of the UK’s services exports, accounting for almost half of the UK’s services trade surplus.
Concerns with the UK financial system predated Brexit. There is longstanding evidence of the system’s shortcomings in financing productive investment and supporting long-term growth. In recent years, the UK has seen the establishment of several new “challenger” banks. These new players together with new forms of intermediation, including crowdfunding, should help in principle to ease financial constraints faced by the corporate sector. However, UK businesses raise relatively little in capital markets and would benefit from diversifying their sources of funding. Further measures to enhance the functioning of equity markets and smaller firms’ access to bond markets are needed.
The EU referendum result means that the UK financial sector will face new challenges. Given the sector’s significance for the UK economy, both as an export industry and an intermediary, Brexit could have wide-ranging implications for employment and growth across the UK.
The UK financial system – a snapshot
The UK has been an important financial hub for centuries and its
prominence in Europe predated the creation of the Single Market.1 The
period before the financial crisis of 2008 saw the financial system balloon
in size. On any measure, the financial system is many multiples of GDP.
Between 1990 and 2016 the assets of the UK banking sector alone
expanded from a multiple of about 2 to 3.6 times annual GDP (Figure 5.1).
1 In the mid-1700s, London overtook Antwerp and Amsterdam as the centre of European finance (Carlos and Neal, 2011).
FIGURE 5.1: ASSETS OF THE BANKING SECTOR
1990
1991
1992
1994
1995
1996
1997
1999
2000
2001
2002
2004
2005
2006
2007
2009
2010
2011
2012
2014
2015
2016
5
4
3
2
1
MU
LTIP
LE O
F A
NN
UA
L G
DP
Notes: Figures include central bank assets. Source: Bank of England, ONS.
The financial sector spans a number of markets, mainly banking, asset
management, and insurance. It plays a major role in employment,
output, and tax revenues in the UK. In the decade before the
financial crisis, measured output growth in the UK financial services
sector averaged over 6% per year, compared with total GDP growth
of 3% per year.2 In 2015 the financial sector employed around
one million people directly. An additional one million people work
in sectors that provide ancillary services, namely legal services,
management consultancy, and accounting services. While those
people are not directly employed by the financial services sector,
their businesses form part of the ecosystem that supports it. The
financial sector is also one of the UK’s leading export industries,
with financial services trade alone accounting for 45% of the UK’s
£95 billion surplus from trade in services. In 2016, key net exports
included financial services (£43bn), business services (£31bn) and
insurance and pension services (£18bn). The EU and the US are
the UK’s top exports destinations for financial services, insurance
and pension services, and other business services.
2 Burgess (2011).

70
The financial crisis of 2008, which brought to light the dangers of
an undercapitalised financial system, started a process of transition.
Fundamental reforms of bank regulation, including the separation,
or ring-fencing, of retail and commercial banking from investment
banking, have made the system safer. New regulations induced
banks to “deleverage” – reducing the ratio of their risk-bearing
assets to their loss-absorbing equity. The capital position of UK
banks has strengthened as a result of public recapitalisation and
asset divestment. The sector has shrunk from its peak at the end of
2008 when its assets stood at 4.7 times annual GDP. It remains large
today – with assets 3.6 times annual GDP in 2016.
The financial sector as an intermediary – bank lending
The key function of the financial sector is to support growth by
providing products that allow households to save, borrow, and
insure themselves against risk. Bank lending is an important part
of this: UK banks lend to other financial institutions, to businesses
and to households. Since the financial crisis all of these forms of
lending have fallen as a share of GDP, with intra-financial lending,
and lending to business falling the most (Figure 5.2).
FIGURE 5.2: LENDING BY UK BANKS
% O
F Q
UA
RTE
RLY
GD
P
1998
1999
2000
2001
2002
2003
2004
2005
2006
2007
2008
2009
2010
2011
2012
2013
2014
2015
300
250
200
150
100
50
BANK LENDING TO PRIVATE NON-FINANCIAL BUSINESSES
BANK LENDING TO OTHER FINANCIAL CORPORATIONS
HOUSEHOLD MORTGAGES
Source: Bank of England and ONS.
FIGURE 5.3: LENDING TO BUSINESS
1997
1998
1999
2001
2002
2003
2004
2005
2006
2007
2008
2009
2010
2011
2012
2013
2014
2015
2016
1,800
1,600
1,400
1,200
1,000
800
600
400
200
0
FINANCIAL SECTOR REAL ESTATE
NON-FINANCIAL, NON REAL ESTATE
£bn
Source: Bank of England, sterling and foreign currency lending by UK-based lenders.
While the supply of credit to UK households has generally been
robust in recent years, there are concerns about the supply
of credit to businesses. Over the past two decades the supply of
credit to financial companies and the real estate sector boomed
then contracted, leaving lending volumes to these sectors roughly
160% above their 1997 level.3 By contrast, lending to non-financial
and non-real estate companies expanded much less over the same
period (by roughly 66%). Lending to the manufacturing sector was
just under £37 billion at the end of Q3 2016, 17% below its 1997
level (Figure 5.3).4
The financial crisis of 2008 hit business lending hard. Evidence
suggests that factors influencing both supply and demand played
a role. Demand was subdued because some businesses reacted to
the economic slowdown of 2008-09 by repaying existing bank debt
(deleveraging) and delayed investment plans in light of economic
uncertainty. Research also suggests that tight credit supply may have
reduced growth in the UK. Firms faced with a contraction in credit
supply experienced a reduction in labour productivity, wages and the
capital intensity of production.5 Surveys of SME managers show that
3 Including finance, insurance and pensions, and auxiliaries.4 Source: Bank of England, Industrial analysis of monetary financial institutions’ lending to UK residents.5 Franklin et al. (2015).

71
SMEs experienced a contraction in credit supply.6 Business lending
in the UK is highly concentrated. The top 6 banks account for 70%
of the stock of lending to UK firms.7 As a consequence, the level
of credit supply by those banks can be an important determinant
of firms’ ability to grow and invest. While credit conditions have
improved in recent years, both for SMEs and large firms, some types
of firm have not benefited, especially small and riskier firms seeking
growth financing – in line with longstanding evidence of the system’s
shortcomings in financing productive investment and supporting
long-term growth.8 Overall, economic evidence suggests that
tight credit supply to companies could be a factor in the UK’s
disappointing growth and productivity performance in recent
years.
Capital markets
Firms in the UK have traditionally been dependent on bank finance. A
recent report by the British Business Bank showed that SMEs, which
make up the vast majority of firms in the UK, raised only £2.4 billion
from equity markets in the first three quarters of 2015, compared
to £53 billion from bank lending.9
Capital markets, in which firms sell their bonds and equity stakes
to investors including pension funds, insurers and individual savers,
are an alternative conduit for funds to be channelled from savers
to borrowers. Bond markets are a particularly important source of
finance in the UK, with an increase in bond-market borrowing by
companies offsetting the post-2008 reduction in corporate lending
in the UK to some extent (Figure 5.4).
6 SME Finance Surveys and SME Finance. See also BIS (2012).7 Bank of England (2015).8 See e.g. Bank of England (2017).9 British Business Bank (2016).
FIGURE 5.4: NET FUNDING RAISED BY UK FIRMS
EQUITY BONDS LOANS
400
350
300
250
200
150
100
50
0
-50
-100
2003
2004
2005
2006
2007
2008
2009
2010
2011
2012
2013
2014
2015
2016
£bn
Notes: Cumulative net funds raised by private non-financial corporations. Source: Bank of England, BankStats.
While bonds made up on average about 40% of total gross capital
issuance by UK businesses between 2003 and 2016, bond markets
are usually only available to large companies. A study covering
around 3,600 UK companies between 1989 and 2011 found that
90% of bond issues are larger than £60 million, and 90% of the
issuers employ over 2,500 staff.10
Equity finance is relatively thin in the UK. Funds raised by UK firms
in recent years have been negative, as companies “buy back” their
own shares and reduce their equity outstanding (Figure 5.4). Such
share buy-backs are a way to return cash to shareholders, and an
alternative to dividends. Gross capital raising in the form of equity is
relatively low too. Of the total capital issued in the UK between 2003
and 2016, just 12.5% on average was equity, with the remainder
being debt, or debt-like instruments.
10 Pattani and Vera (2011).

72
Many economists have noted that the pattern of corporate fundraising
is influenced by the UK tax code. While the tax deductibility of debt in
the UK is relatively generous by international standards, firms’ costs of
equity issuance do not benefit from tax breaks. This generates a “debt
bias” in favour of borrowing via debt rather than equity markets.11
The volume of trading on UK equity markets is a lower fraction of
GDP than in the US (Figure 5.5). Some of this difference may be
due to the sectoral composition of these markets. Highly-traded
technology stocks comprise 21% of the S&P 500 index, but just
above 1% of firms listed on the London Stock Exchange. The relative
lack of equity trading is a puzzle that appears to be growing. Since
the 2008 crash the number of firms listed on an exchange in the UK
has declined sharply year-on-year according to World Federation of
Exchanges data, a pattern not seen in the US.
FIGURE 5.5: TRADING ON EQUITY MARKETS
1975
1977
1979
1981
1983
1985
1987
1989
1991
1993
1995
1997
1999
2001
2003
2005
2007
2009
2011
2013
2015
350
300
250
200
150
100
50
0
UNITED KINGDOM UNITED STATES
% O
F G
DP
Source: World Bank.
11 See, for example, Mirrlees et al. (2011).
Heavy reliance on banks combined with a relative lack of equity
financing and limited access to bond markets for SMEs raise a series
of concerns. Economies in which companies are highly leveraged
are prone to lower investment, and lower growth. Reliance on
debt in the past, and the associated “debt overhang”, has been cited
as one of the potential reasons why global growth remains relatively
sluggish in the aftermath of the crisis.12 The financial crisis induced
a process of deleveraging in the UK, whereby firms retain profits to
repay their debts. Active deleveraging through debt reduction entails
a reduction in assets and hence productive capacity, and possibly
a cutback of investment, with adverse feedback effects on firms’
earnings. The alternative is to increase the corporate equity base.
A higher share of funding through equity would increase resilience
and reduce corporate debt overhang. This would also improve loss
absorbency and could kick-start investment.13 Therefore, it is important
that UK firms achieve a healthy balance of debt and equity.
The UK also needs better equity markets in order to close the gap
in the provision of growth capital for smaller and medium-sized
businesses (SMEs) looking to expand.14 The issue is longstanding
and was discussed in our first report. The lack of growth capital could
help partially explain the dearth of mid-sized businesses in the UK:
firms that employ between 50 and 249 people represent less than
1% of firms and only 12% of employment.15 Some progress has
been made in this area. For example, the Business Growth Fund (BGF)
has invested over £1 billion in more than 160 firms across the UK
since its establishment in 2011.16 The British Business Bank combines
private and public funds to make equity investments in high growth
businesses. However, participants in our evidence session suggested
that significant problems remain. In 2016 HM Treasury announced
“The Patient Capital Review” to identify barriers to access to long-
term finance for growing innovative firms seeking to scale up. This
is a welcome development.
New entrants – challenger banks
Given the longstanding concentration of the UK banking system,
the launch of several new “challenger” banks in recent years
is a welcome development. Research shows that firms’ ability to
substitute among alternatives can shield the real economy from
financial downturns.17
12 Jorda et al. (2013) and Lo and Rogoff (2015).13 Kalemli-Özcan et al. (2015).14 BIS (2009) estimated that a growth capital gap exists between £2m and £10m.15 BIS (2016).16 The BGF was created to make long-term equity investments in growing SMEs. See BGF Portfolio Issue 5 for investments to date.17 De Fiore and Uhlig (2015).

73
The challenger landscape is varied. It includes large players like
Clydesdale, Paragon and Yorkshire Banking Group; foreign entrants
like Handelsbanken; the re-launch of old banks, including TSB.
Established brands including Virgin, Asda, Marks and Spencer and
Sainsbury’s Bank, are increasingly active in the provision of financial
services. Newly established financial technology (FinTech) challengers
include Atom, Fidor Bank, Monzo, and Starling.18
The assets of challenger banks are growing, while those of the Big
Five high street lenders decline. According to a recent report by
KPMG, the lending assets of challenger banks increased by 31.5%
between 2014 and 2015 while those of the Big Five declined by
almost 5%. On average, challenger banks offer better savings rates.
In addition, SME banking is one of the challengers’ targeted niche
markets. They have the potential to help close the funding gap in
this market which is underserved by the Big Five.19
The Brexit shock
Financial markets, including the markets in which bank debt and
equity trade, were volatile following the EU referendum of June 23rd
2016. In the ten days that followed, banks’ equity prices dropped
by an average of 20%, the largest two-week fall since the market
crash of 2008. The share prices of the two state-owned banks, the
Royal Bank of Scotland and Lloyds Banking Group, fell by 37% and
29% respectively (Figure 5.6). Credit default swap (CDS) premia,
a proxy for funding costs, rose for some banks. Trade-weighted
sterling fell by 9%. Since then market turbulence has eased, with
CDS premia falling to their levels before the EU referendum vote.
Bank equity prices have recovered, though the two state-owned
lenders, RBS and Lloyds are still well below the trading levels seen
before the referendum.
With short-term pressure under control, questions turn to the medium
and long-term impact of Brexit. Estimates show a significant impact
is possible. For example, Oliver Wyman estimate that moving to a
third-country status under World Trade Organisation (WTO) rules
would put at risk 40-50% of EU-related financial services activity
(approximately £18-20 billion in revenue) and up to 31-35,000 jobs,
along with around £3-5 billion of annual tax revenues.20 There is a lot
of uncertainty around these medium and long-term repercussions.
However, the UK banking sector – the part of the financial system
that matters most for growth, relies mainly on domestic business
for its revenues.
18 See KPMG (2016).19 Challenger banks issued 32% of the UK’s business mortgages and charges in the first half of 2016 (Burnmark, 2016).20 Oliver Wyman (2016).
FIGURE 5.6: TOP 5 UK BANKS’ EQUITY PRICES IN 2016
JAN
FEB
MA
R
APR
MA
Y
JUN
JUL
AU
G
SEP
OC
T
NO
V
DEC
1.6
1.4
1.2
1.0
0.8
0.6
0.4
0.2
0
BARCLAYS SANTANDERHSBC RBS LLOYDS
Notes: Equity prices rebased to 1 on the day of the referendum vote, 23rd June 2016. Source: Bank of England.
Old Street Shoreditch, nicknamed Silicon Roundabout, has become the centre of Britain’s booming fintech industry.

74
The importance of financial services trade
Overall, the UK runs a large trade deficit, amounting to £39 billion in
2016 (Figure 5.7). But services exports – the sales by UK companies of
a service to overseas residents – are a key strength for the UK. Services
exports generate a persistent surplus, with financial services accounting
for 45% of it. In 2016, key net exports included financial services of
£43 billion, business services of £31 billion and insurance and pension
services of £18 billion.21 Business services include activities such as
accounting, legal advice, and management consulting. These industries
can be seen as “satellites” to the financial sector (among others),
providing services that support financial and business transactions.
21 ONS: Balance of Payments – Release 23 December 2016. Data for 2016 only available up to Q3. Annual estimates are (Q1+Q2+Q3)*(4/3).
FIGURE 5.7: TRADE BALANCE
125
75
25
-25
-75
-125
FINANCIAL SERVICESINSURANCE ANDPENSION SERVICESOTHER BUSINESS SERVICES
FINISHED MANUFACTURING GOODSOTHER GOODSOTHER NON-FINANCIAL SERVICESTOTAL TRADE BALANCE
1991
1992
1993
1994
1995
1996
1997
1998
1999
2000
2001
2002
2003
2004
2005
2006
2007
2008
2009
2010
2011
2012
2014
2015
2016
2013
£bn
Notes: Data for 2016 only available up to Q3. Annual estimates are (Q1+Q2+Q3)*(4/3). Source: ONS: Balance of Payments - 23 Dec 2016 Release.
The UK is more reliant on financial services exports than any other
G7 economy. Financial intermediation, insurance and real estate,
and business services account for roughly 64% of the UK’s total
gross services exports (Figure 5.8).
The importance of the EU in financial services trade
The EU and the US are the UK’s top export destinations for financial
services, insurance and pension services, and other business services
(Table 5.1). The UK exported over £81 billion in services to the EU in
2014, 50% of which were in these three export markets combined.
The EU represents 37% of the UK’s total exports of services, and the
equivalent figure for the US is only 23%.
Traders at the London Metal Exchange, based in London. In 2016 their trade figures exceeded 10 trillion US dollars.

75
FIGURE 5.8: FINANCIAL AND RELATED SERVICES EXPORTS
80
70
60
50
40
30
20
10
0
JAPA
N
ITALY
AUSTRA
LIA
FRANCE
HONG K
ONG
KORE
ACA
NADAGER
MANY
UNITED
STA
TES
SWIT
ZERL
ANDCY
PRUS
UNITED
KIN
GDOM
IREL
AND
LUXEM
BOURG
% O
F TO
TAL
SER
VIC
ES E
XPO
RTS
Source: OECD 2015. Most recent available data: 2011.
The UK is currently a hub for international companies. This is true of
financial institutions but also of non-financial businesses in general.
The UK is home to over 250 foreign banks – more than any other
hub. London hosts more than 40% of the European headquarters
of the world’s largest 250 non-financial companies.22 Moreover,
London is home to 60% of the top non-European companies with
headquarters in Europe – with a strong presence of Asian companies.
The UK currently hosts more headquarters of non-EU firms
than Germany, France, Switzerland and the Netherlands put
together.23 Outside the EU it may be harder to attract internationally
mobile businesses: as an EU-based global financial centre, London
has benefited from a “platform effect” through the EU’s passporting
regime, whereby non-EU financial firms locate in the UK to gain a
foothold in EU markets. London’s status as Europe’s main financial
hub may have made the UK more attractive for foreign non-financial
corporations, too.
22 Its closest rival is Paris hosting just 8% of European headquarters (Deloitte, 2014).23 Deloitte (2014).
TABLE 5.1: UK EXPORTS OF FINANCIAL AND RELATED SERVICES BY DESTINATION (£bn)
EU US World
Insurance & pension 2.5 9.3 20.1
Financial services 20.2 12.4 49.2
Other business services 18.3 14.4 57.1
Total finance & related services 41.0 36.0 126.5
Total services 81.3 50.6 219.8
Source: ONS Pink Book 2015. Latest available data 2014.
Financial services and the UK regions
Financial and related services companies are not based solely
in London. Many have large offices in the UK regions. These
decisions to locate outside London reflect the fact that many UK
regions have financial expertise. Edinburgh and Glasgow are key
centres for asset management, life assurance and banking with
over 148,000 employees in Scotland. Newcastle and Sunderland
are hubs for professional services. The North West hub consisting of
banking, insurance, law and accountancy in and around Manchester
and Liverpool employs 218,800 workers alone.
The South West employs 147,000 people with Bristol and Exeter as
the centres of clusters of insurance and pensions businesses. Of the
two million people employed in financial services and in associated
professional services, The City of London Corporation estimates
that more than half work outside London and the South East.24 This
suggests that any decision to relocate as a result of Brexit would have
implications for employment across the UK and not just for London.
Passporting and financial services trade
Research into the factors that support trade in services shows that the
“gravity model” framework often used to analyse trade in goods is
helpful.25 Trade flows between any two countries are influenced by
their relative sizes and “proximity” (their physical distance but also
economic and cultural proximity, measured by similarities between
political and legal institutions, shared languages and colonial legacies).
The more physically and economically “distant” two trading partners
are, the greater the trade costs. As would be expected, empirical
studies confirm that higher trade costs discourage trade in both
goods and services.26
24 City of London Corporation (2013).25 See e.g. Ebell (2016).26 See Head and Mayer (2014).

76
The major threat for financial services trade is the loss of
passporting rights when the UK leaves the EU. The passporting
regime is the foundation of the EU Single Market for financial
services. It enables financial firms that are authorised in any EU or
EEA (European Economic Area) country to trade freely in any other
member state with minimal additional authorisation. In other words, a
financial firm based in the UK (whether UK-owned or foreign-owned)
has the right to provide a range of financial services anywhere in the
EU/EEA, while being regulated by UK authorities.
Financial services passports cover a range of services, including
traditional banking (such as lending and deposit taking), sales and
trading of securities, and asset management. The basis for passports
is the common adherence to EU Directives, which ensures harmonised
standards for financial regulation and supervision. Passporting rights
do not apply to third-country firms, i.e. firms incorporated outside
the EU/EEA. Once the UK has left the EU and assuming it does not
become a member of the EEA (since this would require free movement
of people), it would become such a “third country”.
There are alternatives to passporting rights but they are costly and
time-consuming. First, UK-based firms can create subsidiaries within
the EU/EEA. Second, some EU legislation provides for third-country
regimes that allow non-EU based firms to obtain a license to offer
services in the EU if their home country regulatory regime is accepted
by the EU as being equivalent to EU standards – that is the so-called
“equivalence” principle. However these licences are not available in
all EU countries, only apply to a limited number of services and are
usually limited to one country at a time, meaning that the UK would
have to negotiate with each individual country separately. They also
provide less certainty, since they can be withdrawn unilaterally if the
EU considers that the other party’s regulatory regime is no longer
sufficiently equivalent to EU law. New research being undertaken by
NIESR and the CEP suggests that free trade agreements are a poor
substitute for Single Market membership. The loss of passporting
rights could entail a reduction of over 25% in the UK’s total financial
services trade.27
27 See Ebell and Roland (2017).
The future of trade in financial services
Emerging markets are both competitors and clients of the UK financial
services industry. Financial centres in emerging markets, particularly
China, are capturing an increasing share of the global profit pool
and are eroding the UK’s leading position in some markets. Since
the financial crisis, Hong Kong has overtaken the UK as an Initial
Public Offering (IPO) hub, and the UK lags behind Hong Kong,
Singapore and the US in terms of offshore debt financing for Chinese
corporates. However, emerging economies remain large importers
of financial and related professional services from the UK, and
there is scope for the UK to strengthen its position as a financial
hub for emerging markets.
London already has a strong position in the trading of emerging-
market financial instruments. For example, it is vying to become the
leading offshore market for renminbi bonds. In 2016 the world’s first
ever rupee- denominated bond issued outside of India by an Indian
company was issued in London. The UK is also a global leader in
foreign-currency clearing, overtaking Singapore as the largest clearing
centre for the renminbi outside of greater China in 2016. Recent
initiatives to increase collaboration between the UK and the financial
sectors of India and China should help support this position.28
Another group of countries, the so-called “frontier economies”
represent a long-term opportunity for countries, like the UK, that
are home to financial hubs. This group includes Kenya, Vietnam,
Bangladesh, Nigeria, Uganda, and Pakistan. Of the 25 countries
forecast to grow the fastest over the next five years, 19 are frontier
economies. Many of them have high demand for funds due to
significant infrastructure financing needs related to the development
of road and rail networks, airports and ports, and power generation.
As these frontier economies issue debt overseas there is a role for
the UK. Ensuring that the UK financial sector has strong links
with this next generation of fast-growing economies is a long-
term priority.
It is important to note that deepening trade links with emerging
markets and frontier economies will imply different challenges than
those faced in the UK’s current relationship with the EU. European
economies are similar to the UK in terms of institutional, legal, and
regulatory frameworks. Differences in those areas, which generate
trade costs for financial transactions, are expected to be higher with
trading partners in emerging markets.
28 Notably the “Chinese Pilot Free Trade Zones” (FTZ) and the “India-UK Financial Partnership” initiatives (IUKFP).

77
The growth of Islamic finance is another opportunity. The UK is already
a strong player in this fast-growing area, which market analysts expect
to be worth $3 trillion by 2018. The UK is the leading Western centre
for Islamic finance with nearly twice as many institutions offering
these services than in the US. The UK was the first Western country
to issue a sovereign Islamic bond (“sukuk”). The UK continues to
distinguish itself by its willingness to create a level playing field for
Islamic institutions. Notably, the Bank of England has plans to put
in place Shari’ah compliant central bank facilities.29
There are also prospects for improved services exports within the EU.
The EU’s single market for services is much less developed than the
market for goods. A recent all-party Parliamentary inquiry noted that
while services account for over 70% of Europe’s output, they account
for only 20% of trade, concluding that “there is no ‘single market
in services’ in any meaningful sense of the term.” Several studies
have found that trade costs are much higher in the services sector
than in goods.30 The factors holding back services trade include the
complexity of national and EU regulation and the diversity of services
which mean that the single services market is hard to “complete”
by defining one single harmonised set of rules. Economic research
confirms this, finding that within the EU there are considerable
differences in services trade costs across member countries.31
There are many plans to build up the EU’s single market for services,
including financial services. A number of initiatives were set out in
the European Commission’s 2015 “Single Market Strategy”. These
include proposals to introduce a “Services Passport” and remove
barriers to the trade of business services. Other initiatives include
the development of the Digital Single Market and plans to create a
Capital Markets Union. An EU digital single market may benefit the
UK FinTech industry if it can access it. The Capital Markets Union
will aim to develop a more diversified financial system (less reliant on
bank financing) and facilitate equity and corporate debt investments
across borders – resulting in a better connection between financing
and investment projects across the EU and more capital market
funding for SMEs.
29 Islamic banks are currently unable to use the Bank’s existing liquidity facilities because interest-based facilities are not deemed Shari’ah compliant.30 See Miroudot et al. (2015) and Sáez and Taglioni (2016).31 See e.g. Miroudot, Sauvage, and Shepherd (2013).
These efforts to complete the EU’s single market for services are
predicted to yield significant gains for the EU’s members.32 While
the UK will not enjoy all the benefits of deeper EU integration
outside the EU, it is likely that improvements in the market for
financial services spill-over to the EU’s trading partners. The
UK could therefore benefit. The extent to which the UK gains will
depend on the pace of EU reforms, and the UK’s ability to negotiate
access to newly integrated markets for services and capital. Finally,
the UK will also benefit indirectly from greater financial stability
within the Eurozone resulting from the Banking Union.
Brexit and the supply of finance
The EU referendum result of June 2016 implies new challenges for
the UK financial system. The transition to a new relationship with
the EU could put a drag on growth either via heightened uncertainty
or the intensification of existing financial constraints.
Uncertainty
Increases in uncertainty are associated with declines in investment.33
Since large investment decisions (for example, building new factories
or buying new equipment) are difficult to unwind, CEOs need to be
relatively confident about their firm’s future path before they commit.
Demand for finance is already subdued. The proportion of SMEs that
are expecting not to seek new funds in the future has increased from
63% in 2012 to 76% in Q2 2016.34 Uncertainty may be playing a
role in this. Decreased investment can in turn reduce future growth
prospects. Economic uncertainty reached record highs in June and July
2016, at the time of the referendum and in its immediate aftermath
(Figure 5.9).35 There was another spike around the time of the High
Court ruling on the Brexit process in November 2016.
32 The potential annual gains from a Digital Single Market are estimated at 3 to 3.6 per cent of EU GDP (Dunne (Ed.), 2015). The Capital Markets Union could facilitate large amounts of additional bank credit to the private sector and SMEs by reviving securitisation (European Commission, 2015).33 See Bloom, Bond, and Van Reenen (2007).34 BDRC Continental (2016).35 Baker, Bloom, and Davis (2015).

78
FIGURE 5.9: POLICY-RELATED ECONOMIC UNCERTAINTY
JAN
200
6
OC
T 20
06
JUL
2007
APR
200
8
JAN
200
9
OC
T 20
09
JUL
2010
APR
201
1
JAN
201
2
OC
T 20
12
JUL
2013
APR
201
4
JAN
201
5
OC
T 20
15
JUL
2016
1200
1000
800
600
400
200
0
UN
CER
TAIN
TY IN
DEX
Notes: The index is based on newspaper articles regarding economic policy uncertainty. Source: Baker et al. (2017).
Studies on the economic implications of political uncertainty suggest
that it can dull growth. Unclear political outcomes can lead to higher
debt-financing costs.36 Equity financing, already limited in the UK,
can also become more expensive, particularly when underlying
economic conditions weaken.37 Other studies show that firms can
pause investment, awaiting the resolution of political uncertainty.38
This suggests there is a risk that political uncertainty surrounding
the Brexit process may compound the negative impact on growth
of economic uncertainty.
While economic uncertainty and policy will affect all types of firms,
it is likely that its implications will be different for large firms and
SMEs. Among others, two important factors will play a role in
determining the severity of the impact on any particular firm: the
financial constraints it faces and its degree of export orientation. A
firm will more likely be affected if it is export oriented and financially
constrained.
36 See e.g. Waisman et al. (2015).37 See e.g. Pastor and Veronesi (2013).38 See e.g. Julio and Yook (2012).
Firms that focus on the domestic market may be somewhat
insulated from uncertainty around the Brexit negotiations, as
their business model does not depend on the shape of the UK’s future
relationship with the EU. As only 9% of SMEs are export oriented
and a further 15% are in the supply chains of other businesses that
export, uncertainty surrounding new trade agreements is likely to
mainly affect larger firms directly. At the same time, any firm using
imported inputs may face cost pressures if import prices rise.39
Threats to bank lending to corporates
SMEs are more likely than large firms to be affected by financial
constraints. Difficulties will be compounded for those that are
growing, or have plans to start serving new export markets. Survey
data around the time of the referendum suggest that during the
referendum campaign, the proportion of SMEs rating either the
current economic climate or political uncertainty as major barriers
increased for larger SMEs and those engaged in international trade.40
These firms are heavily reliant on bank debt and banks dislike the
increased credit risk that goes with heightened uncertainty.
Recent evidence shows that financial frictions faced by firms can
amplify the impact of uncertainty shocks on firms’ investment. This
is because uncertainty induces firms to hoard cash as a precautionary
motive, at the expense of capital investment and labour demand.41
This is a serious concern given that around 60% of the UK labour
force works for micro and small and medium sized firms that are
typically exposed to financial constraints.
Market-based finance for UK companies may also be affected
by the downgrade of the UK’s sovereign rating. Shortly after the
referendum in June 2016, two major rating agencies downgraded the
UK’s rating. The three major agencies warned that more downgrades
could follow and that the most likely trigger for another downgrade
would be the UK’s loss of access to the Single Market. Since sovereign
ratings tend to form a ceiling for the ratings of individual corporates,
companies’ ratings could also fall, and their debt costs rise. Thankfully,
this possibility has not materialised yet with the latest Bank of England
data showing no deterioration in corporate credit conditions.42
39 BIS (2016a).40 BDRC Continental (2016).41 Alfaro, Bloom and Lin (2016).42 Bank of England, Credit Conditions Review Q4 2016.

79
Overseas financing and currency risk
UK companies depend on a range of finance sources from overseas.
This is another area where Brexit may have an impact. At Q2 2016,
UK resident financial corporations had 63% of their debt securities
denominated in foreign currencies (mainly USD and EUR). The share
stood at 38% for UK resident non-financial corporations.43 Liabilities
in foreign currencies create exchange rate risk exposure and the need
to insure against this risk. Large companies on the whole look well
insulated. Many have foreign currency earnings, providing a “natural
hedge”. As sterling has depreciated the equity value of many FTSE
companies has risen, reflecting the increased sterling value of their
foreign currency earnings. Smaller companies involved in import and
export of goods are likely to be less well insulated.
In the absence of a natural hedge, companies can use the foreign
exchange (FX) market to protect (‘hedge’) themselves against
unexpected changes in the exchange rate that affect their returns.
There are a number of instruments for hedging currency risk. A large
proportion of FX market turnover is simply transactions in the spot
market, but UK non-financial corporations also make use of other
instruments, in particular swaps and forward contracts.
Hedging of currency risk by UK corporates rose before the referendum
vote. The survey of over 2,600 companies conducted over four
weeks in March 2016 shows that over half had hedged against FX
exposures, including over a fifth of SMEs, in preparation for currency
fluctuations following a leave vote in the referendum44. Yet many
SMEs may still be exposed to currency risk: survey evidence shows
that small companies are far less likely to hedge against currency
risk than larger ones. Setting a clear path for the UK’s exit from
the EU should help alleviate exchange rate volatility.
43 Bank for International Settlements, Debt Securities Statistics.44 East & Partners (2016).
EU funding and foreign direct investment
The UK economy benefits from a wide range of EU funding
programmes, especially through the European Investment Bank
Group, comprised of the European Investment Bank (EIB) and the
European Investment Fund (EIF), and through the recently established
European Fund for Strategic Investments (EFSI). These schemes target
market failures, particularly the lack of financing for growing SMEs and
large infrastructure projects. The UK is among the largest beneficiaries
of EIF and EFSI funding: over 2011-2015 the EIB invested around
£23.5 billion in the British economy. Some of the EIB’s major projects
in the UK include a £150m loan for the Liverpool port expansion
approved in 2012, a £200 million loan for Oxford University for the
expansion of research and teaching facilities approved in 2015, and
£360 million to support the roll-out of smart meters to reduce energy
use across the UK approved in 2015.
While the EFSI is focussed on large-scale strategic investments (such
as renewable energy, digital infrastructure, transport and R&D),
the EIF has a strong focus on SMEs. The EIF supports SMEs through
three funding channels: private equity and venture capital (VC)
funds, guarantees and securitisation transactions, and microfinance.
Between 2011 and 2015, the EIF committed £2.3 billion to its equity
programmes, £438 million for guarantees and securitisation, and £15
million for microfinance in the UK. Importantly, EIF commitments
mobilise funds from private investors and institutions, so mobilised
funds are a multiple of EIF commitments. Outside the EU it is not
clear whether and to what extent the UK will continue to
benefit from these funds.
The British Business Bank (BBB) could act as a substitute for
these funds. Since EU State Aid rules will no longer apply after
Brexit, there is a potential for the BBB to do more. However, the
BBB remains small and does not mobilise as much additional private
capital as the EIB. Boosting the BBB’s funds will be a priority should
the UK lose access to the EU schemes.
A new infrastructure bank should be established to work closely
with the NIC, in order to reduce and manage risk in the critical early
stages of infrastructure projects. This type of institution was proposed
in the Growth Commission’s first report, and would be still more
valuable should the UK lose access to EIB and other EU funds. It is
also important to ensure that the Green Investment Bank continues
to operate effectively as a development bank.

80
Foreign direct investment (FDI) is another alternative source of
funds. The UK is one of the largest recipients of FDI in the EU,
and the bulk of UK inward FDI has come from EU countries.
Around 26% of UK inward FDI stocks relate to financial services
alone. Outside the EU, firms in the UK might find it more difficult
to raise funds; empirical studies have shown that FDI is supported
by EU membership.45
Competition from EU banks
The UK’s exit from the EU may affect corporate financial conditions
by making it harder for European providers of finance in Britain. The
share of lending to UK private sector residents coming from EU banks
is larger than that coming from US banks and banks from the rest of
the world. Decreased lending activities by EU banks in the UK could
result in weaker competition. This in turn could increase the cost and
decrease the supply of bank finance. Recent research at the OECD
finds that countries that have less restrictive commercial banking
systems have more efficient and competitive credit and insurance
markets.46 However, the magnitude of this kind of supply shock is
likely to be small. UK banks account for the lion’s share of loans
to private sector residents. Most of the UK’s cross-border banking
assets and liabilities are with other banks and non-bank financial
institutions, as opposed to non-financial firms.
While the EU is clearly important to the UK, it is important to
note that the UK is vital to the EU financial system too. At the
end of 2016, 98 companies incorporated in the EU were listed on
the London Stock Exchange, with a market capitalisation of £424
billion. Furthermore, it is unclear whether businesses that decide to
leave the UK would relocate to EU financial centres, such as Paris
or Frankfurt, or to global financial hubs, such as New York, Hong
Kong, and Singapore. Should businesses relocate outside the EU,
this would have negative consequences for the European Union as
a whole, not just the UK.
45 Dhingra et al. (2016b).46 Nordås and Rouzet (2015).
Policy recommendations
The Commission’s evidence gathering and submissions suggest that
growth supporting measures include ensuring access to EU markets,
building new links with emerging markets, widening small firms’
access to capital markets and encouraging long-term investment
(“patient capital”).
Ensure access to EU markets by developing a substitute for the
financial services passport. The government should ensure access
for UK services firms, including financial and business services. The
loss of passporting rights is a threat to UK financial services across
the country and some institutions have already warned of job losses
and relocation of business out of the UK. Existing models of access,
including that followed by the Swiss, come with concessions, both
on contributions to the EU budget and the free movement of people
and may be hard for the UK to secure. Nevertheless, it is key to
secure access rights that are as close as possible to those granted
by passports.
It is therefore likely that harmonised rules and regulations will be
required in any deal with the EU. Since negotiations may be a lengthy
process, a transitional agreement may help mitigate uncertainty
among businesses.
Strengthen existing links with fast-growing economies, and
forge new ones. Build new links with non-EU global financial
centres, especially in fast-growing emerging markets such as China,
India and Korea, and get a foothold in frontier economies, such as
Nigeria and Kenya. The UK already has a strong position as a hub for
emerging market finance, with particularly strong links with China and
India. Emerging markets remain large importers of financial services
and their process of financial deepening is in its infancy. Chinese
financial markets are gradually opening up and the UK can play an
important role in this process. Therefore, the Financial Services Trade
and Investment Board (FSTIB) should continue to aim to strengthen
the UK’s position as the centre of emerging market finance.

81
Widen access to bond markets. The British Business Bank (BBB)
could play a key role in creating a corporate bond market for SMEs,
including efforts to kick-start SME loan securitisation along the
lines of its ENABLE Funding programme for asset-based financing.47
Boost equity tax relief schemes for investors in growing small
and mid-sized companies. Outside of the EU, the Equity Investment
Scheme (EIS) and the Seed Equity Investment Scheme (SEIS) could be
expanded since they would no longer be subject to EU regulations
on State Aid.
Improve the provision of patient capital. The new “Patient Capital
review” led by the Treasury is a welcome development. It should
explore how corporate governance requirements, including reporting
and investor engagement, should be designed to create incentives
for long-term equity investment.48 It should also explore how large
institutional investors, such as pension funds and life insurers, could
play a stronger role in supplying long-term finance for growing
innovative firms. Institutional investors are “natural” long-term
investors due to the often long-term nature of their liabilities. Finally,
the BBB should scale up its current activities to mobilise long-term
funding from the private sector.
Support challenger banks. The UK’s new breed of challenger banks
are well placed to make the UK banking market more competitive
and innovative. Their development could be supported by utilising
flexibility on capital requirements for smaller lenders that will now
be possible outside the EU.
Support the FinTech sector. Along with steps on visas for high-
skilled workers set out in previous chapters the government should
develop initiatives to boost investment in this sector, including giving
FinTech investors clear and enhanced access to tax relief schemes,
such as the Equity Investment Scheme (EIS) and the Seed Equity
Investment Scheme (SEIS).
47 Launched in 2014, ENABLE Funding is a programme aimed at pooling and securitising the asset finance receivables of smaller UK businesses. The programme is still in the pooling stage where receivables from various originators are being warehoused. Once a critical mass has been reached the BBB plans to securitise the aggregated pools of receivables by issuing asset backed securities or other forms of debt to institutional investors.48 Kay (2012).
Strengthen the British Business Bank. Where market failures
exist, expand the role of the BBB using flexibilities not possible under
EU rules. This added flexibility could give the BBB a pivotal role in
supporting the UK’s Industrial Strategy.
A new infrastructure bank. This should be created to improve the
financing of infrastructure projects. It is also crucial to preserve the
strengths of the highly successful Green Investment Bank.
Some of these steps are easier than others. Together, they should
ensure that the UK financial system contributes to growth across
the UK. One risk is the temptation to improve the UK’s short-term
competitiveness as a financial hub by eroding regulatory quality, at
the cost of lower financial systemic stability in the long-term. So while
leaving the EU provides some flexibility, the UK must continue to
play a leading role in the international groups that have a financial
stability remit, including the IMF and the FSB.49 Outside the EU
the UK must be true to its history and compete on the quality
of its financial sector, not on the laxity of its financial stability
requirements.
49 See e.g. HM Government (2014).

82
References
Alfaro, I., Bloom, N., and Lin, X. (2016), “The Finance-Uncertainty
Multiplier,” Stanford Mimeo.
Arrowsmith, M., Griffiths, M., Franklin, J. Wohlmann, E., Young,
G., & Gregory, D. (2013), "SME forbearance and its implications
for monetary and financial stability," Bank of England Quarterly
Bulletin, 2013 Q4.
Atkinson, A., Gregg, P. and McConnell, B. (2006), “The result of 11
plus selection: An investigation into opportunities and outcomes for
pupils in selective LEAs,” Centre for Market and Public Organisation
Working Paper. (No. 06/150). Department of Economics, University
of Bristol, UK.
Baker, R., Bloom, N., and Davis, S. (2015), “Measuring Economic
Policy Uncertainty,” National Bureau of Economic Research
Working Paper. No. 21633.
Bandiera, O. and Valero, A. (2016), “Family Policies, the Allocation
of Talent, Productivity and Growth,” mimeo, STICERD, LSE
Bank of England (2015), “Trends in lending, April 2015.”
Bank of England (2017), “Credit Conditions Review 2016 Q4.”
Barnett, A., Batten, S., Chiu, A., Franklin, J., and Sebastia-Barriel, M.
(2014), “The UK productivity puzzle,” Bank of England Quarterly
Bulletin 2014 Q2.
Battiston, D., R. Dickens, A. Manning and Wadsworth, J. (2013)
“Immigration and the Access to Social Housing in the UK,” CEP
Discussion Paper. No. 1264.
BBC (2013), “The Economic Value of the BBC: 2011/12,” London:
British Broadcasting Corporation.
BBC (2015) "The BBC's role in the creative economy" – BBC Blog.
BDRC Continental (2016), “SME Finance Monitor Q2 2016.”
Bell, B., Fasani, F. and Machin, S. (2013), "Crime and Immigration:
Evidence from Large Immigrant Waves," Review of Economics and
Statistics 95(4): 1278-90.
Bell, B. and Machin, S. (2016a), “Minimum Wages and Firm Value,”
Journal of Labor Economics, Forthcoming.
Bell, B. and Machin, S. (2016b), “Brexit and wage inequality,”
in Brexit Beckons: Thinking ahead by leading economists, ed. R
Baldwin.
BIS (2009), “Rowlands Review: The Provision of Growth Capital to
UK Small and Medium Sized Enterprises,” November.
BIS (2012), “SME Access to External Finance,” BIS Economics Paper
No.16, Department for Business, Energy and Industrial Strategy.
BIS (2014), “Innovation, Research and Growth- Innovation Report
2014,” Department for Business, Innovation and Skills.
BIS (2016a), “BIS Estimate of the Proportion of UK SMEs in the
Supply Chain of Exporters,” Methodology note, Department for
Business, Energy and Industrial Strategy.
BIS (2016b), “Business Population Estimates for the UK and Regions
2016,” Department for Business, Energy and Industrial Strategy.
Bloom, N., Bond, S., Van Reenen, J. (2007) “Uncertainty and
Investment Dynamics,” Review of Economic Studies, vol. 74(2),
pages 391-415.
Bloom, N., Lemos, R., Sadun, R., Scur, D. and Van Reenen, J. (2014),
“The new empirical economics of management”, CEP Occasional
Paper. No. 41. London School of Economics.
Bloom, N., Sadun, R., and Van Reenen, J. (2012), “Americans do
IT better: US multinationals and the productivity miracle,” The
American Economic Review, 102(1), 167-201.
Bloom, N., Sadun, R., and Van Reenen, J., (2016), “Management
as a Technology”, National Bureau of Economic Research Working
Paper. No. 22327.
Blundell, R., Dias, M.C., Meghir, C. and Van Reenen, J. (2004),
“Evaluating the employment impact of a mandatory job search
program,” Journal of the European economic association, 2(4),
569-606.
British Business Bank (2016), “Small business finance markets.”
Bruno, R., Campos, N., Estrin, S. and Tian, M. (2016), “Gravitating
towards Europe: An Econometric Analysis of the FDI Effects of
EU Membership,” mimeo, Technical Appendix to Dhingra et al.
(2016b).
Bukowski, P., Dustmann, C., L. Katz and Machin, S. (2016), “Notes
on Wage and Productivity Growth,” ongoing project.
Burgess, S. (2011), “Measuring financial sector output and its
contribution to UK GDP,” Bank of England Quarterly Bulletin 2011
Q3.

83
Burnmark (2016), “Burnmark Report: Challenger Banking.”
Carlos, Ann M. and Neal, N. (2011), “Amsterdam and London
as financial centres in the eighteenth century,” Financial History
Review, 18 (1). pp. 21-46.
Castle, J. and Hendry D. (2014), “The Real Wage–Productivity
Nexus,” VoxEU, URL: http://voxeu.org/article/real-wage-
productivity-nexus
CBI (2015), “Business priorities for growing UK exports,” CBI
Exports Briefing 2015, London: Confederation of British Industry.
CBI (2016), “The Right Combination: CBI/Pearson Education and
Skills Survey 2016,” London: Confederation of British Industry.
CER (2016) “The Economic Consequences of Leaving the EU,”
London: Centre for European Reform.
Chaney, T. (2016), “Liquidity Constrained Exporters,” Journal of
Economic Dynamics and Control Volume 72, November 2016,
141–154.
Chang, H. and Adreoni, A. (2014), “Rebuilding the UK industrial
base,” In: Umunna, Chuka, (ed.), “Owning the Future. How Britain
can make it in a fast-changing world,” London: Policy Network,
pp. 103-112
Chang, H., Andreoni, A. and Kuan, M. (2013), “International
industrial policy experiences and the Lessons for the UK”, Future
of Manufacturing Project: Evidence Paper 4, Government Office
for Science.
City of London Corporation (2013), “City of London: An
indispensable industry: Financial Services in the UK.”
CMA (2016), “Retail banking market investigation”, 9 August
2016
Corrado, C., Haskel, J., Jona-Lasinio, C., and Iommi, M. (2012),
“Intangible Capital and Growth in Advanced Economies:
Measurement Methods and Comparative Results,” IZA DP No.
6733, July 2012.
Corry, D., Valero, A. and Van Reenen, J. (2011), “UK Economic
Performance Since 1997: Growth, Productivity and Jobs”, CEP
Special Paper. No. 24.
Costa, R. N. Datta and S. Machin (2017) A Factsheet on R&D and
Human Capital Tax Credits, mimeo, CEP, LSE.
Crafts, N. (2012), “British relative economic decline revisited: the
role of competition,” Explorations in Economic History, 49(1), 17-
29.
Crafts, N. and Hughes, A. (2013), “Industrial Policy for the Medium
to Long-Term”, CAGE Working Paper Series. No 179.
De Fiore, Fiorella and Uhlig, H. (2015) “Corporate Debt Structure
and the Financial Crisis.” Journal of Money, Credit and Banking,
Vol. 47, No. 8.
De Giorgi, G. (2008), “Long-Term Effects of a Mandatory Multistage
Program: The New Deal for Young People in the UK,” Institute for
Fiscal Studies Working Paper. No. WP05/08.
Dechezlepretre, A., Martin, R., Mohnen, M. (2013), “Knowledge
spillovers from clean and dirty technologies: A patent citation
analysis,” Centre for Climate Change Economics and Policy
Working Paper. No. 151.
Deloitte (2014), “London Futures – London crowned business
capital of Europe.”
Dhingra, S., Ottaviano, G., Sampson, T. and Van Reenen, J. (2016a),
“The consequences of Brexit for UK trade and living standards,”
CEP Brexit paper. No. 2. London School of Economics.
Dhingra, S., Ottaviano, G., Sampson, T. and Van Reenen, J. (2016b),
“The impact of Brexit on foreign investment in the UK,” CEP Brexit
paper. No. 3. London School of Economics.
Dowling Review (2015), “The Dowling Review of Business-
University Collaborations.” London: Department of Business
Innovation and Skills
Draca, M. (2013) “Reagan’s innovation dividend? Technological
impacts of the 1980s US defense build-up,” CAGE Online Working
Paper Series. No.168.
Dunne, J. (Ed.) (2015), “Mapping the Cost of Non-Europe, 2014-
2019,” European Parliamentary Research Service, European
Parliament.
Dustmann, C., and Frattini, T. (2014), “The fiscal effects of
immigration to the UK,” The Economic Journal, 124(580),
F593-F643.
Dustmann, C., Frattini, T., and Preston, I. P. (2013), “The effect
of immigration along the distribution of wages,” The Review of
Economic Studies, 80(1), 145-173.

84
Dynarski, S.M. (1999), “Does aid matter? Measuring the effect
of student aid on college attendance and completion,” National
Bureau of Economic Research Working Paper. No. 7422.
East and Partners Europe (2016), “Half Of UK Companies fear EU
‘Leave Vote’,” Media Release.
Ebell, M. and Roland, I. (2017), “The impact of Brexit on the UK’s
trade in services and financial services”, mimeo.
Elsevier (2013), “International Comparative Performance of the
UK Research Base-2013”, report prepared for Department for
Business, Innovation and Skills.
European Commission (2015), “Action Plan on Building a Capital
Markets Union,” COM (2015) 468 final.
Eyles, A. and Machin, S. (2015), “The Introduction of Academy
Schools to England’s Education,” CEP Discussion Paper. No. 1368.
London School of Economics.
Eyles, A., Machin, S. and McNally, S. (2016), “Primary academies in
England,” Centre Piece. No. 490. Centre for Economic Performance,
London School of Economics.
Fishback, P. V. (2007), “Seeking Security in the Postwar Era.” In P.
V. Fishback et al. (eds.) Government and the American Economy: A
New History. University of Chicago Press.
Franklin, J., Rostom, M. and Thwaites, G. (2015), “The banks that
said no: banking relationships, credit supply and productivity in the
United Kingdom,” Bank of England Working Paper. No.557.
Gardiner, B., Martin, R., Sunley, P, and Tyler, P. (2013), “Spatially
unbalanced growth in the British economy” Journal of Economic
Geography, 13(6), 889-928.
Garicano, L., C Lelarge and Van Reenen, J. (2012), “Firm Size
Distortions and the Productivity Distribution: Evidence from France”
CEP Discussion Paper. No.1128, London School of Economics.
Geay, C., McNally, S., and Telhaj, S. (2013), “Non-native Speakers
of English in the Classroom: What Are the Effects on Pupil
Performance?” The Economic Journal, 123(570), F281-F307.
Gennaioli, N., La Porta, R., Lopez de Silanes, F. and, Shleifer, A.
(2013), “Human Capital and Regional Development,” Quarterly
Journal of Economics, 128(1) 105-164
Giuntella, O., Nicodemo, C., and Vargas-Silva, C. (2015), “The
effects of immigration on NHS waiting times,” IZA Discussion
Paper. No. 9351.
Goodridge P., Haskel J.l, Wallis G. (2016), “UK Intangible Investment
and Growth”, research commissioned by the Intellectual Property
Office.
Goodridge, P., Haskel, J., Hughes, A., and Wallis, G. (2015),
“The contribution of public and private R&D to UK productivity
growth,” Imperial College Business School Working Paper,
(2015/03).
Grabas, C., and Nützenadel, A. (2013), “Industrial Policies in Europe
in Historical Perspective,” WWWforEurope Working Paper. No 15.
Hall, P., and Soskice, D. (Eds) (2001), “Varieties of Capitalism: The
institutional foundations of comparative advantage”, OUP Oxford
2001
Harrison, A., and Rodriguez-Clare, A. (2009) “Trade, Foreign
Investment, and Industrial Policy for Developing Countries,”
National Bureau Economics Research Working Paper. No. 15621.
Haskel, J. E., Pereira, S. C., and Slaughter, M. J. (2007), “Does
inward foreign direct investment boost the productivity of domestic
firms?,” The review of economics and statistics, 89(3), 482-496.
Haskel, J., and Wallis, G. (2013), “Public support for innovation,
intangible investment and productivity growth in the UK market
sector,” Economics Letters, 119(2), 195–198.
Hauser, H. (2014), “Review of the Catapult network
Recommendations on the future shape, scope and ambition of
the programme,” London: Department of Business Innovation and
Skills.
Hausman, N. (2012), “University Innovation, Local Economic
Growth, and Entrepreneurship”, US Census Bureau Center for
Economic Studies Paper. No. CES-WP- 12-10.
Head, K. and Mayer, T. (2014), “Gravity equations: workhorse,
toolkit, and cookbook,” chapter 3 in Gopinath, G., Helpman, E.
and Rogoff, K. (eds), Handbook of International Economics, vol. 4,
Elsevier, pp. 131–95.
Head, K. and T. Mayer (2015), “Brands in Motion: How Frictions
Shape Multinational Production,” UBC Working Paper.
Hendra, R., Ray, K., Vegeris, S., Hevenstone, D., Hudson, M., (2011),
“Employment Retention and Advancement (ERA) Demonstration:
Delivery, Take-Up, and Outcomes of In-Work Training Support for
Lone Parents,” Department for Work and Pensions, London.

85
HM Government (2014), “Review of the Balance of Competences
between the United Kingdom and the European Union, The Single
Market: Financial Services and the Free Movement of Capital.”
House of Commons (2014), “Statistics on migrants and benefits,”
House of Commons Briefing Paper. No. CBP 7445
IFS (2015), “English schools will feel the pinch over the next five
years,” Institute for Fiscal Studies, 21 October 2015
IFS (2016), “Long-Run Trends in School Spending in England,”
Institute for Fiscal Studies, 15 April 2016
Jordà, Ò., Schularick, M., and Taylor, A. M. (2013), “When credit
bites back,” Journal of Money, Credit and Banking, 45(s2), 3-28.
Julio, B., and Yook, Y. (2012), “Political uncertainty and corporate
investment cycles,” The Journal of Finance, 67(1), 45-83.
Kalemli-Özcan, Ş., Laeven, L., Moreno, D. (2015), “Debt Overhang,
Rollover Risk and Investment in Europe,” mimeo.
Kantor, S., Whalley, A. (2014), “Knowledge spillovers from research
universities: evidence from endowment value shocks”, Review of
Economics and Statistics, 96 (1) (2014), pp. 171–188.
Karabarbounis, L. and Neiman, B. (2014), “The Global Decline of
the Labor Share,” Quarterly Journal of Economics, 129, 61-103.
Katz, L. and Krueger, A. (2016), “The Rise and Nature of Alternative
Work Arrangements in the United States, 1995-2015,” National
Bureau of Economic Research Working Paper. No. 22667.
Kay, J. (2012), “The Kay Review of UK Equity Markets and Long-
term Decision Making, Final Report,” Department for Business,
Energy and Industrial Strategy.
KPMG (2016), “A new landscape – Challenger banking annual
results.”
Langella, M. and Manning, A. (2016), “Who Voted Leave?” Centre
Piece. No. 490. Centre for Economic Performance, London School
of Economics.
Lazonick, W. and Prencipe, A. (2005), “Dynamic Capabilities and
Sustained Innovation: Strategic Control and Financial Commitment
at Rolls-Royce plc”, Industrial and Corporate Change, 14(3), 501-
542.
Lo, S. H., and Rogoff, K. (2015), “Secular stagnation, debt
overhang and other rationales for sluggish growth, six years on,”
BIS Working Paper No. 482.
Low Pay Commission (2016), “National Minimum Wage,” Low Pay
Commission Report, Autumn 2016,
Machin, S. (2011), “Changes in UK Wage Inequality Over the Last
Forty Years,” in Gregg, P. and Wadsworth, J. (eds.) The Labour
Market in Winter – The State of Working Britain, Oxford University
Press.
Machin, S. and Murphy, R. (2014), “Paying out and Crowding out?
The Globalisation of Higher Education”. CEP Discussion Paper. No.
1299. London School of Economics.
Manacorda, M., A. Manning and Wadsworth, J. (2011), “The
Impact of Immigration on the Structure of Male Wages: Theory
and Evidence from Britain,” Journal of the European Economic
Association 10: 120-51.
Manova, K. (2013), “Credit Constraints, Heterogeneous Firms, and
International Trade,” The Review of Economic Studies 80, 711-744.
Manyika, J., S. Lund, J. Bughin, K. Robinson, J. Mischke and
Mahajan, D. (2012), “Independent Work: Choice, Necessity and
the Gig Economy,” Mckinsey Global Institute Report.
Mas, A. and Pallais, A. (2016), “Valuing Alternative Work
Arrangements,” National Bureau of Economic Research Working
Paper. No. 22708.
Mazzucato, M (2015), The Entrepreneurial State: Debunking Public
V Private Sector Myths, Anthenm Press: London.
McKinsey. (2016), “Bridging Global Infrastructure Gaps,” McKinsey
Global Institute.
Miroudot, S., Sauvage, J., and Shepherd, B. (2013), “Measuring the
cost of international trade in services,” World Trade Review, 12(04),
719-735.
Mirrlees, J., Adam, S., Besley, T., Blundell, R., Bond, S., Chote, R.,
Gammie, M., Johnson, P., Myles, G., and Poterba, J. (2011), “Tax By
Design: The Mirrlees Review,” Institute for Fiscal Studies, Oxford:
Oxford University Press.
Moretti, E, Steinwender, C. and Van Reenen, J. (2014), “The
Intellectual Spoils of War? Defense R&D, Productivity and
Spillovers,” mimeo.
Moretti, E., (2004), “Estimating the social return to higher
education: evidence from longitudinal and repeated cross-sectional
data,” Journal of Econometrics, Elsevier, vol. 121(1-2), pages 175-
212

86
NAO (2016), “Financial sustainability of schools”, 14 December
2016
Nickell, S. and J. Saleheen (2015), “The Impact of Immigration
on Occupational Wages: Evidence from Britain,” Bank of England
Staff Working paper. No. 574
Nordås, H. and Rouzet, D. (2015), “The Impact of Services Trade
Restrictiveness on Trade Flows: First Estimates,” OECD Trade Policy
Papers, No. 178, OECD Publishing, Paris.
OECD (2012), “Industrial Policy and Territory Development: Lessons
from Korea,” Paris: OECD.
OECD (2014), Connecting People with Jobs: Activation Policies in
the United Kingdom, OECD: Paris.
OECD (2016), “OECD Factbook 2016: Economic, Environmental
and Social Statistics.” OECD: Paris
Ofcom (2016), “PSB Annual Research Report 2016: PSB output and
spend,” London: Office of Communications.
Oliver Wyman (2016), “The impact of the UK’s exit from the EU
on the UK-based financial services sector,” Commissioned by
TheCityUK.
ONS (2014a), “Annual Business Survey, Exporters and Importers in
Great Britain,” London: Office of National Statistics.
ONS (2014b), “Analysis of Employee Contracts that do not
Guarantee a Minimum Number of Hours,” London: Office of
National Statistics.
ONS (2016a), “Migration Statistics Quarterly Review: December
2016,” London: Office of National Statistics.
ONS (2017a), “Management practices and productivity among
manufacturing businesses in Great Britain: Experimental estimates
for 2015,” London: Office of National Statistics.
ONS (2017b), “Regional firm-level productivity analysis for the non-
financial business economy,” London: Office for National Statistics
Pástor, Ľ., and Veronesi, P. (2013), “Political uncertainty and risk
premia,” Journal of Financial Economics, 110(3), 520-545.
Pattani, A. and Vera, G. (2011), “Going public: UK companies’ use
of capital markets,” Bank of England Quarterly Bulletin, 2011 Q4.
Pessoa, J. and Van Reenen, J. (2013), “Wage Growth and
Productivity Growth: The Myth and Reality of ‘Decoupling,” CEP
Discussion Paper. No. 1246. London School of Economics.
Resolution Foundation (2016), “Brexit vote requires migrant-reliant
firms to rethink business models,” Resolution Foundation Press
Release, July 2016.
Reynolds Porter Chamberlain LLP (2016), “Working Practices
Report: Prepared for the Board of Sports Direct International plc.”
Riley, R. and Young, G. (2001), “Does Welfare-to-Work Policy
Increase Employment? Evidence From the UK New Deal for Young
People,” National Institute of Economic and Social Research,
London.
Rosenberg, N. (2000), “Schumpeter and the Endogeneity of
Technology: Some American Perspectives,” London: Routledge.
Rutten, D. (2014), “The Energiewende and Germany’s Industrial
Policy,” Clingendael International Energy Programme paper.
Spencer, T., Colebrook, C., Hatfield, I. Doyle, P. (2016), “Boosting
Britain’s Low Wage Sectors: A Strategy for Productivity, Innovation
and Growth,” IPPR.
Stern, N. (2016), “Building on Success and Learning from
Experience, An Independent Review of the Research Excellence
Framework”, July 2016
Summers, L. (2016), “The Age of Secular Stagnation: What it is and
what to do about it”, Foreign Affairs, February 2016
Taylor, C., Jowett, A., and Hardie, M. (2014), “An examination
of falling real wages, 2010–2013,” Office for National Statistics,
London.
Upwork and Freelancers Union (2016), “Freelancing in America:
2016,” Annual Report.
Vignoles, A. (2016), “What is the economic value of literacy and
numeracy?” IZA World of Labor.
Wadsworth, J. (2013), “Mustn’t grumble: immigration, health and
health service use in the UK and Germany,” Fiscal Studies, 34(1),
55-82.
Waisman, M., Ye, P., and Zhu, Y. (2015), “The effect of political
uncertainty on the cost of corporate debt,” Journal of Financial
Stability, 16, 106-117.
Wolf, A. (2011), “Review of Vocational Education – The Wolf
Report”, Department for Education. London.

87
Notes

88
Notes

89
Design: LSE Design Unit
The information in this brochure can be made available in alternative formats, on request.
Please contact: +44 (0)20 7955 7673
Email: [email protected]
The London School of Economics and Political Science is a School of the University of London. It is a charity and is incorporated in England as a company limited by guarantee under the Companies Acts (Reg No 70527).
Freedom of thought and expression is essential to the pursuit, advancement and dissemination of knowledge. LSE seeks to ensure that intellectual freedom and freedom of expression within the law is secured for all our members and those we
invite to the School.
Printed on recycled stock

90
LSE Growth Commission
The London School of Economics and Political Science Houghton Street London WC2A 2AE
Tel: +44 (0)20 7955 7673
Copyright © 2017 Centre for Economic Performance at the London School of Economics and Political Science
ISBN number: 978-1-5272-0690-8
lse.ac.uk/growthcommission