uk energy from waste statistics 2016 - tolvik consulting · uk energy from waste statistics - 2016...
TRANSCRIPT

UK Energy from Waste
Statistics – 2016
June 2017

UK Energy from Waste Statistics - 2016
P a g e | 2
INTRODUCTION
This report brings together data on the UK Energy from Waste (“EfW”) sector from a range of sources
into a single document. The objective is that, over time, “UK Energy from Waste Statistics” will become
a consistent and reliable source of data on the sector and of benefit to industry, investors, students
and policymakers.
The focus of this report is upon those EfW facilities generating energy from the combustion of Residual
Waste during 2016. Residual Waste is defined as non-hazardous, solid, combustible mixed waste
which remains after recycling activities. This definition is broader than that for Municipal Waste and
includes Refuse Derived Fuel (“RDF”) as well as unprocessed waste. Inputs comprise primarily of
wastes falling within European Waste Catalogue (“EWC”) 191210, 191212 and 200301.
The report excludes EfW facilities in Jersey and the Isle of Man, cement kilns and facilities solely
processing Waste Wood or other biomass wastes.
Whilst much of the information in the report has been sourced from the public domain, commercially
sensitive information has also been incorporated into the report and where this data has been utilised
it has been aggregated so as to maintain confidentiality.
This report is available either in printed format or can be downloaded via www.tolvik.com free of
charge. Subject to identification of this report as the source, third parties are entitled to use the
contents of the report.
CONTENTS
1. MARKET OVERVIEW ............................................................................................................. 3
2. WASTE INPUTS ..................................................................................................................... 4
3. ENERGY ................................................................................................................................. 6
4. OPERATIONS ......................................................................................................................... 8
5. GATE FEES .......................................................................................................................... 11
6. MARKET DEVELOPMENTS ................................................................................................. 13
7. INTERNATIONAL BENCHMARKS ........................................................................................ 15
APPENDIX 1: EfWs INCLUDED IN THE REPORT ......................................................................... 16
APPENDIX 2: DATA SOURCES .................................................................................................... 18
APPENDIX 3: GLOSSARY ............................................................................................................. 19
Front Cover Image: Leeds EfW, fully operational 2016 Courtesy: Veolia
UK Energy from Waste Statistics - 2016
P a g e | 3
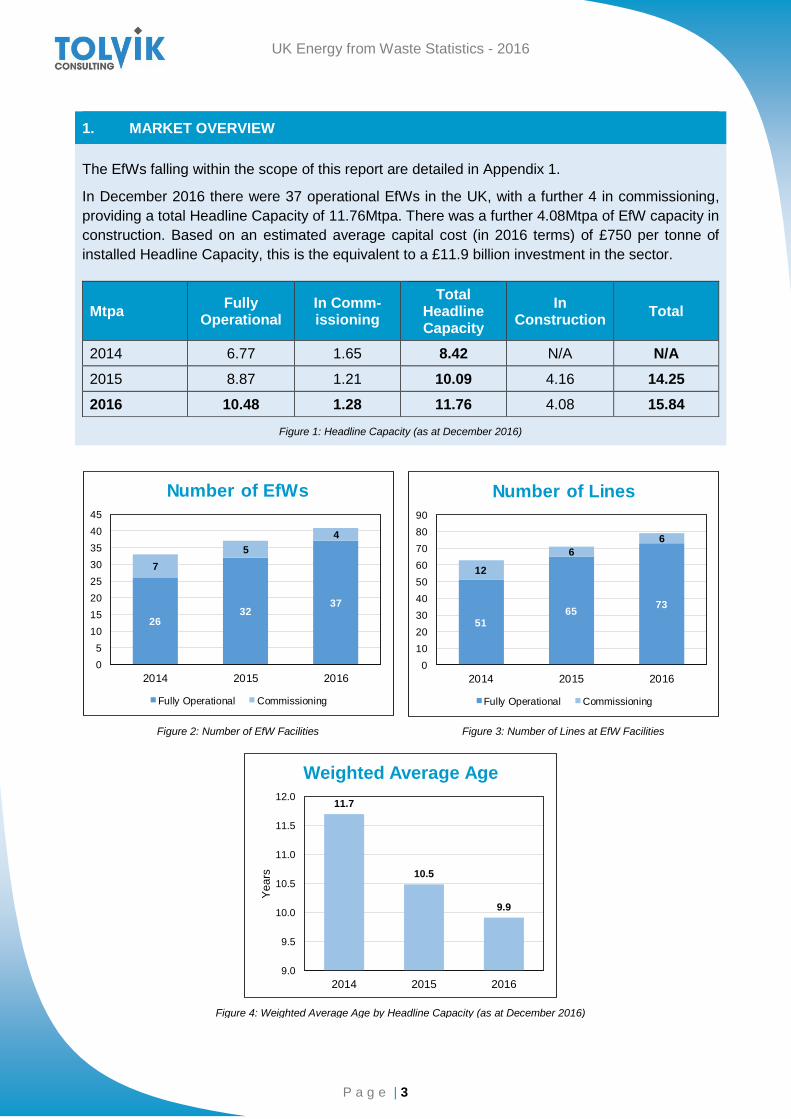
1. MARKET OVERVIEW
The EfWs falling within the scope of this report are detailed in Appendix 1.
In December 2016 there were 37 operational EfWs in the UK, with a further 4 in commissioning,
providing a total Headline Capacity of 11.76Mtpa. There was a further 4.08Mtpa of EfW capacity in
construction. Based on an estimated average capital cost (in 2016 terms) of £750 per tonne of
installed Headline Capacity, this is the equivalent to a £11.9 billion investment in the sector.
Mtpa Fully
Operational In Comm-issioning
Total Headline Capacity
In Construction
Total
2014 6.77 1.65 8.42 N/A N/A
2015 8.87 1.21 10.09 4.16 14.25
2016 10.48 1.28 11.76 4.08 15.84
Figure 1: Headline Capacity (as at December 2016)
Figure 2: Number of EfW Facilities Figure 3: Number of Lines at EfW Facilities
Figure 4: Weighted Average Age by Headline Capacity (as at December 2016)
2632
37
7
5
4
0
5
10
15
20
25
30
35
40
45
2014 2015 2016
Number of EfWs
Fully Operational Commissioning
5165
73
12
6
6
0
10
20
30
40
50
60
70
80
90
2014 2015 2016
Number of Lines
Fully Operational Commissioning
11.7
10.5
9.9
9.0
9.5
10.0
10.5
11.0
11.5
12.0
2014 2015 2016
Ye
ars
Weighted Average Age

UK Energy from Waste Statistics - 2016
P a g e | 4
2. WASTE INPUTS
In 2016 a total of 9.96Mt of Residual Waste was processed in UK EfWs, an increase of 18% on the
2015 figure. These inputs were the equivalent, for EfWs operational throughout the year, of 92.7%
of the Headline Capacity.
Figure 5: Annual EfW Inputs
Mt Input
Tonnage
Inputs as % of Headline
Capacity
2014 6.72 88.2%
2015 8.45 89.0%
2016 9.96 92.7%
Figure 6: Total Tonnage of waste accepted at EfWs in 2006-2016 Source: Annual Performance Reviews (1)
The Role of EfW in the UK Residual Waste Market
It is estimated that the 2016 inputs to EfWs represented 35.4% (2015: 30.7%) of the overall UK
Residual Waste market. Significantly, for the first time, in 2016 the proportion of Residual Waste going
to landfill (at 48.5%) fell below 50%.
Figure 7: Development of the UK Residual Waste Treatment; 2016 Provisional Source: Tolvik Analysis
EfW Inputs by Waste Source and Type
Based on a detailed review of Wastedataflow(2) for 2015/16, it is estimated that 85.1% of all EfW inputs
are derived from Residual Local Authority Collected Waste (“LACW”) and the remainder Commercial
and Industrial (“C&I”) Waste. This is broadly unchanged from the previous year.
3.29 3.28 3.283.60
4.154.77
5.245.53
6.72
8.45
9.96
0.0
2.0
4.0
6.0
8.0
10.0
12.0
2006 2007 2008 2009 2010 2011 2012 2013 2014 2015 2016
Mill
ion
To
nn
es
Tonnages Processed
0%
10%
20%
30%
40%
50%
60%
70%
80%
90%
100%
2008 2009 2010 2011 2012 2013 2014 2015 2016(P)
UK Residual Waste Market
Landfill EfW RDF Exports Other Treatment

UK Energy from Waste Statistics - 2016
P a g e | 5
In 2015/16 it is estimated that 47% of Residual LACW was sent to EfWs in the UK, and a further 10%
exported as RDF.
Waste Source LACW C&I
Waste
2014/15 85.4% 14.6%
2015/16 85.1% 14.9%
Waste Type Untreated Residual
RDF
2015 N/A N/A
2016 82.5% 17.5%
Figure 8: Inputs by Waste Source Source: Wastedataflow Figure 9: Inputs by Waste Type Source: Tolvik Analysis
Untreated Residual Waste (EWC 20 03 01) was the principle input to EfWs in 2016 with an estimated
82.5% of total inputs.
Operator Market Shares
In 2016 Veolia and Viridor had the greatest market share by operator based on input tonnages.
Operator Input (kt) Share
Veolia 2,374 23.8%
Viridor 2,182 21.9%
Suez 1,210 12.1%
FCC 1,150 11.6%
Public Sector 938 9.4%
Cory 753 7.6%
MFE 573 5.8%
MES 386 3.9%
Other 393 3.9%
Total 9,960 100.0%
Figure 10: 2016 Share of Input Tonnage (includes Joint ventures) Source: Tolvik Analysis
23.8%
21.9%
12.1%
11.6%
9.4%
7.6%
5.8%
3.9%3.9%
EfW Market Share
Veolia
Viridor
Suez
FCC
Public Sector
Cory
MFE
MES
Other

UK Energy from Waste Statistics - 2016
P a g e | 6
3. ENERGY
Total power exported by EfWs in the UK in 2016 was 5,208GWh – approximately 1.8% of total UK
generation in 2016 and a 12% increase on 2015. The average power generated per tonne of input
fell during 2016 when compared with 2015, as a couple of larger EfWs experienced lower power
export than expected due to turbine issues during the year.
Gross Power
Generation GWhe
Net Power Export GWhe
Parasitic Load (excl.
power import)
Parasitic Loan (incl.
power import)
Average Net
kWh/tonne input
Net Heat Export GWhth
2014 3,936 3,368 14.4% N/A 492 N/A
2015 5,460 4,636 15.1% N/A 549 553
2016 6,152 5,208 14.8% 15.3% 524 730
Figure 11: 2016 Power Generation Source: Tolvik analysis
Using the same calculation basis as that used for 2015, in 2016 there was little change in the
average parasitic load (at 14.8%) when compared with 2015. Future reports will include imported
energy in the calculation of parasitic load; in 2016 using this revised calculation basis increased the
average parasitic load by 0.5%.
Figure 12: Power Generation from EfW Figure 13: Average Power Generation per tonne of input
Beneficial Heat Use
In 2016 only 8 EfWs in the UK exported heat for beneficial use alongside power.
Total export in 2016 is estimated to have been 730GWh (2015: 553GWh) of which more than 50%
relates to Runcorn. Across all EfWs, this is the equivalent of 75kWh/tonne of inputs (2015:
55kWh/tonne).
14.4%
15.1%
14.8%
0
1,000
2,000
3,000
4,000
5,000
6,000
7,000
2014 2015 2016
GW
h
Power Generation
Net Power Parasitic
492
549
524
400
425
450
475
500
525
550
575
600
2014 2015 2016
kW
h/tonne o
f in
put
Average Generation / Input

UK Energy from Waste Statistics - 2016
P a g e | 7
Power: Benchmarking
Figure 14: 2016 Net Power generated per tonne of Input Source: Tolvik analysis
Figure 15: 2016 Parasitic Load Distribution Source: Tolvik analysis
Figures 14 and 15 show the distribution, for each EfW for which data was reported, of the average net
power exported per tonne of input and the average parasitic power load for the year.
With an average 524kWh generated per tonne of waste input in 2016, the range across all EfWs was
from 198kWh/t to 717kWh/t. The link between EfW capacity and net power export per tonne as
suggested in 2015 UK Energy from Waste Statistics, proved in 2016 to be weak with a number of
other factors – including EfW age, reliability and waste input type having a material impact.
In 2016 EfWs parasitic loads ranged between 10% and 22% with an average 15.3%. The two outliers
were Dundee and Lancing, with the latter believed to include fuel preparation within the reported
parasitic load calculations.
Efficiency and R1
By December 2016 the number of EfWs accredited as R1 (“Recovery”) operations rather than disposal
facilities had increased from 19 to 22. R1 facilities are permitted to import waste for combustion.
# of R1 EfW
Total # of EfWs
R1 as % of Total
2014 5 33 15%
2015 19 37 51%
2016 22 41 54%
Figure 16: R1 EfWs by date of accreditation Source: EA, NRW, SEPA
Figure 17: Calculated R1 for approved EfWs Source: EA, NRW, SEPA
In order to be regarded as recovery, the minimum R1 value is 0.60 for an EfW in operation before 1
January 2009 and 0.65 for all others. The distribution of calculated R1 figures is shown in Figure 17 –
those R1 assessments based on design calculations have still to be validated.
0
100
200
300
400
500
600
700
800
kW
h/t in
pu
t
Net Power/t Input Distribution
0%
5%
10%
15%
20%
25%
30%
35%
40%
Pa
rasitic
Loa
d
Parasitic Load Distribution
0.50
0.55
0.60
0.65
0.70
0.75
0.80
0.85
0.90
0.95
R1
R1 Value Distribution

UK Energy from Waste Statistics - 2016
P a g e | 8
4. OPERATIONS
In 2016 average EfW availability, based on average operational hours reported on a line by line
basis, increased to 90.2%. Average waste outputs, expressed as a percentage of inputs, were
largely unchanged.
Availability -
Hours
% of Input Tonnage
Incinerator Bottom Ash
(“IBA”)
Air Pollution Control Resides
(“APCr”)
Metals Recovery (where reported)
2014 89.0% 20.3% 3.5% 1.9%
2015 88.3% 20.4% 3.5% 1.9%
2016 90.2% 20.2% 3.5% 1.9%
Table 18: Average Operational Data
Figure 19: Average Availability - Hours Figure 20: 2016 EfW Outputs
Availability
Operator Average Availability
Veolia 94.3%
Cory 93.2%
Other 90.8%
MES 90.5%
Suez 90.2%
Viridor 88.8%
MFE 87.9%
FCC 86.5%
Public Sector 85.1%
Average 90.2%
Figure 21: 2016 Availability Distribution Source: Tolvik Analysis Figure 22: 2016 Average Availability by Operator
89.0%88.3%
90.2%
80%
82%
84%
86%
88%
90%
92%
94%
96%
98%
100%
2014 2015 2016
% b
ased o
n o
pera
ting h
ours
Availability - Hours
20.2%
3.5%1.9%
0%
5%
10%
15%
20%
25%
IBA APCr Metals
% b
ased o
n o
pera
ting h
ours
2016 EfW Outputs
65%
70%
75%
80%
85%
90%
95%
100%
% A
va
ilab
ility
Availability Distribution

UK Energy from Waste Statistics - 2016
P a g e | 9
With just one exception, in 2016 all EfWs had an average availability of more than 81%. The six EfWs
with the highest reported availabilities were all operated by Veolia and it is little surprise to see that in
2016 their average availability, at 94.3% was the highest of all EfW operators.
Outputs
Incinerator Bottom Ash
In 2016 IBA accounted on average for 20.2%
(2015: 20.4%) of all waste inputs.
IBA outputs expressed as a percentage of waste
inputs generally fell within the 14% - 26% range
save for Allington (which uses fluidised bed
technology) and Lancing (with inputs being a mix
of RDF and recycled wood). Almost all IBA is now
recycled rather than landfilled.
Air Pollution Control Resides
In 2016, APCr generation was unchanged from
2016 at 3.5% of waste inputs.
The total generation of APCr in 2016 was
reported to be 345kt, an increase of circa 16% on
2015. Allington produced the greatest portion of
APCr as a percentage of inputs.
In 2016 it is estimated that 26% of APCr was
recycled.
Figure 23: 2016 Distribution of IBA Generation (as % of inputs)
Source: Tolvik Analysis Figure 24: 2016 Distribution of APCr Generation (as % of inputs)
Source: Tolvik Analysis
Consumable Use
Data on the use of a range of consumables – water, lime (or other alkaline reagents), urea and carbon
are increasingly being included in annual EfW returns. The data quality appears, in parts, somewhat
variable and without more than one year of data it is not possible to draw any firm conclusions from
the analysis. The available data has, however, been summarised and relates to “Specific Usage” –
i.e. usage per tonne of input. Please note, it excludes those EfWs which use ammonia rather than
urea as there are a limited number of data points.
Consumable Unit Low Median High
Total Water Usage (both potable and non-
potable) -
m3/ tonne
input 0.00 0.41 2.24
Activated carbon or coke
kg/ tonne of
input
0.03 0.36 1.79
(Hydrated) lime or sodium bicarbonate 3.92 11.61 30.91
Urea 0.04 1.61 3.39
Figure 25: 2016 Average Specific Consumable Usage Source: Tolvik analysis
0%
5%
10%
15%
20%
25%
30%
IBA
as %
of
Inputs
IBA Generation Distribution
0%
2%
4%
6%
8%
10%
12%
IBA
as %
of
Inputs
APCr Generation Distribution

UK Energy from Waste Statistics - 2016
P a g e | 10
Operational Risk Assessment (“OPRA”) Scores
All permitted facilities have an OPRA score or equivalent provided by the relevant regulatory authority.
A score of A represents the “best” assessment. There has been no material change in OPRA scores
over the last couple of years.
Figure 26: OPRA Scores Source: EA, SEPA, NRW
0% 20% 40% 60% 80% 100%
2014
2015
OPRA Scores
A B C D E

UK Energy from Waste Statistics - 2016
P a g e | 11
5. GATE FEES
Depending on the source/type of waste and contract duration, in 2016 median EfW gate fees ranged
from £58/t to £95/t.
Excluding long term LACW contracts, in general EfW gate fees in the market were up on 2015. This
reflects the increasing cost of alternatives – in particular landfill (where the number of operational
landfills continued to decline and landfill tax rose) and RDF export (weak exchange rate,
strengthening European EfW markets).
Figure 27: Median 2016 Gate Fees Sources: WRAP Gate Fee Report, Tolvik Analysis
LACW Gate Fees
The “WRAP Gate Fee Report”(3) relates largely to LACW gate fees and the 2016 report calculates a
median gate fee of £86/t – unaltered from 2015. That there has been no material change is not
unsurprising – only 7 out of the 59 respondents to WRAP reported that they had entered into a new
contract in the year and most long term contracts are subject to annual indexation.
Type of EfW Facility Year Gate Fee (per tonne)
Low Median High
Built pre - 2000 2015 £36 £73 £110
2016 £22 £58 £90
Built post - 2000 2015 £65 £99 £132
2016 £65 £95 £131
All EfWs 2015 £36 £86 £132
2016 £22 £86 £131
Figure 28: Local Authority EfW Gate Fees Source: WRAP Gate Fees Report 2015/16
0 20 40 60 80 100
LACW - Built pre 2000
Contracted C&I Waste - RDF
Contracted C&I Waste -Unprocessed
Spot - RDF
LACW - all EfWs
Spot - Unprocessed
LACW - Built post 2000
£ per tonne
2016 Median EfW Gate Fees

UK Energy from Waste Statistics - 2016
P a g e | 12
WRAP note that the movement in the sub-set median gate fees, particularly for EfWs built pre-2000,
was a function of a sampling rather than any change in market conditions.
Many of these LACW gate fees are long term contracts delivered under Design, Build, Finance and
Operate (“DBFO”) schemes and do not reflect “market” gate fees.
C&I Waste Contracted Gate Fees
In the last 24 months, a number of new “merchant” EfW facilities have been developed which are
reliant upon long term (at least 5 years, more typically 10 + years) waste supply agreements for
Residual C&I Waste rather than Residual LACW.
The gate fee data in Figure 29 has been compiled from a number of projects. It is based on contracts
of minimum 5 years, with a credit worthy waste supplier and with a deferred commencement date (i.e.
contract term only starts once the EfW is operational). There has been a rise in median long term gate
fees over the last 12 months of around £6-£8/t - reflecting the impact of the increasing cost of
alternatives treatment/disposal options for Residual C&I Waste - particularly RDF export costs.
Feedstock Year Gate Fee (per tonne)
Low Median High
RDF 2015 £52 £58 £68
2016 £55 £64 £78
Unprocessed Residual Waste 2015 £55 £62 £78
2016 £57 £70 £88
Figure 29: Contracted C&I Waste EfW Gate Fees Source: Tolvik Analysis
Spot/Short Term Gate Fees
The only other source of EfW gate fee income in the public domain is Letsrecycle.com(4) which in
December 2016 reported short term gate fees (i.e. contracts typically of 1-3 years duration) ranging
from £75/t to £105/t. This is consistent with Tolvik’s own market information, with the lower figure for
RDF rather than unprocessed Residual Waste.
Feedstock Year Gate Fee (per tonne)
Low Median High
RDF 2016 £75 £80 £105
Unprocessed Residual Waste 2016 £75 £92 £105
Figure 30: Short Term EfW Gate Fees Source: Letsrecycle.com and Tolvik Analysis

UK Energy from Waste Statistics - 2016
P a g e | 13
6. MARKET DEVELOPMENTS
Section 1 identified Headline Capacity of 15.84Mt which was operational or in construction as at
December 2016. In the period to end April 2017, a further 0.08Mt of Headline Capacity has been
consented though an extension of capacity at Trident Park.
The Headline Capacity should not be used as the basis for projecting future EfW capacity in an
analysis of the UK Residual Waste market. This should instead be based on the projected level of
EfW inputs – the “Operational Capacity”. It is estimated, based solely upon those EfWs which (as
at December 2016) were either operational or in construction, the Operational Capacity in 2020 will
be 14.70Mt.
Figure 31: Projected UK EfW Inputs
The projected Operational Capacity figure assumes:
No additional EfW Capacity is developed and no EfWs are decommissioned;
For EfWs operational in 2016: the Operational Capacity is based on average inputs
over 5 years (or shorter period for newer EfWs); and
For EfWs in construction in 2016: the Operational Capacity will be 95% of the Headline
Capacity.
Decommissioning
Two EfWs which have effectively been decommissioned since 2015:
Avonmouth ACT;
Isle of Wight ACT.
Both are being or are expected to be reconstructed and so have been included within this report.
Similarly it is expected that the 150ktpa Baldovie facility in Dundee will, in due course, be
decommissioned and replaced by a new 110ktpa facility for which planning has recently been granted.
Planning consent has also been granted for a 700ktpa EfW in North London to replace the existing
London EcoPark facility.
0.0
2.0
4.0
6.0
8.0
10.0
12.0
14.0
16.0
Mill
ion
To
nn
es
Projected EfW Operational Capacity

UK Energy from Waste Statistics - 2016
P a g e | 14
Additional EfW Capacity
The Operational Capacity beyond 2020 will be dependent on whether additional EfW facilities are
developed. Recent trends suggest that the EfWs most likely to be developed will either be ACT
facilities benefitting from subsidy support or larger scale EfWs based on conventional moving grate
technologies.
In April 2017 bids were submitted by developers of ACT projects seeking support under the Contracts
for Difference (“CfD”) mechanism. This, the second bidding round, has a total funding pot of £290m
and with decisions expected by autumn 2017.
The expectation is that the process will be very competitive, with ACT developers seeking funding
from the same “pot” as offshore wind. It is understood from several sources that there could have
been as many as 30 applications for support for ACT projects. With this level of competition there is
the potential that the level of support awarded to successful ACT projects may not always be sufficient
for them to be commercially viable. Tolvik therefore expects only a small portion of these facilities to
be financed and built.
The recent strengthening of the Residual Waste market (both in terms of tonnages and gate fees) and
the successful financing of key projects has led to a renewed interest in larger scale EfW facilities.
Figure 32 identifies EfWs with an anticipated capacity of greater than 300ktpa where there was
development activity during 2016-17. Self-evidently not all of these facilities will be constructed.
Local Authority Facility Developer Capacity Latest development
Stockton-on-Tees
Billingham Gaia Power 50MW Planning consent amended from biomass to RDF
Enfield Edmonton NLWA 700kpa Planning consent granted for replacement to London EcoPark
Central Beds Rookery South
Veolia/Covanta 480ktpa Development partnership confirmed
Cheshire West & Chester
Protos Peel 350ktpa Planning consent granted
Essex Rivenhall Gent Fairhead 595ktpa Permit refused and revised application submitted. Has CfD from Round 1
Slough Multifuel SSE 50MW Finalisation of planning consent
Hertfordshire Rye House Veolia 320ktpa Planning application submitted for alternative facility for Hertfordshire LACW contract
Leicestershire Newhurst Biffa 350ktpa Biffa reported in IPO -discussions with potential partners continue
Cheshire West & Chester
Lostock TATA 60MW
Developer seeking to discharge planning consent conditions, prior to expiry of consent in October 2017
Figure 32: Large scale EfWs in active development

UK Energy from Waste Statistics - 2016
P a g e | 15
7. INTERNATIONAL BENCHMARKS
This report has pulled together the latest available published EfW data from other northern European
countries for the purposes of a comparison with the UK EfW market. There will be differences in the
categorisation of EfW facilities and in the calculation/measurement methodologies applied, but it is
hoped that the data provides a useful high level overview of some key operational metrics.
Country Reported
Inputs (Mt)
Associated Capacity
(Mt)
Inputs as % of Headline
Capacity
Sweden 5.78 6.27 92.0%
Denmark 3.48 3.79 91.7%
Norway 1.53 1.80 85.0%
Germany 22.93 24.38 94.4%
Netherlands 7.56 8.01 94.5%
UK 9.72 10.48 92.7%
Figure 33: Reported EfW data used for benchmarking Sources: As per Appendix 2
As Figure 34 shows, whilst in the UK EfWs are largely focussed on electricity export, in most other
European markets energy is exported through a mix of power, hot water and steam.
Country Electricity (MWh/t)
Heat (MWh/t)
Total (MWh/t)
Sweden 0.40 2.55 2.94
Denmark 0.40 2.11 2.51
Norway 0.25 1.90 2.15
Germany 0.44 0.89 1.33
Netherlands 0.48 0.78 1.26
UK 0.52 0.08 0.60
Figure 34: European Benchmarks – Energy Export
The UK’s figures for ash and metal outputs are broadly in line with the rest of Europe.
Country IBA APCr Metals
Sweden 16.7% 4.4%
Denmark 17.0% 3.0%
Germany 27.0% 2.4%
Netherlands 22.0% 2.5% 1.8%
UK 20.2% 3.5% 1.9%
Figure 35: European Benchmarks – Ash and Metal Outputs
0.0
0.5
1.0
1.5
2.0
2.5
3.0
3.5
Sweden Denmark Norway Germany Neth. UK
MW
h/t in
pu
t
Energy Export per tonne Input
Electricity Heat

UK Energy from Waste Statistics - 2016
P a g e | 16
APPENDIX 1: EfWs INCLUDED IN THE REPORT
Figure 36: Location of EfW facilities included in this report (Shetland Islands not shown)

UK Energy from Waste Statistics - 2016
P a g e | 17
Operational EfWs
Figure 37: Operational EfWs in 2016
NB those in italics were only operational for part of the year. * denotes estimated input data as actual figure not reported.
Name Location Local Authority OperatorHeadline
Capacity2016 Input
1 Riverside Belvedere Bexley Cory 785,000 752,839
2 Tyseley Birmingham Birmingham Veolia 400,000 351,208
3 Coventry Coventry Coventry Public Sector 315,000 282,849
4 Dudley Dudley Dudley MES 105,000 93,292
5 Newhaven Newhaven East Sussex Veolia 242,000 233,013
6 Bolton Bolton Greater Manchester Viridor 127,000 86,388
7 Chineham Basingstoke Hampshire Veolia 110,000 97,997
8 Allington Allington Kent FCC 500,000 513,454
9 Kirklees Huddersfield Kirklees Suez 160,000 127,510
10 SELCHP Lewisham Lewisham Veolia 488,000 448,235
11 NewLincs Stallingborough North East Lincolnshire Other 56,000 54,855
12 London EcoPark Edmonton Enfield Public Sector 620,000 547,721
13 Eastcroft Eastcroft Nottingham City FCC 180,000 169,844
14 Portsmouth Portsmouth Portsmouth Veolia 210,000 203,721
15 Sheffield Sheffield Sheffield Veolia 245,000 235,334
16 Gremista Shetlands Shetland Islands Public Sector 26,000 22,965
17 Baldovie Dundee Dundee Public Sector 120,000 84,669
18 Lakeside Colnbrook Slough Viridor 450,000 435,844
19 Marchwood Southampton Southampton Veolia 210,000 204,045
20 Hanford Stoke Stoke-on-Trent MES 210,000 182,069
21 Tees Valley Haverton Hill Stockton-on-Tees Suez 756,000 610,168
22 Lancing Lancing West Sussex Other 60,350 59,005
23 Wolverhampton Wolverhampton Wolverhampton MES 118,000 110,759
24 Avonmouth ACT Avonmouth Bristol Other 120,000 32,428
25 Marsh Barton Exeter Devon Viridor 60,000 53,457
26 Runcorn Runcorn Halton Viridor 850,000 867,715
27 North Hykeham North Hykeham Lincolnshire FCC 170,000 163,580
28 Four Ashes Cannock Staffordshire Veolia 340,000 339,946
29 Trident Park Cardiff Cardiff Viridor 350,000 352,198
30 Cornwall* St Dennis Cornwall Suez 240,000 40,000
31 Ardley Ardley Oxfordshire Viridor 326,000 304,063
32 Peterborough Fengate Peterborough Viridor 85,000 82,702
33 Devonport Plymouth Plymouth Other 265,000 246,580
34 Shropshire Battlefield Shropshire Veolia 102,000 94,421
35 Suffolk Great Blakenham Suffolk Suez 269,000 266,539
36 Ferrybridge FM1 Ferrybridge Wakefield MFE 570,000 573,035
37 Greatmoor Calvert Buckinghamshire FCC 300,000 267,479
38 Leeds Cross Green Leeds Veolia 179,580 165,940
39 Wilton 11 Middlesborough Middlesbrough Suez 444,000 45,805
40 Severnside* Severnside South Gloucestershire Suez 400,000 120,000
41 Hartlebury Kidderminster Worcestershire FCC 200,000 36,094
Totals 11,763,930 9,959,766

UK Energy from Waste Statistics - 2016
P a g e | 18
EfWs in Construction
Figure 38: EfWs in construction in 2016
APPENDIX 2: DATA SOURCES
(1): Annual Performance Reviews released under Freedom of Information Act request:
EA (for England): https://ea.sharefile.com/d-s3f7ca28097445138.
SEPA (for Scotland): http://apps.sepa.org.uk/disclosurelog/# - information can be located in the link under the reference number F0187455.
NRW (for Wales): Report kindly provided by Viridor Waste Management.
NIEA (for N Ireland): Nil return.
(2): http://www.wastedataflow.org/ accessed on 24 April 2017. Q100 for 4 quarters Apr 2015 – Mar 2016.
(3): http://www.wrap.org.uk/collections-and-reprocessing/recovered-materials-markets/reports/gate-fee-report-2016
(4): http://www.letsrecycle.com/prices/efw-landfill-rdf-2/efw-landfill-rdf-2016-gate-fees/
International Data
Country Ref Year Source
Sweden 2015 Avfall Sverige: Svensk Avfallshantering 2016
Denmark 2014 BEATE Benchmarking af affaldssektoren 2015 (data fra 2014)
Forbrænding
Norway 2015 CEWEP Country Report 2016
Germany 2014 ITAD: Jahresbericht 2014
Netherlands 2015 Afvalverwerking in Nederlands, gegevens 2015
Name Location Local Authority OperatorHeadline
Capacity
1 Polmadie ACT Glasgow Glasgow Viridor 154
2 Beddington Lane Croydon Croydon Viridor 275
3 Eco Park ACT Shepperton Surrey Suez 55
4 Milton Keynes ACT Milton Keynes Milton Keynes Other 90
5 Javelin Park Gloucester Gloucestershire Other 190
6 Sinfin Road ACT Derby Derby City Other 190
7 Allerton Park Knaresborough North Yorkshire Other 320
8 Parc Adfer Deeside Flintshire WTI 200
9 Millerhill Millerhill Edinburgh FCC 163
10 Kemsley Kemsley Kent WTI 550
11 Severn Road Avonmouth Bristol Viridor 320
12 Dunbar Dunbar East Lothian Viridor 300
13 Energy Works ACT Hull Kingston-upon-Hull Other 227
14 Ferrybridge FM2 Ferrybridge Wakefield MFE 570
15 Hoddesdon ACT Hoddesdon Hertfordshire Other 90
16 Levenseat ACT Fauldhouse West Lothian Other 180
17 Bombardier ACT Belfast Belfast Other 180
18 Isle of Wight ACT Isle of Wight Isle of Wight Other 30
Total 4,084

UK Energy from Waste Statistics - 2016
P a g e | 19
APPENDIX 3: GLOSSARY
ACT Advanced Conversion Technology (i.e. gasification/pyrolysis)
APCr Air Pollution Control residues
C&I Waste Commercial and Industrial Waste
CfD Contract for Difference
CHP Combined Heat and Power
CV
DBFO
Calorific Value
Design, Build, Finance and Operate
DUKES Digest of UK Energy Statistics
EA Environment Agency
EfW
EWC
Energy from Waste
European Waste Catalogue
Headline Capacity The maximum annual throughput contained within the Environmental Permit except where an operator has publicly reported an alternative figure.
IBA Incinerator Bottom Ash
Kt (pa) ‘000s tonnes (per annum)
LACW Local Authority Collected Waste
Mt (pa) Million tonnes (per annum)
NIEA Northern Ireland Environment Agency
NRW Natural Resources Wales
OPRA Operational Risk Assessment
RDF Refuse Derived Fuel
Residual Waste Solid, non hazardous, combustible waste which remains after recycling either treated (in the form of an RDF or SRF) or untreated (as “black bag” waste).
SEPA Scottish Environmental Protection Agency

Tolvik Consulting Limited
The Old Vicarage
Fairmead
Dursley
Gloucestershire
GL11 5JR
Phone: +44 (0)1453 519048
Email: [email protected]
CONSULTING
MARKET ANALYSIS
DUE DILIGENCE
Tolvik Consulting is a privately-
owned specialist provider of
independent market analysis
and commercial advisory
services across the waste and
biomass sectors.
Our clients include the UK’s
leading waste companies,
project finance investors,
developers and equity
investors.
www.tolvik.com
This report has been written by Tolvik Consulting Ltd on an independent basis using our knowledge of the current UK waste market and with reference inter alia to various published reports and studies and to our own in-house analysis. This knowledge has been built up over time and in the context of our prior work in the waste industry.
This report has been prepared by Tolvik Consulting Ltd with all reasonable skill, care and diligence as applicable. Whilst we have taken reasonable precautions to check the accuracy of information contained herein, we do not warrant the accuracy of information provided.