ugc funded major research project report
TRANSCRIPT
UGC FUNDED MAJOR RESEARCH PROJECT
REPORT
Status of Public Health Care Services in Punjab:
A Case Study of Punjab Health Systems Corporation
(PHSC)
Dr. Amarjit Singh Sidhu
Professor (Re-appointed) &
Principal Investigator
Dr. Gurpreet Randhawa
Assistant Professor &
Co-Investigator
University Business School
Guru Nanak Dev University
Amritsar (Punjab)
2020
PREFACE
Health is a basic component of human development and hence determines society’s well-being.
Higher level of human development enables a country to build up a sound health system which
further enhances labour productivity and contributes to material progress. The analysis of the
status of health services in a country like India, which is the second largest populous country of
the world, is very important to improve the well-being of the people. The health care services in
India are marred by class inequalities, denial of opportunities to disadvantaged groups, low
accessibility to lower strata and the poor quality services in the public sector hospitals. As per
Human Development Report, 2019 out of 189 countries, India was ranked 129 with Human
Development Index of 0.647.
Further, the status of health in a country largely depends on the resources allocated to the health
sector. It has been noticed that countries with higher level of health spending achieve better
health outcomes as compared to the countries with low level of spending. As per WHO statistics,
2017 the health expenditure accounted for only 3.5 per cent of GDP in India which is even less
than some low income countries. Further, out of the total health expenditure in India the private
health expenditure forms a very high proportion. The health sector in India falls in the concurrent
list due to which both centre and the state governments provide funding for the public health
sector. After the implementation of new economic policy in 1991 the rising cost of health
services due to privatization of health services under the garb of reforms has become a major
issue of debate at the national and the state level.
In the implementation of these reforms, the Punjab government established Punjab Health
Systems Corporation (PHSC) in 1996 for the improvement of health services in terms of access
as well as quality with the help of World Bank funding. However, many researchers have
pointed out that the public sector health services in Punjab have further deteriorated even after
the formation of PHSC. So, the present study was planned to enquire this issue by collecting data
from various stakeholders by taking a sample of thirty hospitals working under the PHSC in
Punjab during the period September, 2016 to October, 2017. These thirty hospitals were selected
by taking a sample of six district hospitals, twelve each from sub-divisional hospitals and
community health centers from the six districts of Punjab. Further, a sample of 300 patients and
95 doctors was taken to record their views in regard to the delivery of health services provided
by the PHSC institutions. The findings of the study based on secondary and primary data will go
a long way for the development of a long term health policy for Punjab to improve the access
and quality of public health services.
This work could not have been completed without the active support of our employer Guru
Nanak Dev University, Amritsar which provided us whole-hearted support for the completion of
this study. Our special thanks go to Mr. Paramveer Singh, Project Fellow who worked hard for
the collection of data from the patients and the working doctors in the sampled hospitals. We are
also thankful to the University Grants Commission, New Delhi for sanctioning grant of
Rs. 10,22,000/- vide its office letter no. F.No. 5-251/2014(HRP) dated 17/09/2015 out of which
only Rs. 6,02,000/- was disbursed as first installment. In spite of the fact that we could not get
second installment we succeeded to complete this project. We are thankful to all the doctors, the
patients and the staff working in these hospitals for extending their support in various capacities
for the completion of this project. We are thankful to Mr. Rakesh Mahajan, Senior Research
Fellow, UGC who worked hard and helped us for the preparation of this manuscript. We are
thankful to the Grants Section of Guru Nanak Dev University for their cooperation in the
completion of the project. Last but not the least, we acknowledge the support of our colleagues
and friends who extended their whole hearted support during the completion of this research
work.
Dr. Amarjit Singh Sidhu
Professor (Reappointed) &
Principal Investigator
Dr. Gurpreet Randhawa
Assistant Professor &
Co-Investigator
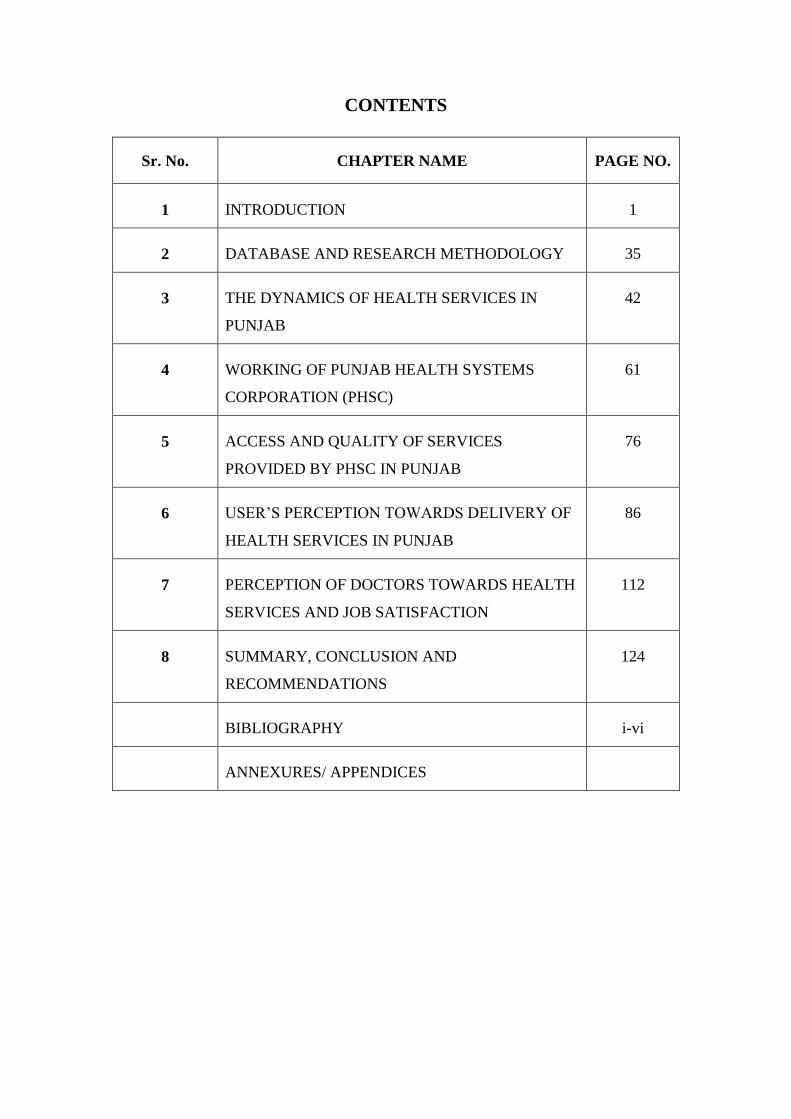
CONTENTS
Sr. No. CHAPTER NAME PAGE NO.
1 INTRODUCTION 1
2 DATABASE AND RESEARCH METHODOLOGY 35
3 THE DYNAMICS OF HEALTH SERVICES IN
PUNJAB
42
4 WORKING OF PUNJAB HEALTH SYSTEMS
CORPORATION (PHSC)
61
5 ACCESS AND QUALITY OF SERVICES
PROVIDED BY PHSC IN PUNJAB
76
6 USER’S PERCEPTION TOWARDS DELIVERY OF
HEALTH SERVICES IN PUNJAB
86
7 PERCEPTION OF DOCTORS TOWARDS HEALTH
SERVICES AND JOB SATISFACTION
112
8 SUMMARY, CONCLUSION AND
RECOMMENDATIONS
124
BIBLIOGRAPHY i-vi
ANNEXURES/ APPENDICES
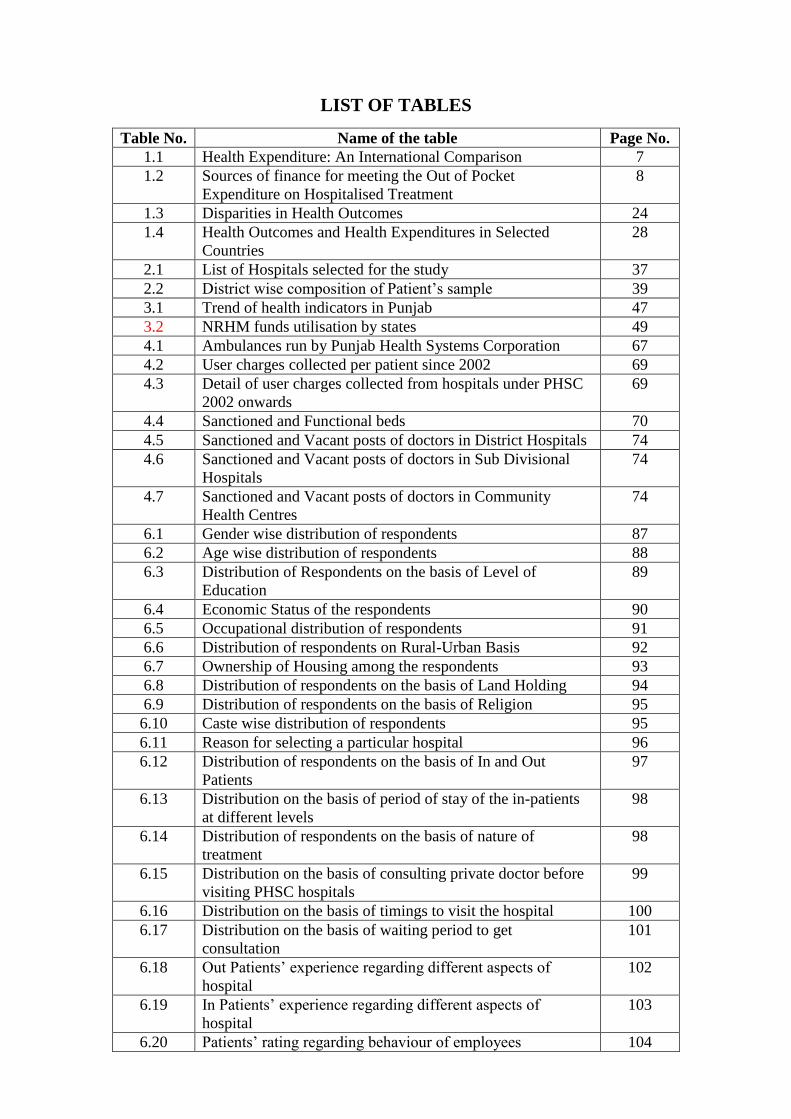
LIST OF TABLES
Table No. Name of the table Page No.
1.1 Health Expenditure: An International Comparison 7
1.2 Sources of finance for meeting the Out of Pocket
Expenditure on Hospitalised Treatment
8
1.3 Disparities in Health Outcomes 24
1.4 Health Outcomes and Health Expenditures in Selected
Countries
28
2.1 List of Hospitals selected for the study 37
2.2 District wise composition of Patient’s sample 39
3.1 Trend of health indicators in Punjab 47
3.2 NRHM funds utilisation by states 49
4.1 Ambulances run by Punjab Health Systems Corporation 67
4.2 User charges collected per patient since 2002 69
4.3 Detail of user charges collected from hospitals under PHSC
2002 onwards
69
4.4 Sanctioned and Functional beds 70
4.5 Sanctioned and Vacant posts of doctors in District Hospitals 74
4.6 Sanctioned and Vacant posts of doctors in Sub Divisional
Hospitals
74
4.7 Sanctioned and Vacant posts of doctors in Community
Health Centres
74
6.1 Gender wise distribution of respondents 87
6.2 Age wise distribution of respondents 88
6.3 Distribution of Respondents on the basis of Level of
Education
89
6.4 Economic Status of the respondents 90
6.5 Occupational distribution of respondents 91
6.6 Distribution of respondents on Rural-Urban Basis 92
6.7 Ownership of Housing among the respondents 93
6.8 Distribution of respondents on the basis of Land Holding 94
6.9 Distribution of respondents on the basis of Religion 95
6.10 Caste wise distribution of respondents 95
6.11 Reason for selecting a particular hospital 96
6.12 Distribution of respondents on the basis of In and Out
Patients
97
6.13 Distribution on the basis of period of stay of the in-patients
at different levels
98
6.14 Distribution of respondents on the basis of nature of
treatment
98
6.15 Distribution on the basis of consulting private doctor before
visiting PHSC hospitals
99
6.16 Distribution on the basis of timings to visit the hospital 100
6.17 Distribution on the basis of waiting period to get
consultation
101
6.18 Out Patients’ experience regarding different aspects of
hospital
102
6.19 In Patients’ experience regarding different aspects of
hospital
103
6.20 Patients’ rating regarding behaviour of employees 104
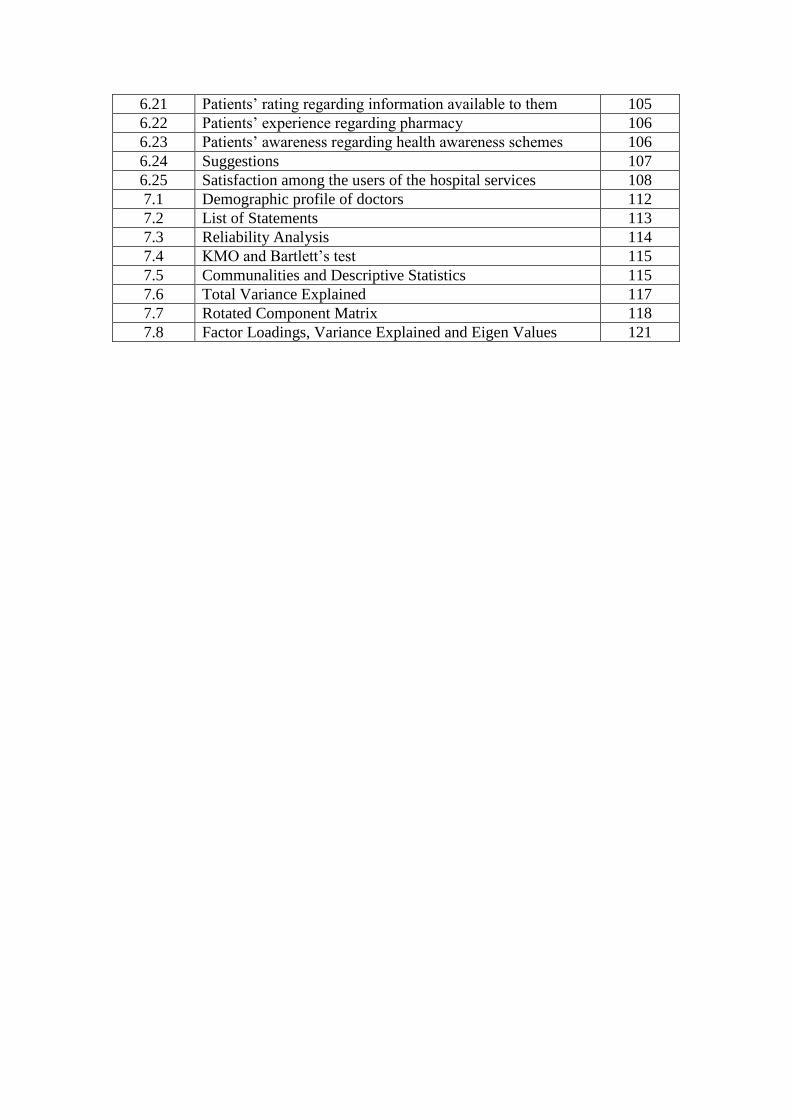
6.21 Patients’ rating regarding information available to them 105
6.22 Patients’ experience regarding pharmacy 106
6.23 Patients’ awareness regarding health awareness schemes 106
6.24 Suggestions 107
6.25 Satisfaction among the users of the hospital services 108
7.1 Demographic profile of doctors 112
7.2 List of Statements 113
7.3 Reliability Analysis 114
7.4 KMO and Bartlett’s test 115
7.5 Communalities and Descriptive Statistics 115
7.6 Total Variance Explained 117
7.7 Rotated Component Matrix 118
7.8 Factor Loadings, Variance Explained and Eigen Values 121
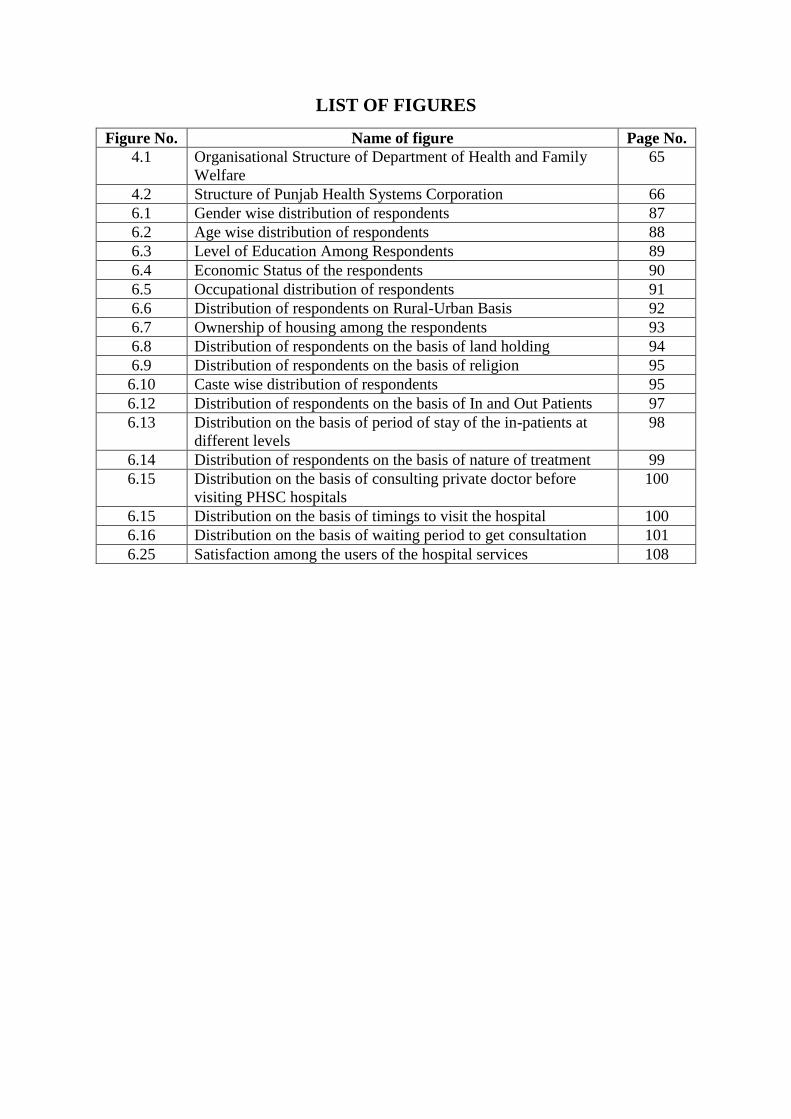
LIST OF FIGURES
Figure No. Name of figure Page No.
4.1 Organisational Structure of Department of Health and Family
Welfare
65
4.2 Structure of Punjab Health Systems Corporation 66
6.1 Gender wise distribution of respondents 87
6.2 Age wise distribution of respondents 88
6.3 Level of Education Among Respondents 89
6.4 Economic Status of the respondents 90
6.5 Occupational distribution of respondents 91
6.6 Distribution of respondents on Rural-Urban Basis 92
6.7 Ownership of housing among the respondents 93
6.8 Distribution of respondents on the basis of land holding 94
6.9 Distribution of respondents on the basis of religion 95
6.10 Caste wise distribution of respondents 95
6.12 Distribution of respondents on the basis of In and Out Patients 97
6.13 Distribution on the basis of period of stay of the in-patients at
different levels
98
6.14 Distribution of respondents on the basis of nature of treatment 99
6.15 Distribution on the basis of consulting private doctor before
visiting PHSC hospitals
100
6.15 Distribution on the basis of timings to visit the hospital 100
6.16 Distribution on the basis of waiting period to get consultation 101
6.25 Satisfaction among the users of the hospital services 108
1
CHAPTER I
INTRODUCTION
Good health is considered to be a pre - requisite for the socio - economic development of any
nation. Health is a basic component of human development, and hence, determines society‟s
well-being. Through human development, sound health enhances labour productivity and
contributes to material progress. It is a means to empower the deprived sections of society and
thus, had emerged as an important element in the strategy for poverty alleviation (Rao and
Choudhry, 2008). Health has been identified as a single sector in which the impact of public
finance and public policy is of particular importance (WDR, 1993). The government‟s active role
either in the form of direct provision of health care services or regulation of the health care
services by the private sector is essential for ensuring equitable access particularly to the poor
(Walsh, 1997). Moreover, public health care interventions are required in order to improve health
and quality of life through prevention and treatment of disease and other physical and mental
health conditions through surveillance of cases and promotion of healthy behavior. However, the
working of current health care system is being questioned not only in developing countries
(including India) but also in developed nations like USA, UK and others (Bose, 2012). As far as
India is concerned, the health care services are marred by class inequalities, denial of
opportunities to disadvantaged groups, low accessibility to lower strata and rampant corruption.
As a result, the health care outcomes in India are below the levels that might be expected even at
India‟s specific level of development (Singh, 2011). All this necessitates the active role of
government in the provision of health services, particularly to the poor (Ghuman and Mehta,
2005).
This chapter has been divided into three sections. Section I presents discussion related to
international scenario in health sector. Section II discusses the facts related with national
scenario. And lastly, section III presents the main highlights of Situation Analyses Report, 2017
and National Health Policy, 2017.
Section I
1.1 International Health Scenario
The health care provision varies around the world. Almost all developed and wealthy
nations provide universal health care services except the USA. The issue of health is challenging
due to the shortage of required funding as well as various social, cultural, political and economic
2
conditions. While looking at the pattern of health care around the world, the WHO (2008) found
five common shortcomings of health care delivery which includes the following: (1) Inverse
care: It means that people with the most means – whose needs for health care are often less –
consume the most care, whereas those with the least means and greatest health problems
consume the least. In other words, public spending on health services most often benefits the rich
more than the poor in high- and low-income countries alike; (2) Impoverishing care : It means
that wherever people lack social protection and payment for care is largely out-of-pocket at the
point of service, they can be confronted with catastrophic expenses. Over 100 million people
annually fall into poverty because they have to pay for health care; (3) Fragmented and
fragmenting care: It refers to the excessive specialization of health-care providers and the
narrow focus of many disease control programs discourage a holistic approach to the individuals
and the families they deal with and do not appreciate the need for continuity in care. Health
services for poor and marginalized groups are often highly fragmented and severely under-
resourced, while development aid often adds to the fragmentation ; (4) Unsafe care: It refers to
the poor system design that is unable to ensure safety and hygiene standards leads to high rates
of hospital-acquired infections, along with medication errors and other avoidable adverse effects
that are an underestimated cause of death and ill-health, and (5) Misdirected care: It means that
the resource allocation clusters around curative services at great cost, neglecting the potential of
primary prevention and health promotion to prevent up to 70 per cent of the disease burden.
Ashtekar (1999) examined the health care measures of Chinese government. The study
found core principles of Chinese healthcare reform plan which are applicable to all countries
having same set of problems. These include “priority for the problems of the masses, prevention
first, making the most of traditional and local resources, combining these with modern medicines
and mobilisation of community for solving health problems”. The Chinese rulers put a lot of
emphasis on their native healing system at levels of health care. After the major reforms the
biggest challenge was rising proportion of 'unmet needs' of people due to rising costs of health
services. The study also revealed that apart from direct health care measures, China paid serious
attention towards non-medical health inputs also such as safe water, sanitation and primary
education which paid rich dividends in the long run. Due to these additional measures, infections
go down steeply. Comparatively, India has a long distance to go on these fronts.
Filmer et al. (2000) observed a very disappointing experience with implementation of
primary health care programs in developing countries. They identified two weak links in the
3
chain between government spending for services to improve health and actual improvements in
health status. According to the researchers, first of all, institutional capacity is a vital ingredient
in providing effective services. When this capacity is inadequate, health spending, even on the
right services, may lead to little actual provision of services. Secondly, the net effect of
government health services depends on the severity of market failures - the more severe the
market failures, the greater the potential for government services to have an impact.
Baru (2003) examined the key processes which influence the size and characteristics of
private provisioning in health care in four South Asian countries, namely, India, Pakistan,
Bangladesh and Sri Lanka. The study found that the key processes as (i) global actors (research
institutions, insurance companies, medical equipment industries, pharmaceutical), (ii) role of the
state in investments/allocations in health services as well in quality/accessibility/availability of
health services, and (iii) influence of middle class supply and demand of private health services.
Latief (2010) explored the success of community-based health care initiatives taken by
Islamic charitable clinics in Indonesia. The study found the popularity of zakat (Islamic
charitable obligation) agencies among poorer families in order to have access to health service.
These charitable agencies serve well the poor families belonging to rural areas as well urban
areas. Moreover, they enjoy strong support from society and Indonesian government also. The
study shows how community-based initiatives and zakat agencies have provided wider access to
viable health services for destitute families in poor urban and rural areas. Their services include
accessible free medical assistance for poorer families.
Section – II
1.2 Health Scenario in India
The analysis of the status of the health sector in a country like India is very important. India is
the second largest populous country of the world. Therefore, the improvement in the level of
health has always been remained a major issue since independence. The first such effort was
made by government with the setting up of Bhore Committee in 1943 even before independence.
Noting a poor status of health in the country, it recommended in 1946 an integration of
preventive and curative services at all administrative levels. On the recommendation of Bhore
Committee India adopted the concept of three tier health system, namely, Primary, Secondary
and Tertiary levels of care. The major initiative during post-independence period is the launch of
National Rural Health Mission in 2005. Its main focus is on the strengthening of health
4
infrastructure particularly in rural areas with the increase in public spending. All these initiatives,
contributed particularly in the improvement of health services in the country in terms of
reduction in birth rate, death rate, infant mortality rate and the increase in the life expectancy.
However, all these achievements have failed to improve rankings of Indian health system when
we make international comparison. India has poor health indicators as compared to many of the
Asian countries like China, Bangladesh (Deepa et. al. 2006). Further, large scale disparities exist
at regional level, rural vs urban etc.
Furthermore, India is spending much less expenditure on health as compared to the
developed and even under developed countries. In addition to low per capita expenditure by the
government, there is a shortage of infrastructure and man power at all levels. In spite of some
improvement in the health sector, still control of communicable diseases is a major challenge.
The number of reported TB cases in India was 12,89,836 which was the highest in the world as
per WHO Report, 2014. The changing lifestyle and increasing urbanization has contributed to
the rise in the non-communicable diseases such as hypertension, cancer and diabetes which is
further expected to increase at higher rate than infectious diseases in future (Rajan and
Prabhakaran, 2012).
The situation has further deteriorated in the recent times. Recently world Health
Organization (WHO) has reported that India had an estimated 11.6 lakh new cancer cases in
2018 only. It further said that one in 10 Indians will develop cancer during their life time and one
in 15 Indians will die of cancer (The Tribune, Feb 5, 2020).
The lack of resources, the frequent change in the health policy, the implementation of
new liberal policy of the government and lack of will in the government and lack of public
pressure are major reasons which are responsible for the poor health standards in the country.
The growth of unregulated privatization has further added to the problems of the poor people. All
these developments have made health services unaffordable for large majority of the population.
1.2.1 Status of health in terms of selected health indicators in India
The important health indicators like infant mortality rate, crude birth rate, crude death rate and
life expectancy provide a clear picture of Health Status of a country. As per HD report 2014, out
of 187 countries, India ranks 135th with Human Development Index of 0.586.
The statistics on health indicators for some developing Asian countries as per WHO
statistics 2015 reveals that in 2013, life expectancy at birth in India was 66 years which was less
than China (75), Sri Lanka (75), Indonesia (71), Bangladesh (71) and Nepal (68). Under five
5
mortality rate in India was 52.7 which was more than the average global rate (45.6). The picture
of Indian health status which is shown by the health indicators is not very satisfactory. The
various health indicators over two different periods 1991-2001 and 2002-2013 are shown in
annexure I.
The performance of health sector is generally evaluated on the basis of crude birth rate,
crude death rate per 1000 people and infant mortality rate per 1000/ live births. The analysis of
data during post reforms period i.e. since 1991 onwards is taken for this purpose. Further, annual
growth rate for the period 1991 to 2001 and 2002 to 2013 has been compared.
The analysis reveals that CBR in urban areas declined at higher rate (1.8 percent) during the
period 1991-2001, however, in the second period, decline in CBR is higher in rural areas. The
higher decline in rural areas in CBR may be due to the implementation of National Rural Health
Mission programme in 2005, which aims at improving the health infrastructure in the rural areas
and to increase the public spending on health.
The analysis of data relating to Crude Death Rate (CDR) reveals that there is higher
decline in CDR (1.6 per cent) during the first period i.e. 1991-2001 than during the second
period (1.2 per cent). The CDR in urban areas has declined at a very slow rate 0.7 per cent since
1991. Further, CDR has declined at the higher rate in rural areas in both the time periods but still
CDR in rural areas was higher (7.5 per cent) than in urban areas (5.6 per cent). The decline in
CDR is the result of decline in epidemics, improvement in medical facilities, increase in literacy
rate and improved sanitation facilities (curative measure) during the post reforms period.
The number of infants dying before attaining one year of age per 1000 live birth rate is
the Infant Mortality Rate (IMR). The analysis of data reveals that the IMR has declined from 80
deaths per 1000 live births in 1991 to 40 in 2012. However, decline rate in IMR has been higher
during 2002-2013 (4.1 per cent) as compared to 1.7 per cent during 1991-2001. The increase in
public spending might be the reason of higher survival rate during the latter period. Further, there
is a substantial fall in the overall IMR but still rural-urban variations exist. In spite of the launch
of Rural Health Mission in 2005, the urban population is still in better position than the rural
people, in terms of allocation of funds and higher access to quality health services. As per census
2011, about 70 per cent of the Indian population lives in rural areas, therefore, improvement in
rural health indicators is the key to the overall health improvement in the country.
The Maternal Mortality is another important indicator of health status. The MMR was
398 in 1997-98 which declined to 167 in 2012-13(National Health Report India, 2015). Among
6
the major steps taken by government in this regard was the introduction of Janani Suraksha
Yojna in 2005. It is one of the world‟s largest schemes which involve conditional cash transfer.
Under this scheme, the women are given financial incentives to promote the institutional
delivery, due to which maternal deaths have reduced. Another scheme in this regard is Janani
Sishu Suraksha Karyakram launched under the Reproductive and Child Health Programme to
reduce IMR and MMR. The MMR deaths have declined to half in the last two decades; even
then India could not achieve Millennium Development Goal of 109 by 2015. Furthermore, the
male life expectancy in India has improved from 63.8 per cent in 2001-05 to 67.3 per cent in
2011-15 which increased from 66.1 to 69.6 during the same period in case of females. This
increase can be attributed to better immunization and nutrition along with the prevention and
treatment of communicable diseases.
1.2.2 Pattern of Health Expenditure in India
The status of health services in the country largely depends on the resources allocated to the
health sector. It has been noticed that the countries with higher level of health spending
achieve better health outcomes, compared to the countries with low level of spending. Thus,
it becomes important to have a higher level of health spending. The plan-wise total
investment made by the Indian government on all heads and on health in particular reveals
that the allocation for health in the first plan was Rs. 65.3 crores which increased to Rs.
300018 crores in the twelfth plan. The health outlay as a proportion of the total investment
has shown an increase from 3.4 per cent to 6.5 per cent over the period. The effect of NRHM
can be clearly seen in the eleventh five year plan as the health allocations were substantially
increased from 3.97 per cent of outlay to 6.50 per cent. The eleventh plan highlighted the
poor state of the health system in India. The shortage of health personnel and the inter-state
disparities in terms of health access and health outcomes were reported as the major issues in
the public health system of India. Besides this, the deteriorating quality of medical education
was also considered critical. In the twelfth plan, the health allocation has been further
increased to 8.40 per cent of the total plan investment. Though, the efforts have been made to
increase the health spending as a percentage of GDP at the national level but it is still below
the developed countries.
Undoubtedly, the total investment on health has increased enormously in absolute terms,
but as a percentage of GDP, the health expenditure is still inadequate. India ranks below
7
developed and emerging countries in this respect and ranks lowest among the BRICS (Brazil,
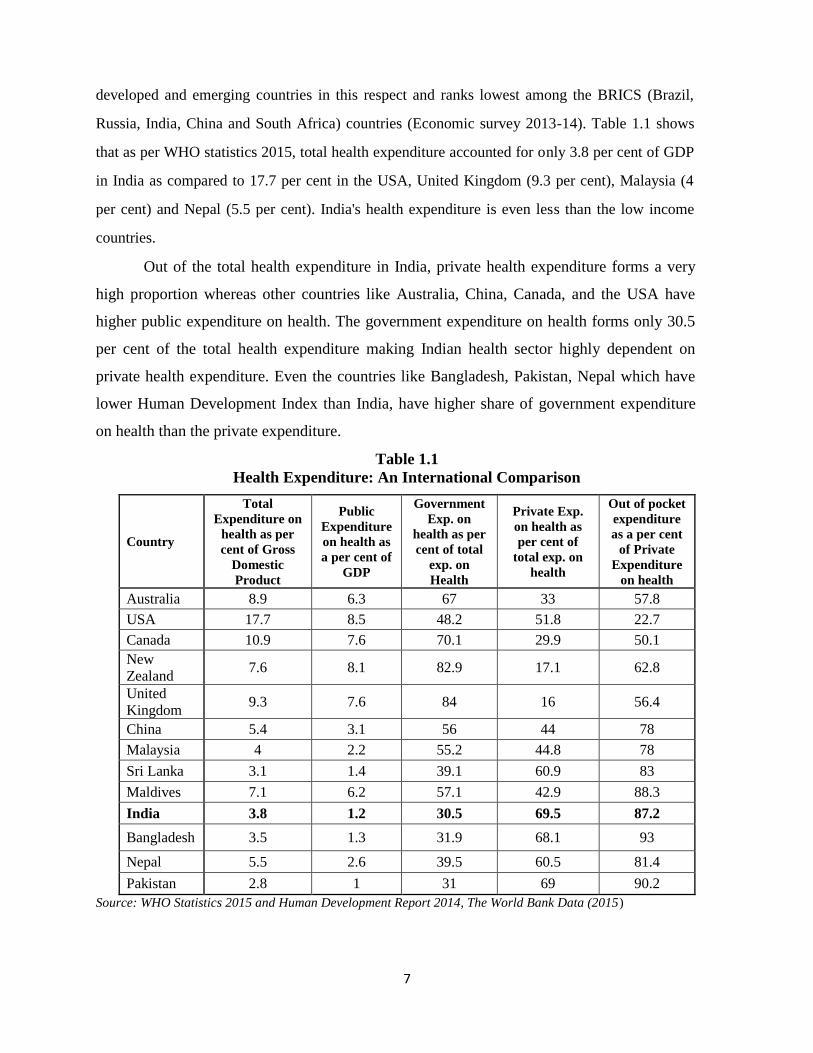
Russia, India, China and South Africa) countries (Economic survey 2013-14). Table 1.1 shows
that as per WHO statistics 2015, total health expenditure accounted for only 3.8 per cent of GDP
in India as compared to 17.7 per cent in the USA, United Kingdom (9.3 per cent), Malaysia (4
per cent) and Nepal (5.5 per cent). India's health expenditure is even less than the low income
countries.
Out of the total health expenditure in India, private health expenditure forms a very
high proportion whereas other countries like Australia, China, Canada, and the USA have
higher public expenditure on health. The government expenditure on health forms only 30.5
per cent of the total health expenditure making Indian health sector highly dependent on
private health expenditure. Even the countries like Bangladesh, Pakistan, Nepal which have
lower Human Development Index than India, have higher share of government expenditure
on health than the private expenditure.
Table 1.1
Health Expenditure: An International Comparison
Country
Total
Expenditure on
health as per
cent of Gross
Domestic
Product
Public
Expenditure
on health as
a per cent of
GDP
Government
Exp. on
health as per
cent of total
exp. on
Health
Private Exp.
on health as
per cent of
total exp. on
health
Out of pocket
expenditure
as a per cent
of Private
Expenditure
on health
Australia 8.9 6.3 67 33 57.8
USA 17.7 8.5 48.2 51.8 22.7
Canada 10.9 7.6 70.1 29.9 50.1
New
Zealand 7.6 8.1 82.9 17.1 62.8
United
Kingdom 9.3 7.6 84 16 56.4
China 5.4 3.1 56 44 78
Malaysia 4 2.2 55.2 44.8 78
Sri Lanka 3.1 1.4 39.1 60.9 83
Maldives 7.1 6.2 57.1 42.9 88.3
India 3.8 1.2 30.5 69.5 87.2
Bangladesh 3.5 1.3 31.9 68.1 93
Nepal 5.5 2.6 39.5 60.5 81.4
Pakistan 2.8 1 31 69 90.2
Source: WHO Statistics 2015 and Human Development Report 2014, The World Bank Data (2015)
8
The misery of the Indian health sector is that out of the total private health expenditure,
87.2 per cent is Out Of Pocket (OOP) expenditure, which makes it most privatised health sector
in the world (Dutta, 2012). This high proportion of out of pocket expenditure puts additional
financial burden on the poor leading to households spending a huge amount of their consumption
expenditure on health. The low level of government spending on health has resulted in low
utilisation of public health care services. Due to unavailability and inefficiency of the public
health services, the poor people have been forced to use the services of expensive and
unregulated private sector. It exposes the poor people to financial risk and sometimes even push
them in poverty. According to NSSO report, the percentage of medical conditions not treated due
to unaffordability has increased from 15 to 28 per cent in rural areas between 1986-87 and 2004
(NSSO 60th
round report). The report reveals that the major source of finance for both urban and
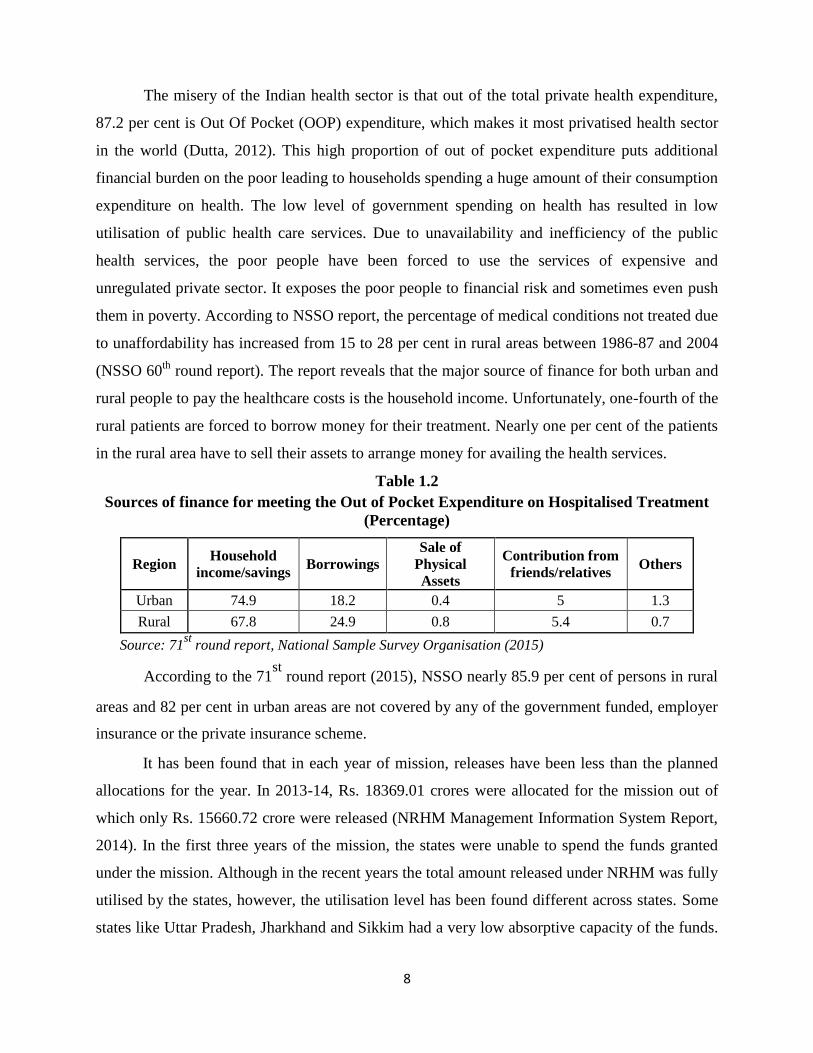
rural people to pay the healthcare costs is the household income. Unfortunately, one-fourth of the
rural patients are forced to borrow money for their treatment. Nearly one per cent of the patients
in the rural area have to sell their assets to arrange money for availing the health services.
Table 1.2
Sources of finance for meeting the Out of Pocket Expenditure on Hospitalised Treatment
(Percentage)
Region Household
income/savings Borrowings
Sale of
Physical
Assets
Contribution from
friends/relatives Others
Urban 74.9 18.2 0.4 5 1.3
Rural 67.8 24.9 0.8 5.4 0.7
Source: 71st
round report, National Sample Survey Organisation (2015)
According to the 71st
round report (2015), NSSO nearly 85.9 per cent of persons in rural
areas and 82 per cent in urban areas are not covered by any of the government funded, employer
insurance or the private insurance scheme.
It has been found that in each year of mission, releases have been less than the planned
allocations for the year. In 2013-14, Rs. 18369.01 crores were allocated for the mission out of
which only Rs. 15660.72 crore were released (NRHM Management Information System Report,
2014). In the first three years of the mission, the states were unable to spend the funds granted
under the mission. Although in the recent years the total amount released under NRHM was fully
utilised by the states, however, the utilisation level has been found different across states. Some
states like Uttar Pradesh, Jharkhand and Sikkim had a very low absorptive capacity of the funds.
9
The inability of the state governments to develop district and lower level health plans has been
identified as the major reason for poor utilisation of released amount for health services.
In order to ensure proper utilisation of the released funds, the Central Government framed a
new policy in 2012 in which the allocations were linked to the performance of the state. Till 2012,
NRHM allocations to states were inflexible and the states used to get the allocated fund irrespective
of their performance. The new policy follows 'carrot and stick' approach which aims to reward the
high performing states and to punish the poor performing states. It provides an opportunity to the
states to gain up to 30 per cent of the allocations by introducing reforms in health sector like the
supply of free generic medicines. Besides this, the states can also face a reduction in the allocation if
they fail to solve the issues like covering the shortage of health manpower. In order to avail this
opportunity, state governments need to put in efforts to introduce new reforms and improve their
performance. Since the adoption of this policy, the utilisation patterns of the states have improved
(Ghuman, Saif, 2016).
Health being a state subject, the total government expenditure on health in India comes
from two sources: Central Government (grants) and State Governments. Under NRHM the funds
are contributed by centre and state in the ratio 85:15.The goals set at the central level to increase
the proportion of public spending on health cannot be achieved without the involvement of the
states. It was estimated that to achieve the goal of 2-3 percent of expenditure on health as
percentage of GDP, the states needed to increase their health allocations by 22 per cent each
year, which was beyond the reach of the states (Berman et al., 2010). As the Indian states form
the primary source of healthcare finance, the healthcare expenditure level is more dependent on
the state health spending. Major attempt was made in Eleventh five year plan to convince the
states to spend at least 7-8 percent of total state expenditure on healthcare. However, until 2013,
the health spending by the states as a percentage of total state expenditure has remained low and
none of the states has been able to meet this target.
The interstate inequality in health spending and low per capita expenditure is another big
hurdle being faced by the Indian health sector. There are various states whose per capita public
health expenditure is lower than the national average of Rs.444. These include Bihar (Rs. 173),
Madhya Pradesh (Rs. 301), Orissa (Rs. 317), Uttar Pradesh (Rs. 328), Chhattisgarh (Rs. 338),
Rajasthan (Rs. 381), West Bengal (Rs. 421) and Assam (Rs. 434).
10
1.2.3 Highlights of National Rural Health Statistics
As on 31st March, 2018, there were 158417 Sub Centres (SCs), 25743 Primary Health Centres
(PHCs) and 5624 Community Health Centres (CHCs) functioning in the country. While the Sub
Centres and PHCs have increased in number in 2017-18 with respect to previous year, however,
there is no change in the number of CHCs. The current numbers of SCs, PHCs & CHCs are not
as per the Indian Public Health Standards (IPHS) norm.
Sub Centres (SCs)
Number of SCs had been increased by 12391 during the period 2005-2018, from 146026 in 2005
to 158417 by March 2018. There is a significant increase in the number of SCs in the States of
Rajasthan (3893), Madhya Pradesh (2318), Gujarat (1878), Chhattisgarh (1382), Karnataka
(1300), Jammu & Kashmir (1088), Odisha (761), Tripura (481), Kerala (286) and Uttarakhand
(271).
There had been an addition of 2186 Sub Centres, during the year 2017-18. Significant
increases in the number of Sub Centres have been reported in the States of Madhya Pradesh
(2000), Gujarat (71) and Karnataka (62). The increase of 2000 SCs in the State of Madhya
Pradesh is due to additional SCs sanctioned during the period.
Percentage of Sub Centres functioning in the Government buildings had increased from
49.7 per cent in 2005 to 72.2 per cent in 2018. The increase was mainly due to addition in the
number of government buildings in the States of Uttar Pradesh (11672), West Bengal (5559),
Madhya Pradesh (4294), Karnataka (3188), Rajasthan (3076), Gujarat (2835), Chhattisgarh
(2596), Maharashtra (2109), Odisha (1869), Assam (1279) and Uttarakhand (42).
There were 28091 numbers of functional Sub Centres in the tribal areas as on 31st March
2018. There were 31 per cent of SCs with separate toilet for male & female patients and 58 per
cent of SCs with toilet facility for staff. So, these statistics reveals that a lot is need to be done in
the rural health sector.
Primary Health Centres (PHCs)
Number of PHCs has increased by 2507 during the period 2005-2018, from 23236 to 27413. Mix
trend is observed in different States. In the States of Karnataka (678), Gujarat (404), Assam
(336), Rajasthan (365), Jammu & Kashmir (303) and Chhattisgarh (276) and Bihar (251) a
significant increase has been observed.
11
The analysis of data further reveals that the percentage of PHCs functioning in
government buildings has increased significantly from 78% in 2005 to 92.9 per cent in 2018.
This is mainly due to increase in the government buildings in the States of Uttar Pradesh (1681),
Karnataka (841), Gujarat (697), Rajasthan (422), Madhya Pradesh (418), Chhattisgarh (351),
Assam (331), Maharashtra (255) and Himachal Pradesh (120).
There were 3971 numbers of functional PHCs in the tribal areas as on 31st March 2018.
There were 20 per cent of PHCs with separate toilet for male & female patients and 82 per cent
of PHCs with toilet facility for Staff. So, again all is not well in regard to the provision of basic
facility like toilets for the patients in the PHCs.
Community Health Centres (CHCs)
Number of CHCs has also increased by 2278 during the period 2005-2018. Significant increase
was observed in the States of Uttar Pradesh (436), Tamil Nadu (350), West Bengal (253),
Rajasthan (253), Odisha (146), Jharkhand (124), Kerala (121), Gujarat (91) and Madhya Pradesh
(80).
However, no change has been found in the total number of CHCs as on March 2018 as
compared to the number reported on March, 2017 i.e 5624. Minor increase was observed in the
State of Assam (14), Rajasthan (9) and Odisha (7), however, comparative fall is also noticed in
few states.
Number of CHCs functioning in government buildings has also increased during the
period 2005-2018. The percentage of CHCs in Govt. buildings has increased from 91.6 per cent
in 2005 to 99.2 per cent in 2018 over the period of 13 years.
There were 1017 numbers of functional CHCs in the tribal areas as on 31st March 2018.
Analysis of data further reveals that 89 per cent of CHCs were having separate toilet for male &
female patients and 88 per cent of CHCs were with toilet facility for Staff.
Developments Relating to the Manpower in Public Health Sector
Number of HW (F) / ANM at Sub Centres and PHCs has increased from 133194 in 2005 to
219326 in 2018 which amounts to an increase of about 64.7 per cent. As on 31st March, 2018 the
overall shortfall in the posts of HW(F) / ANM at SCs & PHCs was 5.9 per cent of the total
requirement as per IPHS norms.
12
The number of allopathic doctors at PHCs has increased from 20308 in 2005 to 27567 in
2018, which is about 35.7 per cent increase. A shortfall of allopathic doctors in PHCs was 14.3
per cent of the total requirement for existing infrastructure.
Regarding the specialist doctors at CHCs, the number has been decreased marginally
from 4156 in 2017 to 4074 in 2018. A mix trend has been observed in all the states. Reduction
has been noticed in the states of Uttar Pradesh (292), Punjab (98), Odisha (65) and Maharashtra
(23). However increase has been observed in the states of Tamil Nadu (132), Madhya Pradesh
(68), Rajasthan (68), Jammu & Kashmir (65) and Andhra Pradesh (36). The shortfall has also
been noticed in case of surgeons (84.6 per cent), obstetricians & gynecologists (74.7 per cent),
physicians (85.7 per cent) and pediatricians (82.6 per cent). Overall, there is a shortfall of 81.9
per cent specialists at CHCs during the year 2018 in comparison with the IPHS norms. However,
significant increase in the number of paramedical staff has been observed in 2018 as compared to
the position of 2005.
1.2.4 The Empirical Evidences of Poor Health Scenario in India
The different aspects of public health care system which have been examined by the
researchers in India till date and are relevant to the present study are presented briefly in the
following discussion:
Jeffery (1988) reviewed health care policy of India and appreciated the consistent efforts
of Indian government for the allocation of resources to rural health, preventive medicine and
paramedical training. He pointed out the successful fight of government against diseases like
smallpox. Further, the study found that although better quality of care is provided to higher
castes but the poor people in rural India have not been excluded. He concluded that “a movement
toward greater equity in health care is only present in those states which are relatively free of
class domination and where the landless poor play a critical role in local politics”.
Considering the significance of proper utilization of existing health facilities, Basu (1990)
argued that simply the provision of health care services doesn‟t ensure its proper utilization by
public. The study hypothesized that “cultural or regional identity has an important bearing on the
knowledge, attitudes, and practices relevant to the use of health care facilities”. Data were
collected from the poor households of two culturally distinct regional groups but settled at Delhi,
These were people from Uttar Pradesh and Tamil Nadu that represents contrasting north India
and south India culture. The two study groups were having similarities in their socioeconomic
status, locality and thus having access to same health services available in that area. Findings of
13
the study revealed that as far as treatment of normal diseases, respondents from both groups
shown strong reliance on modern medicine especially from private practitioners. But in case of
specialised medical needs important cultural differentials surfaced for medical services sought.
For instance, at the time of childbirth, in case of rural Uttar Pradesh, around 94 percent births had
been delivered by untrained personnel, whereas in case of rural Tamil Nadu the figure was 50
percent.
Kethineni (1991) analysed the health care system in India by examining the distribution
of resources between various sectors (preventive and curative), between rural and urban areas
and finally between different regions. The study found that nearly55 per cent of public
expenditure on health services is spent on curative health care and medical education. The share
of public health services is just one-third of total expenditure and rest amount spent on family-
welfare programmes. The study also found contradictions in health policy documents and actual
practice. For instance, the real emphasis is on producing highly specialised manpower in curative
services whereas health policy documents kept on repeating the need for creating physicians in
social and preventive medicine and paramedical personnel. This difference in theory and practice
results numerous negative consequences like (a) more than one doctor per nurse instead of
having several nurses per doctor, (b) more doctors per person rather than having more health
visitor or midwife per person, (c) trained doctors‟ intent to settle down in urban areas rather than
serving rural poor who lack even basic medical services, (d) focus on sophisticated diseases of
international repute such as heart related diseases, cancer, AIDS rather than focus on diseases
like malaria, leprosy etc. which are more relevant to Indian health.
Bhat (1993) examined the growth of the private health sector in India. The study found
that a huge amount was spent in private health sector. The study highlighted the potential of
private sector in preventive as well as curative health sector. The author emphasized on more
investment in R&D in health sector as well as medical technology so that in future cost on
healthcare services can be reduced with enhanced quality. In the end the study suggested for
monitoring of investment in health sector by concerned government bodies along with financial
incentives in order to reduce urban rural disparities for doctors and basic healthcare
infrastructure.
Purohit and Siddiqui (1994) observed that the pattern of utilisation in our country had
some-desirable outcomes, namely, growing popularity of indigenous non - allopathic systems
and growth in private sector's involvement in expensive tertiary care. As against the National
14
Health Policy guidelines the regional disparities in health service utilisation among different
expenditure groups of states as well as rural-urban disparities tend to continue. Further, in spite
of inadequacy of health services and prevalence of inequality in utilisation, there has been no
serious governmental initiative to encourage appropriate utilisation by means of devising health
insurance and other cost recovery mechanisms.
Bhat (1996) examined the attentiveness of healthcare providers upon the implementation
of Consumer Protection Act in health sector. Data was collected with the help of a structured
questionnaire from a sample of 130 private health care providers of Ahmedabad (India). The
findings of the study revealed that in comparison to other acts in health sector doctors were
found to be more aware of Consumer Protection Act. In addition, the doctors raised their concern
regarding the protection of patients as after the implementation of this Act could raise fee of
doctors, prescription of more medicines, more diagnostic costs etc. Apart from all these patients
may stay away from using their consumer rights due to cost of filing complaints in consumer
courts.
Duggal (1997) argued that a meaningful analysis of health budgets can only be made in
the context of the direct and indirect encouragement given by the state to the growth of the
private sector in health services. First, the slowing down of state investment in the hospital sector
and the subsidies, soft loans and duty and tax exemptions offered; second, the creation of a
market for modern health care through the setting up of PHCs and cottage hospitals in the rural
areas; and third, the consistent expansion in highly qualified medical personnel who could not be
absorbed in the state sector.
Yesudian (1999) also reported that there are numerous misconceptions among the poor
about the utilisation patterns of health care which has led to the formulation of inapt urban health
services. The study conducted a survey of utilisation patterns of health services among the poor
in two areas in Mumbai and identified that there are four factors, namely, cost of services,
proximity, convenience of timing and perceived quality of health care services which influence
the utilisation pattern of health service. Further, the study found that the poor preferred availing
health care services from private sector over public sector municipal health services as they
perceive quality of private health care is superior than its counterpart.
Ellis et al. (2000) stated that there are growing evidences that the level of health care
spending in India as a percentage of its total GDP is considerably higher than that in many other
developing countries. It further suggests that more than three-quarters of this spending includes
15
private 'out-of-pocket expenses'. Despite such a high share of expenditure by individuals, the
provision of health care, that is adequate in terms of quality and access, is becoming more and
more problematic. Particularly, public delivery of health care is poor in quality, presumably for
reasons of inadequate financing.
Qadeer (2000) examined the reforms brought by Indian government in health sector. The
study throw the light on structural adjustment programmes initiated in health sector on the
directions from World Bank and IMF brought two kinds of changes in health sector, these were,
(i) reduction in the government allocations, and (ii) enlarged role of private sector. Due to
reduction in the government spending on health sector the research work of Indian Council of
Medical Research suffered badly. In this end, the author suggested that (i) government
expenditure in health sector must be at least up to 2-3 per cent of GDP, (ii) decentralisation in
health sector with more powers to local levels/ Panchayati Raj Institutions.
Bhat (2000) observed that public-private partnerships in the health sector can bring
needed resources while also taking care that the vulnerable groups - the poor and rural
populations - have access to health facilities. However, he emphasized that the government must
clarify its policy towards the private sector and ensures that public spending on health does not
decline.
Peterset al. (2002) pointed out although India has build up a huge network of public
health care, yet public spending on health is very less or rather stagnant over the years in terms
of spending on health as percentage of GDP. Further the study identified that discrepancy in
health financing among Indian states widened the gap in public resources for health between rich
and poor states. For instance, Kerala, Tamil Nadu and Punjab have double the per capita public
health spending than that of Bihar and Madhya Pradesh. In quite similar to other nations‟
approach India too gave low priority topublic spending on preventive health services than
curative care which are pro-rich in division. Furthermore the study found that in India private
health care spending accounts for more than 80 percent of total health spending which is one of
the highest proportions of private spending in the world. Moreover, most of private spending is
out-of-pocket.
Gokhale et al. (2002) examined the influence of female literacy on the reduction of infant
mortality rate. Data was collected from 317 mothers. Results reveal that illiteracy among females
was related with all maternal care as well as infant mortality rate. Further the authors grouped the
Indian states into best, medium, and worst on the basis of female illiteracy. The study found that
16
IMR was significantly higher among the worst group than that among the medium and the best.
Furthermore, the study found that ill effects of female illiteracy were more detrimental in the
rural areas in comparison to urban areas. In the end, the study advocated for the essential steps
need to be taken in order to have health benefits in the long run like free education to girls etc.
Priya et al. (2004) examined the adoption of tough measures towards “an Indian model of
reforms” in health care services, which is essential for becoming „world class‟. The authors
cautioned that by simply raising amount of funds for the ongoing programmes will not serve
purpose of improving health if it is not supplemented by reforms in content, functioning and
overall revamping of structure of public health care services. For effective
restructuring/functioning of health services in public sector, the authors suggested the
strengthening of capacities at district level, rational utilization of existing infrastructure and
human resources by aligning block, district and state level health care, ensuring sufficient supply
of vital drugs and basic medical equipment, revamping administrative measures along with a
review of medical education so as to enhance understanding towards public health matters.
Paul et al. (2004) observed that India has made considerable progress in the area of health
care during the last five decades. The crude birth rate per 1,000 population, which was 40.8 in
1951, has declined to 25.8 by 2000. Similarly, infant mortality rate (per 1,000 live births)
declined to 68 as compared to 146 in 1951. The number of sub-centres, PHCs and CHCs
increased from 725 in 1951 to 57,363 in 1981 and further to 1,63,181 in 1999. The number of
dispensaries and hospitals increased from 9,209 in 1951 to 23,555 in 1981 and further to 43,322
in 1996. Among the major states, Gujarat, Kerala, Karnataka and Tamil Nadu have relatively
better coverage of health facilities. However, most of the states appear to have more or less
fulfilled at an aggregate level, the stipulated norms for providing the health facilities (one sub-
centre per 5,000 population in plain areas and per 3,000 population in tribal and hilly areas; one
PHC per 30,000 population in plain areas and per 20,000 population in hilly and tribal areas). As
a result of all these developments, the urban population has better access to health services
compared to the rural population. Further, the extent of access to and utilization of health care
has varied substantially between states, districts and different segments of society (Economic
Survey, 2002-03). The authors emphasized that although the government has provided a large
network of health institutions, the extent and frequency of the utilisation of these facilities is
considerably low. Several factors might have come in the way of the utilisation of public health
services such as distance, shortage of health personnel and medicines, absence of doctors, poor
17
quality of services, unhygienic atmosphere, inappropriate behaviour of health staff and
corruption.
Ahuja (2004) examined health insurance for the poor in India and found that instead of
government or market based insurance, community based health insurance (CBHI) is the most
suitable method of reaching the poor living in developing countries. Considering the importance
of CBHI in comparison to other methods/schemes the author advocated that depending upon the
health needs of target, CBHI can take different suitable forms. The study concluded by stressing
the need of appropriate regulatory changes that can reduce the risks and convert the potential
benefits into gains for the poor.
According to Gupta (2005) the public health services, which reduce a population's
exposure to disease through such measures as sanitation and vector control, are an essential part
of a country's development infrastructure. The author observed that in India, policies have
focused largely on medical services. Public health services, and even implementation of basic
public health regulations, have been neglected so far.
Sengupta and Nundy (2005) argued that although private health sector in India is growing
at the cost of public health care, but the two issues cannot be messed up together. Citing the
example of necessity of simultaneous development in two extreme areas like potable drinking
water and electricity for each village in India along with building of rockets, the authors stressed
for simultaneous development in different areas and same for healthcare industry too. For
instance, foreign exchange earned through medical tourism will generate certainly boost India's
economy, that can in turn lift up standard of healthcare facilities. In the end, the study
emphasises for adopting a systematic approach to ensure that a part of the funds is channelized
towards primary health care and increase in the budget allocation for health sector shouldn‟t be
at the cost of new source of national income.
Chaudary (2006) examined the public health expenditure of those states in India which
had low Gross State Domestic Product (GSDP). The findings of the study showed that low
income states (e.g., Rajasthan, Bihar, Orissa, Assam etc.) had very poor health status. Moreover,
these states were not capable of raising financial resources for healthcare in future also, thus,
impacting overall Indian health status. In the end, the study stressed for government attention for
the needy states for the improvement in health scenario in India.
Considering rising health divide between rich and poor countries and between rich and
poor within the countries Athreya and Rao (2006) argued that these health inequalities are the
18
results of structural adjustment and reforms in health sector introduced on the advice of World
Bank and IMF. As a result of these reforms, the commitment of State for health sector reduced
and interventions introduced were not organized one. Citing some specific examples authors
highlighted that rather than focusing on proper water supply and sanitation, focus was on ORS
for diarrhea, similarly anemia was taken care only during pregnancy, care was not initiated for
general population and nutritious food was never on the priority list. Another issue was high
OOP expenditure especially in those states where public health care infrastructure was not
properly built up. For instance cost of treatment was found highest in Punjab, Haryana, Uttar
Pradesh and least in Kerala, West Bengal and Tamil Nadu.
Hammer et al. (2007) investigated the government and private healthcare sector in India,
namely, in the two categories, (i) preventive and promotive, and (ii) curative health care. The
study revealed that in case of preventive healthcare the programmes focused equally on poor and
rich. Whereas, in case of curative healthcare services, it was found that there was shortage of
staff, absenteeism of health workers, untrained staff, lack of courtesy and care for patients in the
primary health centres. Lack of accountability was identified as the main reason for the failure of
government health schemes. In the end, the study suggested that needs of patients should be
given priority while designing policies in health sector and healthcare personnel should be
provided with attractive incentives.
Selvaraj and Karan (2009) compared the public and private treatment costs and reported
that on an average private health care is one and half times more costly than public health care
for outpatient treatments. Whereas in case of hospitalisation, cost of treatment in private
healthcare facilities is more than twice in comparison to public health care. Moreover, the
government facilities force the patients to obtain drugs and get diagnostic services from private
sector providers. Regarding rural-urban difference of per episode expenditure, in case of
outpatient care, expenditure in the public sector is more or less similar both in rural and urban
areas. In case of inpatient care, per episode expenditure in public healthcare is only slightly
higher for urban patients. However, huge rural-urban difference was visible in case of private
health facilities as significantly higher per episode expenses incurred by people living in urban
areas.
Baru et al. (2010) examined the inequities in access to health care services in India and
found large inequities exist even today and moreover widened their base between rural and urban
areas and further within the different communities. The authors found the presence of three kinds
19
of inequities which have ruled health sector in India. These are (i) historical inequities (these are
based on the policies of British India which still continued), (ii) socio-economic inequities (due
to caste, gender and class differentials) and (iii) lastly those inequities which lie in the
availability and affordability of health care services.
Lalneizo and Reddy (2010) examined the child health status in North Eastern states of
India. The findings revealed that in these states the child health indicators (IMR and under five
mortality) were found to be much better when compared to all India average. Further the study
found good breast feeding practices in North Eastern States. However, immunization coverage
was found to be poor and high morbidity levels and Vitamin A supplement was less available.
But these states rely on Vitamin A rich foods.
Rai and Usha (2010) highlighted that every year 60,000 to 70,000 maternal deaths occur
in India and 20 to 30 times more women become very ill due to pregnancy, childbirth or
abortions. Women die because they are unable to access good quality affordable and specialized
care. It was estimated that one in 48 pregnant women run the risk of dying during childbirth. The
situation becomes alarming in tribal population and among the marginalized living in prolated
pockets of the counting. The study further estimated that 87 percent of pregnant women were
found anemic which accounted for 20 to 40 percent of the maternal deaths.
Radha (2011) argued that although India as a nation has been growing economically at a
rapid pace particularly after the advent of New Economic Policy of 1991 but this rapid economic
development has not been accompanied by social development particularly health sector
development. According to the author, “the health sector in India has been accorded very low
priority in terms of allocation of resources. Public expenditure on health was recorded less than 1
per cent of GDP in India which further declined during the post economic liberalization period.
The meager resource allocation to health sector has adversely affected both access and quality of
health services. The unequal access to health services is reported across strata, gender and
location (i.e. urban and rural areas). With a view to improve access and quality of health
services, government should enhance public spending on health sector in the vicinity of 3 per
cent of GDP. Today, the healthcare system in India faces a challenge in raising the service
quality and ensuring equitable access to people while simultaneously gearing up its capabilities
to tackle the changing disease incidence profiles. This challenge needs to be addressed through a
concerted effort of both public and private sectors by their agreeing on suitable public policy
20
initiatives which incentivize financing and provision of healthcare, and thereby increase
healthcare access to the people”.
Deosthali et al (2011) investigated standards of care in 216 small, private hospitals (less
than 30 beds) in Maharashtra, with a focus on maternity care. Data was collected with the help of
interviews of hospitals' owners or senior staff, and personal observation. The study found overall
poor standards of care in most of the hospitals. Specifically, authors observed few or no qualified
nurses or a medical officer, most of the hospitals did not have a qualified midwife, in so called
emergency care, only 3 hospitals had a blood bank and only 8 had an ambulance service. The
study stressed on the enforcement existing of regulations on the healthcare services providers.
Joshi (2011) conducted a study on needs of old people in India and found that health
system network for an old person is in very poor shape. Moreover, old people don‟t have access
to any particular health care programmes of government except the employees retired from
organized sector who get medical facilities. However, individuals belonging to unorganized or
informal sector face difficulties in getting proper health attention due to poor financial
conditions. Further, the study found that most of the aged people have to rely on government
hospitals, charitable hospitals, and PHCs for health checkups. But these facilities lack in quality
care due to which mostly aged people remained deprived of good health facility. In addition,
introduction of user charges as a part of structural reforms has added more to their woes.
Radha (2011) argued that although India as a nation has been growing economically at a
rapid pace particularly after the advent of New Economic Policy of 1991 but this rapid economic
development has not been accompanied by social development particularly health sector
development. According to the author, “the health sector in India has been accorded very low
priority in terms of allocation of resources. Public expenditure on health was less than 1 per cent
of GDP in India. It has further witnessed decline during the post economic liberalization period.
The meager resource allocation to health sector has adversely affected both access and quality of
health services. The unequal access to health services is reported across strata, gender and
location (i.e. urban and rural areas).
Kumar and Prakash (2012) examined the differences in utilization of health care services
provided by the public and private sectors in India along with differences in utilization of health
services region/state wise. The study found that utilization of public health care services mainly
depend upon the provision of subsidized services provided by government. In addition the
findings revealed that drive behind utilization of public services seems to be most likely to avail
21
government‟s free services or medicines etc. Further, the study identified inclination towards the
use of private health services due to perception of poor and in adequate public health care
services. Regarding state wise utilization of health services the results revealed that in states like
Assam, Chhattisgarh, Jharkhand and Madhya Pradesh highest proportion of people utilized
public health care services. In the end the study stresses for affordable and better quality health
care services for common man.
Singh (2012) investigated availability and role of public health care services provided by
public sector in Thar Desert of India. The study also explored the main reasons behind the high
dependency on quacks. With the help of a structured questionnaire data was collected by
conducting in-depth interviews of 610 respondents. The study found inadequacy in the number
of CHCs/PHCs/Sub-centres in the Thar Desert in order to meet the health needs of entire
population of this area. The study concluded that the illiteracy, poverty, lack of transportation
facilities push people towards quacks for medical help.
Sengupta and Chatterjee (2013) examined the end of life care within the framework of
public health in India. The study investigated four possible health care settings, i.e., primary,
hospital, palliative and home. Findings of the study reported that at the primary level,
information deficit occurs as it has low capacity to identify the dying process and thus put
limitations on providing long term care at this level. Thus mostly hospitals are the main place for
dying. Next are the palliative centres which are known for cost-effective services during end-of-
life. However, they are very few in India and mainly concerned for providing pain relief.Lastly,
home is not recognised as conducive place for dying as care givers are not properly trained and
well-equipped. A fragmented health care system does not qualify home as a conducive place for
dying either. The study concluded that health care in India is not well-prepared yet to deliver
quality end of life care.
Bajpai (2014) stated that even after the setting up of National Rural Health Mission
(NRHM) since 2005, the public health system in India was still struggling with numerous
challenges. The study identified the key challenges, namely, (i) deficiency in infrastructure (it
includes basic infrastructure also like safe drinking water, paramedical workforce, beds,
electricity etc.), (ii) deficiency of human resources (it includes deficiency of manpower at
various levels like between rural & urban, between public & private sectors, between different
regions), (iii) high patients load (due to rise in unplanned cities and ever growing urban
population, lack of purchasing power of migrants in cities etc.), (iv) lack of quality of healthcare
22
services (due to more liberal polices for private healthcare and even outsourcing of public health
service) and (v) high out of pocket expenditure (due to less spending on healthcare by Indian
government). In regard to these challenges, the author suggested some measures that need to be
undertaken to cure public health system in India. These includes (i) on the pattern of defence
personnel, provision of living and working conditions in the peripheral areas that would motivate
the doctors and other health staff to serve rural areas. Taking care of family and kids of health
care team will surely enhance their job involvement, (ii) prompt filling of vacant posts in the
health sector and fast response in administrative tasks, (iii) mandatory rural service immediately
after medical graduation and strictly no waiver in this rule, (iv) enhanced capacity of health
facilities so as to absorb maximum health care workers, and (v) regular training cum workshops
for paramedical personnel.
Section – III
1.3 The Status of Health Services in India as per National Health Policy: Situation
Analyses, 2017
Report on Situation Analyses carried-out by the Ministry of Health and Family Welfare,
Government of India prepared a background paper for the preparation of the National Health
Policy, 2017. The government of India appointed experts to analyse the ground realities of health
system working at the national and the state level. The main highlights of this report are
presented in this section. Further, the major highlights of the National Health Policy, 2017
prepared by the Ministry of Health and Family Welfare, Government of India is also presented in
this section.
The paper has highlighted that India is close to reaching the MDGs with respect to
maternal and under 5 mortality rate. MDG-5 target was to reduce MM Ratio (MMR) by three
quarters between 1990 and 2015. From a baseline of 556 in 1990, India has achieved MMR of
167 by 2011-13. However, the rate of decline of still-births and neo-natal mortality has been
slow. The report also noticed inter and intra state variations. For instance, under 5 Mortality rate
ranges from 73 (Assam) to 12 (Kerala). Madhya Pradesh has wide disparity in Infant Mortality
Rate with Indore at 37 and Panna at 85.
Nutrition status has been considered another important underlying cause of mortality and
morbidity especially among young children. MDGs for eradicating hunger states that proportion
of underweight children should have decreased by 26 per cent by 2015. However, India has been
able to reduce proportion of underweight children below five years of age to 29.4 per cent in
23
2013-14 from the estimated 52 per cent in 1990. Further, percentage of underweight children <3
years was higher in rural areas (44 per cent) as compared to urban areas (30 per cent). The inter-
state variations are also visible. India has also shown consistent improvement in population
stabilization, with a decrease in decadal growth rate both in percentage and absolute numbers.
However, the persistent challenge on the population stabilization front is the declining
sex ratio. India has child sex ratio (0-6 years) of 919 females per 1000 males and it is worse in
urban areas with 905 females as compared to rural areas (923).
The report noted that India is currently experiencing rapid health transition. Overall,
communicable diseases (CDs) contribute 28 per cent of the entire disease burden, while non-
communicable diseases (60 per cent) and injuries (12 per cent) now constitute the bulk of the
country‟s disease burden. Anemia in women is another area of concern and it has a multiplier
effect through birth of low weight babies, which affects the mental and physical growth in
children.
The rising occurrence of non-communicable diseases in India has been highlighted as a
major public heath challenge. WHO estimates that these diseases (with mostly preventable risk
factors) account for 60 per cent of all deaths and significant morbidity in India. The report
further mentioned that so, for the occupational health needs were largely unaddressed in both
formal and informal sector. Like nutrition, adolescent health also has an inter-generational effect.
70 per cent of adult deaths from non-communicable diseases were linked to risk factors that start
in adolescence.
The situation analysis noted that there has been a steady rise in mental illness in the
country. According to a recent publication one in every four women and 10 per cent men suffer
from depression in India. Increase in the life expectancy has increased the requirement of
geriatric care. The elderly (above 60 years) comprise 103.8 million or 8.6 per cent of total
population and 8 per cent of them are confined to bed or in home. The preventive aspect needs to
be adequately addressed through assessing the impact of existing and future non-health sector
programmes and policies through the health lens.
The report noted that a high degree of inequity in health outcomes and access to health
care services exist in India. So, there is a need to address the existing inequities in health
outcomes between and within states in India. Even in states where overall averages are
improving, marginalized communities and poorer economic quintiles of the population,
especially in remote and tribal areas, continue to perform poorly.
24
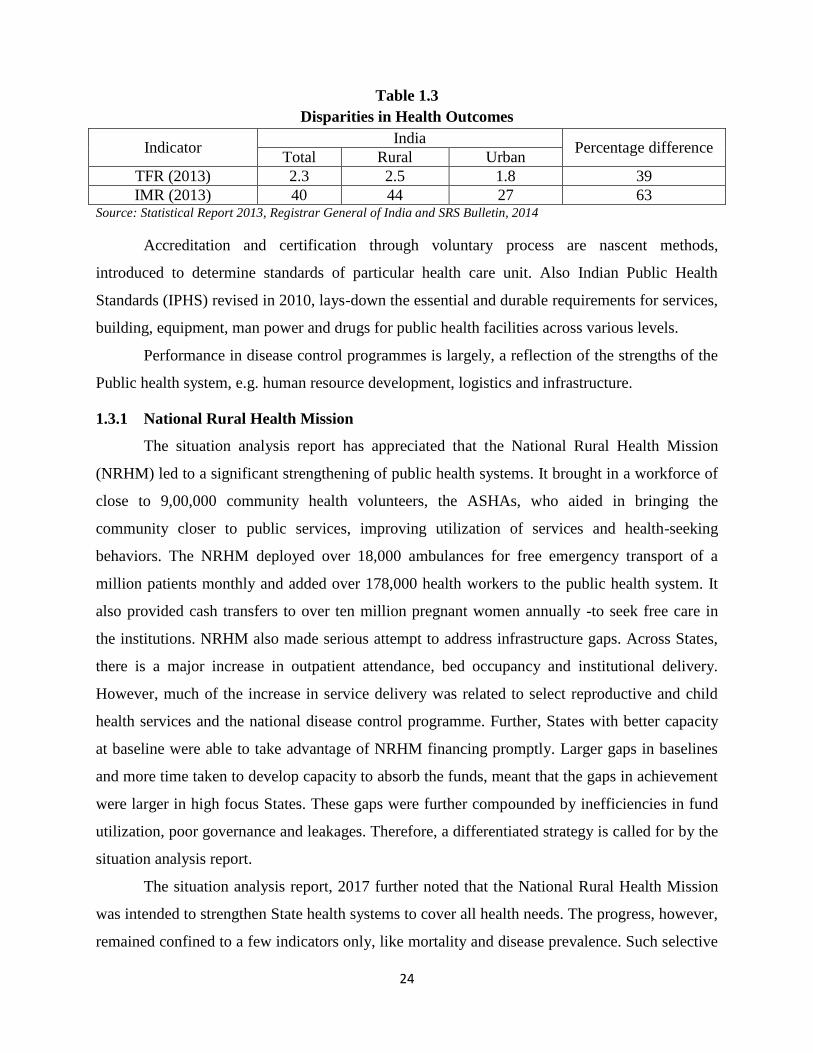
Table 1.3
Disparities in Health Outcomes
Indicator India
Percentage difference Total Rural Urban
TFR (2013) 2.3 2.5 1.8 39
IMR (2013) 40 44 27 63 Source: Statistical Report 2013, Registrar General of India and SRS Bulletin, 2014
Accreditation and certification through voluntary process are nascent methods,
introduced to determine standards of particular health care unit. Also Indian Public Health
Standards (IPHS) revised in 2010, lays-down the essential and durable requirements for services,
building, equipment, man power and drugs for public health facilities across various levels.
Performance in disease control programmes is largely, a reflection of the strengths of the
Public health system, e.g. human resource development, logistics and infrastructure.
1.3.1 National Rural Health Mission
The situation analysis report has appreciated that the National Rural Health Mission
(NRHM) led to a significant strengthening of public health systems. It brought in a workforce of
close to 9,00,000 community health volunteers, the ASHAs, who aided in bringing the
community closer to public services, improving utilization of services and health-seeking
behaviors. The NRHM deployed over 18,000 ambulances for free emergency transport of a
million patients monthly and added over 178,000 health workers to the public health system. It
also provided cash transfers to over ten million pregnant women annually -to seek free care in
the institutions. NRHM also made serious attempt to address infrastructure gaps. Across States,
there is a major increase in outpatient attendance, bed occupancy and institutional delivery.
However, much of the increase in service delivery was related to select reproductive and child
health services and the national disease control programme. Further, States with better capacity
at baseline were able to take advantage of NRHM financing promptly. Larger gaps in baselines
and more time taken to develop capacity to absorb the funds, meant that the gaps in achievement
were larger in high focus States. These gaps were further compounded by inefficiencies in fund
utilization, poor governance and leakages. Therefore, a differentiated strategy is called for by the
situation analysis report.
The situation analysis report, 2017 further noted that the National Rural Health Mission
was intended to strengthen State health systems to cover all health needs. The progress, however,
remained confined to a few indicators only, like mortality and disease prevalence. Such selective
25
focus and facility development is clearly not efficient. Strengthening health systems for
providing comprehensive care requires higher levels of investment and human resources, than
were made available. The budgetary support and the expenditure was only about 40 per cent of
what was envisaged for a fully revitalised NRHM Framework.
1.3.2 Urban Health Scenario
Rapid and unplanned urbanization has led to massive growth in the number of the urban
poor, including migrant populations. This section of the population has poorer health outcomes
due to adverse social determinants and poor access to health care facilities, despite living in close
proximity to many hospitals - public and private. As a matter of fact, primary healthcare in many
urban areas require considerable strengthening. The National Urban Health Mission (NUHM),
introduced in 2013, has a strong focus on primary care especially for urban poor and vulnerable
population. NUHM aims at strengthening primary health care- through additional ANMs, urban
ASHAs, women‟s health committees, a network of primary health centers and inter-sectoral
convergence. However, substantial expansion on a sustained basis is required to improve urban
health.
1.3.3 Cost of care and Financial Protection
The fact, however, remains that inability to cover the entire spectrum of health care needs,
through increased public investment has led to a rise in the out of pocket expenditure and
consequent impoverishment. The analysis highlighted that over 63 million persons are pushed to
poverty every year due to health care costs. In 2011-12, the share of out of pocket expenditure on
health care as a proportion of total household monthly per capita expenditure was 6.9 per cent in
rural areas and 5.5 per cent in urban areas. This led to an increasing number of households facing
catastrophic expenditures due to health costs (18 per cent of all households in 2011-12 as
compared to 15 per cent in 2004-05). It has been observed that, in 2014 the average amount
spent per child birth as inpatient in private hospitals was nine times that spent in public hospitals
for both rural and urban areas across all quintiles. Under NRHM, free care in public hospitals
was extended to a select set of conditions. User fees on all other services especially for
diagnostics, as also the purchase of drugs added to the cost of care. Several essential services,
especially for chronic illnesses, were only available at overcrowded district and medical college
hospitals - resulting in physical and financial hardship and poor quality of care.
26
1.3.4 Publically Financed Health Insurance
The Central Government launched the Rashtriya Swasthya Bima Yojana (RSBY) in 2008. The
population coverage under these various schemes expanded from almost 55 million in 2003-04
to about 370 million in 2014 (almost one-fourth of the population). Nearly two thirds (180
million) of this population were those in the Below Poverty Line (BPL) category. Evaluations
show that schemes such as the RSBY, have improved utilization of hospital services, especially
in private sector and among the poorest 20 per cent of households and SC/ST households.
1.3.5 Regulatory Role of Government
The Government‟s regulatory role has been extended to the regulation of drugs through the
CDSCO, the regulation of food safety through the office of the Food Safety and Standards
Authority of India, support to the regulation of professional education through the six
professional councils and the regulation of clinical establishments by the National Council for
the same. Progress in each of these areas has been challenging. Some of the challenges relate to
institutional strengthening as also the mechanisms of institutional governance, which may
sometimes require amendments to the laws. Regulation of drug pricing is under the Department
of Pharmaceuticals which has been playing an active and effective role in monitoring of drug
prices and its implementation. Reforms in each of these areas, especially in professional councils
and clinical establishments are facing resistance from certain stakeholders. Considerable political
leadership and public support would be required to implement these reforms. But clearly, as
private industry grows rapidly and quality health care for all is envisioned, the Government
needs to find ways to move forward on these responsibilities.
1.3.6 Investment in Health Care
The report noted that despite years of strong economic growth and increased health spending by
the Government in the 11th Five Year plan period, the total spending on healthcare in 2013-14 in
the country was just about 4.02 per cent of GDP. Global evidence on health spending shows that,
unless a country spends at least 5–6 per cent of its GDP on health with Government expenditure
being a major part, basic health care needs are seldom met. The Government spending on
healthcare in India is only 1.15 per cent of GDP. This is 3.8 per cent of total Government
expenditure and accounts for 28.6 per cent of total health spending. This translates in absolute
terms to Rs. 1042 per capita at current market prices. The Union Government share of this is
only Rs. 365 per capita (0.40 per cent GDP) while State Government share translates to about
27
Rs. 677 per capita (0.75 per cent of GDP) at base line scenario. Perhaps the single most
important policy pronouncement of the National Health Policy 2002 articulated in the 10th, 11th
and 12th Five Year Plans, and in the NRHM Framework, was the decision to increase public
health expenditure to 2 per cent to 3 per cent of the GDP. As a result, public health expenditure
rose briskly in the first few years of the NRHM, but at the peak of its performance it started
stagnating at about 1.04 per cent of the GDP.
Though there is always space to generate some more value for the money, it is unrealistic
to expect achieving key goals in a Five Year Plan on half the estimated and sanctioned budget.
The failure to attain threshold minimum levels of public health expenditure, remains the single
most important constraint. While it is important to recognize the growth and potential of a
rapidly expanding private sector, international experience (as evidenced from the table 1.4)
shows that health outcomes and financial protection are closely related to absolute and relative
levels of public health expenditure.
Among the developing countries (Table-1.4), two nations, Brazil and Thailand, are
considered to have achieved close to universal health coverage- Thailand at 3.2 per cent has
almost the same percent of total health expenditure to GDP as India, but its proportion of public
health expenditure is 77.7 per cent of total health expenditures, which results from a form of
strategic purchasing in which about 95 per cent is purchased from public health care facilities.
This is what gives its public health system such a high efficiency. Brazil spends 9 per cent of its
GDP on health of which public health expenditure constitutes 4.1 per cent of the GDP and 45.7
per cent of total health expenditure. This public health expenditure accounts for almost 75 per
cent of all health care provision. Most expert groups have estimated 2.5 per cent as being
realistic and achievable public health expenditure target. At such levels of expenditure,
“purchasing,” would have to be mainly from public health providers for efficient use of
resources with purchasing from private providers only for supplementation.
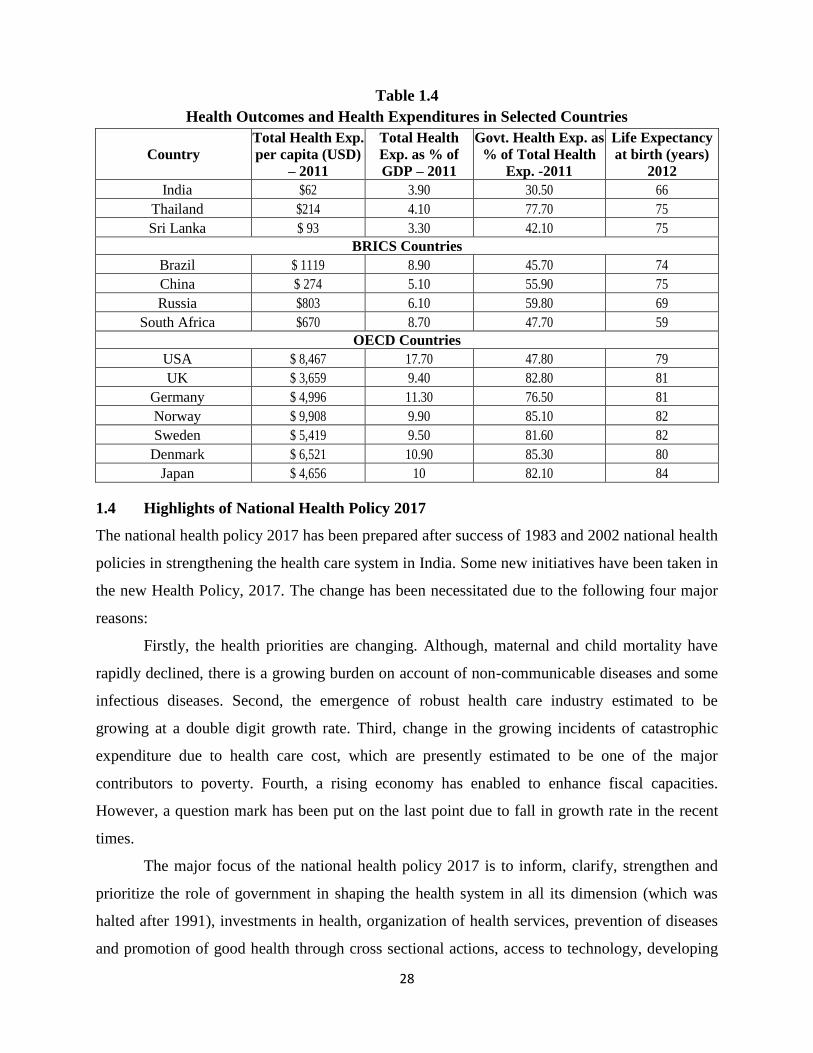
28
Table 1.4
Health Outcomes and Health Expenditures in Selected Countries
Country
Total Health Exp.
per capita (USD)
– 2011
Total Health
Exp. as % of
GDP – 2011
Govt. Health Exp. as
% of Total Health
Exp. -2011
Life Expectancy
at birth (years)
2012
India $62 3.90 30.50 66
Thailand $214 4.10 77.70 75
Sri Lanka $ 93 3.30 42.10 75
BRICS Countries
Brazil $ 1119 8.90 45.70 74
China $ 274 5.10 55.90 75
Russia $803 6.10 59.80 69
South Africa $670 8.70 47.70 59
OECD Countries
USA $ 8,467 17.70 47.80 79
UK $ 3,659 9.40 82.80 81
Germany $ 4,996 11.30 76.50 81
Norway $ 9,908 9.90 85.10 82
Sweden $ 5,419 9.50 81.60 82
Denmark $ 6,521 10.90 85.30 80
Japan $ 4,656 10 82.10 84
1.4 Highlights of National Health Policy 2017
The national health policy 2017 has been prepared after success of 1983 and 2002 national health
policies in strengthening the health care system in India. Some new initiatives have been taken in
the new Health Policy, 2017. The change has been necessitated due to the following four major
reasons:
Firstly, the health priorities are changing. Although, maternal and child mortality have
rapidly declined, there is a growing burden on account of non-communicable diseases and some
infectious diseases. Second, the emergence of robust health care industry estimated to be
growing at a double digit growth rate. Third, change in the growing incidents of catastrophic
expenditure due to health care cost, which are presently estimated to be one of the major
contributors to poverty. Fourth, a rising economy has enabled to enhance fiscal capacities.
However, a question mark has been put on the last point due to fall in growth rate in the recent
times.
The major focus of the national health policy 2017 is to inform, clarify, strengthen and
prioritize the role of government in shaping the health system in all its dimension (which was
halted after 1991), investments in health, organization of health services, prevention of diseases
and promotion of good health through cross sectional actions, access to technology, developing
29
human resources, encouraging medical pluralism, building knowledge base, developing better
financial protection strategies, strengthening regulations and health assurance.
The goal of health policy 2017 is to attain highest level of health and well-being for all
ages, through a combination of preventive and promotive health care system for universal access
to good quality services without leaving anyone at affordable price. The emphasis is on access,
improved quality and lowering the cost of health care delivery.
These goals are expected to be achieved through the following key policy principles:
Introducing professionalism, integrity and ethics. Equity, affordability, universality and
patient centered quality care will guide the policy;
Accountability, intensive partnership pluralism, decentralization and dynamism and
adaptiveness are the other key features of this new policy; and
Emphasis will be on progressively achieving universal health coverage with a focus on
significant reduction in out of pocket expenditure due to increasing health care costs and
achieving a reduction in proportion of households experiencing catastrophic health
expenditure and consequent impoverishment. To achieve this goal the trust of the public
will be reinforced in public health care system which has been eroded in the recent past.
The growth of private health care sector will be aligned in public health goals.
Specific quantitative goals and objectives are further outlined under three broad components:
a) Health status and program impact;
b) Health systems performance; and
c) Health system strengthening.
These goals and objectives are aligned to achieve a sustainable development in health
sector in keeping with policy trust. The important step in this direction is to increase health
expenditure by government as a percentage of GDP from the existing 1.15 per cent to 2.5 per
cent by 2025, increase in state health sector spending to more than 8 per cent of their budget by
2020 and decrease in proportion of households facing catastrophic health expenditure from
current level by 25 per cent by 2025.
These three issues have been highlighted by many researchers through empirical studies.
In addition to the higher spending by the government through public health sector, the policy
articulates to institutionalize inter-sectoral coordination at national and sub-national level to
optimize health outcomes through constitutional bodies that have representation from relevant
non-health ministries. This is in line with the emergent international “Health in All” approach as
30
compliment to “Health For All”. The policy pre-requisites is for an empowered public health
cater to address social determinants of health effectively, by enforcing regulatory provisions.
The policy identifies, coordinated actions on seven priority areas for improving the
environment for health:
The Swachh Bharat Abhiyan;
Balanced, healthy diets and regular exercise;
Addressing tobacco, alcohol and substance abuse;
Yatri suraksha-preventing deaths due to rail and road traffic accidents;
Nirbhaya Nari-action against gender violence;
Reduced stress and improved safety in the workplace;
Reducing indoor and outdoor air pollution;
The policy lays greater emphasis on investment and action in school health by incorporating
health education as part of the curriculum, hygiene and safe health practices within the
school environment and by acting as a site of primary health care; and
Recognizing the risks arising from physical, chemical and other workplace hazards, the
policy advocates for providing greater focus on occupational health. Work-sites and
institutions would be encouraged and monitored to ensure safe health practices and accident
prevention, besides providing preventive and promotive health care services.
The policy proposes seven key policies shifts in organizing health care services.
In primary care- from selective care to assured comprehensive care with linkages to referral
hospitals.
In secondary and tertiary care-from an input oriented to an output based strategic purchasing.
In public hospitals- from user fee and cost recovery to assured free drugs, diagnostic and
emergency services to all.
In-infrastructure and human-resource development-from normative approach to targeted
approach to reach under-serviced areas.
In urban health-from token interventions to on-scale assured interventions, to organize
primary health care delivery and referral support for urban poor. Collaboration with other
sectors to address wider determinants of urban health has been advocated.
In national health programmes-integration with health systems for programme effectiveness
and in turn contributing to strengthening of health system for efficiency.
31
In AYUSH services-from stand alone to a three dimensional mainstreaming.
In the long run, the policy envisages to have fully equipped and functional public sector
hospitals in these areas to meet secondary and tertiary health care needs of population, especially
the poorest and marginalized. Public facilities would remain the focal point in the healthcare
delivery system and services in the public health facilities would be expanded from current
levels. In order to provide access and financial protection at secondary and tertiary care levels,
the policy proposes free drugs, free diagnostics and free emergency care services in all public
hospitals. To address the growing challenges of urban health, the policy advocates scaling up
National Urban Health Mission (NUHM) to cover the entire urban population within the next
five years with sustained financing.
1.4.1 Primary Care Services and Continuity of Care
This policy denotes important change from very selective to comprehensive primary
health care package which includes geriatric health care, palliative care and rehabilitative care
services. The facilities which start providing the larger package of comprehensive primary health
care will be called “Health and Wellness Centers‟. Primary care must be assured. The policy
recommends that health centres be established on geographical norms apart from population
norms. To provide comprehensive care, the policy recommends a matching human resources
development strategy, effective logistics support system and referral backup. This would also
necessitate upgradation of the existing sub-centres and reorienting PHCs to provide
comprehensive set of preventive, promotive, curative and rehabilitative services.
1.4.2 Secondary Care Services
The policy aspires to provide at the district level most of the secondary care which is
currently provided at a medical college hospital. Basic secondary care services, such as caesarian
section and neonatal care would be made available at the least at sub-divisional level in a cluster
of few blocks. To achieve this, policy therefore aims:
To have at least two beds per thousand population distributed in such a way that it is
accessible within golden hour rule. This implies an efficient emergency transport system.
The policy also aims that ten categories of what are currently specialist skills be available
within the district. Additionally four or at least five of these specialist skill categories be
available at sub-district levels. This may be achieved by strengthening the district hospital
and a well-chosen, well located set of sub-district hospitals.
32
Resource allocation should be responsive to quantity, diversity and quality of caseloads
provided.
Purchasing care after due diligence from non-Government hospitals as a short term strategy
till public systems are strengthened.
National Health Policy proposes a responsive and strong regulatory framework to guide
purchasing of care from non-government sector so that challenges of quality of care, cost
escalations and impediments to equity are addressed effectively.
In order to develop the secondary care sector, comprehensive facility development and
obligations with regard to human resources, especially specialists needs, are to be prioritized. To
this end the policy recommends a scheme to develop human resources and specialist skills.
Further, Access to blood and blood safety has been a major concern in district healthcare
services. This policy affirms in expanding the network of blood banks across the country to
ensure improved access to safe blood.
1.4.3 Closing Infrastructure and Human Resources/Skill Gaps
The policy duly acknowledges the roadmap of the 12th Five Year Plan for managing human
resources for health. The policy initiatives aim for measurable improvements in quality of care.
Further, the policy emphasize on strengthening the urban health care also. National health policy
prioritizes addressing the primary health care needs of the urban population with special focus on
poor populations living in listed and unlisted slums, other vulnerable populations such as
homeless, rag-pickers, street children, rickshaw pullers, construction workers, sex workers and
temporary migrants.
The national health policy has reiterated by focusing on the national health programmes,
namely, RMNCH+A services, Child and Adolescent Health, Interventions to Address
Malnutrition and Micronutrient Deficiencies, Universal Immunization, Communicable Diseases,
Control of Tuberculosis, Control of HIV/AIDS, Leprosy Elimination, Vector Borne Disease
Control. The policy recognizes the interrelationship between communicable disease control
programmes and public health system strengthening. Every one of these programmes requires a
robust public health system as their core delivery strategy. At the same time, these programmes
also lead to strengthening of healthcare systems.
In regard to Non-Communicable Diseases, The policy recognizes the need to halt and
reverse the growing incidence of chronic diseases. The policy recommends to set-up a
33
National Institute of Chronic Diseases including Trauma, to generate evidence for
adopting cost effective approaches and to showcase best practices.
The policy will take into consideration the provisions of the National Mental Health
Policy 2014.
The National Health Policy recognises that improved access, education and
empowerment would be the basis of successful population stabilization. The policy
further emphasizing on Women‟s Health & Gender Mainstreaming, Gender based
violence (GBV):, Supportive Supervision, and Emergency Care and Disaster
Preparedness.
National Health Policy emphasizes on mainstreaming the Potential of AYUSH, Tertiary care
Services, Human Resources for Health and change in Medical Education. This policy
recommends that the current pattern of MCQ (Multiple Choice Question) based entrance test for
post graduates medical courses- that drive students away from practical learning- should be
reviewed. The policy recognizes the need to revise the under graduate and post graduate medical
curriculum keeping in view the changing needs, technology and the newer emerging disease
trends. Further, Attracting and Retaining Doctors in Remote Areas, Specialist Attraction and
Retention, strengthening of Mid-Level Service Providers through expansion of primary care
from selective care to comprehensive care, complementary human resource strategy is the
development of a cadre of mid-level care providers. This can be done through appropriate
courses like a B.Sc. in community health and/or through competency-based bridge courses and
short courses.
Moreover, improvement in the regulation and quality management of nursing education,
the certification programme for ASHAs for their professional selection into NAM, Nursing and
Para-medical courses has been proposed. The policy recommends revival and strengthening of
Multipurpose Male Health Worker cadre, in order to effectively manage the emerging infectious
and non-communicable diseases at community level. The addition of a second Community
Health Worker would be based on geographic considerations, disease burdens, and time required
to perform multiple tasks to be performed by ASHA/ Community Health Worker. Further, the
paramedical skills required for super-speciality paramedical care needs strengthening.
The policy proposes creation of Public Health Management Cadre in all States based on
public health or related disciplines, as an entry criteria. The policy also advocates an appropriate
career structure and recruitment policy to attract young and talented multi-disciplinary
34
professionals. Medical & health professionals would form a major part of this, but professionals
coming in from diverse backgrounds such as sociology, economics, anthropology, nursing,
hospital management, communications, etc. who have since undergone public health
management training would also be considered. States could decide to locate these public health
managers, with medical and non-medical qualifications, into same or different cadre streams
belonging to Directorates of health. Further, the policy recognizes the need to continuously
nurture certain specialized skills like entomology, housekeeping, bio-medical waste
management, bio medical engineering communication skills, management of call centres and
even ambulance services. The major emphasis is on financing of health care by allocating major
proportion (up to two-thirds or more) of resources to primary care followed by secondary and
tertiary care.
The foregoing discussion based on empirical evidences highlighted by the social, the
finding of the situation analysis report, 2017and the policy changes introduced in the national
health policy, 2017 clearly reveals that all is not well in regard to the working of health system in
general and public health system in particular in India. Therefore, an attempt has been made to
study the working of a major flagship program introduced by Government of Punjab under the
garb of reforms in the public health sector by setting up Punjab Health Systems Corporation
(PHSC) in 1995 to improve the access and quality of health services in Punjab.
1.5 The Scheme of the Study
The present study is divided into seven chapters. Chapter-I deals with the global health
scenario with special reference to India. This chapter also presents the important research studies
carried out at the national level in India, the Situation Analyses Report, 2017 and the main
highlights of National Health Policy, 2017.
The database and research methodology is presented in Chapter-II. The dynamics of
health services in Punjab is carried out in Chapter-III. The working of Punjab Health Systems
Corporation is carried out in Chapter-IV. Further, the access and quality of services provided by
PHSC in Punjab is presented in Chapter-V. Users‟ perception towards delivery of health services
in Punjab is presented in Chapter-VI and the perception of doctors towards health services and
level of job satisfaction among the doctors is carried out in Chapter-VII. The Summary,
Conclusion and Recommendations are presented in Chapter-VIII.
35
CHAPTER II
DATABASE AND RESEARCH METHODOLOGY
2.1 Importance of the Study
The health services have become an important issue after the acceptance of neo-literal model of
development at global level in general and India in particular. With the implementation of
liberalization, the state has been continuously withdrawing from the field of health. As a result,
the poor people are facing difficulties to avail these services. Moreover, the quality of public
sector health services has deteriorated over the period of time. On the other hand, the private
health services are going beyond the reach of common people. The mushrooming growth of
unregulated private health players and the fall in the standard of the government health care
sector demand the evaluation of existing situation of health sector at national level as well as the
state level.
Although good number of studies has been conducted at national level in India, however,
very few studies are available relating to the working of health sector in Punjab. Majority of
studies are unanimous that the public health expenditure in India is very meager as compared to
the developed economy as well as the developing countries at the global level.
The WHO data, 2015 reveals that India's total expenditure on health as percentage of
GDP was 3.8 out of which public expenditure on health as percentage of GDP was only 1.2
percent which was lower than Sri Lanka (1.4 per cent), Bangladesh (1.3 per cent), and Nepal (2.6
per cent). Further, the share of government and private expenditure on health as percentage of
total health expenditure was 30.5 per cent and 69.5 per cent. Moreover, the out of pocket
expenditure as percentage of private expenditure on health was 87.2 per cent whereas in USA it
was only 22.7 per cent (WHO statistics 2015).
Although Punjab government did not make any planned effort to improve the health
scenario in Punjab, it took few initiatives in this direction. The main health initiatives taken to
improve the Punjab health system include, namely, the formation of Punjab health system
corporation (PHSC) in 1995, opening the health sector to private players and decentralization of
health services at the block and village level. The purpose of setting PHSC was to improve the
secondary level health services in the state. The access and quality of the health services were
also sought to be improved. However, many studies carried out in Punjab as presented in the
following discussion reveals that PHSC has failed to improve the delivery of quality health
services in Punjab.
36
2.2 Objectives of the Study
The present study has been planned to focus on the following objectives:
1. To analyse the health scenario at the national level with special reference to National
Health Policy, 2017;
2. To examine the present status and problems of public health care services in Punjab;
3. To study the working of Punjab health systems Corporation (PHSC) in terms of provision
of access to quality health care services;
4. To examine the perception of user of health services provided by PHSC;
5. To identify the factors which influence the level of satisfaction among doctors working in
PHSC hospitals; and
6. To suggest suitable recommendations for the improvement of access and quality of public
health services in Punjab.
2.3 Universe of the study
The universe of the study includes all the District Hospitals (DHs), Sub-Divisional Hospitals
(SDHs) and Community Health Centers (CHCs) working under Punjab Health Systems
Corporation (PHSC). All the doctors working in these hospitals and the patients (both in-patients
and out-patients) who got treatment from the hospitals and the doctors working in these hospitals
constitute the population for the study.
2.4 Sources of Data
The present study focuses on the state of Punjab. The study is based on both primary and
secondary data. However, secondary data has been collected from various published reports of
Government of India and state of Punjab. The publications of World Health Organization have
also been consulted. First two objectives of this project have been achieved on the basis of
secondary data. Third objective has been achieved on the basis of both primary and secondary
data while Fourth and Fifth objectives have been achieved by analyzing the primary data
collected from the field. The primary data were collected during the period September 2016 to
October 2017.
2.4.1 Secondary data sources
The online sources which have been accessed includes websites of World Health Organisation,
Ministry of Health and Family Welfare, India (MoH&FW), National Sample Survey
Organisation, Central Statistical Organisation (New Delhi), Union Budget of India, Punjab
Health Systems Corporation, Health Department (Punjab), Economic and Statistical
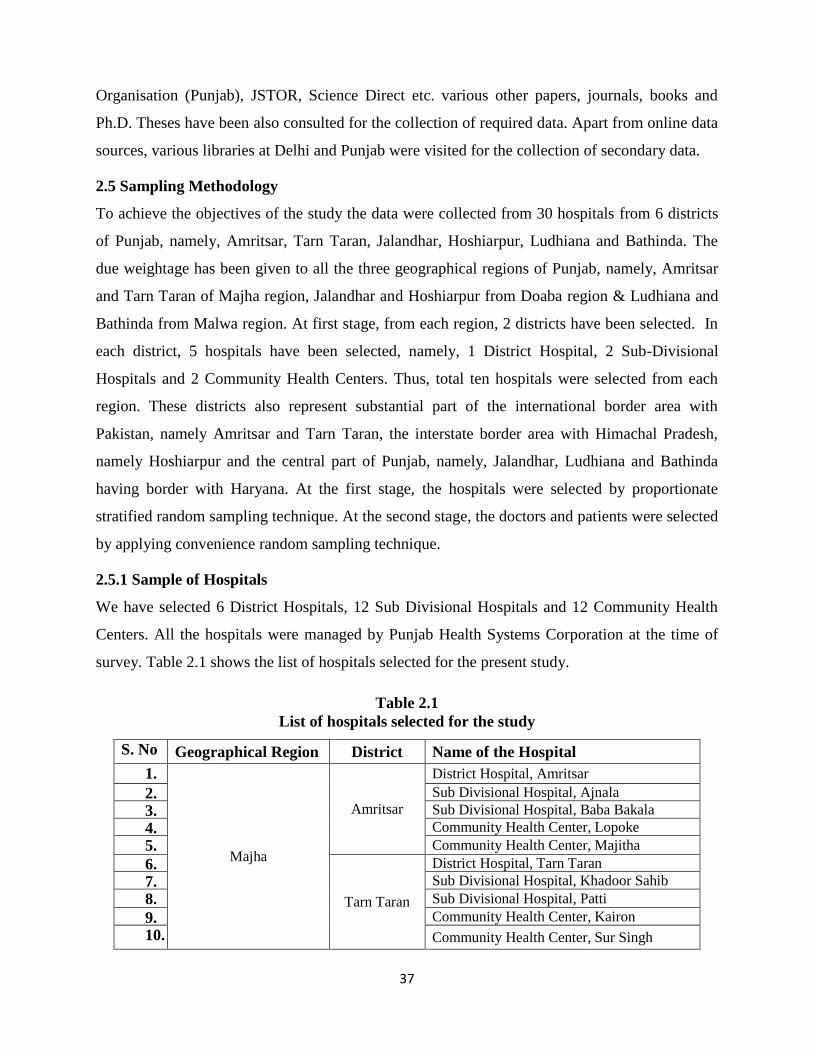
37
Organisation (Punjab), JSTOR, Science Direct etc. various other papers, journals, books and
Ph.D. Theses have been also consulted for the collection of required data. Apart from online data
sources, various libraries at Delhi and Punjab were visited for the collection of secondary data.
2.5 Sampling Methodology
To achieve the objectives of the study the data were collected from 30 hospitals from 6 districts
of Punjab, namely, Amritsar, Tarn Taran, Jalandhar, Hoshiarpur, Ludhiana and Bathinda. The
due weightage has been given to all the three geographical regions of Punjab, namely, Amritsar
and Tarn Taran of Majha region, Jalandhar and Hoshiarpur from Doaba region & Ludhiana and
Bathinda from Malwa region. At first stage, from each region, 2 districts have been selected. In
each district, 5 hospitals have been selected, namely, 1 District Hospital, 2 Sub-Divisional
Hospitals and 2 Community Health Centers. Thus, total ten hospitals were selected from each
region. These districts also represent substantial part of the international border area with
Pakistan, namely Amritsar and Tarn Taran, the interstate border area with Himachal Pradesh,
namely Hoshiarpur and the central part of Punjab, namely, Jalandhar, Ludhiana and Bathinda
having border with Haryana. At the first stage, the hospitals were selected by proportionate
stratified random sampling technique. At the second stage, the doctors and patients were selected
by applying convenience random sampling technique.
2.5.1 Sample of Hospitals
We have selected 6 District Hospitals, 12 Sub Divisional Hospitals and 12 Community Health
Centers. All the hospitals were managed by Punjab Health Systems Corporation at the time of
survey. Table 2.1 shows the list of hospitals selected for the present study.
Table 2.1
List of hospitals selected for the study
S. No Geographical Region District Name of the Hospital
1.
Majha
Amritsar
District Hospital, Amritsar
2. Sub Divisional Hospital, Ajnala
3. Sub Divisional Hospital, Baba Bakala
4. Community Health Center, Lopoke
5. Community Health Center, Majitha
6.
Tarn Taran
District Hospital, Tarn Taran
7. Sub Divisional Hospital, Khadoor Sahib
8. Sub Divisional Hospital, Patti
9. Community Health Center, Kairon
10. Community Health Center, Sur Singh
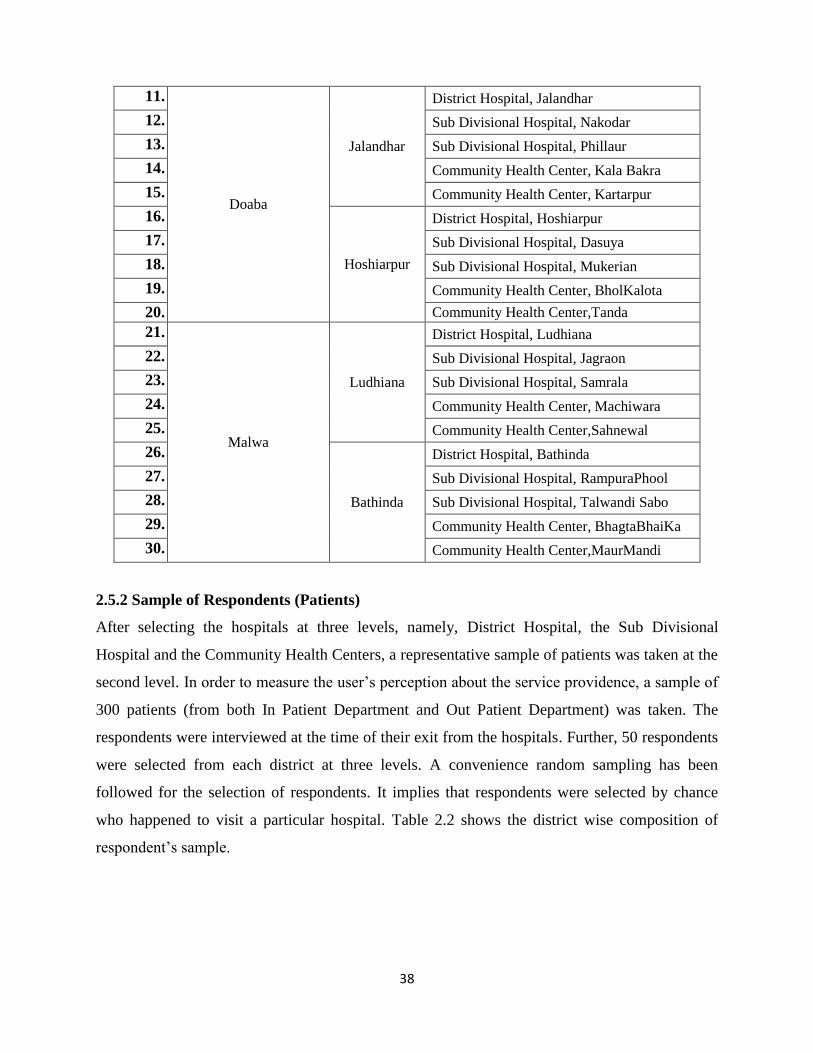
38
11.
Doaba
Jalandhar
District Hospital, Jalandhar
12. Sub Divisional Hospital, Nakodar
13. Sub Divisional Hospital, Phillaur
14. Community Health Center, Kala Bakra
15. Community Health Center, Kartarpur
16.
Hoshiarpur
District Hospital, Hoshiarpur
17. Sub Divisional Hospital, Dasuya
18. Sub Divisional Hospital, Mukerian
19. Community Health Center, BholKalota
20. Community Health Center,Tanda
21.
Malwa
Ludhiana
District Hospital, Ludhiana
22. Sub Divisional Hospital, Jagraon
23. Sub Divisional Hospital, Samrala
24. Community Health Center, Machiwara
25. Community Health Center,Sahnewal
26.
Bathinda
District Hospital, Bathinda
27. Sub Divisional Hospital, RampuraPhool
28. Sub Divisional Hospital, Talwandi Sabo
29. Community Health Center, BhagtaBhaiKa
30. Community Health Center,MaurMandi
2.5.2 Sample of Respondents (Patients)
After selecting the hospitals at three levels, namely, District Hospital, the Sub Divisional
Hospital and the Community Health Centers, a representative sample of patients was taken at the
second level. In order to measure the user‟s perception about the service providence, a sample of
300 patients (from both In Patient Department and Out Patient Department) was taken. The
respondents were interviewed at the time of their exit from the hospitals. Further, 50 respondents
were selected from each district at three levels. A convenience random sampling has been
followed for the selection of respondents. It implies that respondents were selected by chance
who happened to visit a particular hospital. Table 2.2 shows the district wise composition of
respondent‟s sample.
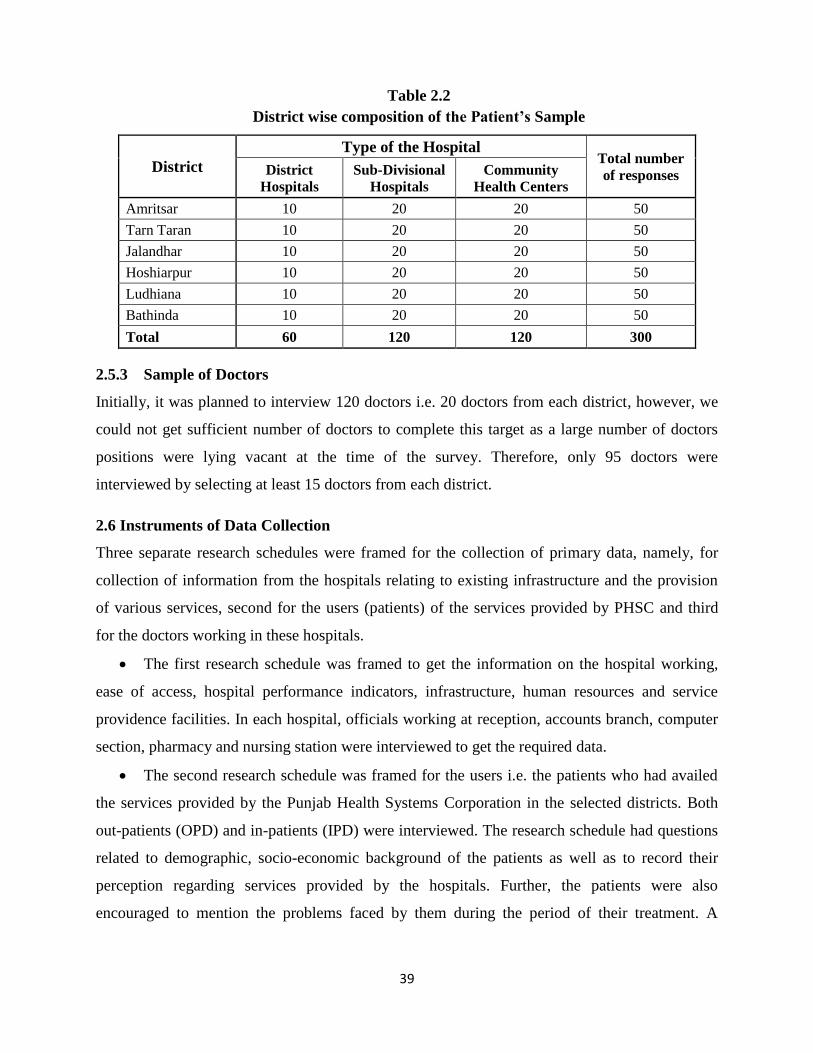
39
Table 2.2
District wise composition of the Patient’s Sample
District
Type of the Hospital Total number
of responses District
Hospitals
Sub-Divisional
Hospitals
Community
Health Centers
Amritsar 10 20 20 50
Tarn Taran 10 20 20 50
Jalandhar 10 20 20 50
Hoshiarpur 10 20 20 50
Ludhiana 10 20 20 50
Bathinda 10 20 20 50
Total 60 120 120 300
2.5.3 Sample of Doctors
Initially, it was planned to interview 120 doctors i.e. 20 doctors from each district, however, we
could not get sufficient number of doctors to complete this target as a large number of doctors
positions were lying vacant at the time of the survey. Therefore, only 95 doctors were
interviewed by selecting at least 15 doctors from each district.
2.6 Instruments of Data Collection
Three separate research schedules were framed for the collection of primary data, namely, for
collection of information from the hospitals relating to existing infrastructure and the provision
of various services, second for the users (patients) of the services provided by PHSC and third
for the doctors working in these hospitals.
The first research schedule was framed to get the information on the hospital working,
ease of access, hospital performance indicators, infrastructure, human resources and service
providence facilities. In each hospital, officials working at reception, accounts branch, computer
section, pharmacy and nursing station were interviewed to get the required data.
The second research schedule was framed for the users i.e. the patients who had availed
the services provided by the Punjab Health Systems Corporation in the selected districts. Both
out-patients (OPD) and in-patients (IPD) were interviewed. The research schedule had questions
related to demographic, socio-economic background of the patients as well as to record their
perception regarding services provided by the hospitals. Further, the patients were also
encouraged to mention the problems faced by them during the period of their treatment. A
40
sample of 300 patients was selected taking 50 patients from each sampled district. Due care was
also given to give representation to the patients of three types of the hospitals.
The third research schedule was framed to collect information relating to the
demaographic profile of the doctors and to identify the factors which influence the level of
satisfaction of the doctors working in PHSC hospitals. 23 statements were developed to record
the responses of the doctors on a five point likert-type scale with the five options from 1 to 5
where 1 means „Strongly Disagree‟, 2 means „Disagree‟, 3 means „Neither Agree nor Disagree‟,
4 means „Agree‟ and 5 means „Strongly Agree‟. All the statements were positively worded to
avoid any confusion. The statements were examined for the content validity through discussion
with the experts.
2.7 Analysis of Secondary and Primary Data
For the analysis of data both simple and advanced statistical tools have been applied. The
secondary data have been analysed by calculating percentages on the basis of frequencies. The
bar-charts have also been prepared to show the data. SPSS (version 21) was used to analyse the
data. Exploratory Factor Analysis (EFA) was applied to identify the factors which influence the
level of satisfaction of the doctors working in PHSC. It is a multivariate technique which find-
out the interrelationship between several variables. This technique is generally used to reduce the
large number of variables to a small set of factors. These factors determine the dimensions within
the data. Before applying factor analysis, data must fulfill the following assumptions, namely,
Normality i.e. data should be normally distributed, Kaiser Meyer Olkin (KMO) Measure of
Sampling Adequacy and Bartlett‟s Test of Sphericity. The value of KMO ranges between 0 to 1
and it should be closer to 1 for better results. Similarly, the Bartlett‟s test of sphericity is a test of
null hypothesis which help us to find out that all the variables under study are uncorrelated.
Further, the Correlation Matrix is prepared which indicate the relationship between the variables.
Hair et. al. argued that the values of the matrix should be greater than 0.40 and preferably 0.50. If
the value of elements in the correlation matrix is less than 0.30 then data is not considered fit for
running factor analysis. After testing the data for above assumptions, Principal Components
Analysis Method with Varimax Rotation was used for the extraction of factors. The Varimax
Rotational approach makes the interpretation of factor loadings more clear. The factor loadings
closer to 1 clearly indicate a high correlation between the variable and the factor whereas the
factor loading closer to zero (0) shows the absence of such correlation.
41
2.8 Limitations of the study
The study has been restricted to only six districts of Punjab, namely, Amritsar, Tarn Taran,
Jalandhar, Hoshiarpur, Ludhiana and Bathinda. The findings may not be applicable to other
areas of the Punjab.
Due to limitation of time and resources, the response of limited respondents was collected.
With greater sample size there would have been more possibility to generalize the findings
of the study.
The data have been collected in the study through a primary survey. The feedback of the
respondents in such surveys may be biased. Sometimes the responses of the respondents are
different than what they actually experienced because they want to keep their experiences
confidential.
42
Chapter III
The Dynamics of Health Services in Punjab
Among the Indian states, Punjab is relatively a small state situated at the sensitive border of the
country. It is among the highest income states, and was at the forefront of India‟s green
revolution, which increased yields through the adoption of new high-yielding varieties of wheat
and rice. It is among the first few states in the country with 100 per cent road connectivity in
rural areas.
Punjab, known as India's granary, had been the fastest growing state of India till the
1990s. The compound annual growth rate of Gross State Domestic Product of Punjab was 7.88
per cent in 1985-86 as compared to 4.08 per cent growth in Gross Domestic Product of India
(Sawhney, 2011). According to National Human Development Report (2001), Punjab was
ranked second next only to Kerala in terms of Human Development Index (HDI) with lowest
poverty rate. However, the speed of growth of the state started declining during the 1990s due to
several reasons, particularly the saturation of agricultural sector, lack of industrial development
and terrorism. As a result, the per capita income of the state started declining as compared to
other major Indian states. Punjab was ranked 5th in terms of HDI as per Indian Human
Development Report 2011. In the 1980s, Punjab ranked first in terms of per capita Net State
Domestic Product (NSDP), however, in 2013-14 its rank declined to 14th. Although its per
capita income is still more than the majority of the states of the country (Rs. 1,53,061/- in 2018-
19) at the same time it has become one of the most debt burdened state of India. The debt of
Punjab which was estimated 1.95 Lakh Crore in 2017-18 has increased further to 2.12 Lakh
Crore estimated in budget 2018-19. The situation has reached to such level that the Punjab
government generally borrows for paying off the salaries, pensions and for providing subsidies.
The financial crisis of the state has affected public spending in every sector especially the
health sector. The funds allocated for the development of public health services got stagnated
during the 1990s. The public health expenditure in Punjab (as a percentage of total budget
expenditure) has continuously decreased over the last four decades from nearly 9-10 per cent in
1980-81 to 6.97 per cent in 1989-90 which further declined to 4.3 per cent in 2004-05 and 3.81
per cent of total annual budget in 2016-17. The low government health expenditure at the state
levels has led to the deterioration of the health services.
Further, huge inter district disparities were observed as the health infrastructure was
concentrated in three districts, namely, Amritsar, Ludhiana and Gurdaspur. Therefore, the Fourth
43
plan aimed at expanding the health services in the lagging districts especially in the rural areas.
Besides this, the family planning programmes were given importance to control the growing
population. During the Fifth plan, the development of health infrastructure was the major goal. In
order to achieve this, the plan proposed to set up new dispensaries, dental clinic and to upgrade
the existing Primary health centres (Human Development Report of Punjab, 2004).
The Sixth plan observed that there were an adequate number of medical institutions in the
state but these were not working properly due to the absence of health manpower and up to date
equipment. So, the focus of the plan was shifted from improvement of infrastructure to its
efficient functioning. Similarly, the Seventh plan decided to spend on the transformation of the
existing equipment in the medical institutions. The health infrastructure and workforce remained
the prime concern of the Eighth and the Ninth plan. In these plans, the government emphasized
the need to figure out the factors responsible for the poor health conditions in the state. Like the
earlier plans, the Tenth plan focused on strengthening the existing medical infrastructure
providing Allopathic, Homeopathic and Ayurvedic health services. The impact of the launch of
National Rural Health Mission by the central government in 2005 was visible in the Eleventh
plan of Punjab. As a result, in this plan, the Punjab government aimed at improving the rural
health in the state. For this purpose, Rog Kalyani Samitis at the village levels were formed to
increase the participation of the masses.
The most recent plan i.e. the Twelfth plan aimed to improve the infrastructure and
educational facilities in the medical colleges. It also proposed to start programmes to train the
medical and para-medical staff to improve their skills (Draft Twelfth five year plan, 2007-12).
Although in the recent plans there has been an increase in the health expenditure in absolute
terms but it has been spent mostly on the curative health services. However, the state government
like the central government has not given due importance to the preventive health care measures
to check the incidence of Non communicable diseases like diabetes, Cardiovascular disease and
cancer which has put a serious challenge to the health sector in Punjab. The absence of a
regulatory system for the private health players is yet another issue in the health sector of Punjab.
Further, the deficiency of modern equipment and shortage of doctors and other supporting staff
has impacted the access and delivery of quality health services in Punjab.
In spite of all these efforts made by the government the health outcomes record in many
dimensions (e.g. maternal and infant mortality rates) have not been found satisfactory in terms of
Millennium Development Goals and Sustainable Development Goals. Due to the declining share
44
of public health expenditure, the government hospitals in Punjab are suffering from lack of
medicine supplies, shortage of doctors, and possibly, a misplaced emphasis on treatment rather
than prevention. Even the funds that are available are not being used fully. In Punjab, most of the
government hospitals are overcrowded and private health sector services are out of reach of
common public. Moreover, there are very few government hospitals in proportion to population
which are providing tertiary healthcare which is the most expensive.
3.1 Health reforms in Punjab
In the post liberalization period, the government allocation to the health sector got major set-
back at the national as well as the state level. Although the Punjab state government failed to
make any planned efforts to improve the health scenario, however, under the influence of the
national economic reforms, few initiatives were taken. The main health initiatives taken to
restructure the Punjab health system include the formation of Punjab Health Systems
Corporations (PHSC) in 1995, opening the health sector to private players and decentralization
of health services at the village levels.
3.2 Punjab Health System Corporation (1996)
The secondary level health care institutions occupy a very important position in the state health
care system. In the mid 1990s, the district hospitals, sub divisional hospitals and Community
health centres of Punjab were in pitiable condition due to the shortage of infrastructure,
manpower and lower health expenditure. To overcome this, Punjab government requested the
World Bank to provide financial aid to improve the access and quality of basic health services in
the state. As a result, the International Development Association (IDA) approved credit under
Multi-State Health System Development Project to three states of India namely, Punjab,
Karnataka and West Bengal (National Institute of Health and Family Welfare report on PHSC,
2008). The total project cost in Punjab was estimated around US$106.1 million out of which
US$ 89.7million was sanctioned by IDA and rest of US$16.4 million was met by the Punjab
Government. Thus, the Punjab Health Systems Corporation (PHSC) was incorporated by the
State Government in the year 1996 through the enactment of Legislative Act, “The Punjab
Health Systems Corporation Act, 1996” (Punjab Act No.6 of 1996). The corporation took over
around 166 medical institutions which included district hospitals, sub divisional hospitals and
community health centres. It is pertinent to mention that IDA agreed to extend financial
assistance for the health sector subject to the conditions that the government of Punjab will set-
up a separate corporation in addition to the existing departments of health sector in Punjab. At
the initial stage, Punjab government resisted the proposal but later on it succumbed to the
45
pressure of the World Bank. So ultimately a parallel health system was created in the form of a
corporation.
However, the setting up of PHSC as a parallel system of health to the existing state health
department further contributed to the existing disorder in the health system of Punjab (Gupta,
2000).The problems of corruption, poor management and favouritism continued in PHSC as it
was controlled by the same officials who were managing the previous system. Contrary to the
objective of increasing health financing, the government allocation to secondary level health
services decreased from 25 per cent (of total health expenditure) in 1994 to 19 per cent in 2003
(State health system development project II: World bank implementation report, 2004). It is
interesting to note that the Directorate of Public Enterprises and Disinvestment, Punjab in their
policy for disinvestment (2002) recommended the winding up of Punjab Health System
Corporation due to its inability to improve the health scenario of Punjab during 7 years of its
functioning. On the other hand, the World Bank II state development project implementation
report found it to be a success and suggested the continuation of the corporation. Finally, the
status of PHSC was converted from an autonomous body to a government entity under the
Department of Health and Family Welfare, Punjab from 2002 (Mulay and Sharma, 2006). So the
attempt to improve the health services at the secondary level got a serious set-back.
3.3 Public Private Partnership
Under the influence of National Economic Reforms and the formation of PHSC in Punjab, the
state government opened the health sector to the private investment. With the objective of setting
up super speciality medical institutions, Punjab Urban Development Authority (PUDA) started
offering lands at subsidised rates to the private sector (Bhatt, 2000). In return, it was expected
that these private hospitals would provide free treatment to below poverty line people- up to 10
per cent of the outdoor and 5 per cent of the indoor patients coming to these hospitals. However,
according to a field survey majority of the people were unaware about this scheme under which
the yellow card holders were exempted from the user fee in private super speciality hospitals
(Ghuman and Mehta, 2005).
Another, Public Private Partnership (PPP) initiative was the implementation of Rashtriya
Swasthya Bima Yojna under which private health insurance companies were also involved in
managing the scheme. In addition, Punjab government also took various PPP initiatives which
include setting-up Mohali and Bathinda Hospitals in collaboration with Max Healthcare,
Fatehgarh sahib Mother and child hospital, Nangal General Hospital and Nabha Civil Hospital.
46
The major reason for inviting private investment was the shortage of government funds which
led to incomplete hospital construction projects and the poor functioning of the completed
projects.
The empirical evidence support that except the Max healthcare project, the other PPP
initiatives in the state have faced several challenges. Firstly due to the local variations within the
state, similar type of projects cannot be launched everywhere. Secondly, these projects have
attempted to expand the infrastructure rather than planning to make optimum use of the existing
private sector infrastructure. The reason behind more investment on infrastructure seems to be
the government‟s desire to show that it is doing a lot to improve the public health.
3.4 Decentralisation of Health Sector
In 1993, the World Bank in its report recommended the decentralisation of management of
health services to increase efficiency (The World Development Report, 1993). As a result
various developed and developing countries implemented this idea and experienced mixed
results. In India, to strengthen the rural self governance system, Panchayati Raj Institutions
(PRIs) was formed through 73rd constitutional amendment act in 1992. Health was one of the 29
functions transferred to the PRIs. Although some of the states transferred the powers and funds
to the PRIs but overall the response was not very encouraging.
The government of Punjab also remained slow in devolving power to the panchayat
bodies. However, the launch of NRHM gave an impetus to the decentralization process. The
district health mission launched under NRHM, 2005 was to be carried on, under the leadership of
Zila Parishad with district health head as convener, thereby, indicating the transfer of powers by
the Department of Health and Family Welfare. Another step taken to increase the community
participation was the formation of Rogi Kalyani Samitis (RKS) at district, sub divisional, CHC
and PHC levels (Kaur et al. 2012). In 2006, the Punjab government introduced the concept of
decentralisation in the health sector in order to better understand and fulfil the local health needs
of the rural areas. An initiative was taken to transfer 1186 Subsidiary Health centres (rural
dispensaries) out of total 2951 to Panchayati Raj Institutions. Under this scheme, the zila
parishads were authorized to appoint a service provider for every dispensary who was, in turn,
responsible for hiring the required workforce in the SHC. Unfortunately, all these initiatives
under the decentralized policy could not produce good results in Punjab.
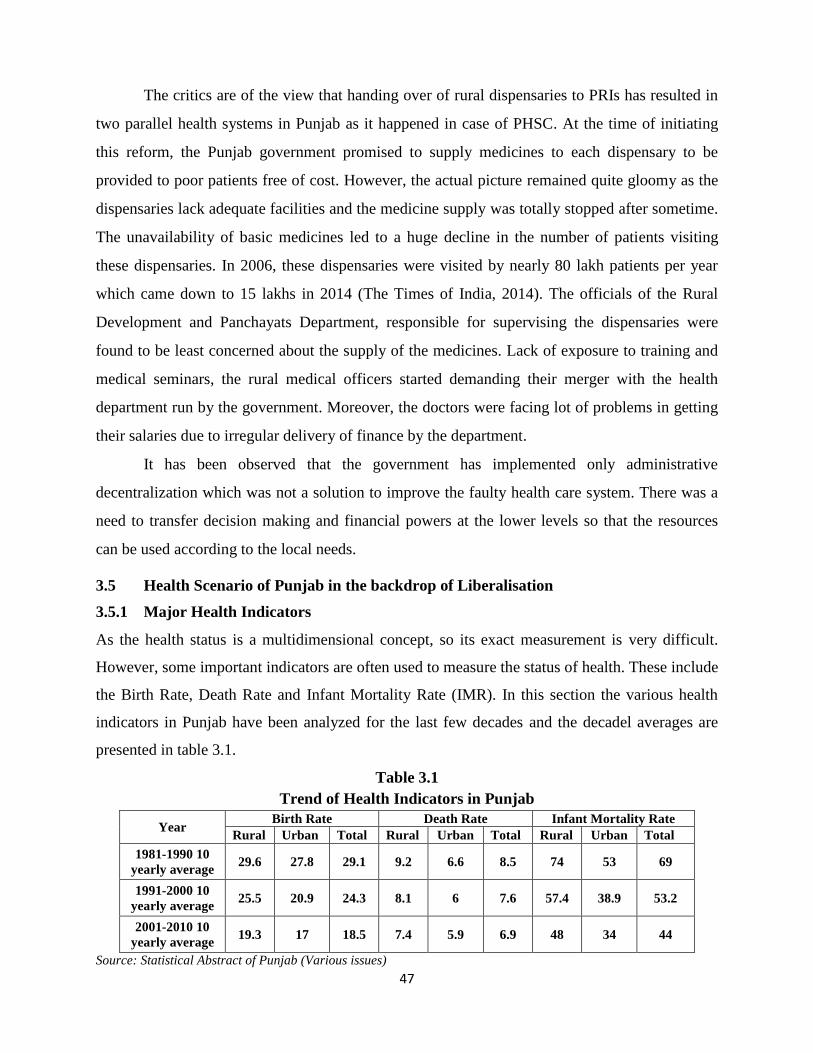
47
The critics are of the view that handing over of rural dispensaries to PRIs has resulted in
two parallel health systems in Punjab as it happened in case of PHSC. At the time of initiating
this reform, the Punjab government promised to supply medicines to each dispensary to be
provided to poor patients free of cost. However, the actual picture remained quite gloomy as the
dispensaries lack adequate facilities and the medicine supply was totally stopped after sometime.
The unavailability of basic medicines led to a huge decline in the number of patients visiting
these dispensaries. In 2006, these dispensaries were visited by nearly 80 lakh patients per year
which came down to 15 lakhs in 2014 (The Times of India, 2014). The officials of the Rural
Development and Panchayats Department, responsible for supervising the dispensaries were
found to be least concerned about the supply of the medicines. Lack of exposure to training and
medical seminars, the rural medical officers started demanding their merger with the health
department run by the government. Moreover, the doctors were facing lot of problems in getting
their salaries due to irregular delivery of finance by the department.
It has been observed that the government has implemented only administrative
decentralization which was not a solution to improve the faulty health care system. There was a
need to transfer decision making and financial powers at the lower levels so that the resources
can be used according to the local needs.
3.5 Health Scenario of Punjab in the backdrop of Liberalisation
3.5.1 Major Health Indicators
As the health status is a multidimensional concept, so its exact measurement is very difficult.
However, some important indicators are often used to measure the status of health. These include
the Birth Rate, Death Rate and Infant Mortality Rate (IMR). In this section the various health
indicators in Punjab have been analyzed for the last few decades and the decadel averages are
presented in table 3.1.
Table 3.1
Trend of Health Indicators in Punjab
Year Birth Rate Death Rate Infant Mortality Rate
Rural Urban Total Rural Urban Total Rural Urban Total
1981-1990 10
yearly average 29.6 27.8 29.1 9.2 6.6 8.5 74 53 69
1991-2000 10
yearly average 25.5 20.9 24.3 8.1 6 7.6 57.4 38.9 53.2
2001-2010 10
yearly average 19.3 17 18.5 7.4 5.9 6.9 48 34 44
Source: Statistical Abstract of Punjab (Various issues)
48
The analysis of data reveals that there is a visible decline in many of the parameters over the period of
time.
This decline can be attributed to the increased immunisation coverage of the infants for
health problems like measles, Diphtheria etc. Moreover, the introduction of various child
survival programmes under NRHM has also helped to bring down the IMR. However, the
decline in the total death rate was higher in the pre-reform period as compared to the next two
decades. The higher death rate after 2000 has been due to the outbreak of dengue in this period.
The changing lifestyle of the people has also led to an increase in the number of deaths due to
non-communicable diseases like cancer, cardiovascular disease, diabetes etc. On the contrary,
the birth rate declined at 3.0 per cent per year between 1990 and 2000 which is higher than the
pre reform period. There has been a reduction of 50 per cent in birth rate between 1980 and
2010. The increasing literacy rate, urbanization and higher economic status are mainly
contributing to the low levels of fertility. The life expectancy in Punjab for male and females was
69.7 and 72.8, which was higher than national average of 67.3 and 69.6 (National Health Profile
of India, 2015). All these improvements show positive developments in the field of health sector
in Punjab.
In spite of the fact that Punjab is heading fast towards the achievement of Millennium
Development Goals on these health indicators, however, there are various health issues which need
attention. One of these issues is rural urban differences in the health standards. For instance, 2001-
2010 average birth rate in rural Punjab was 19.3 compared to 17 in urban Punjab. Similarly, the
average rural death rate (7.4) was higher than the urban death rate (5.9). As regards the Infant
Mortality Rate, it was 48 in rural Punjab and 34 in urban Punjab. The lack of physical health
facilities, manpower and basic medicines in the rural areas was given the primary reason for these
disparities (Gill et al., 2010). In the absence of sound health facilities, rural people depend on the
expensive and poor health services provided by the unqualified doctors. In order to bridge this gap,
the Punjab government needs to put the rural health issues on its agenda.
3.5.2 Health Expenditure
One of the reasons for the difference in the pace of economic development and social
development in Punjab is the lower allocation of resources to the social sector particularly the
health sector. In absolute terms, the government health expenditure on revenue account has
increased from Rs 196.97 crores in 1990-91 to Rs 2561.29 crores in 2014-15. According to the
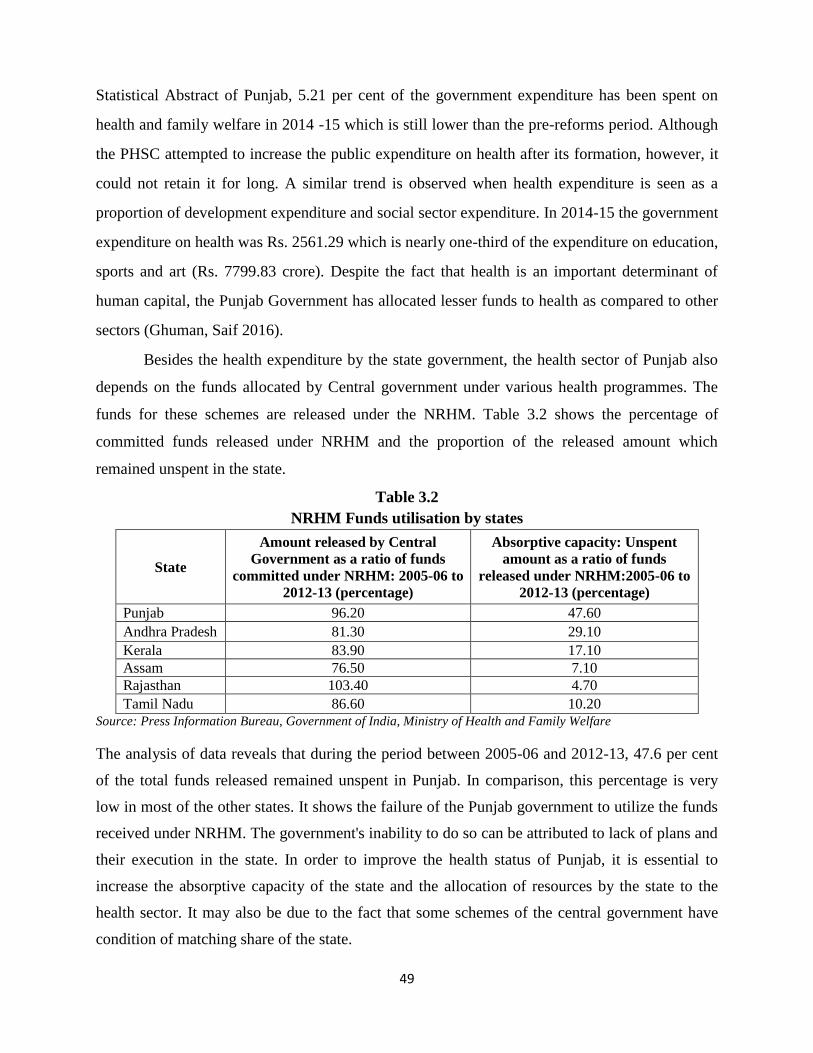
49
Statistical Abstract of Punjab, 5.21 per cent of the government expenditure has been spent on
health and family welfare in 2014 -15 which is still lower than the pre-reforms period. Although
the PHSC attempted to increase the public expenditure on health after its formation, however, it
could not retain it for long. A similar trend is observed when health expenditure is seen as a
proportion of development expenditure and social sector expenditure. In 2014-15 the government
expenditure on health was Rs. 2561.29 which is nearly one-third of the expenditure on education,
sports and art (Rs. 7799.83 crore). Despite the fact that health is an important determinant of
human capital, the Punjab Government has allocated lesser funds to health as compared to other
sectors (Ghuman, Saif 2016).
Besides the health expenditure by the state government, the health sector of Punjab also
depends on the funds allocated by Central government under various health programmes. The
funds for these schemes are released under the NRHM. Table 3.2 shows the percentage of
committed funds released under NRHM and the proportion of the released amount which
remained unspent in the state.
Table 3.2
NRHM Funds utilisation by states
State
Amount released by Central
Government as a ratio of funds
committed under NRHM: 2005-06 to
2012-13 (percentage)
Absorptive capacity: Unspent
amount as a ratio of funds
released under NRHM:2005-06 to
2012-13 (percentage)
Punjab 96.20 47.60
Andhra Pradesh 81.30 29.10
Kerala 83.90 17.10
Assam 76.50 7.10
Rajasthan 103.40 4.70
Tamil Nadu 86.60 10.20
Source: Press Information Bureau, Government of India, Ministry of Health and Family Welfare
The analysis of data reveals that during the period between 2005-06 and 2012-13, 47.6 per cent
of the total funds released remained unspent in Punjab. In comparison, this percentage is very
low in most of the other states. It shows the failure of the Punjab government to utilize the funds
received under NRHM. The government's inability to do so can be attributed to lack of plans and
their execution in the state. In order to improve the health status of Punjab, it is essential to
increase the absorptive capacity of the state and the allocation of resources by the state to the
health sector. It may also be due to the fact that some schemes of the central government have
condition of matching share of the state.
50
3.5.3 Health Infrastructure and Manpower in Punjab
The available data reveals that from 1980 to 1986, nearly 10 per cent of the total government
expenditure was spent on the health sector in Punjab. As a result, the number of health
institutions in Punjab showed an upward trend during this period. There were 1008 rural medical
institutions in 1979 in the state which went up to 1799 in 1990 (Statistical Abstract of Punjab).
The primary reason for this increase in the rural health infrastructure was the introduction of
Minimum Needs Programme by the Central Government in the fifth five year plan. The
programme was continued during next five year plans and it focussed on the issues in the rural
areas. However after the introduction of economic reforms, the government health expenditure
went down which led to stagnation in the health infrastructure in Punjab (Randhawa and Sidhu,
2011).
An attempt has also been made to compare the data relating to health infrastructure in
Punjab on the basis of three indicators, namely, total number of medical institutions, total
number of beds and total number of doctors during the period 1971 to 2010. Further, the period
from 1971-1990 was taken as pre-reforms period while period from 1991-2010 has been
considered as the post-reforms period on the basis of data available in various issues of statistical
abstract of Punjab. The analysis of data reveals that the average number of medical institutions
for the period 1971-1980 was 919, the average number of beds was 13005, and the average
number of doctors was 6939 for the same period. If we take the 10 years average for the period
1981-1990 the figure increased to 2141, 22590 and 11119 respectively. So, the comparison of
these two decades clearly shows that there is a substantial increase on account of all these three
parameters which indicates the improvement in the health infrastructure in Punjab during the
pre-reforms period. However, this increase was marginal during the period 1991-2000 as the first
decade of economic reforms and the number increased to 2222, 24931 and 15056 respectively.
When we move further and look on the period 2001-2010 i.e. the second decade of economic
reforms we find that there is a decline in the first two indicators and the number declined to 2177
and 24381whereas the third indicator (doctors‟ strength) increased from 15056 to 19728 during
the same period. So, Punjab witnessed a negative growth rate during the post-reforms period in
regard to number of medical institutions and number of total beds available during the period
from 1991-2010. This decline has impact on population served per institution and availability of
beds in Punjab during the post-reforms period. So, again three parameters are taken to analyse
the data for these four decades by taking the indicators, namely, population served per
51
institution, population served per bed and population served per doctor. The figures for these
three parameters are 18109, 1189 and 2210 as an average for the period 1971-1980. This
situation improved during the period 1981-1990 when the population served per institution
declined to 8795, 833 (population served per bed) and 1687 (population served per doctor).
However, we find a reverse trend during the first decade of post-reforms period (1991-2000)
with the number increased in case of first two parameters while there was decline on account of
third parameter. The population served per institution increased to 9967, 888 (population served
per bed) and 1500 (population served per doctor). This number further increased in case of first
two parameters to 11919, 1068 but declined to 1346 in case of third parameter i.e. population
served per doctor. So, a clear relationship emerge that the decline in the total number of medical
institutions, total number of beds during the post-reforms period has led to the increase in
population served per institution and per bed. On the other hand, the increase in the number of
doctors has improved the situation in regard to the population served per doctor in Punjab during
both pre and post-reforms period. The declining trend of the medical institutions and the number
of beds in Public health sector of Punjab accompanied with the increasing population in the state
has affected the population served per institution and availability of bed. However, this trend has
reversed from 2011 onwards. The recent data analysis reveals that population served per doctor has
drastically increased to 9817 as on 31/12/2017.
The analysis of data further reveals that the health infrastructure at the rural end remains
inadequate as the state has not been able to meet the standards set by the centre regarding the
population served by CHC, PHC and SC. According to the IPHS norms, there should be one
CHC for 1,20,000, PHC for 30,000 population and SC for 5000 in plain areas. As against these
standards, each SC was serving a population of 5,877 and the people served by PHC are 40,619.
Due to the deficient number of government medical institutions, the patient load is very high on
the existing health institutions. In Punjab the number of villages covered by one PHC is 29 and
only one CHC is available for 84 villages. All these indices show the poor condition of the health
services in rural Punjab. Besides this, the condition of the existing rural health dispensaries is
deplorable as they lack the basic facilities. In Punjab, nearly 165 sub centres were working
without proper water supply and 200 were without regular electric supply. So in order to improve
the overall health status of Punjab, the rural health should be given the top most priority
(Ghuman Saif 2016).
52
3.5.4 Patients Treated in Medical Institutions of Punjab
The number of patients availing the public health services is another indicator of the utilisation
of the health facilities provided in the government hospitals. The analysis of data based on four
decades covering the period from 1970-1990 and 1991-2010 by taking two important indicators,
namely, number of in-patients and out-patients treated by the public hospitals reveals that there is
a continuous increase in the in-patients and out-patients during both the pre and post-reforms
period in Punjab. However, the increase in number of patients during the pre-reforms period was
higher than the increase during the post-reforms period. For instance, the number of in-patients
was 300980 which increased to 444694 which further increased to 457620 and 483700 for the
period 1971-1980 (average), 1981-1990 (average) followed by 1991-2000 and 2001-2010.
Similarly, the number of out-patients treated also increased from 9431703 (10 year average) to
12732989 which declined to 10921590 but again increased to 12575000 for the same period i.e.
four decades of pre and post-reforms period in Punjab. The declining growth rate, despite the
increasing population, shows the lack of trust in the public medical institutions among the
people. Another finding which is a matter of great concern is the small number of indoor patients
availing the government health services. The analysis reveals that the post reforms period
witnessed the deterioration of the government health services and the growth of the private
health care providers (Ghuman Saif 2016).
3.6 Major Health Issues in Punjab and Government's Initiatives
3.6.1 Maternal Health
In order to achieve the targets, the government has focused on providing the ante-natal care, safe
delivery and post natal care through various maternal health programmes. Janani Suraksha
Yojana (JSY) was the first major initiative launched under NRHM in 2005. It aims to shift the
births from home to health institutions and also provides financial support to the women
belonging to scheduled castes and below the poverty line. Apart from the central government
schemes for improving the maternal health, several other initiatives have been taken by the
Punjab government. These include Surakhit Janepa Yojana, a public private partnership under
which BPL and SC women can get the delivery done for free from certain accredited private
institutions. Another state scheme named Mata Kaushalya Yojna was started in 2011 to motivate
the women for deliveries in public health institutions by giving them financial incentives. Under
this scheme, every woman irrespective of caste and economic status is given Rs 1000 for
delivering their baby in a government medical institution. The Punjab government has also
53
launched Mother and Child Health Plan (2014-2017) to effectively implement the maternal and
child health schemes framed by the central government.
All these steps have led to a drastic change in the percentage of institutional deliveries in
Punjab. In 2008-09, only 59 per cent of the total births took place in health institutions which
increased to 85 per cent in 2014 (Health Management Information System, Punjab). Despite this
increase, the MMR has shown a very slow improvement. The reason is that these schemes
concentrated on only one aspect of maternal health which is institutional delivery, ignoring the
improvement in quality of care which is provided to pregnant women in the health institutions. A
large proportion of the Auxiliary Nurse Midwives and doctors handling the deliveries lack the
Skilled Birth Attendant (SBA) training (Randive et al., 2013) The current status of maternal
health and the achievement of the maternal health programmes indicate that the objective of
'skilled birth attendance' has been substituted with 'institutional deliveries'. Moreover, the
programmes have failed to reach the neediest section of the women highlighting the inequitable
approach of these schemes. Inter district variations also exist in the number of women registered
for JSY. Out of the total number of women registered for Ante Natal Care only a small
proportion was registered to receive the benefits of the JSY in some districts such as Pathankot,
Gurdaspur, Fatehgarh Sahib (SRS Bulletin, 2014). Another issue of concern for these schemes is
the lack of timely disbursement of financial incentives. This problem is more critical in the
Punjab's Mata Kaushalaya Yojana which is currently facing a fund deficit. As per the scheme the
beneficiaries should be given the financial support on the day of discharge from the hospital,
however, the hospitals often receive grants after the discharge of the patient (The Tribune, July
30, 2015). Thus, the beneficiaries are facing hardship to collect the incentives promised by the
government.
3.6.2 Cancer crisis in Punjab
The increasing incidence of cancer cases in Punjab is the most critical issue being faced by state
health system. The situation is so alarming that there are 90 cancer patients per 1,00,000 people
which is higher than the Indian average of 80 per lakh. In 2012 it was found that on an average
127 people die of cancer per lakh population in Punjab and this number was 144 in Malwa
region. The second highest incidence is in Doaba region with a death rate of 136.
The Cancer survey report (2012) revealed that 34,430 people died of cancer in Punjab in
five years (2007-2012). It was after this report that the government woke up and felt the need of
cancer prevention schemes and hospitals offering specialised treatment. As a result, Mukh
54
Mantri Punjab Cancer Rahat Kosh Scheme (MMPCRKS) was launched in 2012. Under this
scheme, the cancer patients who are non-government employees and are without health
insurance are entitled to free treatment of cancer (with maximum ceiling of 1.5 lakh per case) in
the hospitals empanelled by the Punjab Government. The majority of the empanelled hospitals
are private which inflates the treatment costs beyond 1.5 lakhs compelling the patients to pay the
balance.
It has been seen that in the absence of an affordable treatment option in Punjab the poor
patients travel to Acharya Tulsi Regional Cancer Institute, Bikaner to avail the benefits of
MMPCRKS. The train from Bathinda to Bikaner carries an average of 100 patients everyday and
is commonly called as 'The Cancer Train'. The recent development in this field is the setting up
of two new cancer hospitals in Punjab, namely, Homi Bhabha Cancer Super speciality hospital in
Sangrur and Advanced Cancer Treatment and Research Centre at Bathinda. Moreover, a Cancer
hospital is under construction in Mullanpur (Chandigarh) and is expected to start operating soon.
In another initiative, the state government has collaborated with a non government organisation
called 'Roko cancer' which organises cancer detection and awareness camps free of cost. The
diagnosis is done with the help of cancer detection mobile units. A total of 987 common cancer
patients were found from 1.1.2018 to 31.12.2018 as per National Health Profile 2019.
The higher incidence of cancer has forced the Central Government to start Punjab Cancer
atlas project under Indian Council of Medical Research. The project aimed at collecting the data
to determine the most prevalent type of cancer and its patterns across the state. The first report of
Cancer Atlas was prepared for the years 2012 and 2013. The report revealed that in male patients
the prostate cancer was the most common whereas the majority of the female patients had breast
cancer. Although the government has taken few steps for the treatment of cancer patients, a lot
more needs to be done to control the deadly disease. Besides, the curative measures the
government needs to emphasize on the preventive measures. The people should be educated
about the harmful effects of excessive use of pesticides and the intake of alcohol and tobacco
should also be discouraged (Ghuman, Saif, 2016).
3.7 Recent Initiatives to Strengthen Health System in Punjab
Besides the health initiatives taken by the Punjab government discussed above the following
citizen services have also been started recently in the state to strengthen the existing health
system.
55
The Punjab health department is developing integrated HMIS under which the
information of all the health schemes in the state will be pooled. This information system will
help to monitor the performance of various health programmes being run in the state.
ERS also called 108 service is a 24-hour ambulance service for the accident victims and
the patients requiring critical care. This free of cost service was started in Punjab in 2011 under
public private partnership model. The Punjab government in partnership with Ziqitza Healthcare
Limited (ZHL) launched this service with 90 ambulances and the number was later increased to
240 in a phased manner (Punjab Health System Corporation). The service proved to be very
beneficial and in four years of its operation, it was used by nearly 10 lakh people (The Tribune,
2015). The annual expenditure on this network of ambulances is Rs. 17 crores out of which 80
per cent is incurred by the Punjab government and 20 per cent by the centre (NRHM). A study
by PGIMER regarding 108 ambulances found the number of ambulances to be adequate but it
criticized the service for its high cost. The operating cost of ERS per patient is quite high.
Therefore, the state government should take steps to bring down the operating cost of the
ambulances.
104 health helpline service was launched by Punjab government in 2014. It is a 24-hour
toll-free service through which the callers can get medical advice from a doctor and information
on various health issues and schemes from a competent and qualified person. The aim of the
service is to provide health information to the people, particularly in the far flung areas. Apart
from this, it also acts as a grievance redressal system for the patients of the government health
institutions. The service is provided through a call centre operated by ZHL. The utility of this
service may be judged from the fact that total of 47, 476 calls were received at 104 helpline in
one year i.e. from June 2014 to June 2015 out of which majority of the callers sought
information about the health schemes in Punjab (The Tribune, 2015).
MMU is a service which attempts to take the delivery of health services at the doorstep of
the people living in the rural areas and urban slums where the health facilities are not easily
accessible. The MMUs in Punjab operate under Punjab Health System Corporation since 2008.
There were 24 well equipped MMUs in the state (PHSC data). Each MMU consists of one or two
vehicles which carry a team of medical staff and diagnostic tools such as X-ray, ECG machine.
At least one MMU is assigned to each district to provide primary health care facilities by
56
conducting basic health investigations of the people. All the diagnostic services and supply of
medicines are provided free of cost. The concept of MMUs is undoubtedly a positive step to
improve the provision of health services. But the PHSC data shows that the number of patients
examined and X-rays done is declining year by year. In 2013-14, 354654 patients were examined
by MMUs and 6795 X-rays were done as compared to 477006 and 9998 in 2010-11. The
decrease in the number of patients may be attributed to low efficiency and quality of health care
provided by MMUs. It has been reported that the Punjab government has failed to release the
funds in time to effectively run these units. The shortage of medical officers and laboratory
technicians is another issue being faced by this service (Hindustan Times, 2014).
Telemedicine refers to the use of information technology to provide specialised
healthcare to the patients in remote areas. In Punjab, there are 22 telemedicine sites which
include 3 medical colleges and 19 hospitals. The hospitals are digitally connected to PGI,
Chandigarh and state medical colleges which help the patients to get expert advice from the
doctors through video conferencing without spending time and money on travelling. The success
of this project is possible only if the installed technology is efficiently used by hiring tech-savvy
staff. The telemedicine sites in Punjab are facing a shortage of motivated and skilled staff which
results in frequent mistakes such as sending incomplete histories of the patient. Moreover, it has
been observed that most of the referrals are made in the last week of the month which might be
due to pressure to meet the utilisation targets set for each month (Mittal, 2013). As this concept
is new, the state health department should provide proper training to the doctors and motivate
them to make increased use of it.
3.8 Empirical Evidences of Health Scenario in Punjab
Gill and Ghuman (2000) observed that prioritising rural health care in the state policy by
allocating additional investments for sanitary infrastructure and medical personnel in rural areas
is essential for redressing the growing disparity in health care facilities between rural and urban
Punjab.
Ghuman and Mehta (2009) investigated the key concerns of health sector in India, i.e.,
quality of healthcare and accessibility of health services. The study was conducted in the
Muktsar District of Punjab state. Data was obtained from a sample of 352 families which
includes 300 rural and 52 urban families. The findings of the study revealed the preference of
57
people for private health care services over public health care services. Lack of proper health
care infrastructure and its maintenance along with insufficient government attention towards
health sector in state allowed the even existing facilities to deteriorate. The authors suggested for
allocation of more funds for shaping public health care services in order to tackle key concerns
of health sector (like scarcity of health care personnel, lack of range of good health care
facilities/schemes etc.).
Singh (2010) observed that commercialisation and privatisation of health services have
excluded a sizeable proportion of the population, particularly those belonging to socially
disadvantaged groups like landless labourers, marginal and small farmers, and poor from the
coverage of health services provided by organized sector in rural areas. The subsequent financial
burden of private healthcare services is responsible for a large proportion of total borrowing by
these underprivileged sections of society. Therefore, policy measures like increasing the share of
state‟s expenditure on healthcare, especially in rural areas, improving the existing healthcare
facilities, filling up of vacant posts in these institutions, frequent surprise visits by higher
officials to check absenteeism, compulsory rural postings of staff and fixing accountability of
employees are necessary to improve the rural health service delivery in the Punjab state.
Gill et al. (2010) conducted a study to investigate the impact of withdrawal of state
government from the health sector in Punjab. The findings of the study showed that (i) due to
stagnated public care infrastructure, bed occupancy rate is very low in public hospital, and (ii)
due to lack of funds, vacancies are not filled, thus shortage of health workforce. In this context,
the study recommended for the adoption of a proper health policy by the state government with
fresh investment in health sector along with providing platforms for community participation in
this sector.
Randhawa and Sidhu (2011) examined the status of public health care services in the
Punjab state in the post reform period. The study was based on the secondary sources of data.
The authors argued that although Punjab state is among front runners as per agricultural produce
indicators but lags behind as compared to other states in terms of health indicators. Further, even
the setting up of Punjab Health Systems Corporation (PHSC) with the assistance of World Bank
couldn‟t save the fall in accessibility and quality of health care services in the state. The study
found that healthcare has become a pure commodity in Punjab, those who can afford can avail
the services and for others especially the poor section of society, it has become a distant dream.
58
Singh (2011) examined the current state of public-private partnerships (PPPs) in health
care in Punjab, and possibilities for new kinds of initiatives in this broad category of institutional
arrangements. The study observed that Indian government has recognized the need for public
policy action, and is implementing a massive National Rural Health Mission (NRHM) to
improve public sector delivery of health care services, especially in poorer states, and especially
to the poor all over the country. The NRHM involves substantial increases in funding, and many
innovations in organizational arrangements, including collaborations with a range of private
sector entities. In the state of Punjab also the NRHM provides substantial new funding to the
Punjab government, and it, too, is attempting reforms in publicly provided health care services.
In parallel, the Punjab government has a well-defined procedure for considering PPPs, including
in health care, but with a focus on the strengthening of infrastructure, i.e., hospitals in this
particular sector. The study found that the current use of PPPs for health care in Punjab is
moderately successful, but with extremely limited scope.
Singh et al. (2013) carried out a study to measure patient‟s satisfaction with the help of
simple and cost effective way of evaluating hospital‟s performance and the services they provide.
The study found that most of the patients were satisfied with the behavior of the doctors and
were dissatisfied with the cleanliness of hospital premises (toilets and wards). Maximum number
of patients visiting government hospitals was from the poor section of the community.
The cancer survey report (2012) revealed that 34430 patients died of cancer in Punjab in
Five years (2007-12). There was threefold increase in the number of cancer patients between
2009 to 2012. It was after this report that government launched Mukh Mantri Punjab Cancer
Rahat Kosh Scheme (MMPCRKS) in 2012. Under this scheme, the non-government employees
and those who are without health insurance are entitled to free treatment of cancer (with
maximum ceiling of Rs. 1.5 lakh per case) in hospitals empanelled by the government of Punjab.
However, majority of the empanelled hospitals are private in nature which inflates the treatment
cost beyond 1.5 lakh compelling the patients to pay from the pocket. This has become a major
cause of increasing debt burden in rural Punjab leading to suicide by farmers and agricultural
labourers in Punjab (The Tribune, April 4, 2015).
Prinja et al. (2016) analyzed the economic cost of delivering health care services in
fourteen hospitals of three states, namely, Punjab, Haryana and Himachal Pradesh. The study
found that more than 50 per cent of the funds were utilized to pay salaries to the doctors and the
59
staff. They also found that a very meager allocation of Rs. 162 per capita per year was to meet
the cost of preventive and curative services at PHC and CHC level of care.
Ghuman, Saif (2016) highlighted that beside cancer, drug addiction is another serious
problem in Punjab. To deal with the situation, 31 drug de-addiction centres (DDCs) have been
set-up by the government of Punjab in addition to large number of private drug de-addiction
centres. Apart from this, the government has set-up five 50 bedded drug de-addiction centres
with modern facilities at Bathinda, Faridkot, Jalandhar and Amritsar. The government approved
a sum of Rs. 100 lakh for the year 2014-15 to control the drug menace. The number of drug
addicts is so large, but the government charged an amount of Rs 1000 as admission fee from the
addicts and Rs. 200 per day in DDC which lead to decrease in bed occupancy in these centres.
Ghuman, Saif (2016) further, found that there is a significant association between the
monthly income of the family and occupation of the patient and the type of hospital chosen for
treatment by the patient. In other words, analysis reveals that the families with higher income
prefer to use the services of private hospitals. On the other hand, majority of the government
health services users belong to either farming sector or were labourers who happen to be from
poor income group. The study further found that except „cost of availing hospital services‟, on all
other factors the private hospitals‟ patients were found more satisfied than the government
hospitals‟ patients. Despite the dissatisfaction of the patients with the high cost of the private
health services they were found to be overall more satisfied. This is the cause of poor condition
of the government health services in Punjab.
The foregoing analysis of the review of literature leads us to the conclusion that health
reforms have failed to improve the health system in Punjab. It has been noticed that the
government created new infrastructure under PHSC instead of strengthening the existing one
which lead to wastage of funds in the creation of a parallel health system to the existing system.
Further, the state is still facing a huge shortage of specialist doctors and infrastructure which is
forcing people to use private health services. Further, gradual withdrawl of the government from
the health sector and encouragement to private sector by giving them subsidies and exempting
them from taxes has further weakened the public health sector. The dependence of patients on
private sector has increased the financial burden on the poor. Further, public-private partnership
has also not been found to be successful in Punjab. The increasing cost of health services in the
private sector forced the poor sections to depend on the poor quality services of the public health
sector.
60
Furthermore, the decentralization of public health services through the zila parishad has
also failed to improve the access and delivery of public health services in Punjab. It has been
found that due to the poor financial health Punjab government has failed to utilize the health
funding provided under the NRHM as well as the other centrally financed schemes of health. The
most important issue which emerge from the empirical evidences that common people has lost
faith in public health system due to which they prefer to avail private health services in Punjab.
Moreover, Punjab government could not develop a long run health policy to deal with non-
communicable diseases like cancer and drug addiction.
61
CHAPTER IV
WORKING OF PUNJAB HEALTH SYSTEMS CORPORATION
Secondary or First Referral Healthcare institutions play a vital and complementary role in the
primary and tertiary health care system. In the 1990s, District hospitals, Sub – Divisional
Hospitals and Community Health Centers of the Punjab state were in the poor condition due to
staff crunch and lack of funds required for development of infrastructure. To overcome this
problem, Punjab government approached the World Bank to provide financial aid to improve
quality of healthcare delivery system. As a result, on Feb 20, 1996 World Bank proposed a credit
of USD 350 million under Multi-State Health System Development Project to India with the aim
to assist Government of Punjab, Karnataka and West Bengal to put in place a first referral
healthcare system (MoU World Bank, 1996). Out of USD 350 million allocated to three states of
India, in the state of Punjab, PHSC was set up with the financial assistance of around USD 106.1
million in the state of Punjab. USD 89.7 million was sanctioned by International Development
Association (IDA) and rest of USD 16.4 million was planned to be met by Punjab Government.
It is worth mentioning here that the World Bank agreed to extend financial aid subject to
the condition that government of Punjab will set up a separate corporation in addition to existing
healthcare delivery system. At the initial stage, government was reluctant to form a new
corporation but later on failed to resist pressure of the World Bank. So ultimately a parallel
health system was created in the form of PHSC (Ghuman, 2016). Thus, with the approval of
Governor of Punjab in April, 1996, Punjab Health Systems Corporation (PHSC) was
incorporated through the enactment of Legislative Act which is called “The Punjab Health
Systems Corporation Act, 1996” (Punjab Act No. 6 of 1996). The corporation took over around
166 existing medical institutions which included District hospitals, Sub – Divisional Hospitals
and Community Health Centers. The main objective of setting up of PHSC was to improve
efficiency of health resources through policy and institutional development and to provide
quality services, coverage and effectiveness at secondary level of healthcare. Ultimate goal of
this project was to improve health status especially of poor people, by reducing mortality,
morbidity and disability.
Specifically the main objectives of PHSC were as follows:
(a) To improve efficiency in the allocation and use of health resources in the Punjab State
through policy and institutional development; and
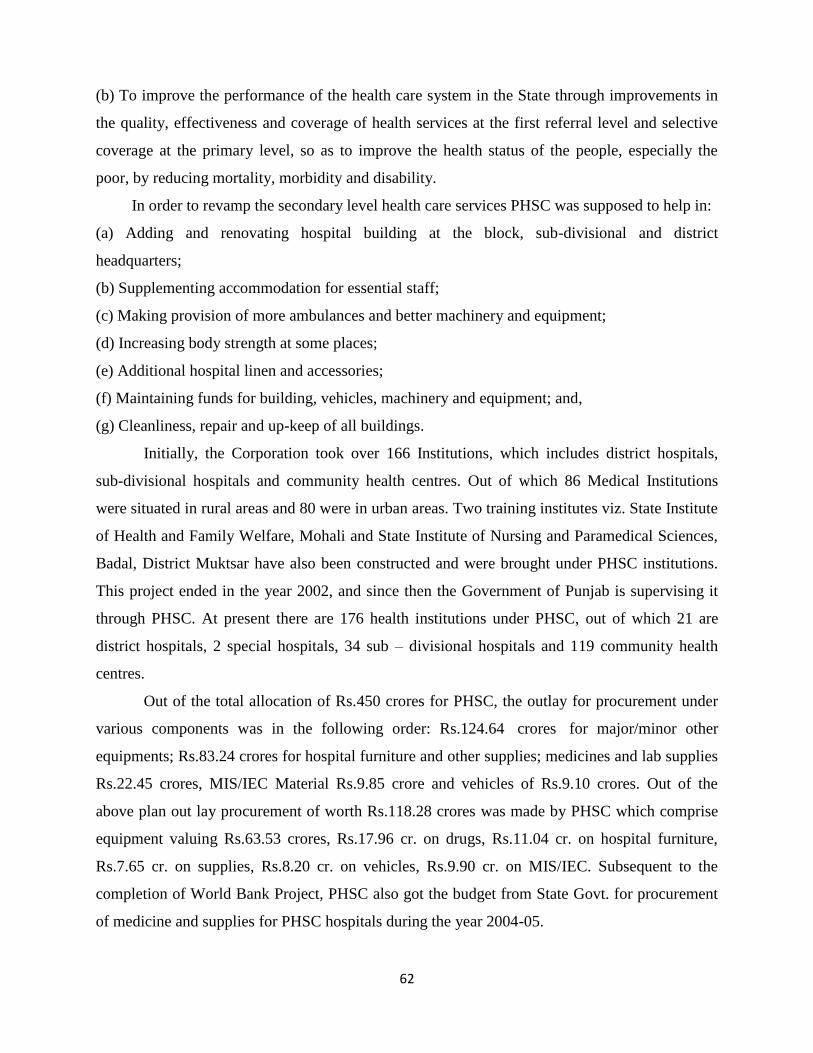
62
(b) To improve the performance of the health care system in the State through improvements in
the quality, effectiveness and coverage of health services at the first referral level and selective
coverage at the primary level, so as to improve the health status of the people, especially the
poor, by reducing mortality, morbidity and disability.
In order to revamp the secondary level health care services PHSC was supposed to help in:
(a) Adding and renovating hospital building at the block, sub-divisional and district
headquarters;
(b) Supplementing accommodation for essential staff;
(c) Making provision of more ambulances and better machinery and equipment;
(d) Increasing body strength at some places;
(e) Additional hospital linen and accessories;
(f) Maintaining funds for building, vehicles, machinery and equipment; and,
(g) Cleanliness, repair and up-keep of all buildings.
Initially, the Corporation took over 166 Institutions, which includes district hospitals,
sub-divisional hospitals and community health centres. Out of which 86 Medical Institutions
were situated in rural areas and 80 were in urban areas. Two training institutes viz. State Institute
of Health and Family Welfare, Mohali and State Institute of Nursing and Paramedical Sciences,
Badal, District Muktsar have also been constructed and were brought under PHSC institutions.
This project ended in the year 2002, and since then the Government of Punjab is supervising it
through PHSC. At present there are 176 health institutions under PHSC, out of which 21 are
district hospitals, 2 special hospitals, 34 sub – divisional hospitals and 119 community health
centres.
Out of the total allocation of Rs.450 crores for PHSC, the outlay for procurement under
various components was in the following order: Rs.124.64 crores for major/minor other
equipments; Rs.83.24 crores for hospital furniture and other supplies; medicines and lab supplies
Rs.22.45 crores, MIS/IEC Material Rs.9.85 crore and vehicles of Rs.9.10 crores. Out of the
above plan out lay procurement of worth Rs.118.28 crores was made by PHSC which comprise
equipment valuing Rs.63.53 crores, Rs.17.96 cr. on drugs, Rs.11.04 cr. on hospital furniture,
Rs.7.65 cr. on supplies, Rs.8.20 cr. on vehicles, Rs.9.90 cr. on MIS/IEC. Subsequent to the
completion of World Bank Project, PHSC also got the budget from State Govt. for procurement
of medicine and supplies for PHSC hospitals during the year 2004-05.
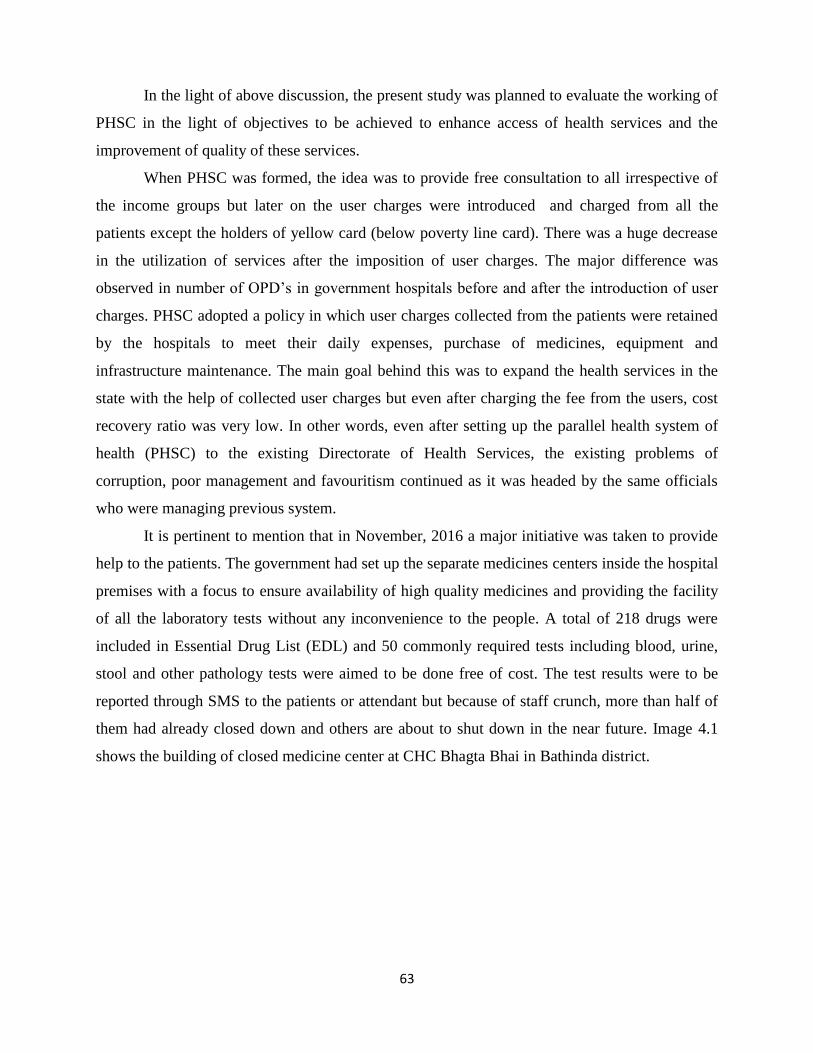
63
In the light of above discussion, the present study was planned to evaluate the working of
PHSC in the light of objectives to be achieved to enhance access of health services and the
improvement of quality of these services.
When PHSC was formed, the idea was to provide free consultation to all irrespective of
the income groups but later on the user charges were introduced and charged from all the
patients except the holders of yellow card (below poverty line card). There was a huge decrease
in the utilization of services after the imposition of user charges. The major difference was
observed in number of OPD‟s in government hospitals before and after the introduction of user
charges. PHSC adopted a policy in which user charges collected from the patients were retained
by the hospitals to meet their daily expenses, purchase of medicines, equipment and
infrastructure maintenance. The main goal behind this was to expand the health services in the
state with the help of collected user charges but even after charging the fee from the users, cost
recovery ratio was very low. In other words, even after setting up the parallel health system of
health (PHSC) to the existing Directorate of Health Services, the existing problems of
corruption, poor management and favouritism continued as it was headed by the same officials
who were managing previous system.
It is pertinent to mention that in November, 2016 a major initiative was taken to provide
help to the patients. The government had set up the separate medicines centers inside the hospital
premises with a focus to ensure availability of high quality medicines and providing the facility
of all the laboratory tests without any inconvenience to the people. A total of 218 drugs were
included in Essential Drug List (EDL) and 50 commonly required tests including blood, urine,
stool and other pathology tests were aimed to be done free of cost. The test results were to be
reported through SMS to the patients or attendant but because of staff crunch, more than half of
them had already closed down and others are about to shut down in the near future. Image 4.1
shows the building of closed medicine center at CHC Bhagta Bhai in Bathinda district.
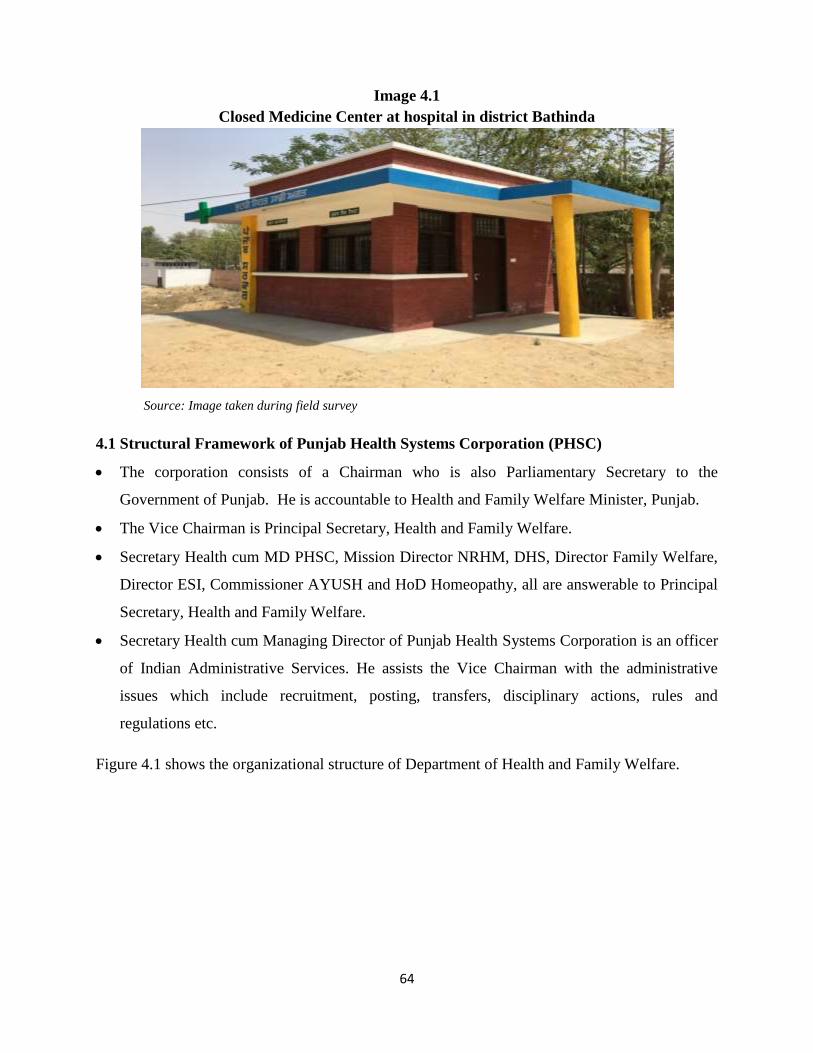
64
Image 4.1
Closed Medicine Center at hospital in district Bathinda
Source: Image taken during field survey
4.1 Structural Framework of Punjab Health Systems Corporation (PHSC)
The corporation consists of a Chairman who is also Parliamentary Secretary to the
Government of Punjab. He is accountable to Health and Family Welfare Minister, Punjab.
The Vice Chairman is Principal Secretary, Health and Family Welfare.
Secretary Health cum MD PHSC, Mission Director NRHM, DHS, Director Family Welfare,
Director ESI, Commissioner AYUSH and HoD Homeopathy, all are answerable to Principal
Secretary, Health and Family Welfare.
Secretary Health cum Managing Director of Punjab Health Systems Corporation is an officer
of Indian Administrative Services. He assists the Vice Chairman with the administrative
issues which include recruitment, posting, transfers, disciplinary actions, rules and
regulations etc.
Figure 4.1 shows the organizational structure of Department of Health and Family Welfare.
65
Figure 4.1
Organisational Structure of Department of Health and Family Welfare
Source: PHSC website URL: http://pbhealth.gov.in/org.htm
At district headquarter level, there is one Deputy Director (DD) cum Civil Surgeon (CS) in
each district and hence a total of 22 DD cum CS are posted in Punjab.
At block level, the Civil Surgeon is supported by Senior Medical Officers (SMO) and one
hospital may have more than one SMOs depending upon bed strength of the hospital. For
every 100 beds, 1 SMO is deputed. For example, Amritsar is 200 bedded hospital and have 2
SMO posts.
Deputy Medical Commissioner (DMC) looks after the health care services in District
Hospitals, Sub-Divisional Hospitals and Community Health Centers, which are headed by
SMOs of the hospital.
Figure 4.2 shows the hierarchical structure of Punjab Health Systems Corporation. Chairman is
head of PHSC and Managing Director of PHSC is an officer of IAS rank.
Health and Family Welfare Minister
Parliamentary Secretary Health & Family Welfare
Principal Secretary Health & Family Welfare
Secretary Health cum Managing Director PHSC
PHSC
Mission Director NRHM
Director Health
Services
Director Family Welfare
Director Social
Insurance (ESI)
Commissioner AYUSH
HoD Homeopathy
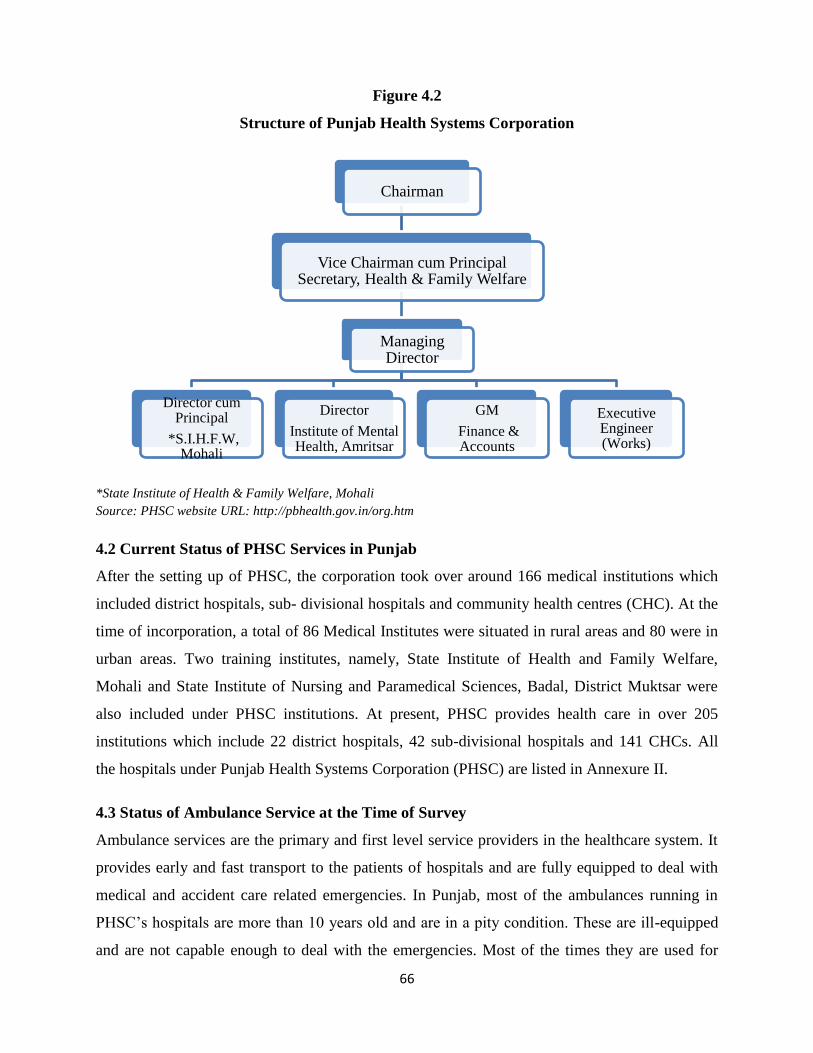
66
Figure 4.2
Structure of Punjab Health Systems Corporation
*State Institute of Health & Family Welfare, Mohali
Source: PHSC website URL: http://pbhealth.gov.in/org.htm
4.2 Current Status of PHSC Services in Punjab
After the setting up of PHSC, the corporation took over around 166 medical institutions which
included district hospitals, sub- divisional hospitals and community health centres (CHC). At the
time of incorporation, a total of 86 Medical Institutes were situated in rural areas and 80 were in
urban areas. Two training institutes, namely, State Institute of Health and Family Welfare,
Mohali and State Institute of Nursing and Paramedical Sciences, Badal, District Muktsar were
also included under PHSC institutions. At present, PHSC provides health care in over 205
institutions which include 22 district hospitals, 42 sub-divisional hospitals and 141 CHCs. All
the hospitals under Punjab Health Systems Corporation (PHSC) are listed in Annexure II.
4.3 Status of Ambulance Service at the Time of Survey
Ambulance services are the primary and first level service providers in the healthcare system. It
provides early and fast transport to the patients of hospitals and are fully equipped to deal with
medical and accident care related emergencies. In Punjab, most of the ambulances running in
PHSC‟s hospitals are more than 10 years old and are in a pity condition. These are ill-equipped
and are not capable enough to deal with the emergencies. Most of the times they are used for
Chairman
Vice Chairman cum Principal Secretary, Health & Family Welfare
Managing Director
Director cum Principal
*S.I.H.F.W, Mohali
Director
Institute of Mental Health, Amritsar
GM
Finance & Accounts
Executive Engineer (Works)
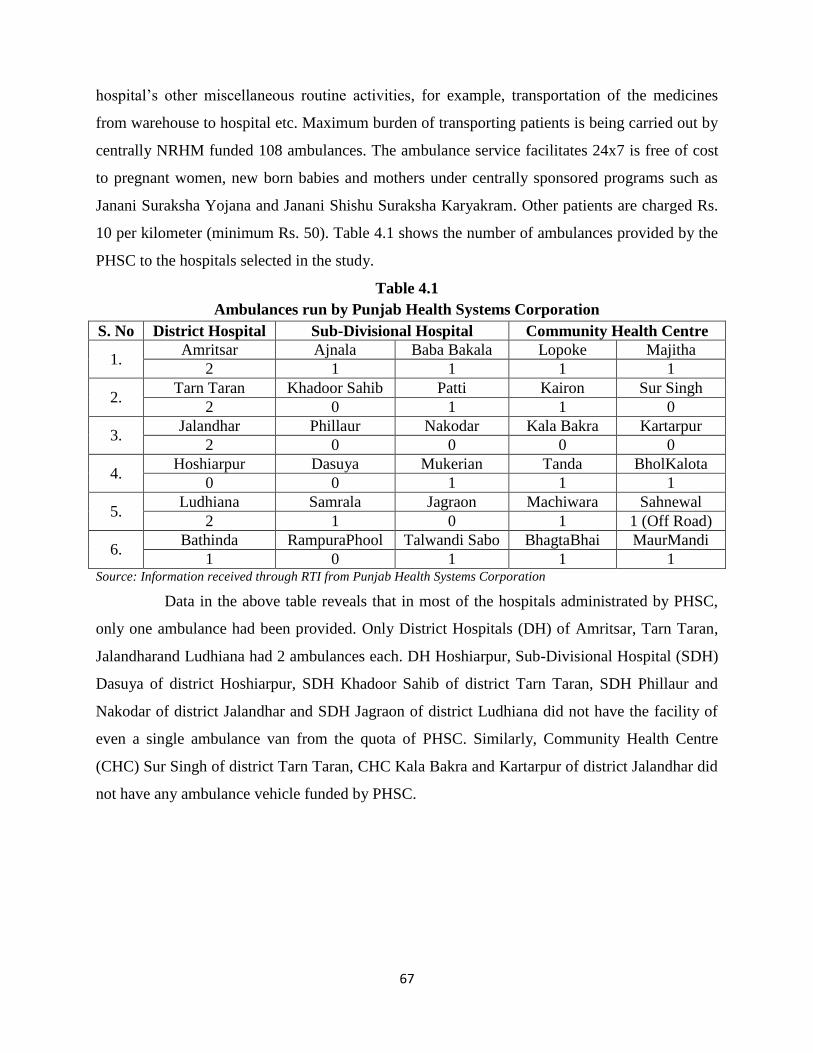
67
hospital‟s other miscellaneous routine activities, for example, transportation of the medicines
from warehouse to hospital etc. Maximum burden of transporting patients is being carried out by
centrally NRHM funded 108 ambulances. The ambulance service facilitates 24x7 is free of cost
to pregnant women, new born babies and mothers under centrally sponsored programs such as
Janani Suraksha Yojana and Janani Shishu Suraksha Karyakram. Other patients are charged Rs.
10 per kilometer (minimum Rs. 50). Table 4.1 shows the number of ambulances provided by the
PHSC to the hospitals selected in the study.
Table 4.1
Ambulances run by Punjab Health Systems Corporation
S. No District Hospital Sub-Divisional Hospital Community Health Centre
1. Amritsar Ajnala Baba Bakala Lopoke Majitha
2 1 1 1 1
2. Tarn Taran Khadoor Sahib Patti Kairon Sur Singh
2 0 1 1 0
3. Jalandhar Phillaur Nakodar Kala Bakra Kartarpur
2 0 0 0 0
4. Hoshiarpur Dasuya Mukerian Tanda BholKalota
0 0 1 1 1
5. Ludhiana Samrala Jagraon Machiwara Sahnewal
2 1 0 1 1 (Off Road)
6. Bathinda RampuraPhool Talwandi Sabo BhagtaBhai MaurMandi
1 0 1 1 1 Source: Information received through RTI from Punjab Health Systems Corporation
Data in the above table reveals that in most of the hospitals administrated by PHSC,
only one ambulance had been provided. Only District Hospitals (DH) of Amritsar, Tarn Taran,
Jalandharand Ludhiana had 2 ambulances each. DH Hoshiarpur, Sub-Divisional Hospital (SDH)
Dasuya of district Hoshiarpur, SDH Khadoor Sahib of district Tarn Taran, SDH Phillaur and
Nakodar of district Jalandhar and SDH Jagraon of district Ludhiana did not have the facility of
even a single ambulance van from the quota of PHSC. Similarly, Community Health Centre
(CHC) Sur Singh of district Tarn Taran, CHC Kala Bakra and Kartarpur of district Jalandhar did
not have any ambulance vehicle funded by PHSC.
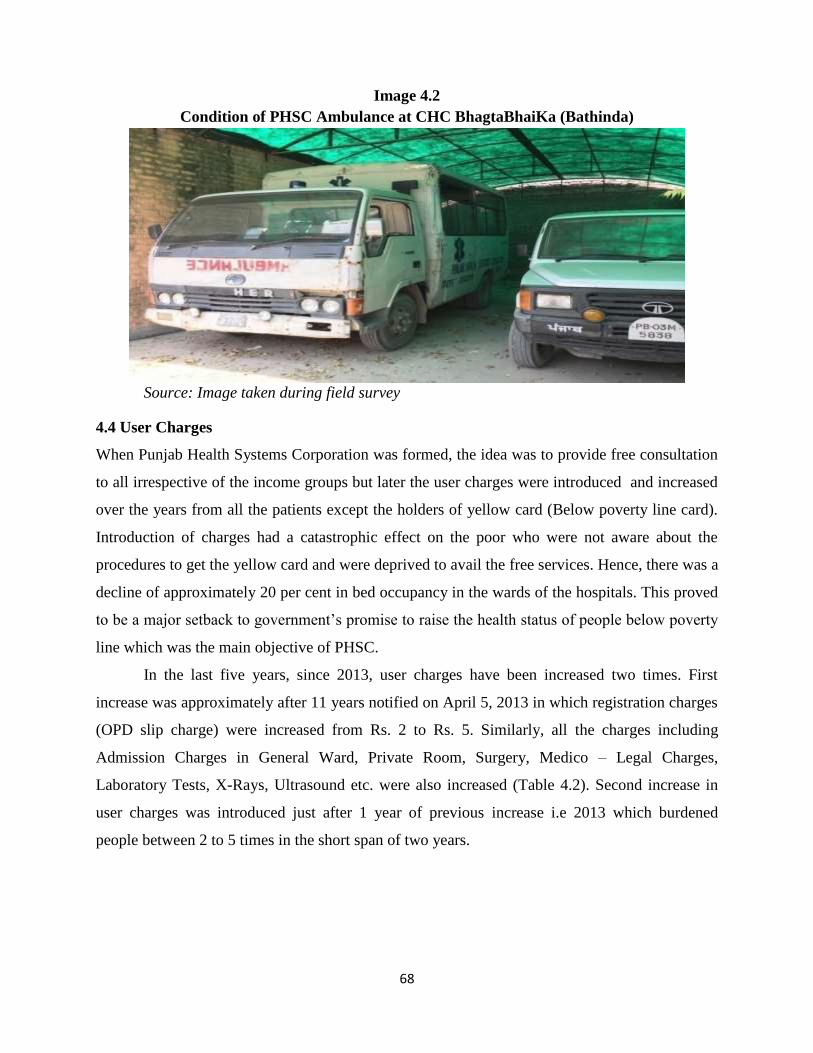
68
Image 4.2
Condition of PHSC Ambulance at CHC BhagtaBhaiKa (Bathinda)
Source: Image taken during field survey
4.4 User Charges
When Punjab Health Systems Corporation was formed, the idea was to provide free consultation
to all irrespective of the income groups but later the user charges were introduced and increased
over the years from all the patients except the holders of yellow card (Below poverty line card).
Introduction of charges had a catastrophic effect on the poor who were not aware about the
procedures to get the yellow card and were deprived to avail the free services. Hence, there was a
decline of approximately 20 per cent in bed occupancy in the wards of the hospitals. This proved
to be a major setback to government‟s promise to raise the health status of people below poverty
line which was the main objective of PHSC.
In the last five years, since 2013, user charges have been increased two times. First
increase was approximately after 11 years notified on April 5, 2013 in which registration charges
(OPD slip charge) were increased from Rs. 2 to Rs. 5. Similarly, all the charges including
Admission Charges in General Ward, Private Room, Surgery, Medico – Legal Charges,
Laboratory Tests, X-Rays, Ultrasound etc. were also increased (Table 4.2). Second increase in
user charges was introduced just after 1 year of previous increase i.e 2013 which burdened
people between 2 to 5 times in the short span of two years.
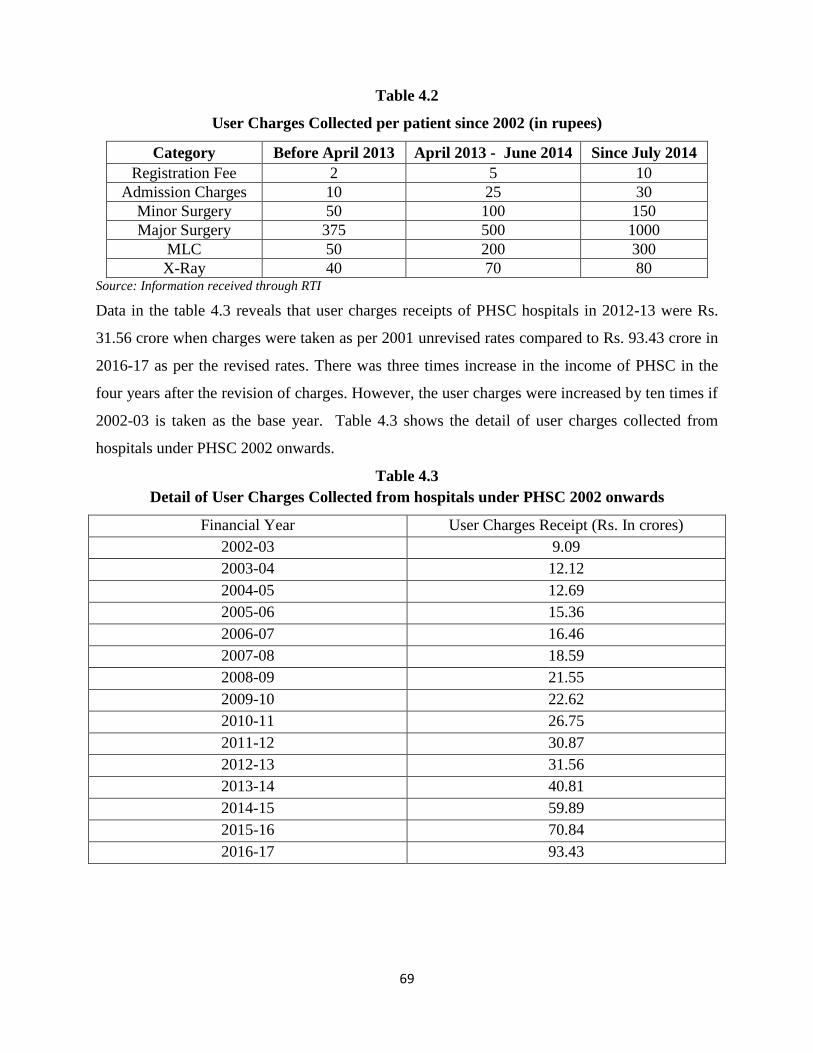
69
Table 4.2
User Charges Collected per patient since 2002 (in rupees)
Category Before April 2013 April 2013 - June 2014 Since July 2014
Registration Fee 2 5 10
Admission Charges 10 25 30
Minor Surgery 50 100 150
Major Surgery 375 500 1000
MLC 50 200 300
X-Ray 40 70 80 Source: Information received through RTI
Data in the table 4.3 reveals that user charges receipts of PHSC hospitals in 2012-13 were Rs.
31.56 crore when charges were taken as per 2001 unrevised rates compared to Rs. 93.43 crore in
2016-17 as per the revised rates. There was three times increase in the income of PHSC in the
four years after the revision of charges. However, the user charges were increased by ten times if
2002-03 is taken as the base year. Table 4.3 shows the detail of user charges collected from
hospitals under PHSC 2002 onwards.
Table 4.3
Detail of User Charges Collected from hospitals under PHSC 2002 onwards
Financial Year User Charges Receipt (Rs. In crores)
2002-03 9.09
2003-04 12.12
2004-05 12.69
2005-06 15.36
2006-07 16.46
2007-08 18.59
2008-09 21.55
2009-10 22.62
2010-11 26.75
2011-12 30.87
2012-13 31.56
2013-14 40.81
2014-15 59.89
2015-16 70.84
2016-17 93.43
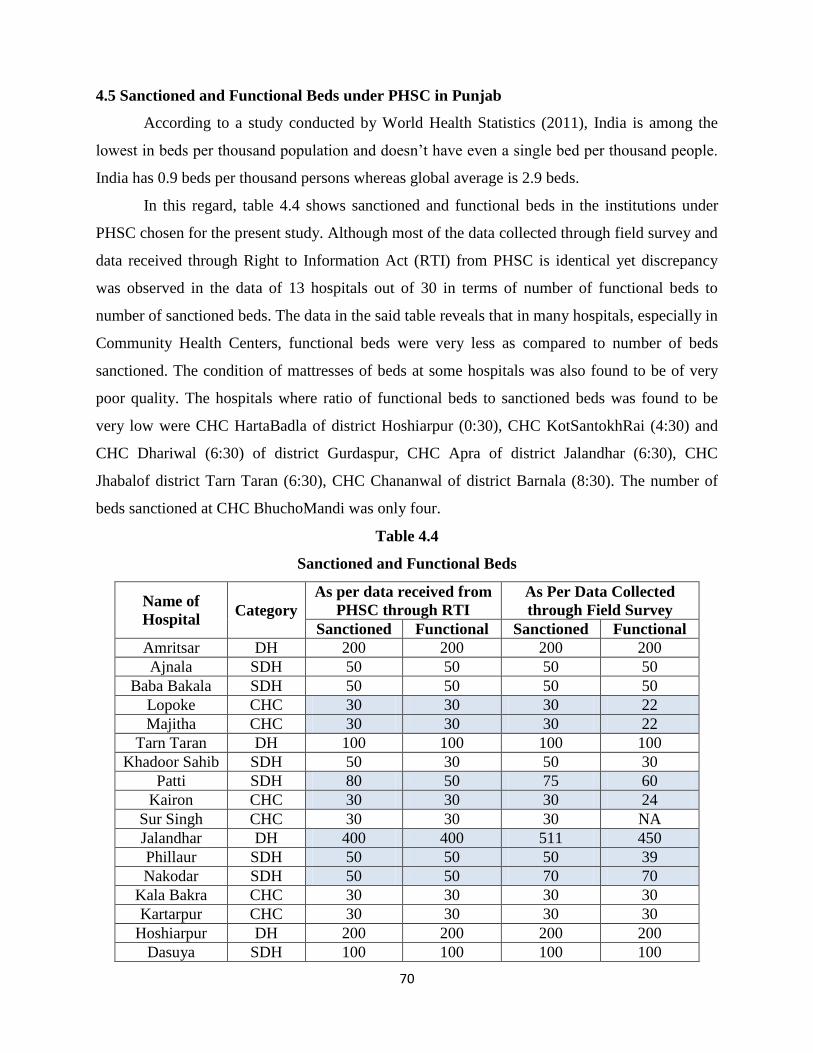
70
4.5 Sanctioned and Functional Beds under PHSC in Punjab
According to a study conducted by World Health Statistics (2011), India is among the
lowest in beds per thousand population and doesn‟t have even a single bed per thousand people.
India has 0.9 beds per thousand persons whereas global average is 2.9 beds.
In this regard, table 4.4 shows sanctioned and functional beds in the institutions under
PHSC chosen for the present study. Although most of the data collected through field survey and
data received through Right to Information Act (RTI) from PHSC is identical yet discrepancy
was observed in the data of 13 hospitals out of 30 in terms of number of functional beds to
number of sanctioned beds. The data in the said table reveals that in many hospitals, especially in
Community Health Centers, functional beds were very less as compared to number of beds
sanctioned. The condition of mattresses of beds at some hospitals was also found to be of very
poor quality. The hospitals where ratio of functional beds to sanctioned beds was found to be
very low were CHC HartaBadla of district Hoshiarpur (0:30), CHC KotSantokhRai (4:30) and
CHC Dhariwal (6:30) of district Gurdaspur, CHC Apra of district Jalandhar (6:30), CHC
Jhabalof district Tarn Taran (6:30), CHC Chananwal of district Barnala (8:30). The number of
beds sanctioned at CHC BhuchoMandi was only four.
Table 4.4
Sanctioned and Functional Beds
Name of
Hospital Category
As per data received from
PHSC through RTI
As Per Data Collected
through Field Survey
Sanctioned Functional Sanctioned Functional
Amritsar DH 200 200 200 200
Ajnala SDH 50 50 50 50
Baba Bakala SDH 50 50 50 50
Lopoke CHC 30 30 30 22
Majitha CHC 30 30 30 22
Tarn Taran DH 100 100 100 100
Khadoor Sahib SDH 50 30 50 30
Patti SDH 80 50 75 60
Kairon CHC 30 30 30 24
Sur Singh CHC 30 30 30 NA
Jalandhar DH 400 400 511 450
Phillaur SDH 50 50 50 39
Nakodar SDH 50 50 70 70
Kala Bakra CHC 30 30 30 30
Kartarpur CHC 30 30 30 30
Hoshiarpur DH 200 200 200 200
Dasuya SDH 100 100 100 100
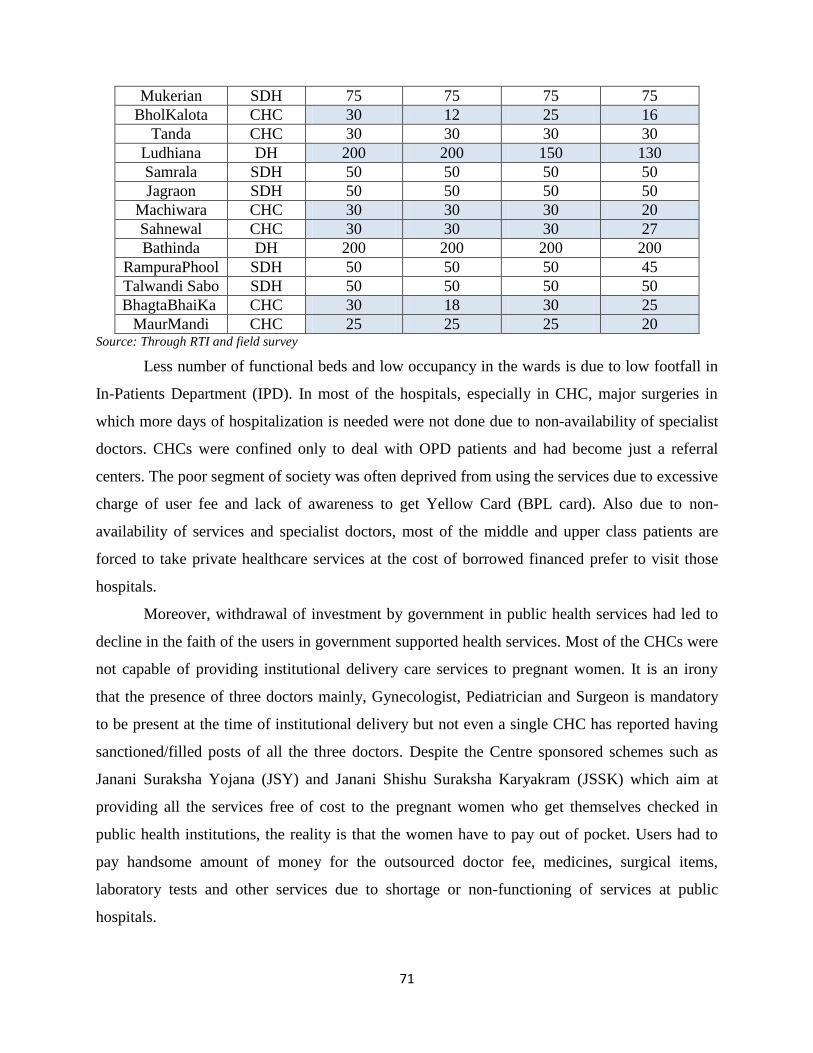
71
Mukerian SDH 75 75 75 75
BholKalota CHC 30 12 25 16
Tanda CHC 30 30 30 30
Ludhiana DH 200 200 150 130
Samrala SDH 50 50 50 50
Jagraon SDH 50 50 50 50
Machiwara CHC 30 30 30 20
Sahnewal CHC 30 30 30 27
Bathinda DH 200 200 200 200
RampuraPhool SDH 50 50 50 45
Talwandi Sabo SDH 50 50 50 50
BhagtaBhaiKa CHC 30 18 30 25
MaurMandi CHC 25 25 25 20 Source: Through RTI and field survey
Less number of functional beds and low occupancy in the wards is due to low footfall in
In-Patients Department (IPD). In most of the hospitals, especially in CHC, major surgeries in
which more days of hospitalization is needed were not done due to non-availability of specialist
doctors. CHCs were confined only to deal with OPD patients and had become just a referral
centers. The poor segment of society was often deprived from using the services due to excessive
charge of user fee and lack of awareness to get Yellow Card (BPL card). Also due to non-
availability of services and specialist doctors, most of the middle and upper class patients are
forced to take private healthcare services at the cost of borrowed financed prefer to visit those
hospitals.
Moreover, withdrawal of investment by government in public health services had led to
decline in the faith of the users in government supported health services. Most of the CHCs were
not capable of providing institutional delivery care services to pregnant women. It is an irony
that the presence of three doctors mainly, Gynecologist, Pediatrician and Surgeon is mandatory
to be present at the time of institutional delivery but not even a single CHC has reported having
sanctioned/filled posts of all the three doctors. Despite the Centre sponsored schemes such as
Janani Suraksha Yojana (JSY) and Janani Shishu Suraksha Karyakram (JSSK) which aim at
providing all the services free of cost to the pregnant women who get themselves checked in
public health institutions, the reality is that the women have to pay out of pocket. Users had to
pay handsome amount of money for the outsourced doctor fee, medicines, surgical items,
laboratory tests and other services due to shortage or non-functioning of services at public
hospitals.
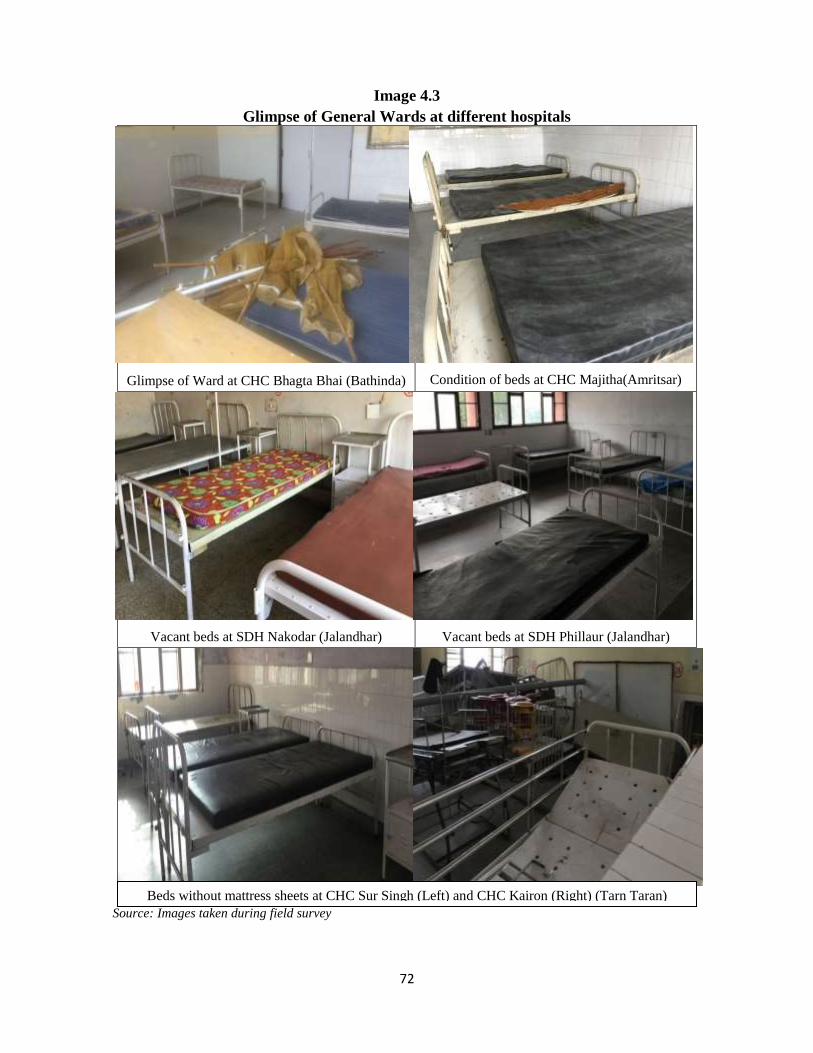
72
Image 4.3
Glimpse of General Wards at different hospitals
Glimpse of Ward at CHC Bhagta Bhai (Bathinda)
Condition of beds at CHC Majitha(Amritsar)
Vacant beds at SDH Nakodar (Jalandhar)
Vacant beds at SDH Phillaur (Jalandhar)
Source: Images taken during field survey
Beds without mattress sheets at CHC Sur Singh (Left) and CHC Kairon (Right) (Tarn Taran)
73
A patient at CHC Tanda in district Hoshiarpur said during the field survey that they had paid Rs.
1800 as outsourced Gynecologist fee otherwise they were asked to shift to Sub-Divisional
Hospital Dasuya due to the non-availability of Gynecologist and other supporting staff.
Ultrasound and protein powder needed during the course of pregnancy were also not available in
the hospital. In Punjab, on an average Out of Pocket Expenditure (OOPE) per delivery in public
hospitals was Rs. 1890 (National Family Health Survey- 4, 2015-16). This high Out of Pocket
Expenditure had put unbearable burden on poor families who are often pushed to poverty due to
this financial burden.
4.8 Sanctioned and Vacant Posts of Doctors under PHSC controlled Hospitals
The hospital is just like the any other building of brick and mortar if it is without doctors and
supporting staff. Total count of OPD and IPD coming at the institution directly depends upon
quantity and quality of their doctors and staff. Despite the government‟s assurance to provide
high class healthcare facilities to the people, state‟s healthcare delivery system is in disarray. In
District Hospitals, more than 21 per cent of the sanctioned posts of specialist doctors and 46 per
cent of the sanctioned posts of Medical Officers (MBBS) were lying vacant at the time of survey.
Situation of Sub-Division Hospitals and Community Health Centers were even worse than that.
In Sub-Division Hospitals half of the sanctioned posts of MBBS doctors were lying vacant. In
CHC‟s, there were only 3 specialist doctors filled out of 10 sanctioned. All these posts were
either changed from Specialist to General Medical Officers (MBBS) or were vacant.
Less number of MBBS doctors in the public hospitals is also because of the governments
rule to pay only basic salary for the first three years. All the new recruits are just getting a
meager monthly amount between Rs. 20,000 – Rs. 25,000. Doctors demanding for “Equal Work,
Equal Pay” either do not join the government services or leave after getting better opportunity in
private institutions.
4.9 Status of District Hospitals under the control of PHSC
Table 4.5 shows the position of sanctioned and vacant posts of specialist and Medical Officers
(MBBS) in six District Hospitals chosen for the study. Detailed list of sanctioned and vacant
posts of doctors in these district hospitals is given in annexure III.
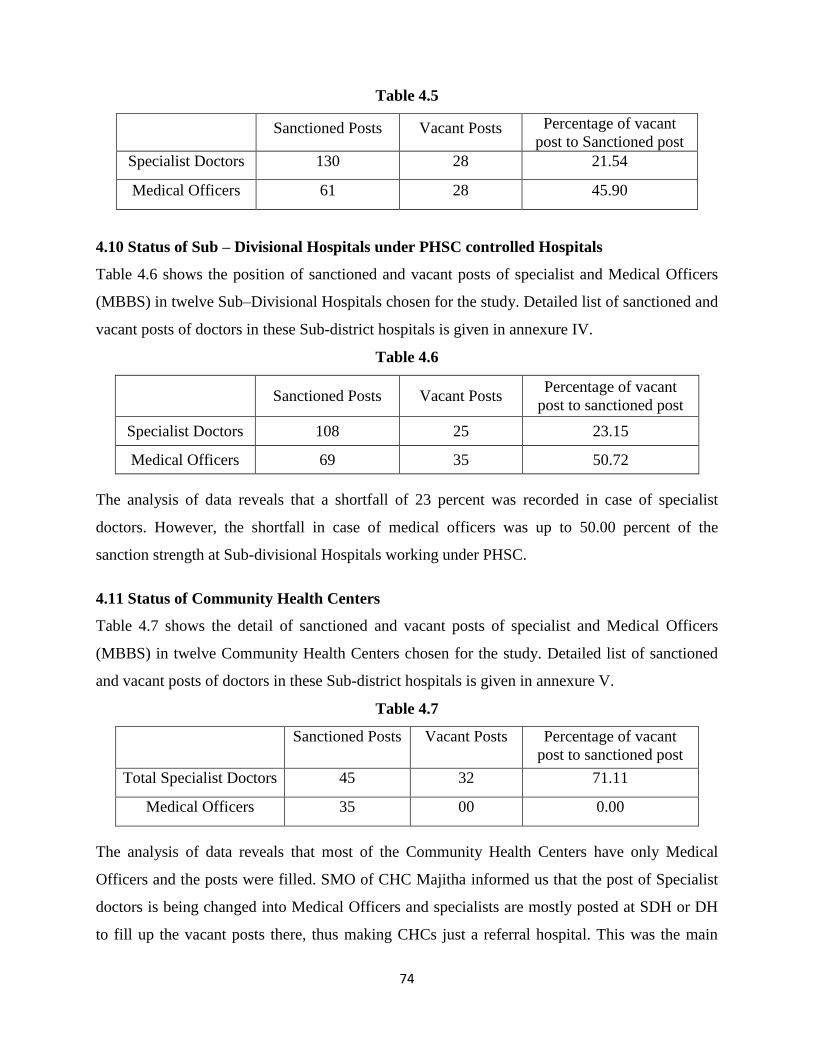
74
Table 4.5
Sanctioned Posts Vacant Posts Percentage of vacant
post to Sanctioned post
Specialist Doctors 130 28 21.54
Medical Officers 61 28 45.90
4.10 Status of Sub – Divisional Hospitals under PHSC controlled Hospitals
Table 4.6 shows the position of sanctioned and vacant posts of specialist and Medical Officers
(MBBS) in twelve Sub–Divisional Hospitals chosen for the study. Detailed list of sanctioned and
vacant posts of doctors in these Sub-district hospitals is given in annexure IV.
Table 4.6
Sanctioned Posts Vacant Posts Percentage of vacant
post to sanctioned post
Specialist Doctors 108 25 23.15
Medical Officers 69 35 50.72
The analysis of data reveals that a shortfall of 23 percent was recorded in case of specialist
doctors. However, the shortfall in case of medical officers was up to 50.00 percent of the
sanction strength at Sub-divisional Hospitals working under PHSC.
4.11 Status of Community Health Centers
Table 4.7 shows the detail of sanctioned and vacant posts of specialist and Medical Officers
(MBBS) in twelve Community Health Centers chosen for the study. Detailed list of sanctioned
and vacant posts of doctors in these Sub-district hospitals is given in annexure V.
Table 4.7
Sanctioned Posts Vacant Posts Percentage of vacant
post to sanctioned post
Total Specialist Doctors 45 32 71.11
Medical Officers 35 00 0.00
The analysis of data reveals that most of the Community Health Centers have only Medical
Officers and the posts were filled. SMO of CHC Majitha informed us that the post of Specialist
doctors is being changed into Medical Officers and specialists are mostly posted at SDH or DH
to fill up the vacant posts there, thus making CHCs just a referral hospital. This was the main
75
reason of over filled posts of MBBS doctors. CHC Maur Mandi and Bhagta Bhai Ka in Bathinda
district had only have 1 Medical Officer sanctioned. CHC Kartarpur in district Jalandhar and
CHC Machiwara in district Ludhiana had 2 sanctioned posts and were filled. In CHC Lopoke, all
the posts of specialist doctors were converted into Medical Officers. CHC Kala Bakra had 9
sanctioned positions of MBBS doctors.
So, the analysis of data reveals that the percentage of functional beds to the sanctioned
beds at all three levels of PHSC hospitals is very less. On the similar line, the percentage of
vacant positions of doctors against the sanctioned positions is also very high. The increase in the
user charges is another important issue in the PHSC hospitals. The analysis further reveals that
overall infrastructure of these hospitals has been found poor. All these factors have contributed
to the poor performance of these hospitals in terms of access to quality and affordable health
services in Punjab. It is only the poor section of the population who are availing these services as
they cannot afford high priced private hospitals.
76
CHAPTER V
Access and Quality of Services Provided by PHSC in Punjab
Present chapter is divided into three sections. The first section (5.1) deals with infrastructure
facilities and provision of other basic services provided by District Hospitals. The existence
of infrastructure and other facilities in sub divisional hospitals are presented in section 5.2.
The state of infrastructure and other basic facilities available in CHCs is presented in section
5.3.
Evaluation of working of the PHSC hospitals
A separate research schedule was designed for the collection of data to study the working of
the hospitals with respect to various indicators. The detailed analysis on the basis of data
collected through personal visits to the sampled hospitals is presented in the following
discussion.
Section 5.1
District Hospitals Scenario at the time of survey
The data was collected from six district hospitals selected as sample, namely, Amritsar, Tarn
Taran, Jalandhar, Hoshiarpur, Ludhiana and Bathinda. So, the sample covers all the
geographical regions of Punjab i.e. Majha, Malwa and Doaba.
Accessibility
The analysis of primary data reveals that all the district hospitals were well connected with
the roads. Distance of DH Amritsar and DH Hoshiarpur was less than 1 km from the bus
stand. Distance of DH Jalandhar was more than 3 kms from bus stand and distance of DH
Tarn Taran, DH Ludhiana and DH Bathinda was more than 5 kms from the bus stand.
Average distance of all the hospitals from railway station was about 3 kms except DH
Bathinda which was about 14 kms from the railway station. So, the analysis reveals that all
the District hospitals, under PHSC were easily accessible to the public.
Water Supply
As per the information collected through field survey, all the hospitals had adequate supply of
water and four hospitals from Majha and Doaba region had bore-well supply and two
hospitals Ludhiana and Bathinda of Malwa region had Municipal Corporation water supply.
77
Electricity Supply
Only two out of six hospitals namely, Jalandhar and Amritsar had regular power supply.
However, Backup generator was available in all the hospitals.
Lifts and Ramps
Lifts were found in four out of six hospitals but was functional in only two hospitals. DH
Amritsar had 4 lifts but only two of them were functional at the time of survey. However,
ramps were available in all the hospitals which are an important requirement for the patients
and attendants.
Ambulance Services
The analysis of data reveals that ambulance services were available in all the hospitals
through centrally sponsored 108 ambulance service. All the hospitals had at least one
ambulance provided by PHSC except DH Hoshiarpur where no ambulance was provided by
PHSC. The ambulance service is the primary service for the patients.
Operation Theatre
All the hospitals had at least one minor OT, except DH Ludhiana and Jalandhar, which both
had 4 minor OT‟s. Regarding the major OT‟s, all the hospitals had 1 major OT except DH
Ludhiana and Jalandhar which had 2 and 4 major OT‟s respectively.
Air Conditioners and Air Coolers
No hospital had provision of AC rooms except Ludhiana which had 2 air conditioners in
Emergency and Bathinda which had AC in burn ward. DH Tarn Taran and Bathinda had only
provision of air coolers in their general ward. The lack of provision of ACs in the hospitals
shows that much has not changed after the formation of PHSC in terms of availability of
quality infrastructure in Punjab for the convenience of the patients.
Emergency, Maternity and Dental Services
All the hospitals provide Emergency, Maternity and Dental Services and had separate
rooms/wards to perform these services.
Laundry Services
Laundry services in five out of six hospitals were found to be outsourced while DH Ludhiana
had In-House laundry service. Quality of washing and linen was found average in four
hospitals and in two hospitals, namely, Ludhiana and Bathinda, it was found to be good.
78
Provision of Security
All the hospitals had contract with the agencies to provide security arrangements in the
hospitals except Ludhiana where there was not even a single security guard available during
the visit. The respondents during the survey also raised the issue of lack of security in the
PHSC.
Sign, Roads and Lighting
Four of the six hospitals had good roads to their premises except DH Amritsar and Ludhiana
which had average roads and lighting. Sign post system was only good in DH Hoshiarpur.
Rest of the hospitals had average signage system.
General Impression on state of building and cleanliness
The status of building was found to be average in all the hospital except DH Amritsar which
had good quality of infrastructure. In DH Ludhiana, the newly constructed building was good
whereas status of old building was found to be average. All the hospitals were found to have
average level of cleanliness except DH Amritsar which is the basic requirement for the
performance of quality services in the hospitals.
Bed Strength
All the hospitals were 100-200 bedded, except DH Jalandhar which was found to be 511
bedded hospital out of which 450 beds were functional at the time of survey. DH Ludhiana
had 150 beds hospital out of which only 130 beds were found to be functional. DH Bathinda
had 200 beds capacity, out of which only 100 beds were in the newly built building of
Children Hospital. So, the analysis shows that there was a deficiency of beds in PHSC which
is the primary requirement for any hospital at district level.
Staff Strength
In all the hospitals most of the posts of General Medical Officers (MBBS) was found to be
vacant except Ludhiana. The analysis of data reveals that 46 per cent of the posts were vacant
with respect to sanctioned posts of MBBS doctors. So, the high percentage of vacant
positions of doctors affects the performance of these hospitals which leads to the lack of faith
among the people in Public Health System. Study further found that more than 21 per cent of
the posts of specialist doctors were also lying vacant in the District Hospitals.
79
MRI, CT scanning, X-Ray and Ultrasound facilities
None of the hospitals were found to have the provision of MRI scanning and only two out of
six hospitals were having CT scanning available. All the hospitals were found to have X-Ray
and Ultrasound scanning facilities. In the present times, the non-availability of such machines
forced the patients to pay for these services from their pockets to avail these services from
private sector.
Medical Ventilators and Dialysis Machine
Only two hospitals were found to have ventilator support system and four out of six hospitals
had the provision of dialysis services. So, the non-existence of ventilator support system put
question mark on the quality and access of services provided under the PHSC in Punjab.
Mortuary with cold storage and facility of Post-Mortem
All the hospitals were found to have mortuaries with cold storage and post mortem facilities.
One day charge for the cold storage in mortuary was Rs. 100. The availability of mortuaries
in PHSC is a good development as large number of families in Punjab is living abroad due to
which the families have to wait for their relatives for cremation.
Section 5.2
Sub – Divisional Hospitals (SDH) Scenario at the time of survey
The study was conducted in twelvesub divisional hospitals selected as sample, namely,
Ajnala, Baba Bakala, Patti, Khadoor Sahib, Nakodar, Phillaur, Dasuya, Mukerian, Jagraon,
Samrala, RampuraPhool and Talwandi Sabo. Selection of the sub-divisional hospitals also
covers all the geographical regions of Punjab. The detailed survey is given in the Annexure –
II.
Accessibility
All the sub divisional hospitals were found well connected with the roads. Average distance
of all the hospitals was about 1 km from the bus stand. Four sub-divisional hospitals were not
having railway connectivity while rests of hospitals were about 2 kms from the railway
stations.
Water Supply
All the hospitals had adequate supply of water and ten out of twelve hospitals had bore well
supply and two hospitals had Municipal Corporation water supply.
80
Electricity Supply
Only three out of twelve hospitals had regular power supply. However, Backup generator was
available in all the hospitals.
Lifts and Ramps
None of the hospitals was found to have lifts. Ramps were available in all the hospitals
except SDH Jagraon which was a single storey hospital. So, the lack of lifts in these hospitals
sometime demands more manpower for the shifting of patients from one floor to another
floor.
Ambulance services
Ambulance services were available in all the hospitals through centrally sponsored 108
ambulance service. It was found that there was not even a single ambulance in SDH Nakodar,
Phillaur, Dasuya, Jagraon and Rampura Phool provided by the PHSC. Rest of the hospitals
had one ambulance per hospital. So, the lack of ambulance facilities forced the poor patients
to pay for costly transport particularly at the time of emergencies.
Operation Theatre
All the hospitals had one minor operation theatre and one major operation theatre except
SDH Patti which had 2 major OT‟s.
Air Conditioners and Air Coolers
Four hospitals out of twelve had the provision of AC rooms/wards, namely, Patti, Nakodar,
Khadoor Sahib and Dasuya. Seven hospitals had only provision of air coolers in their general
ward.
Emergency, Maternity and Dental Services
All the hospitals provide Emergency, Maternity and Dental Services and had separate
rooms/wards for the performance of these services.
Laundry Services
Laundry services in all the hospitals were found to be outsourced. Quality of washing and
linen was found average in eight hospitals and in four hospitals, namely, Baba Bakal, Patti,
Phillaur and Jagraon, it was found to be good.
81
Security Arrangements
Six hospitals had no security arrangement at all. Five hospitals had contract with the agencies
to provide security in the hospitals except Dasuya where they have in-house security
provisions. The provision of security in the hospitals is a basic requirement which is lacking
in sub-divisional hospitals.
Sign, Roads and Lighting
Eight of the twelve hospitals had good roads to their premises except SDH Rampura Phool,
Ajnala, Patti and Nakodar which had average roads and lighting. Sign post system was found
good at four hospitals. Three hospitals had poor sign posting and rest of the hospitals had
average signage system.
General Impression on state of building and cleanliness
It was observed during the visit to these hospitals that the status of building was good in eight
hospitals and four of them were found to be having average level. Five hospitals were found
to have good level of cleanliness while rests of the hospitals were found averagely cleaned.
Bed Strength
All the hospitals were 50 and 75 bedded, except SDH Nakodar with 70 beds, SDH Dasuya
with 100 beds, SDH Patti with 75 beds, however, only 60 beds were found to be functional.
SDH Phillaur had a capacity of 50 beds while 39 beds were functional. It was found during
the visit that SDH Jagraon was admitting patients above their capacity of 50 beds. 74 patients
were admitted at SDH Jagraon against the availability of 50 beds in the hospital at the time of
survey.
Staff Strength
In all the hospitals half of the posts of General Medical Officers (MBBS) were found to be
vacant. Further, 51 per cent of the posts were vacant with respect to sanctioned posts of
MBBS doctors. More than 23 per cent of the posts of specialist doctors were lying vacant in
the Sub – Divisional Hospitals of PHSC.
MRI, CT scanning, X-Ray and Ultrasound services
None of the hospital was found to have the provision of MRI and CT scanning. All the
hospitals were found to have provision of X-Ray and nine hospitals were found to have
Ultrasound scanning services. So, the lack of these modern diagnosing techniques hampers
82
the efficiency of the doctors working in these hospitals which is reported by doctors during
interaction.
Medical Ventilators and Dialysis Machine
None of the hospitals were found to have ventilator support system and only one hospital i.e
SDH Dasuya had the provision of dialysis services at the time of survey. The ventilator
support system is an important requirement which should be made available in these
hospitals.
Mortuary with cold storage and facility of Post-Mortem
Nine out of twelve hospitals were found to have mortuaries with cold storage and post
mortem facilities. One day charge for the cold storage in mortuary was Rs. 100.
Section 5.3
Community Health Centers (CHCs) Scenario at the time of survey
The study was conducted in twelve community health centers selected as sample, namely,
Lopoke, Majitha, Kairon, Sur Singh, Kala Bakra, Kartarpur, Bhol Kalota, Tanda, Machiwara,
Sahnewal, Bhagta Bhai Ka and Maur Mandi. Selection of the community health centers
covers all the geographical regions of Punjab. The detailed survey is given in the Annexure –
III.
Accessibility
All the community health centers were well connected with the roads with average distance
of about half km from the bus stand except Majitha and Maur Mandi which were located in
the densely populated commercial areas. Five community health centers were having no
railway connectivity while average distance of rest of the hospitals was about 1 km from
railway station.
Water Supply
All the hospitals had adequate supply of water except CHC Kartarpur and ten out of twelve
hospitals had bore well supply and two hospitals had Municipal Corporation/ Municipal
Committee water supply.
Electricity Supply
Only three out of twelve hospitals had regular power supply. However, Backup generator was
available in all the hospitals.
83
Lifts and Ramps
None of the hospitals was found to have lifts. Ramps were available in all the hospitals
except CHC Machiwara and Sahnewal which were single storey hospital.
Ambulance Services
Ambulance services were available in all the hospitals through centrally sponsored 108
ambulance service. It was found that five sampled hospitals were not having even a single
ambulance provided by the PHSC while rest of the hospitals had one ambulance each.
Operation Theatre
All the hospitals had one minor operation theatre and one major operation theatre except
CHC Bhol Kalota which had 2 major OT‟s.
Air Conditioners and Air Coolers
Only one hospital (CHC Kartarpur) out of twelve had the provision of one AC room in their
hospital. Six hospitals had provision of air coolers in their general wards. It is important to
mention that Punjab face high temperature and humid weather in summer and severe cold in
winter. So, the non-availability of proper system for the control of temperature for the
patients is a serious lapse.
Emergency, Maternity and Dental Services
All the hospitals provide Emergency, Maternity and Dental Services and had separate
rooms/wards for these services. Most of the hospitals had discontinued performing caesarean
deliveries due to shortage of specialist doctors. In case of any emergency, the hospitals
outsource the specialists and their fee is charged from the patients.
Laundry Services
Laundry services in all the hospitals were found to be outsourced except in CHC Bhagta Bhai
Ka and Maur Mandi. Quality of washing the linen was found of average level in ten hospitals
while the quality of washing was found good in two hospitals, namely, Bhol Kalota and
Tanda.
Security Arrangements
All the twelve hospitals had no security arrangements at all. The provision of security in the
hospitals is a basic requirement which is lacking in all the community health centres. The
incidences of attacks on hospital staff by outraged patients or their attendants were reported
by hospitals staff during the interaction.
84
Sign, Roads and Lighting
Five of the twelve hospitals had good roads leading to their premises and five had average
roads while the two hospitals had poor road connectivity. Sign post system was good at three
hospitals while four hospitals had poor sign posting and rest of the hospitals had average sign
boards displayed.
General Impression on state of building and cleanliness
It was found during the visit that the building was good in only three hospitals, one hospital
had poor quality of infrastructure and rests of the hospitals were found to have average level
of building/ infrastructure. Moreover, only two hospitals were found to have proper
cleanliness, three hospitals had poor cleanliness and rests of the hospitals were found with
average level of cleanliness.
Bed Strength
All the hospitals were having the capacity of 30 beds each except CHC Bhol Kalota which
was found to have sanctioned capacity of 25 beds. Nine out of twelve hospitals were found to
have less functional beds as compared to sanctioned.
Staff Strength
More than 70 per cent of the posts of specialist doctors were lying vacant in the community
health centers. Non-availability of doctors in the CHCs forced the patients to visit the private
hospitals for chronic diseases.
MRI, CT scanning, X-Ray and Ultrasound services
None of the hospitals were found to have the provision of MRI and CT scanning. All the
hospitals were found to have provision of X-Ray while only CHC Bhol Kalota was found to
have Ultrasound scanning services.
Medical Ventilators and Dialysis Machine
None of the hospitals were found to have ventilator support system and dialysis services.
Mortuary with cold storage and facility of Post-Mortem
None of the hospitals was found to have mortuaries with cold storage and post mortem
facilities.

85
The major issues emerge from the above discussion carried out in the three sections dealing
with District Hospitals, Sub-Divisional Hospitals and Community Health Centers reveals that
the shortage of doctors particularly of specialist doctors is the major problem faced at all
levels. Furthermore, the percentage of functional beds against the sanctioned beds is another
major problem. The non-availability of advanced diagnostic equipment like MRI and CT
scanning is another major issue for the doctors to perform their services efficiently. Even
ultrasound facility is not available in most of the hospitals. The proper cleanliness and lack of
security arrangements are another major problems faced by these hospitals.
86
CHAPTER VI
USERS’ PERCEPTION TOWARDS DELIVERY OF HEALTH
SERVICES IN PUNJAB
According to World Health Organisation, health should be a fundamental right of every
human being and it is the duty of every government to provide minimal level of health
services to the masses. Unfortunately, healthcare costs are increasing all over the world. In
India, where major share of population lives below poverty line, rising cost of healthcare has
made medical assistance almost out of reach, even for the middle class (S. M. Bose, 2012). In
Punjab, most of the government hospitals are overcrowded; on the other hand, private health
services are very costly. Moreover, the proportion of government hospitals to population,
which are providing tertiary healthcare is very low and is also expensive. As a result of which
out-of pocket expenditure of patients has increased many folds over the period of time.
User’s Perception
To know the perception of patients towards the extent and quality of health services, 300
patients were interviewed from various health institutions, namely, District Hospitals, Sub-
Divisional Hospitals and Community Health Centers working under the Punjab Health
Systems Corporation.
Socio-Economic Profile of Respondents
Socio-economic background of the respondents has been analysed on the basis of selected
variables as discussed below.
6.1 Gender-wise Distribution of Respondents
The gender-wise composition of respondents is presented in table 6.1. The analysis of data
reveals that the share of female patients is higher than males at all the three levels of public
health services.
Out of 300 respondents, the average services were utilized more by females,
approximately 56 percent as compared to 44 percent by males in all the hospitals as shown in
table 6.1. The higher share of female patients may be due to the reason that females are more
prone to sickness as compared to male patients.
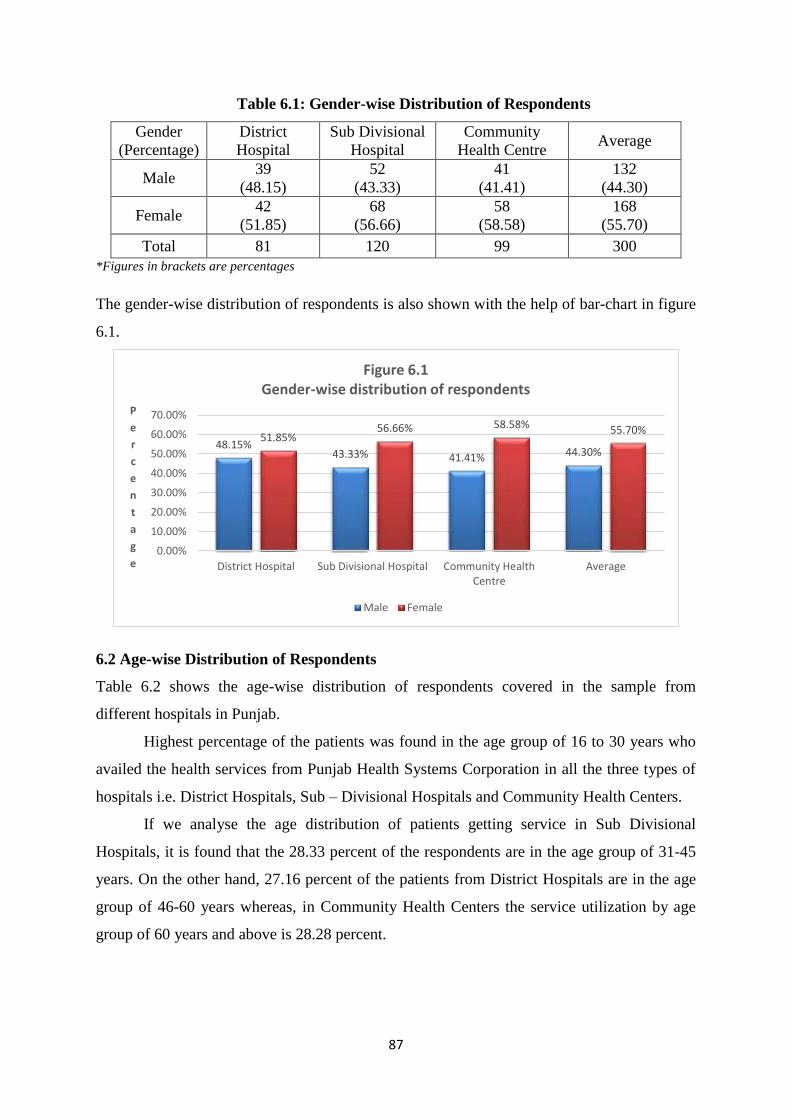
87
Table 6.1: Gender-wise Distribution of Respondents
Gender
(Percentage)
District
Hospital
Sub Divisional
Hospital
Community
Health Centre Average
Male 39
(48.15)
52
(43.33)
41
(41.41)
132
(44.30)
Female 42
(51.85)
68
(56.66)
58
(58.58)
168
(55.70)
Total 81 120 99 300
*Figures in brackets are percentages
The gender-wise distribution of respondents is also shown with the help of bar-chart in figure
6.1.
6.2 Age-wise Distribution of Respondents
Table 6.2 shows the age-wise distribution of respondents covered in the sample from
different hospitals in Punjab.
Highest percentage of the patients was found in the age group of 16 to 30 years who
availed the health services from Punjab Health Systems Corporation in all the three types of
hospitals i.e. District Hospitals, Sub – Divisional Hospitals and Community Health Centers.
If we analyse the age distribution of patients getting service in Sub Divisional
Hospitals, it is found that the 28.33 percent of the respondents are in the age group of 31-45
years. On the other hand, 27.16 percent of the patients from District Hospitals are in the age
group of 46-60 years whereas, in Community Health Centers the service utilization by age
group of 60 years and above is 28.28 percent.
48.15% 43.33% 41.41% 44.30%
51.85% 56.66% 58.58% 55.70%
0.00%
10.00%
20.00%
30.00%
40.00%
50.00%
60.00%
70.00%
District Hospital Sub Divisional Hospital Community HealthCentre
Average
P
e
r
c
e
n
t
a
g
e
Figure 6.1 Gender-wise distribution of respondents
Male Female
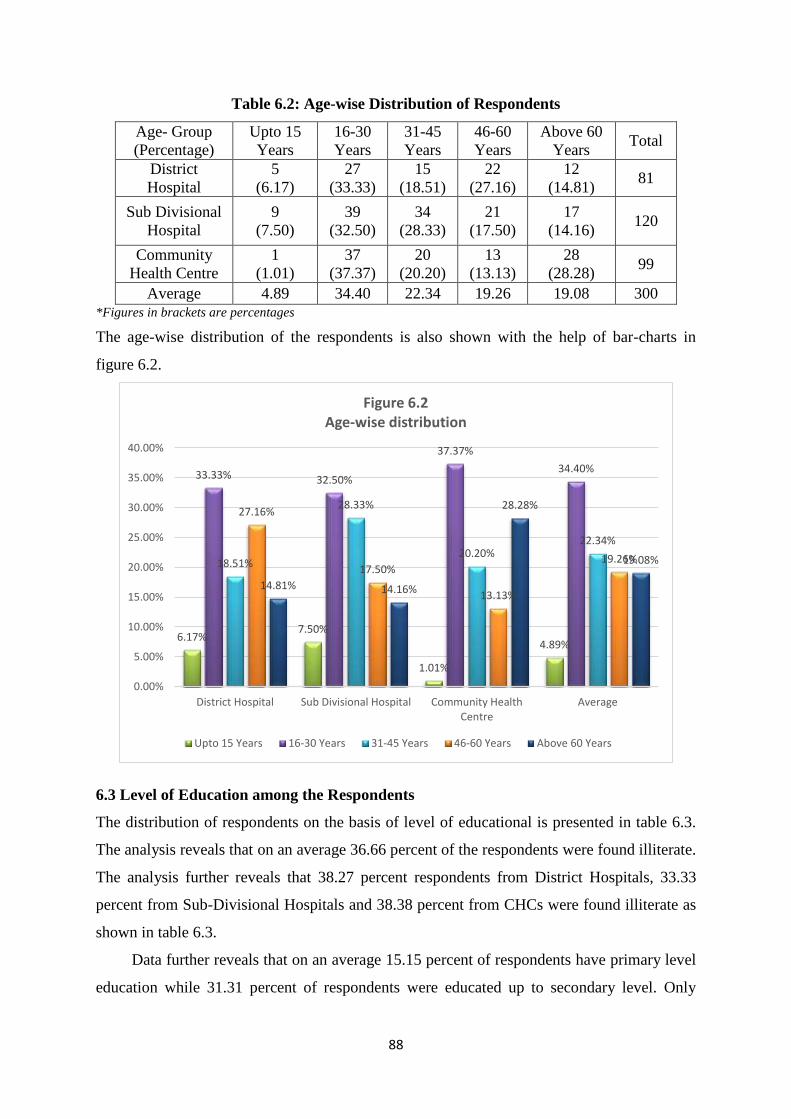
88
Table 6.2: Age-wise Distribution of Respondents
Age- Group
(Percentage)
Upto 15
Years
16-30
Years
31-45
Years
46-60
Years
Above 60
Years Total
District
Hospital
5
(6.17)
27
(33.33)
15
(18.51)
22
(27.16)
12
(14.81) 81
Sub Divisional
Hospital
9
(7.50)
39
(32.50)
34
(28.33)
21
(17.50)
17
(14.16) 120
Community
Health Centre
1
(1.01)
37
(37.37)
20
(20.20)
13
(13.13)
28
(28.28) 99
Average 4.89 34.40 22.34 19.26 19.08 300 *Figures in brackets are percentages
The age-wise distribution of the respondents is also shown with the help of bar-charts in
figure 6.2.
6.3 Level of Education among the Respondents
The distribution of respondents on the basis of level of educational is presented in table 6.3.
The analysis reveals that on an average 36.66 percent of the respondents were found illiterate.
The analysis further reveals that 38.27 percent respondents from District Hospitals, 33.33
percent from Sub-Divisional Hospitals and 38.38 percent from CHCs were found illiterate as
shown in table 6.3.
Data further reveals that on an average 15.15 percent of respondents have primary level
education while 31.31 percent of respondents were educated up to secondary level. Only
6.17% 7.50%
1.01%
4.89%
33.33% 32.50%
37.37%
34.40%
18.51%
28.33%
20.20% 22.34%
27.16%
17.50%
13.13%
19.26%
14.81% 14.16%
28.28%
19.08%
0.00%
5.00%
10.00%
15.00%
20.00%
25.00%
30.00%
35.00%
40.00%
District Hospital Sub Divisional Hospital Community HealthCentre
Average
Figure 6.2 Age-wise distribution
Upto 15 Years 16-30 Years 31-45 Years 46-60 Years Above 60 Years
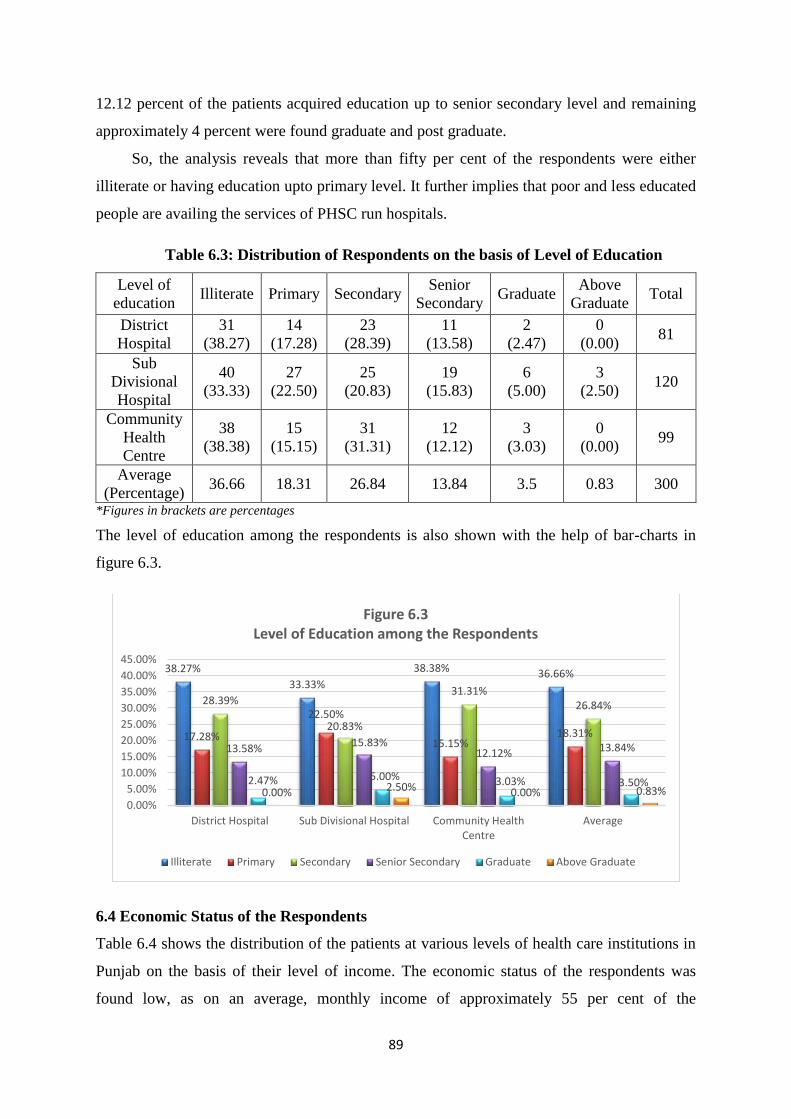
89
12.12 percent of the patients acquired education up to senior secondary level and remaining
approximately 4 percent were found graduate and post graduate.
So, the analysis reveals that more than fifty per cent of the respondents were either
illiterate or having education upto primary level. It further implies that poor and less educated
people are availing the services of PHSC run hospitals.
Table 6.3: Distribution of Respondents on the basis of Level of Education
Level of
education Illiterate Primary Secondary
Senior
Secondary Graduate
Above
Graduate Total
District
Hospital
31
(38.27)
14
(17.28)
23
(28.39)
11
(13.58)
2
(2.47)
0
(0.00) 81
Sub
Divisional
Hospital
40
(33.33)
27
(22.50)
25
(20.83)
19
(15.83)
6
(5.00)
3
(2.50) 120
Community
Health
Centre
38
(38.38)
15
(15.15)
31
(31.31)
12
(12.12)
3
(3.03)
0
(0.00) 99
Average
(Percentage) 36.66 18.31 26.84 13.84 3.5 0.83 300
*Figures in brackets are percentages
The level of education among the respondents is also shown with the help of bar-charts in
figure 6.3.
6.4 Economic Status of the Respondents
Table 6.4 shows the distribution of the patients at various levels of health care institutions in
Punjab on the basis of their level of income. The economic status of the respondents was
found low, as on an average, monthly income of approximately 55 per cent of the
38.27%
33.33%
38.38% 36.66%
17.28%
22.50%
15.15% 18.31%
28.39%
20.83%
31.31% 26.84%
13.58% 15.83% 12.12% 13.84%
2.47% 5.00% 3.03% 3.50% 0.00% 2.50% 0.00% 0.83%
0.00%
5.00%
10.00%
15.00%
20.00%
25.00%
30.00%
35.00%
40.00%
45.00%
District Hospital Sub Divisional Hospital Community HealthCentre
Average
Figure 6.3 Level of Education among the Respondents
Illiterate Primary Secondary Senior Secondary Graduate Above Graduate
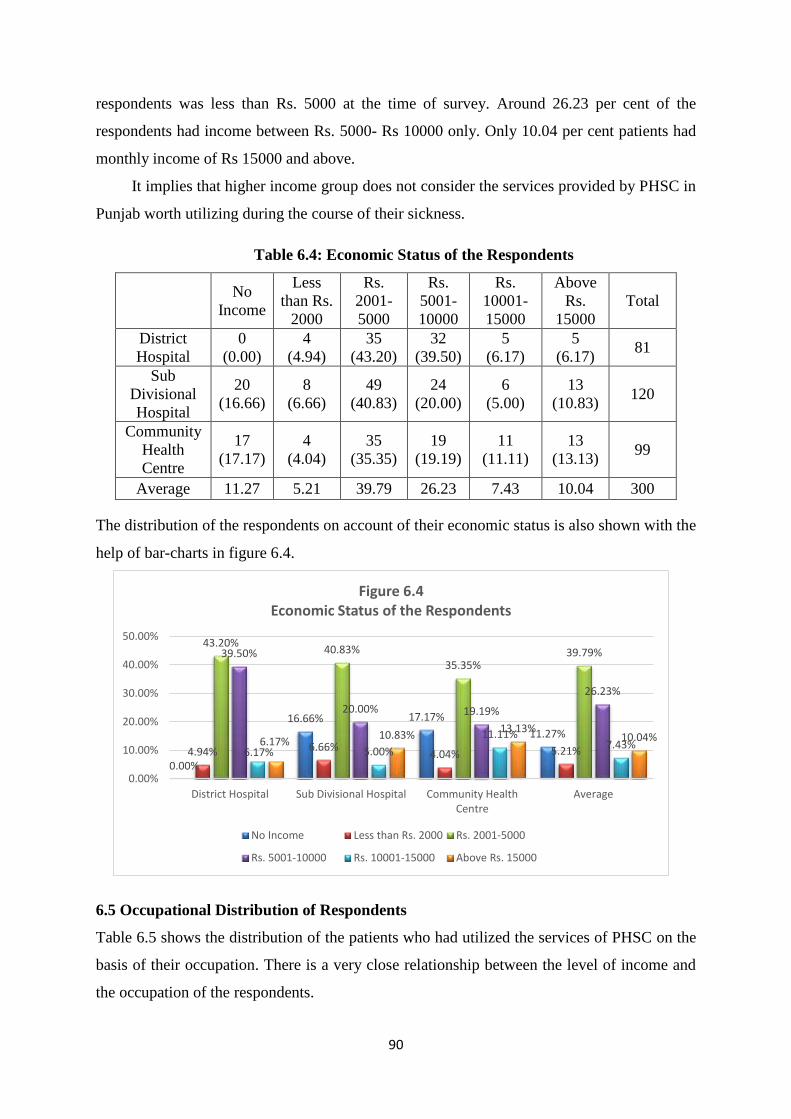
90
respondents was less than Rs. 5000 at the time of survey. Around 26.23 per cent of the
respondents had income between Rs. 5000- Rs 10000 only. Only 10.04 per cent patients had
monthly income of Rs 15000 and above.
It implies that higher income group does not consider the services provided by PHSC in
Punjab worth utilizing during the course of their sickness.
Table 6.4: Economic Status of the Respondents
No
Income
Less
than Rs.
2000
Rs.
2001-
5000
Rs.
5001-
10000
Rs.
10001-
15000
Above
Rs.
15000
Total
District
Hospital
0
(0.00)
4
(4.94)
35
(43.20)
32
(39.50)
5
(6.17)
5
(6.17) 81
Sub
Divisional
Hospital
20
(16.66)
8
(6.66)
49
(40.83)
24
(20.00)
6
(5.00)
13
(10.83) 120
Community
Health
Centre
17
(17.17)
4
(4.04)
35
(35.35)
19
(19.19)
11
(11.11)
13
(13.13) 99
Average 11.27 5.21 39.79 26.23 7.43 10.04 300
The distribution of the respondents on account of their economic status is also shown with the
help of bar-charts in figure 6.4.
6.5 Occupational Distribution of Respondents
Table 6.5 shows the distribution of the patients who had utilized the services of PHSC on the
basis of their occupation. There is a very close relationship between the level of income and
the occupation of the respondents.
0.00%
16.66% 17.17%
11.27%
4.94% 6.66% 4.04% 5.21%
43.20% 40.83%
35.35% 39.79% 39.50%
20.00% 19.19%
26.23%
6.17% 5.00%
11.11% 7.43% 6.17%
10.83% 13.13%
10.04%
0.00%
10.00%
20.00%
30.00%
40.00%
50.00%
District Hospital Sub Divisional Hospital Community HealthCentre
Average
Figure 6.4 Economic Status of the Respondents
No Income Less than Rs. 2000 Rs. 2001-5000
Rs. 5001-10000 Rs. 10001-15000 Above Rs. 15000
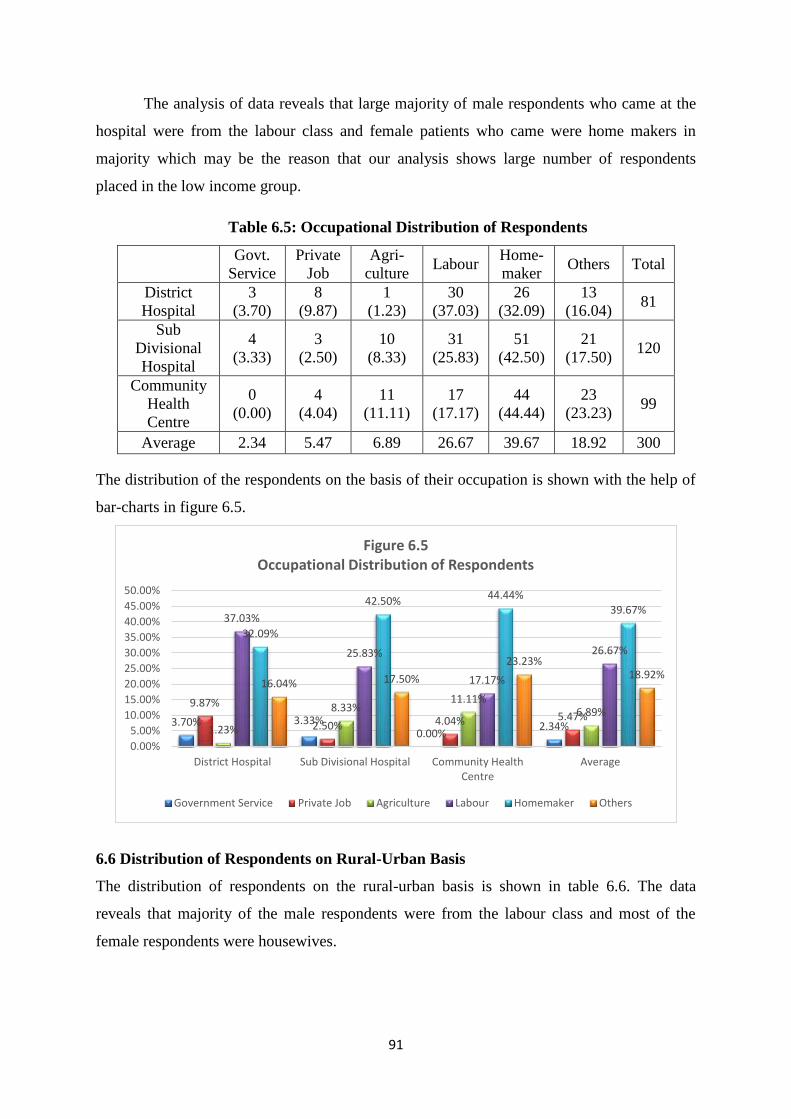
91
The analysis of data reveals that large majority of male respondents who came at the
hospital were from the labour class and female patients who came were home makers in
majority which may be the reason that our analysis shows large number of respondents
placed in the low income group.
Table 6.5: Occupational Distribution of Respondents
Govt.
Service
Private
Job
Agri-
culture Labour
Home-
maker Others Total
District
Hospital
3
(3.70)
8
(9.87)
1
(1.23)
30
(37.03)
26
(32.09)
13
(16.04) 81
Sub
Divisional
Hospital
4
(3.33)
3
(2.50)
10
(8.33)
31
(25.83)
51
(42.50)
21
(17.50) 120
Community
Health
Centre
0
(0.00)
4
(4.04)
11
(11.11)
17
(17.17)
44
(44.44)
23
(23.23) 99
Average 2.34 5.47 6.89 26.67 39.67 18.92 300
The distribution of the respondents on the basis of their occupation is shown with the help of
bar-charts in figure 6.5.
6.6 Distribution of Respondents on Rural-Urban Basis
The distribution of respondents on the rural-urban basis is shown in table 6.6. The data
reveals that majority of the male respondents were from the labour class and most of the
female respondents were housewives.
3.70% 3.33% 0.00%
2.34%
9.87%
2.50% 4.04% 5.47% 1.23%
8.33% 11.11%
6.89%
37.03%
25.83%
17.17%
26.67%
32.09%
42.50% 44.44%
39.67%
16.04% 17.50%
23.23% 18.92%
0.00%
5.00%
10.00%
15.00%
20.00%
25.00%
30.00%
35.00%
40.00%
45.00%
50.00%
District Hospital Sub Divisional Hospital Community HealthCentre
Average
Figure 6.5 Occupational Distribution of Respondents
Government Service Private Job Agriculture Labour Homemaker Others
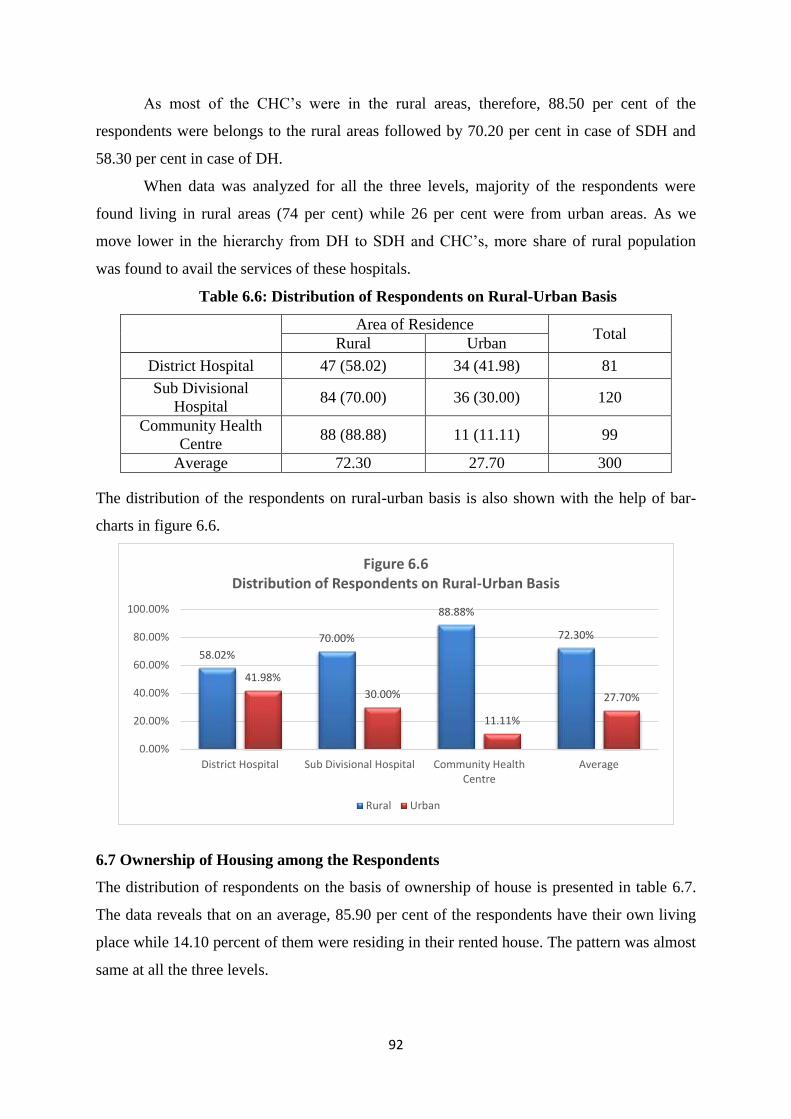
92
As most of the CHC‟s were in the rural areas, therefore, 88.50 per cent of the
respondents were belongs to the rural areas followed by 70.20 per cent in case of SDH and
58.30 per cent in case of DH.
When data was analyzed for all the three levels, majority of the respondents were
found living in rural areas (74 per cent) while 26 per cent were from urban areas. As we
move lower in the hierarchy from DH to SDH and CHC‟s, more share of rural population
was found to avail the services of these hospitals.
Table 6.6: Distribution of Respondents on Rural-Urban Basis
Area of Residence Total
Rural Urban
District Hospital 47 (58.02) 34 (41.98) 81
Sub Divisional
Hospital 84 (70.00) 36 (30.00) 120
Community Health
Centre 88 (88.88) 11 (11.11) 99
Average 72.30 27.70 300
The distribution of the respondents on rural-urban basis is also shown with the help of bar-
charts in figure 6.6.
6.7 Ownership of Housing among the Respondents
The distribution of respondents on the basis of ownership of house is presented in table 6.7.
The data reveals that on an average, 85.90 per cent of the respondents have their own living
place while 14.10 percent of them were residing in their rented house. The pattern was almost
same at all the three levels.
58.02%
70.00%
88.88%
72.30%
41.98%
30.00%
11.11%
27.70%
0.00%
20.00%
40.00%
60.00%
80.00%
100.00%
District Hospital Sub Divisional Hospital Community HealthCentre
Average
Figure 6.6 Distribution of Respondents on Rural-Urban Basis
Rural Urban
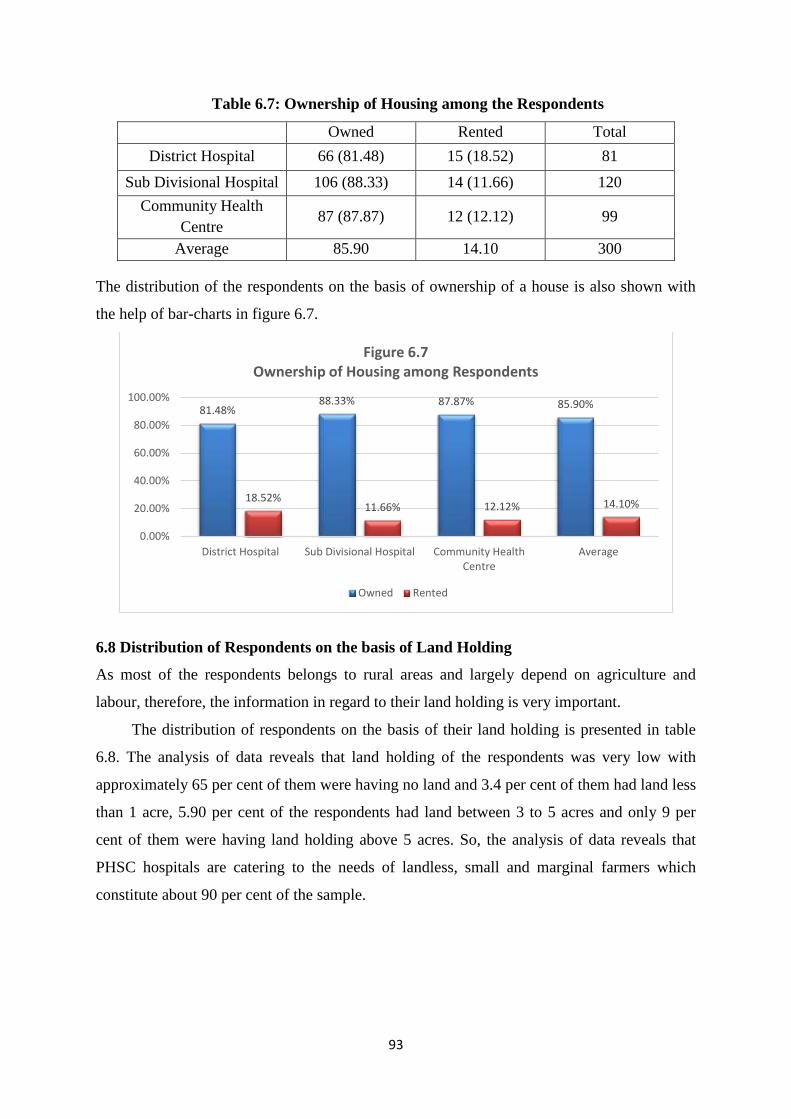
93
Table 6.7: Ownership of Housing among the Respondents
Owned Rented Total
District Hospital 66 (81.48) 15 (18.52) 81
Sub Divisional Hospital 106 (88.33) 14 (11.66) 120
Community Health
Centre 87 (87.87) 12 (12.12) 99
Average 85.90 14.10 300
The distribution of the respondents on the basis of ownership of a house is also shown with
the help of bar-charts in figure 6.7.
6.8 Distribution of Respondents on the basis of Land Holding
As most of the respondents belongs to rural areas and largely depend on agriculture and
labour, therefore, the information in regard to their land holding is very important.
The distribution of respondents on the basis of their land holding is presented in table
6.8. The analysis of data reveals that land holding of the respondents was very low with
approximately 65 per cent of them were having no land and 3.4 per cent of them had land less
than 1 acre, 5.90 per cent of the respondents had land between 3 to 5 acres and only 9 per
cent of them were having land holding above 5 acres. So, the analysis of data reveals that
PHSC hospitals are catering to the needs of landless, small and marginal farmers which
constitute about 90 per cent of the sample.
81.48% 88.33% 87.87% 85.90%
18.52% 11.66% 12.12% 14.10%
0.00%
20.00%
40.00%
60.00%
80.00%
100.00%
District Hospital Sub Divisional Hospital Community HealthCentre
Average
Figure 6.7 Ownership of Housing among Respondents
Owned Rented
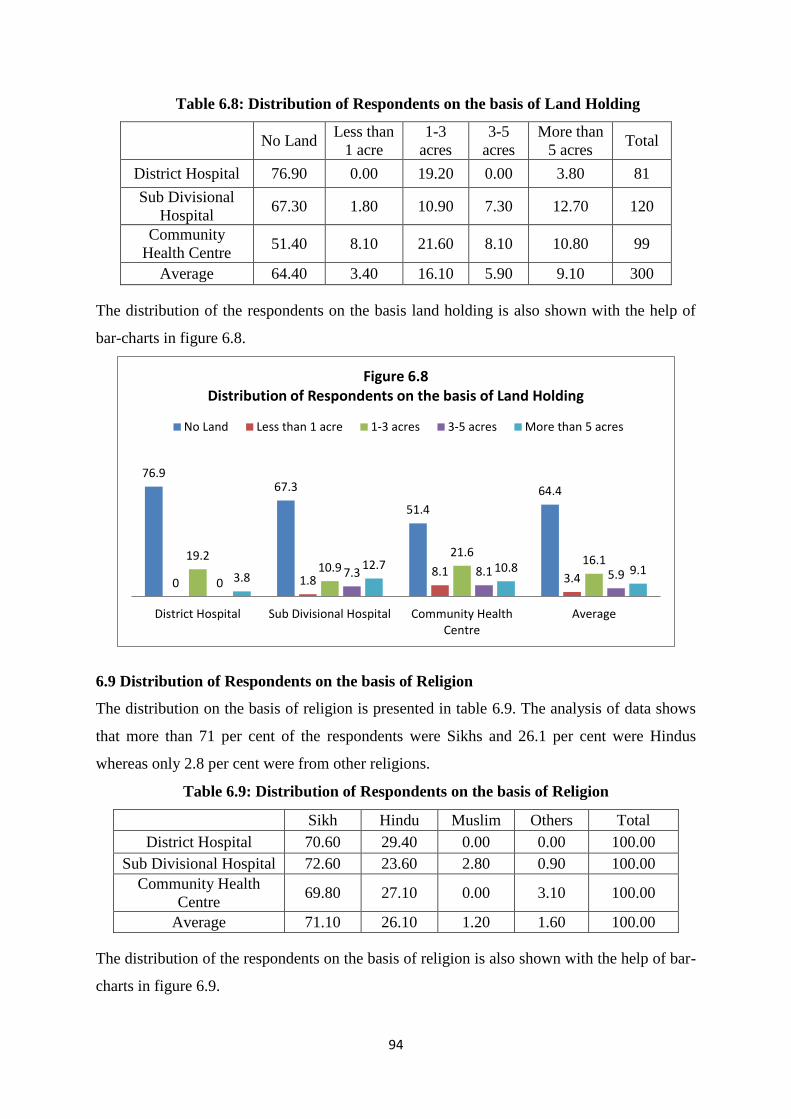
94
Table 6.8: Distribution of Respondents on the basis of Land Holding
No Land
Less than
1 acre
1-3
acres
3-5
acres
More than
5 acres Total
District Hospital 76.90 0.00 19.20 0.00 3.80 81
Sub Divisional
Hospital 67.30 1.80 10.90 7.30 12.70 120
Community
Health Centre 51.40 8.10 21.60 8.10 10.80 99
Average 64.40 3.40 16.10 5.90 9.10 300
The distribution of the respondents on the basis land holding is also shown with the help of
bar-charts in figure 6.8.
6.9 Distribution of Respondents on the basis of Religion
The distribution on the basis of religion is presented in table 6.9. The analysis of data shows
that more than 71 per cent of the respondents were Sikhs and 26.1 per cent were Hindus
whereas only 2.8 per cent were from other religions.
Table 6.9: Distribution of Respondents on the basis of Religion
Sikh Hindu Muslim Others Total
District Hospital 70.60 29.40 0.00 0.00 100.00
Sub Divisional Hospital 72.60 23.60 2.80 0.90 100.00
Community Health
Centre 69.80 27.10 0.00 3.10 100.00
Average 71.10 26.10 1.20 1.60 100.00
The distribution of the respondents on the basis of religion is also shown with the help of bar-
charts in figure 6.9.
76.9 67.3
51.4
64.4
0 1.8 8.1
3.4
19.2 10.9
21.6 16.1
0 7.3 8.1 5.9 3.8
12.7 10.8 9.1
District Hospital Sub Divisional Hospital Community HealthCentre
Average
Figure 6.8 Distribution of Respondents on the basis of Land Holding
No Land Less than 1 acre 1-3 acres 3-5 acres More than 5 acres
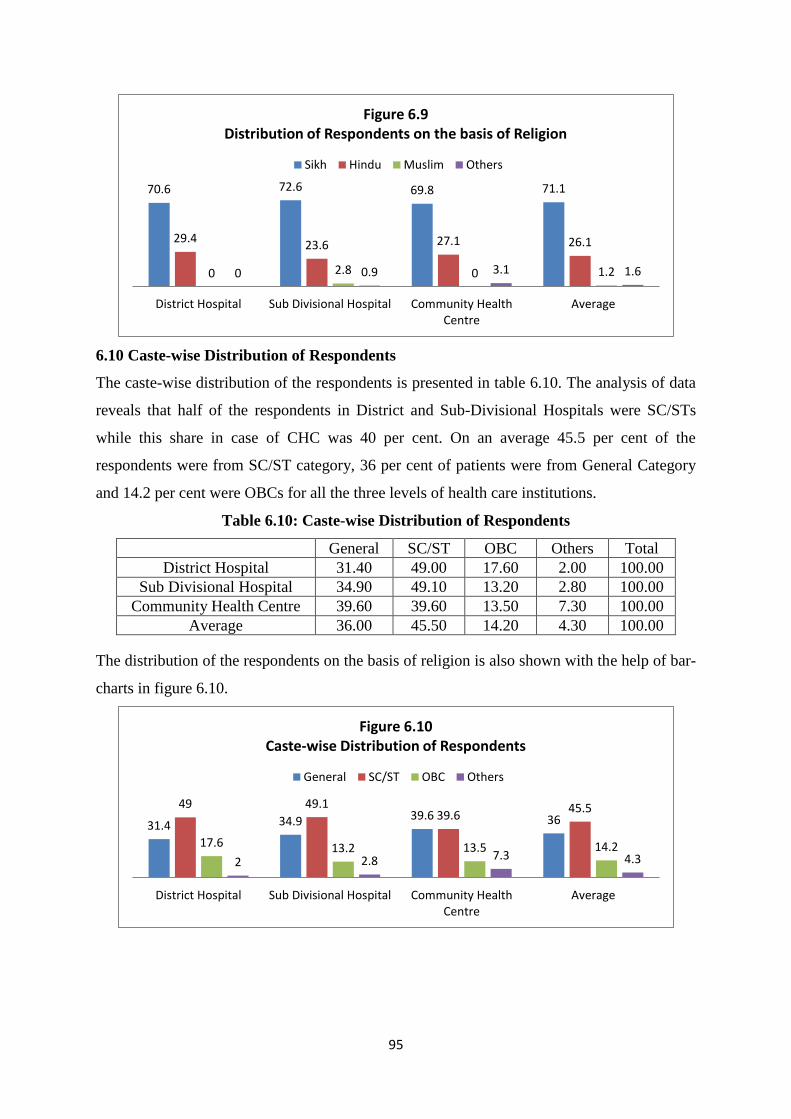
95
6.10 Caste-wise Distribution of Respondents
The caste-wise distribution of the respondents is presented in table 6.10. The analysis of data
reveals that half of the respondents in District and Sub-Divisional Hospitals were SC/STs
while this share in case of CHC was 40 per cent. On an average 45.5 per cent of the
respondents were from SC/ST category, 36 per cent of patients were from General Category
and 14.2 per cent were OBCs for all the three levels of health care institutions.
Table 6.10: Caste-wise Distribution of Respondents
General SC/ST OBC Others Total
District Hospital 31.40 49.00 17.60 2.00 100.00
Sub Divisional Hospital 34.90 49.10 13.20 2.80 100.00
Community Health Centre 39.60 39.60 13.50 7.30 100.00
Average 36.00 45.50 14.20 4.30 100.00
The distribution of the respondents on the basis of religion is also shown with the help of bar-
charts in figure 6.10.
70.6 72.6 69.8 71.1
29.4 23.6 27.1 26.1
0 2.8 0 1.2 0 0.9 3.1 1.6
District Hospital Sub Divisional Hospital Community HealthCentre
Average
Figure 6.9 Distribution of Respondents on the basis of Religion
Sikh Hindu Muslim Others
31.4 34.9 39.6 36 49 49.1
39.6 45.5
17.6 13.2 13.5 14.2 2 2.8 7.3 4.3
District Hospital Sub Divisional Hospital Community HealthCentre
Average
Figure 6.10 Caste-wise Distribution of Respondents
General SC/ST OBC Others
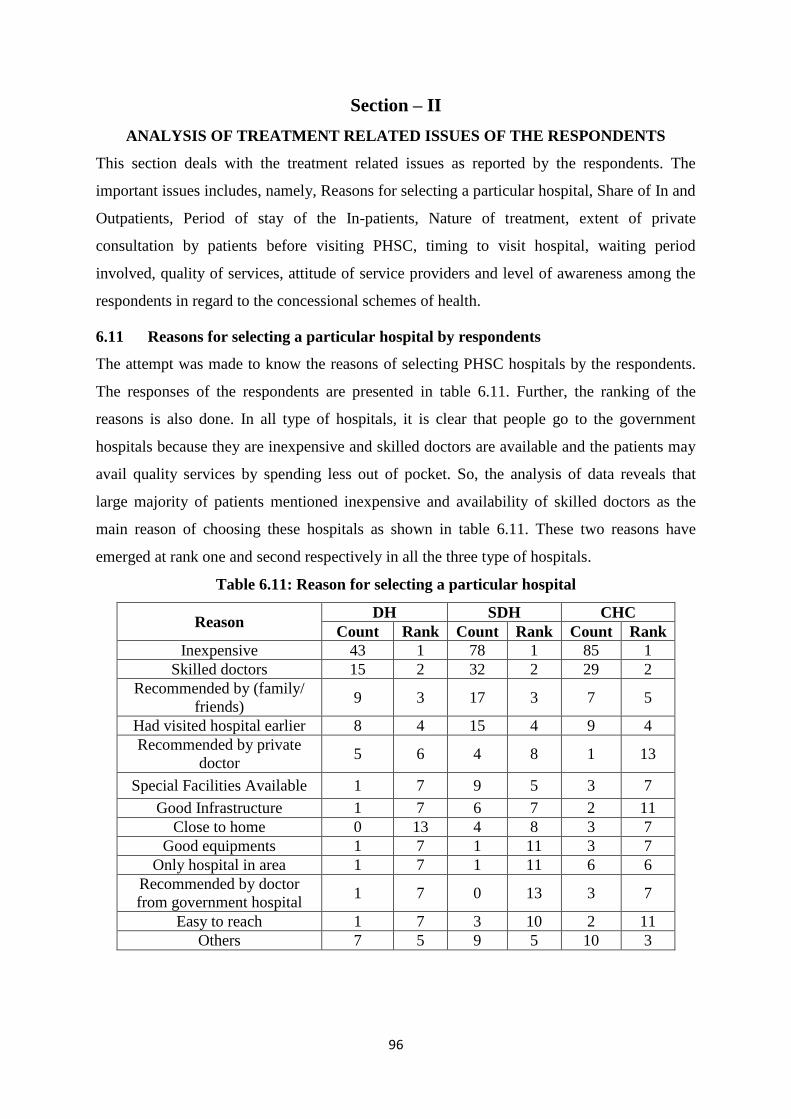
96
Section – II
ANALYSIS OF TREATMENT RELATED ISSUES OF THE RESPONDENTS
This section deals with the treatment related issues as reported by the respondents. The
important issues includes, namely, Reasons for selecting a particular hospital, Share of In and
Outpatients, Period of stay of the In-patients, Nature of treatment, extent of private
consultation by patients before visiting PHSC, timing to visit hospital, waiting period
involved, quality of services, attitude of service providers and level of awareness among the
respondents in regard to the concessional schemes of health.
6.11 Reasons for selecting a particular hospital by respondents
The attempt was made to know the reasons of selecting PHSC hospitals by the respondents.
The responses of the respondents are presented in table 6.11. Further, the ranking of the
reasons is also done. In all type of hospitals, it is clear that people go to the government
hospitals because they are inexpensive and skilled doctors are available and the patients may
avail quality services by spending less out of pocket. So, the analysis of data reveals that
large majority of patients mentioned inexpensive and availability of skilled doctors as the
main reason of choosing these hospitals as shown in table 6.11. These two reasons have
emerged at rank one and second respectively in all the three type of hospitals.
Table 6.11: Reason for selecting a particular hospital
Reason DH SDH CHC
Count Rank Count Rank Count Rank
Inexpensive 43 1 78 1 85 1
Skilled doctors 15 2 32 2 29 2
Recommended by (family/
friends) 9 3 17 3 7 5
Had visited hospital earlier 8 4 15 4 9 4
Recommended by private
doctor 5 6 4 8 1 13
Special Facilities Available 1 7 9 5 3 7
Good Infrastructure 1 7 6 7 2 11
Close to home 0 13 4 8 3 7
Good equipments 1 7 1 11 3 7
Only hospital in area 1 7 1 11 6 6
Recommended by doctor
from government hospital 1 7 0 13 3 7
Easy to reach 1 7 3 10 2 11
Others 7 5 9 5 10 3
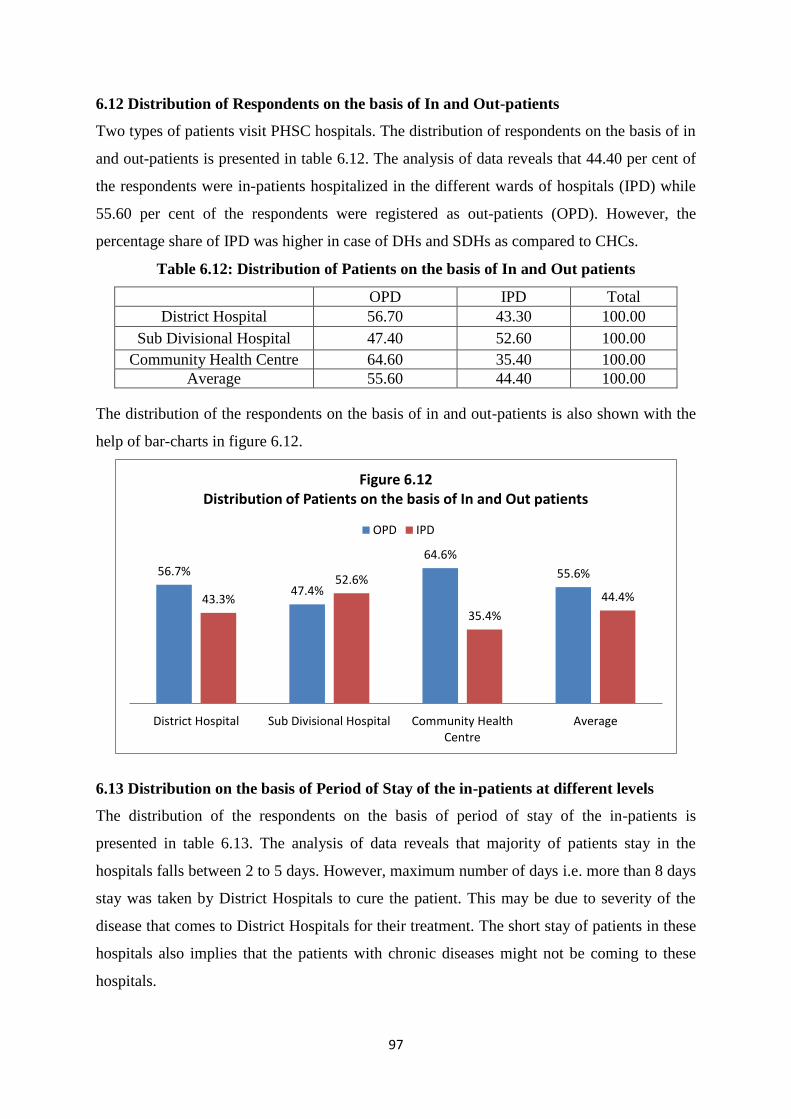
97
6.12 Distribution of Respondents on the basis of In and Out-patients
Two types of patients visit PHSC hospitals. The distribution of respondents on the basis of in
and out-patients is presented in table 6.12. The analysis of data reveals that 44.40 per cent of
the respondents were in-patients hospitalized in the different wards of hospitals (IPD) while
55.60 per cent of the respondents were registered as out-patients (OPD). However, the
percentage share of IPD was higher in case of DHs and SDHs as compared to CHCs.
Table 6.12: Distribution of Patients on the basis of In and Out patients
OPD IPD Total
District Hospital 56.70 43.30 100.00
Sub Divisional Hospital 47.40 52.60 100.00
Community Health Centre 64.60 35.40 100.00
Average 55.60 44.40 100.00
The distribution of the respondents on the basis of in and out-patients is also shown with the
help of bar-charts in figure 6.12.
6.13 Distribution on the basis of Period of Stay of the in-patients at different levels
The distribution of the respondents on the basis of period of stay of the in-patients is
presented in table 6.13. The analysis of data reveals that majority of patients stay in the
hospitals falls between 2 to 5 days. However, maximum number of days i.e. more than 8 days
stay was taken by District Hospitals to cure the patient. This may be due to severity of the
disease that comes to District Hospitals for their treatment. The short stay of patients in these
hospitals also implies that the patients with chronic diseases might not be coming to these
hospitals.
56.7%
47.4%
64.6%
55.6%
43.3%
52.6%
35.4%
44.4%
District Hospital Sub Divisional Hospital Community HealthCentre
Average
Figure 6.12 Distribution of Patients on the basis of In and Out patients
OPD IPD
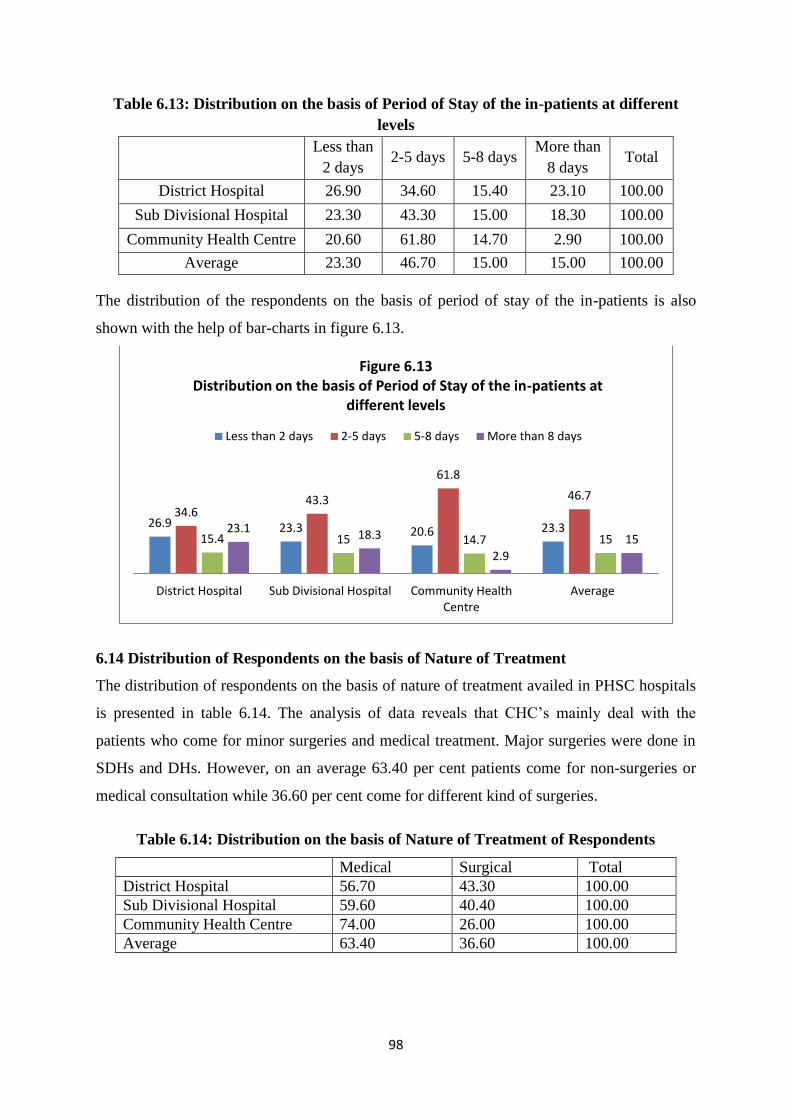
98
Table 6.13: Distribution on the basis of Period of Stay of the in-patients at different
levels
Less than
2 days 2-5 days 5-8 days
More than
8 days Total
District Hospital 26.90 34.60 15.40 23.10 100.00
Sub Divisional Hospital 23.30 43.30 15.00 18.30 100.00
Community Health Centre 20.60 61.80 14.70 2.90 100.00
Average 23.30 46.70 15.00 15.00 100.00
The distribution of the respondents on the basis of period of stay of the in-patients is also
shown with the help of bar-charts in figure 6.13.
6.14 Distribution of Respondents on the basis of Nature of Treatment
The distribution of respondents on the basis of nature of treatment availed in PHSC hospitals
is presented in table 6.14. The analysis of data reveals that CHC‟s mainly deal with the
patients who come for minor surgeries and medical treatment. Major surgeries were done in
SDHs and DHs. However, on an average 63.40 per cent patients come for non-surgeries or
medical consultation while 36.60 per cent come for different kind of surgeries.
Table 6.14: Distribution on the basis of Nature of Treatment of Respondents
Medical Surgical Total
District Hospital 56.70 43.30 100.00
Sub Divisional Hospital 59.60 40.40 100.00
Community Health Centre 74.00 26.00 100.00
Average 63.40 36.60 100.00
26.9 23.3 20.6 23.3 34.6
43.3
61.8
46.7
15.4 15 14.7 15 23.1 18.3
2.9
15
District Hospital Sub Divisional Hospital Community HealthCentre
Average
Figure 6.13 Distribution on the basis of Period of Stay of the in-patients at
different levels
Less than 2 days 2-5 days 5-8 days More than 8 days
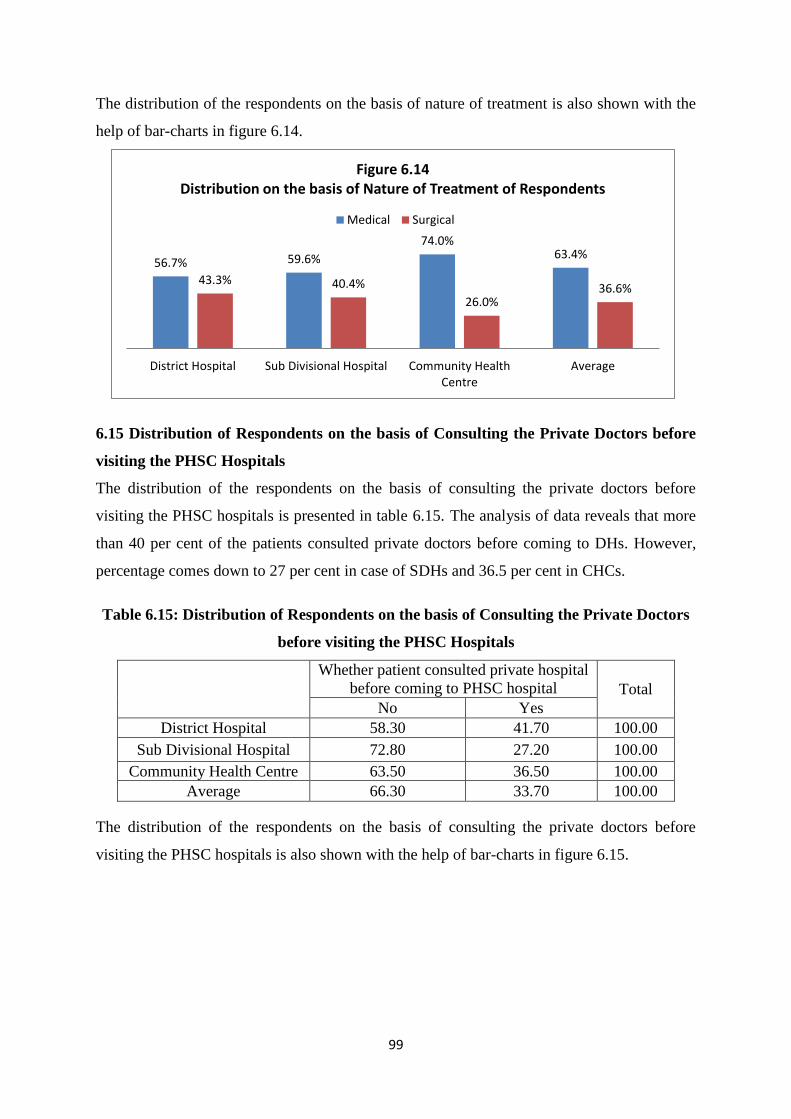
99
The distribution of the respondents on the basis of nature of treatment is also shown with the
help of bar-charts in figure 6.14.
6.15 Distribution of Respondents on the basis of Consulting the Private Doctors before
visiting the PHSC Hospitals
The distribution of the respondents on the basis of consulting the private doctors before
visiting the PHSC hospitals is presented in table 6.15. The analysis of data reveals that more
than 40 per cent of the patients consulted private doctors before coming to DHs. However,
percentage comes down to 27 per cent in case of SDHs and 36.5 per cent in CHCs.
Table 6.15: Distribution of Respondents on the basis of Consulting the Private Doctors
before visiting the PHSC Hospitals
Whether patient consulted private hospital
before coming to PHSC hospital Total
No Yes
District Hospital 58.30 41.70 100.00
Sub Divisional Hospital 72.80 27.20 100.00
Community Health Centre 63.50 36.50 100.00
Average 66.30 33.70 100.00
The distribution of the respondents on the basis of consulting the private doctors before
visiting the PHSC hospitals is also shown with the help of bar-charts in figure 6.15.
56.7% 59.6%
74.0% 63.4%
43.3% 40.4%
26.0% 36.6%
District Hospital Sub Divisional Hospital Community HealthCentre
Average
Figure 6.14 Distribution on the basis of Nature of Treatment of Respondents
Medical Surgical
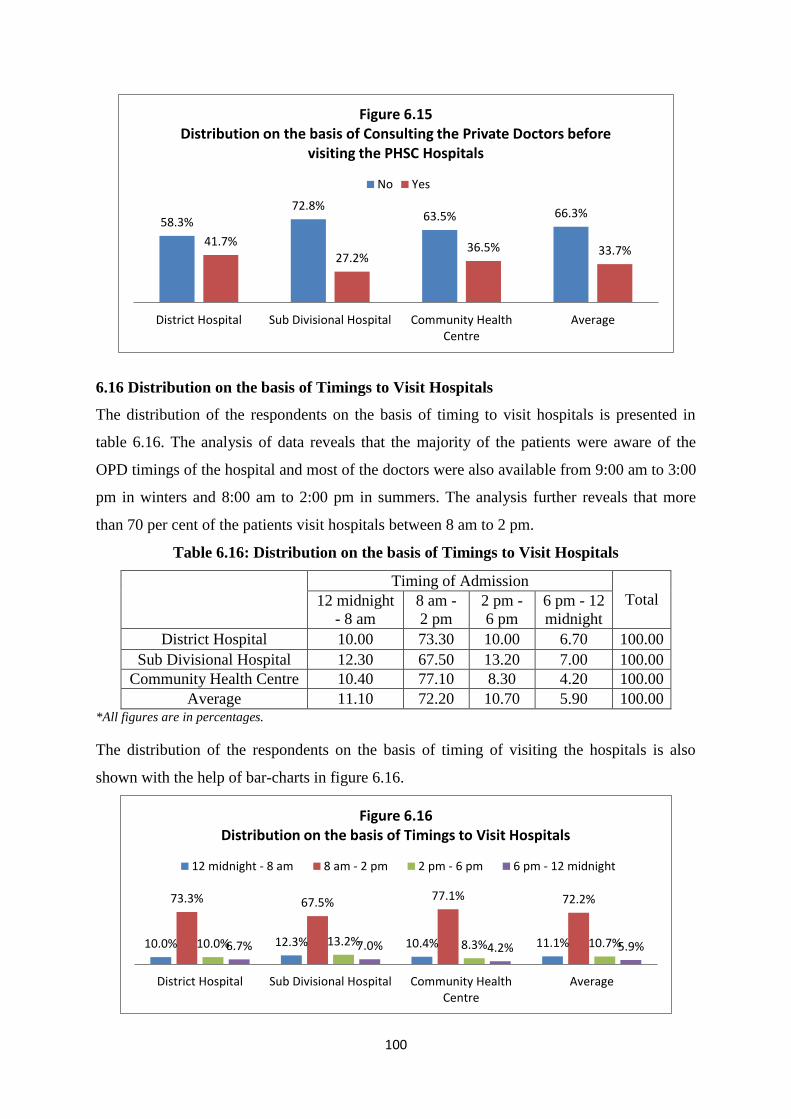
100
6.16 Distribution on the basis of Timings to Visit Hospitals
The distribution of the respondents on the basis of timing to visit hospitals is presented in
table 6.16. The analysis of data reveals that the majority of the patients were aware of the
OPD timings of the hospital and most of the doctors were also available from 9:00 am to 3:00
pm in winters and 8:00 am to 2:00 pm in summers. The analysis further reveals that more
than 70 per cent of the patients visit hospitals between 8 am to 2 pm.
Table 6.16: Distribution on the basis of Timings to Visit Hospitals
Timing of Admission
Total 12 midnight
- 8 am
8 am -
2 pm
2 pm -
6 pm
6 pm - 12
midnight
District Hospital 10.00 73.30 10.00 6.70 100.00
Sub Divisional Hospital 12.30 67.50 13.20 7.00 100.00
Community Health Centre 10.40 77.10 8.30 4.20 100.00
Average 11.10 72.20 10.70 5.90 100.00 *All figures are in percentages.
The distribution of the respondents on the basis of timing of visiting the hospitals is also
shown with the help of bar-charts in figure 6.16.
58.3%
72.8% 63.5% 66.3%
41.7%
27.2% 36.5% 33.7%
District Hospital Sub Divisional Hospital Community HealthCentre
Average
Figure 6.15 Distribution on the basis of Consulting the Private Doctors before
visiting the PHSC Hospitals
No Yes
10.0% 12.3% 10.4% 11.1%
73.3% 67.5% 77.1% 72.2%
10.0% 13.2% 8.3% 10.7% 6.7% 7.0% 4.2% 5.9%
District Hospital Sub Divisional Hospital Community HealthCentre
Average
Figure 6.16 Distribution on the basis of Timings to Visit Hospitals
12 midnight - 8 am 8 am - 2 pm 2 pm - 6 pm 6 pm - 12 midnight
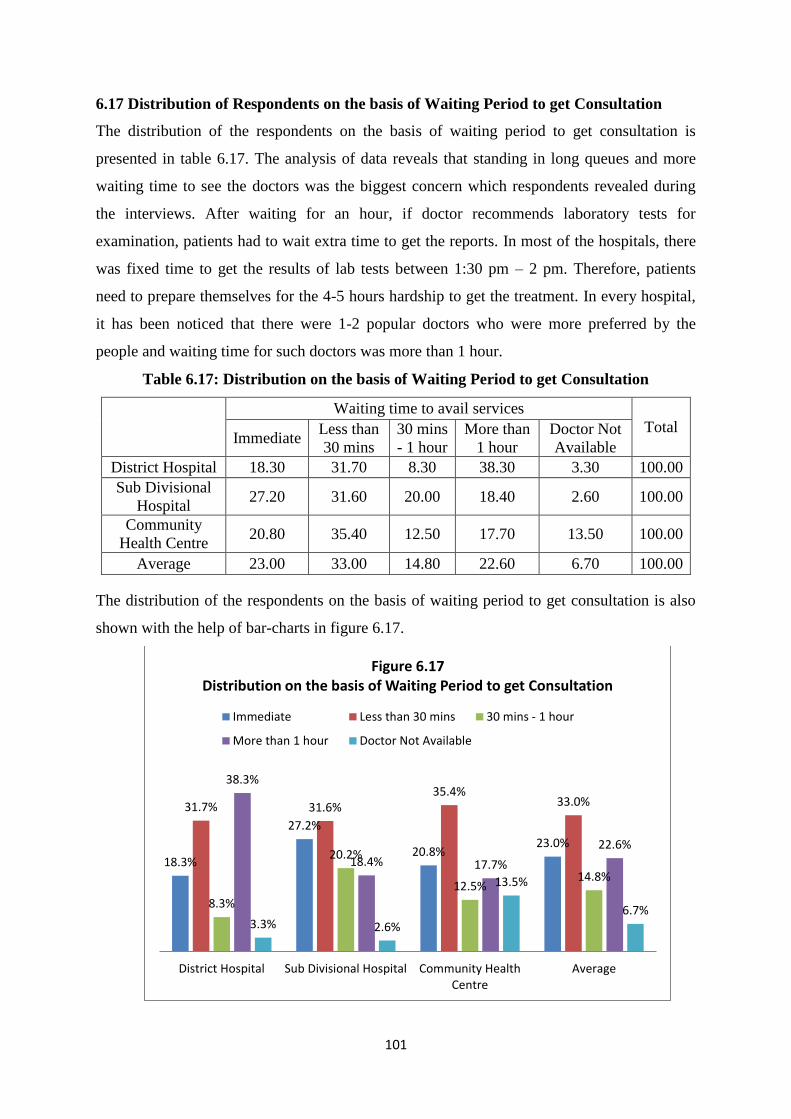
101
6.17 Distribution of Respondents on the basis of Waiting Period to get Consultation
The distribution of the respondents on the basis of waiting period to get consultation is
presented in table 6.17. The analysis of data reveals that standing in long queues and more
waiting time to see the doctors was the biggest concern which respondents revealed during
the interviews. After waiting for an hour, if doctor recommends laboratory tests for
examination, patients had to wait extra time to get the reports. In most of the hospitals, there
was fixed time to get the results of lab tests between 1:30 pm – 2 pm. Therefore, patients
need to prepare themselves for the 4-5 hours hardship to get the treatment. In every hospital,
it has been noticed that there were 1-2 popular doctors who were more preferred by the
people and waiting time for such doctors was more than 1 hour.
Table 6.17: Distribution on the basis of Waiting Period to get Consultation
Waiting time to avail services
Total Immediate
Less than
30 mins
30 mins
- 1 hour
More than
1 hour
Doctor Not
Available
District Hospital 18.30 31.70 8.30 38.30 3.30 100.00
Sub Divisional
Hospital 27.20 31.60 20.00 18.40 2.60 100.00
Community
Health Centre 20.80 35.40 12.50 17.70 13.50 100.00
Average 23.00 33.00 14.80 22.60 6.70 100.00
The distribution of the respondents on the basis of waiting period to get consultation is also
shown with the help of bar-charts in figure 6.17.
18.3%
27.2%
20.8% 23.0%
31.7% 31.6% 35.4%
33.0%
8.3%
20.2%
12.5% 14.8%
38.3%
18.4% 17.7%
22.6%
3.3% 2.6%
13.5%
6.7%
District Hospital Sub Divisional Hospital Community HealthCentre
Average
Figure 6.17 Distribution on the basis of Waiting Period to get Consultation
Immediate Less than 30 mins 30 mins - 1 hour
More than 1 hour Doctor Not Available
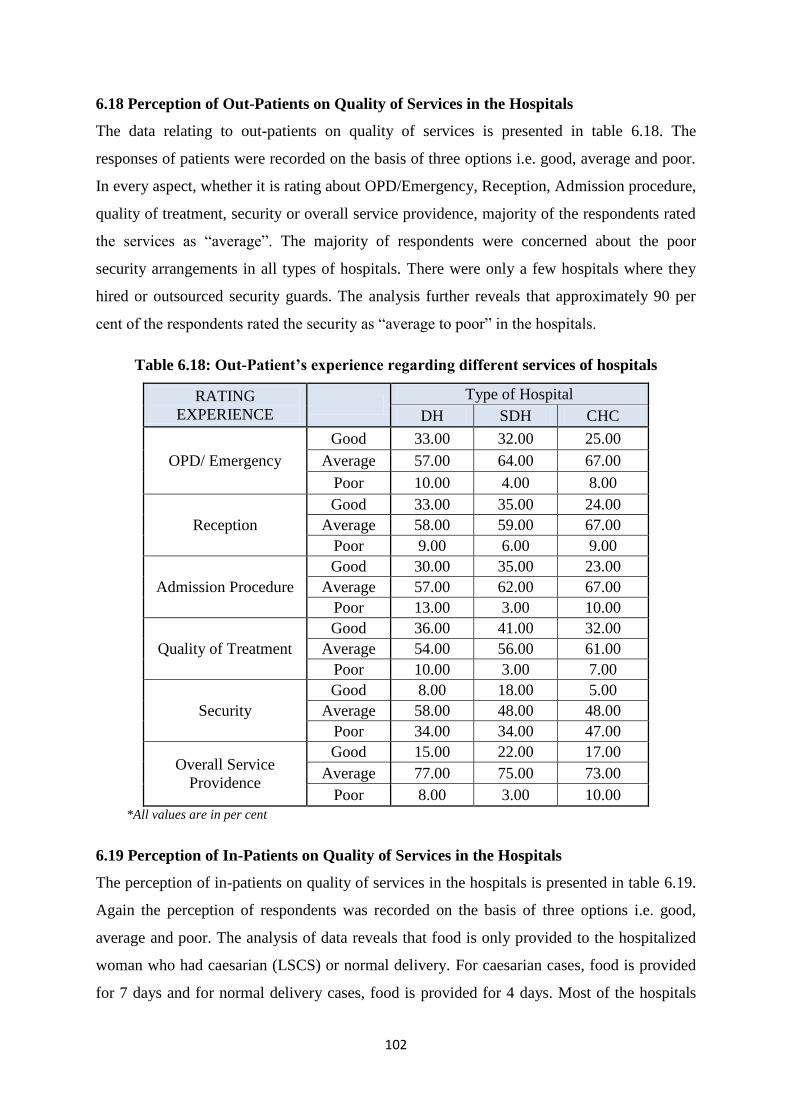
102
6.18 Perception of Out-Patients on Quality of Services in the Hospitals
The data relating to out-patients on quality of services is presented in table 6.18. The
responses of patients were recorded on the basis of three options i.e. good, average and poor.
In every aspect, whether it is rating about OPD/Emergency, Reception, Admission procedure,
quality of treatment, security or overall service providence, majority of the respondents rated
the services as “average”. The majority of respondents were concerned about the poor
security arrangements in all types of hospitals. There were only a few hospitals where they
hired or outsourced security guards. The analysis further reveals that approximately 90 per
cent of the respondents rated the security as “average to poor” in the hospitals.
Table 6.18: Out-Patient’s experience regarding different services of hospitals
RATING
EXPERIENCE
Type of Hospital
DH SDH CHC
OPD/ Emergency
Good 33.00 32.00 25.00
Average 57.00 64.00 67.00
Poor 10.00 4.00 8.00
Reception
Good 33.00 35.00 24.00
Average 58.00 59.00 67.00
Poor 9.00 6.00 9.00
Admission Procedure
Good 30.00 35.00 23.00
Average 57.00 62.00 67.00
Poor 13.00 3.00 10.00
Quality of Treatment
Good 36.00 41.00 32.00
Average 54.00 56.00 61.00
Poor 10.00 3.00 7.00
Security
Good 8.00 18.00 5.00
Average 58.00 48.00 48.00
Poor 34.00 34.00 47.00
Overall Service
Providence
Good 15.00 22.00 17.00
Average 77.00 75.00 73.00
Poor 8.00 3.00 10.00
*All values are in per cent
6.19 Perception of In-Patients on Quality of Services in the Hospitals
The perception of in-patients on quality of services in the hospitals is presented in table 6.19.
Again the perception of respondents was recorded on the basis of three options i.e. good,
average and poor. The analysis of data reveals that food is only provided to the hospitalized
woman who had caesarian (LSCS) or normal delivery. For caesarian cases, food is provided
for 7 days and for normal delivery cases, food is provided for 4 days. Most of the hospitals
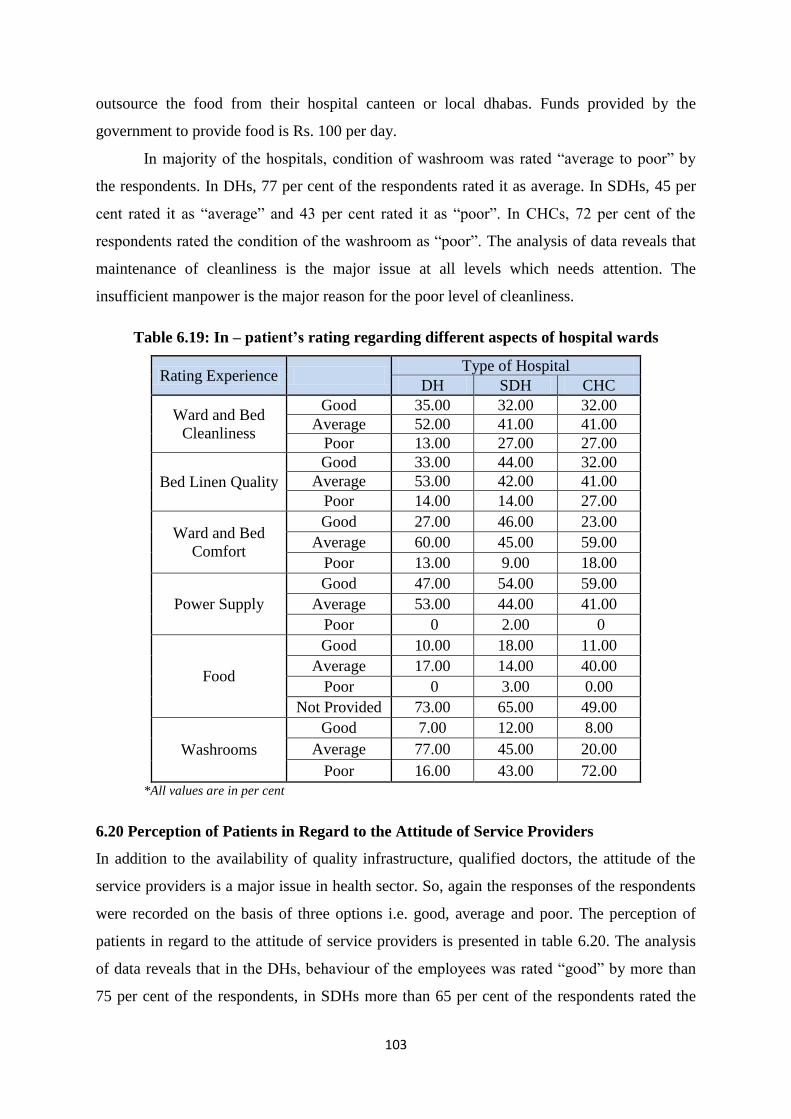
103
outsource the food from their hospital canteen or local dhabas. Funds provided by the
government to provide food is Rs. 100 per day.
In majority of the hospitals, condition of washroom was rated “average to poor” by
the respondents. In DHs, 77 per cent of the respondents rated it as average. In SDHs, 45 per
cent rated it as “average” and 43 per cent rated it as “poor”. In CHCs, 72 per cent of the
respondents rated the condition of the washroom as “poor”. The analysis of data reveals that
maintenance of cleanliness is the major issue at all levels which needs attention. The
insufficient manpower is the major reason for the poor level of cleanliness.
Table 6.19: In – patient’s rating regarding different aspects of hospital wards
Rating Experience Type of Hospital
DH SDH CHC
Ward and Bed
Cleanliness
Good 35.00 32.00 32.00
Average 52.00 41.00 41.00
Poor 13.00 27.00 27.00
Bed Linen Quality
Good 33.00 44.00 32.00
Average 53.00 42.00 41.00
Poor 14.00 14.00 27.00
Ward and Bed
Comfort
Good 27.00 46.00 23.00
Average 60.00 45.00 59.00
Poor 13.00 9.00 18.00
Power Supply
Good 47.00 54.00 59.00
Average 53.00 44.00 41.00
Poor 0 2.00 0
Food
Good 10.00 18.00 11.00
Average 17.00 14.00 40.00
Poor 0 3.00 0.00
Not Provided 73.00 65.00 49.00
Washrooms
Good 7.00 12.00 8.00
Average 77.00 45.00 20.00
Poor 16.00 43.00 72.00
*All values are in per cent
6.20 Perception of Patients in Regard to the Attitude of Service Providers
In addition to the availability of quality infrastructure, qualified doctors, the attitude of the
service providers is a major issue in health sector. So, again the responses of the respondents
were recorded on the basis of three options i.e. good, average and poor. The perception of
patients in regard to the attitude of service providers is presented in table 6.20. The analysis
of data reveals that in the DHs, behaviour of the employees was rated “good” by more than
75 per cent of the respondents, in SDHs more than 65 per cent of the respondents rated the
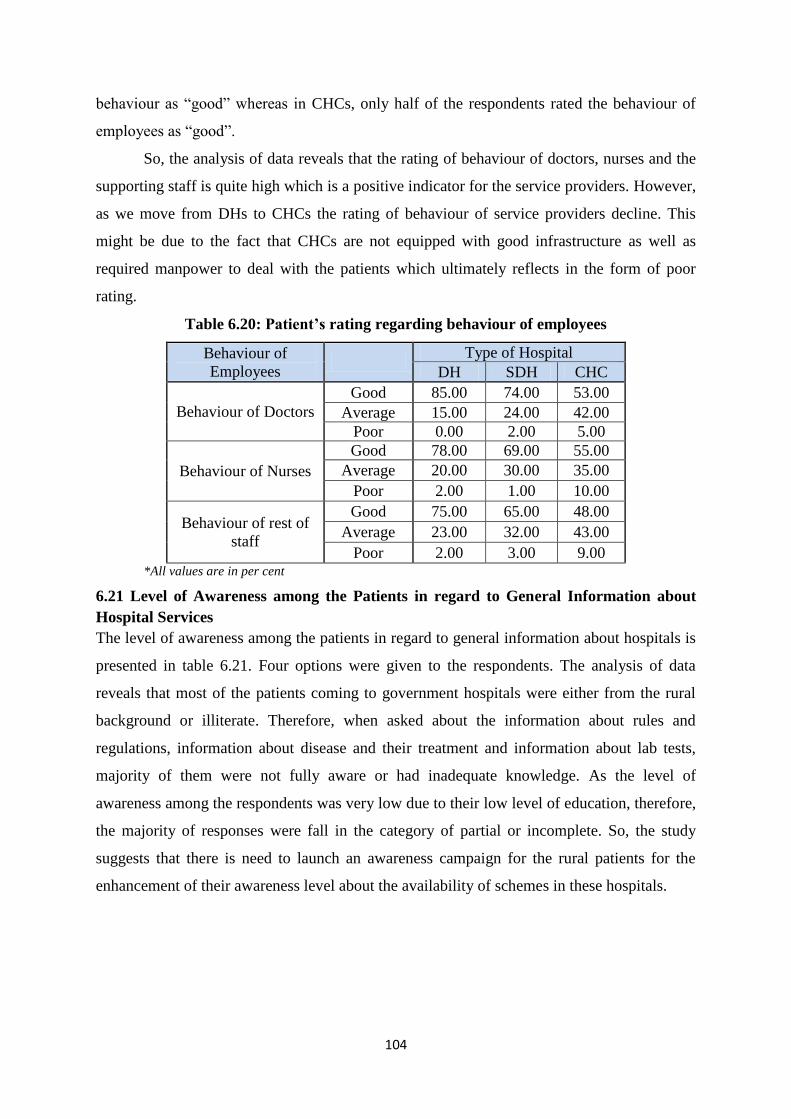
104
behaviour as “good” whereas in CHCs, only half of the respondents rated the behaviour of
employees as “good”.
So, the analysis of data reveals that the rating of behaviour of doctors, nurses and the
supporting staff is quite high which is a positive indicator for the service providers. However,
as we move from DHs to CHCs the rating of behaviour of service providers decline. This
might be due to the fact that CHCs are not equipped with good infrastructure as well as
required manpower to deal with the patients which ultimately reflects in the form of poor
rating.
Table 6.20: Patient’s rating regarding behaviour of employees
Behaviour of
Employees
Type of Hospital
DH SDH CHC
Behaviour of Doctors
Good 85.00 74.00 53.00
Average 15.00 24.00 42.00
Poor 0.00 2.00 5.00
Behaviour of Nurses
Good 78.00 69.00 55.00
Average 20.00 30.00 35.00
Poor 2.00 1.00 10.00
Behaviour of rest of
staff
Good 75.00 65.00 48.00
Average 23.00 32.00 43.00
Poor 2.00 3.00 9.00 *All values are in per cent
6.21 Level of Awareness among the Patients in regard to General Information about
Hospital Services
The level of awareness among the patients in regard to general information about hospitals is
presented in table 6.21. Four options were given to the respondents. The analysis of data
reveals that most of the patients coming to government hospitals were either from the rural
background or illiterate. Therefore, when asked about the information about rules and
regulations, information about disease and their treatment and information about lab tests,
majority of them were not fully aware or had inadequate knowledge. As the level of
awareness among the respondents was very low due to their low level of education, therefore,
the majority of responses were fall in the category of partial or incomplete. So, the study
suggests that there is need to launch an awareness campaign for the rural patients for the
enhancement of their awareness level about the availability of schemes in these hospitals.
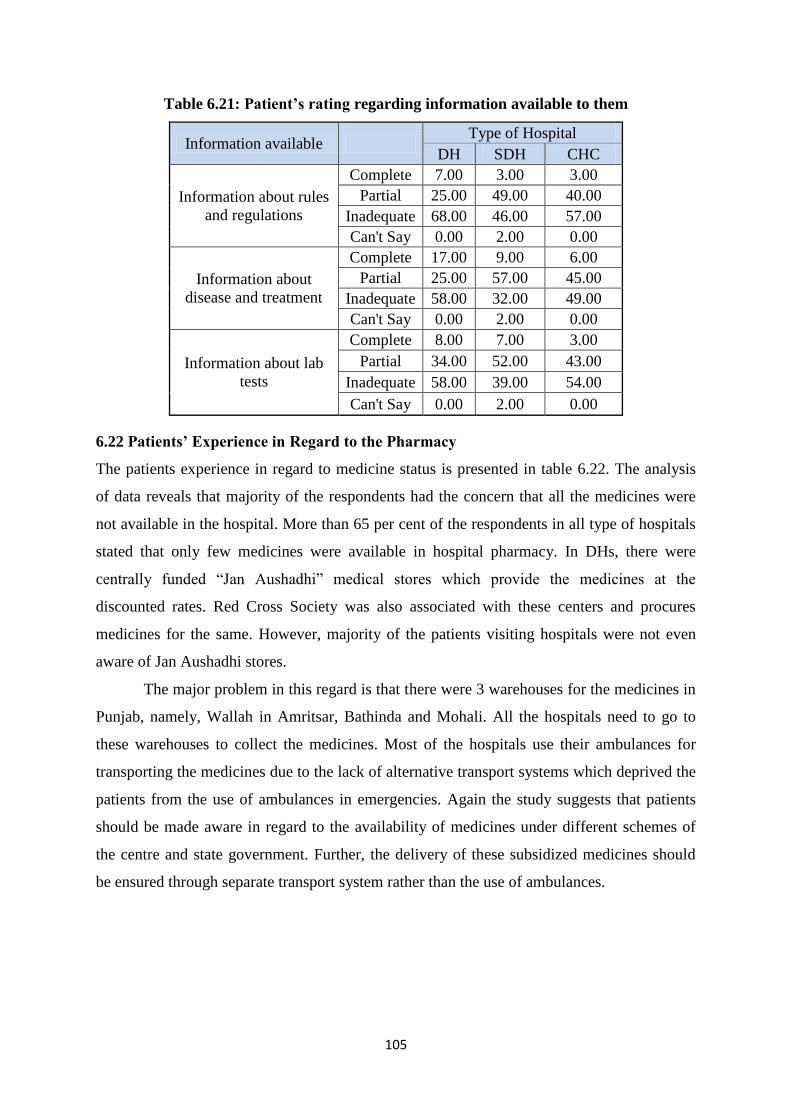
105
Table 6.21: Patient’s rating regarding information available to them
Information available Type of Hospital
DH SDH CHC
Information about rules
and regulations
Complete 7.00 3.00 3.00
Partial 25.00 49.00 40.00
Inadequate 68.00 46.00 57.00
Can't Say 0.00 2.00 0.00
Information about
disease and treatment
Complete 17.00 9.00 6.00
Partial 25.00 57.00 45.00
Inadequate 58.00 32.00 49.00
Can't Say 0.00 2.00 0.00
Information about lab
tests
Complete 8.00 7.00 3.00
Partial 34.00 52.00 43.00
Inadequate 58.00 39.00 54.00
Can't Say 0.00 2.00 0.00
6.22 Patients’ Experience in Regard to the Pharmacy
The patients experience in regard to medicine status is presented in table 6.22. The analysis
of data reveals that majority of the respondents had the concern that all the medicines were
not available in the hospital. More than 65 per cent of the respondents in all type of hospitals
stated that only few medicines were available in hospital pharmacy. In DHs, there were
centrally funded “Jan Aushadhi” medical stores which provide the medicines at the
discounted rates. Red Cross Society was also associated with these centers and procures
medicines for the same. However, majority of the patients visiting hospitals were not even
aware of Jan Aushadhi stores.
The major problem in this regard is that there were 3 warehouses for the medicines in
Punjab, namely, Wallah in Amritsar, Bathinda and Mohali. All the hospitals need to go to
these warehouses to collect the medicines. Most of the hospitals use their ambulances for
transporting the medicines due to the lack of alternative transport systems which deprived the
patients from the use of ambulances in emergencies. Again the study suggests that patients
should be made aware in regard to the availability of medicines under different schemes of
the centre and state government. Further, the delivery of these subsidized medicines should
be ensured through separate transport system rather than the use of ambulances.
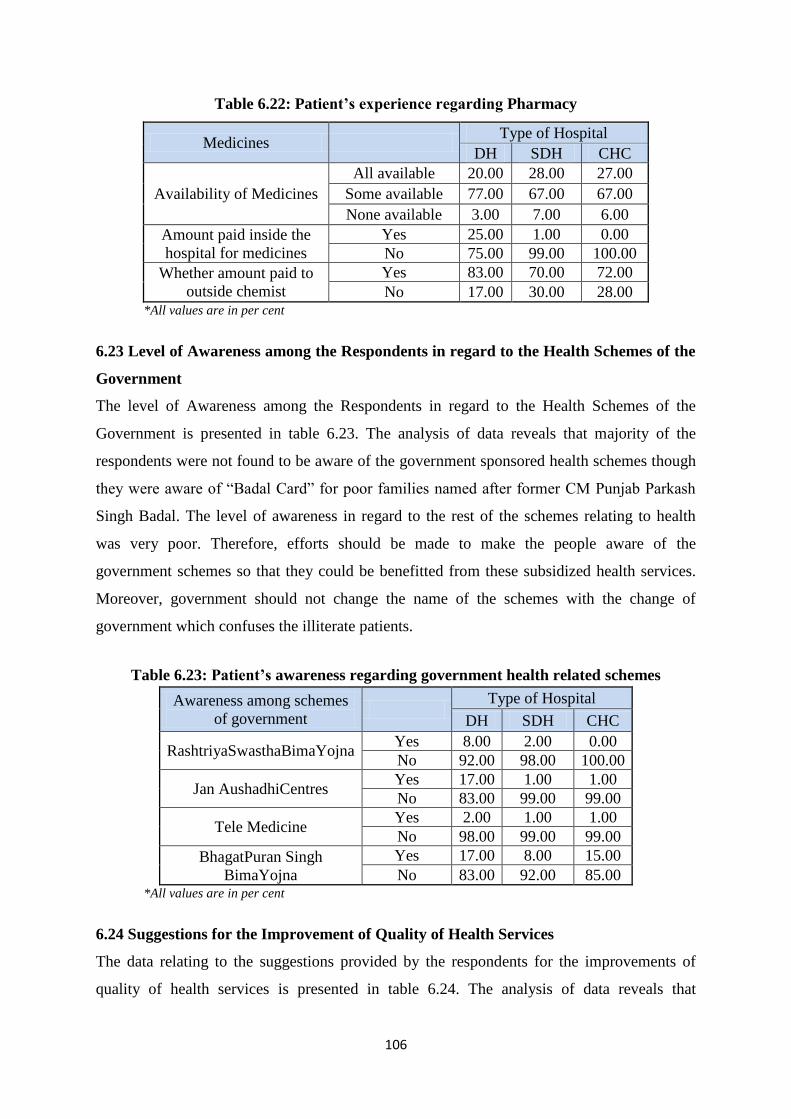
106
Table 6.22: Patient’s experience regarding Pharmacy
Medicines Type of Hospital
DH SDH CHC
Availability of Medicines
All available 20.00 28.00 27.00
Some available 77.00 67.00 67.00
None available 3.00 7.00 6.00
Amount paid inside the
hospital for medicines
Yes 25.00 1.00 0.00
No 75.00 99.00 100.00
Whether amount paid to
outside chemist
Yes 83.00 70.00 72.00
No 17.00 30.00 28.00 *All values are in per cent
6.23 Level of Awareness among the Respondents in regard to the Health Schemes of the
Government
The level of Awareness among the Respondents in regard to the Health Schemes of the
Government is presented in table 6.23. The analysis of data reveals that majority of the
respondents were not found to be aware of the government sponsored health schemes though
they were aware of “Badal Card” for poor families named after former CM Punjab Parkash
Singh Badal. The level of awareness in regard to the rest of the schemes relating to health
was very poor. Therefore, efforts should be made to make the people aware of the
government schemes so that they could be benefitted from these subsidized health services.
Moreover, government should not change the name of the schemes with the change of
government which confuses the illiterate patients.
Table 6.23: Patient’s awareness regarding government health related schemes
Awareness among schemes
of government
Type of Hospital
DH SDH CHC
RashtriyaSwasthaBimaYojna Yes 8.00 2.00 0.00
No 92.00 98.00 100.00
Jan AushadhiCentres Yes 17.00 1.00 1.00
No 83.00 99.00 99.00
Tele Medicine Yes 2.00 1.00 1.00
No 98.00 99.00 99.00
BhagatPuran Singh
BimaYojna
Yes 17.00 8.00 15.00
No 83.00 92.00 85.00 *All values are in per cent
6.24 Suggestions for the Improvement of Quality of Health Services
The data relating to the suggestions provided by the respondents for the improvements of
quality of health services is presented in table 6.24. The analysis of data reveals that
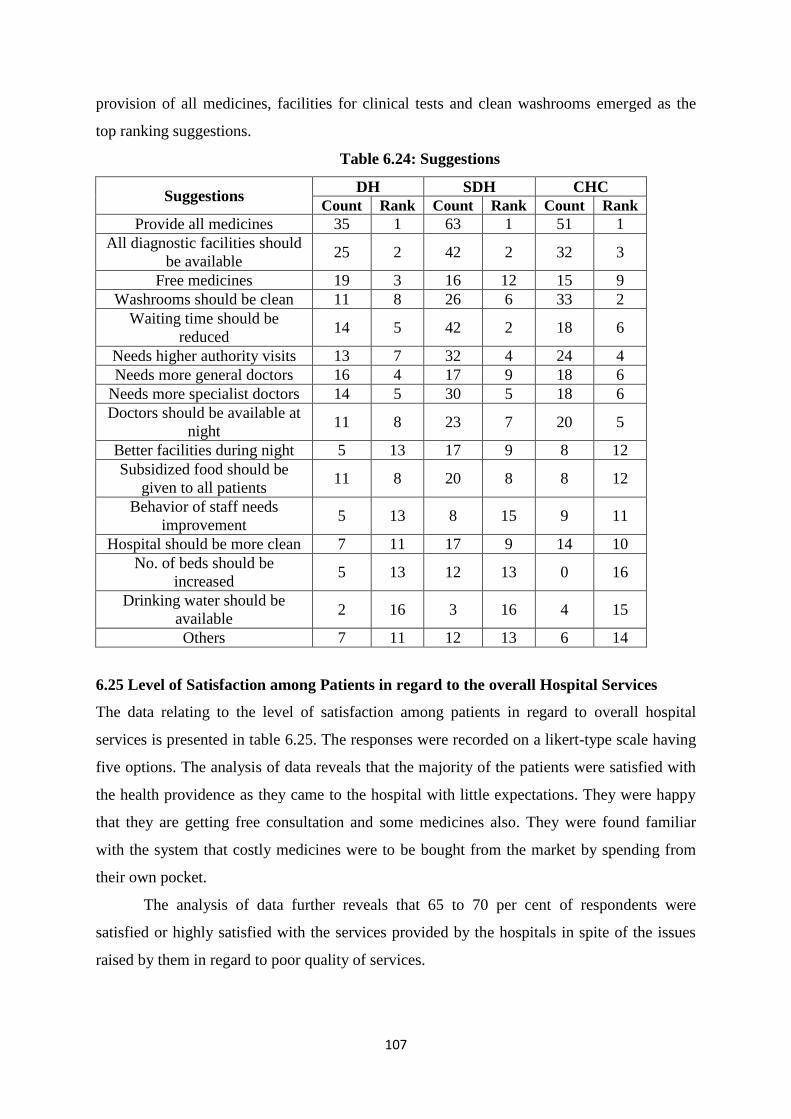
107
provision of all medicines, facilities for clinical tests and clean washrooms emerged as the
top ranking suggestions.
Table 6.24: Suggestions
Suggestions DH SDH CHC
Count Rank Count Rank Count Rank
Provide all medicines 35 1 63 1 51 1
All diagnostic facilities should
be available 25 2 42 2 32 3
Free medicines 19 3 16 12 15 9
Washrooms should be clean 11 8 26 6 33 2
Waiting time should be
reduced 14 5 42 2 18 6
Needs higher authority visits 13 7 32 4 24 4
Needs more general doctors 16 4 17 9 18 6
Needs more specialist doctors 14 5 30 5 18 6
Doctors should be available at
night 11 8 23 7 20 5
Better facilities during night 5 13 17 9 8 12
Subsidized food should be
given to all patients 11 8 20 8 8 12
Behavior of staff needs
improvement 5 13 8 15 9 11
Hospital should be more clean 7 11 17 9 14 10
No. of beds should be
increased 5 13 12 13 0 16
Drinking water should be
available 2 16 3 16 4 15
Others 7 11 12 13 6 14
6.25 Level of Satisfaction among Patients in regard to the overall Hospital Services
The data relating to the level of satisfaction among patients in regard to overall hospital
services is presented in table 6.25. The responses were recorded on a likert-type scale having
five options. The analysis of data reveals that the majority of the patients were satisfied with
the health providence as they came to the hospital with little expectations. They were happy
that they are getting free consultation and some medicines also. They were found familiar
with the system that costly medicines were to be bought from the market by spending from
their own pocket.
The analysis of data further reveals that 65 to 70 per cent of respondents were
satisfied or highly satisfied with the services provided by the hospitals in spite of the issues
raised by them in regard to poor quality of services.
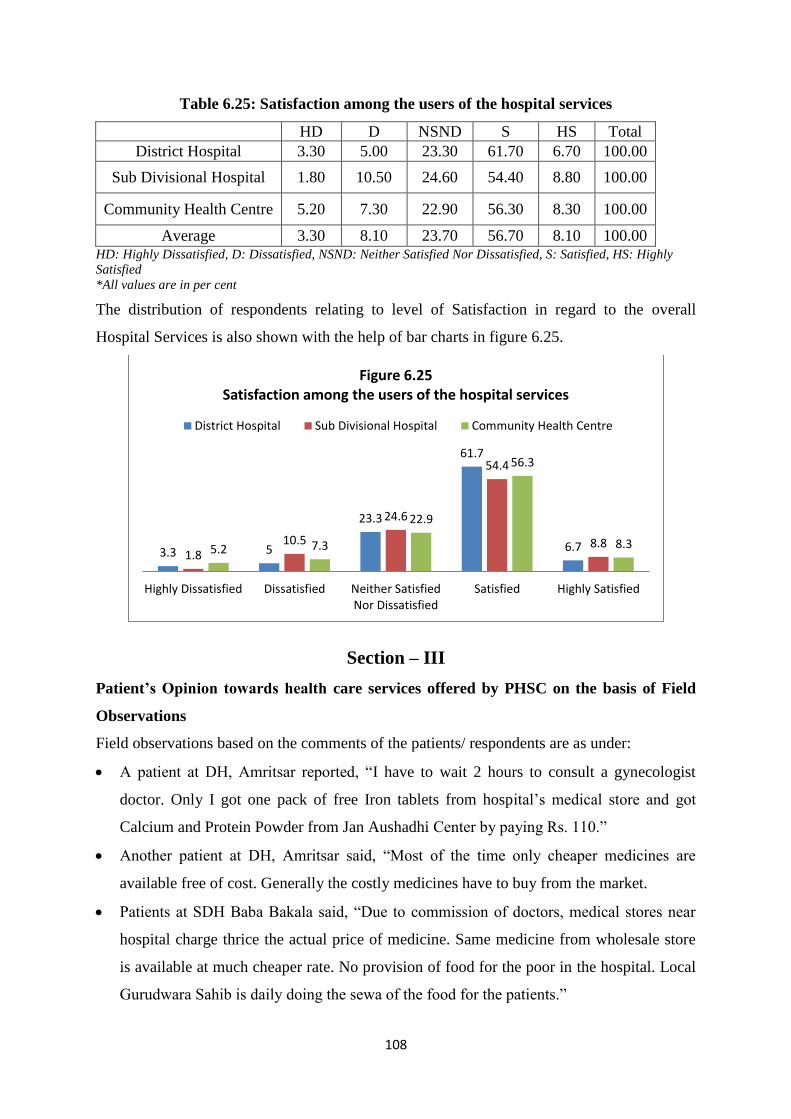
108
Table 6.25: Satisfaction among the users of the hospital services
HD D NSND S HS Total
District Hospital 3.30 5.00 23.30 61.70 6.70 100.00
Sub Divisional Hospital 1.80 10.50 24.60 54.40 8.80 100.00
Community Health Centre 5.20 7.30 22.90 56.30 8.30 100.00
Average 3.30 8.10 23.70 56.70 8.10 100.00 HD: Highly Dissatisfied, D: Dissatisfied, NSND: Neither Satisfied Nor Dissatisfied, S: Satisfied, HS: Highly
Satisfied
*All values are in per cent
The distribution of respondents relating to level of Satisfaction in regard to the overall
Hospital Services is also shown with the help of bar charts in figure 6.25.
Section – III
Patient’s Opinion towards health care services offered by PHSC on the basis of Field
Observations
Field observations based on the comments of the patients/ respondents are as under:
A patient at DH, Amritsar reported, “I have to wait 2 hours to consult a gynecologist
doctor. Only I got one pack of free Iron tablets from hospital‟s medical store and got
Calcium and Protein Powder from Jan Aushadhi Center by paying Rs. 110.”
Another patient at DH, Amritsar said, “Most of the time only cheaper medicines are
available free of cost. Generally the costly medicines have to buy from the market.
Patients at SDH Baba Bakala said, “Due to commission of doctors, medical stores near
hospital charge thrice the actual price of medicine. Same medicine from wholesale store
is available at much cheaper rate. No provision of food for the poor in the hospital. Local
Gurudwara Sahib is daily doing the sewa of the food for the patients.”
3.3 5
23.3
61.7
6.7 1.8
10.5
24.6
54.4
8.8 5.2 7.3
22.9
56.3
8.3
Highly Dissatisfied Dissatisfied Neither SatisfiedNor Dissatisfied
Satisfied Highly Satisfied
Figure 6.25 Satisfaction among the users of the hospital services
District Hospital Sub Divisional Hospital Community Health Centre
109
One patient at SDH Baba Bakala said, “I got operated my arm in the hospital. An
injection which costs Rs. 750 was not available in the hospital medical store. We are not
able to afford such a high cost of medicines. More than Rs. 22,000 we spent out of pocket
in 10 days to complete the treatment which we borrowed at market interest.”
One patient at SDH Ajnala reported that he bought operation kit and plates required for
surgery from outside medical store for Rs. 15,000.
Patients at CHC Lopoke said that OPD timing was 8 am to 2 pm, but doctors came at 9
am and see the patients only till 12 noon. There was no washroom for male patients in the
hospital.
A patient at DH Jalandhar said, “I have to buy costly medicines from outside chemist.
Cost of the medicine was Rs. 800 for 1 day. However, daily food was served from outside
by sewa wala which reduce our cost to stay in the hospital.”
A patient at DH Jalandhar commented that he had to wait for one day and one night for
the operation because doctors were not available.
Some patients told that old machines like X-Rays and Ultrasound in the hospital were not
giving the accurate results. Doctors sometimes suggest to get the procedure done from
outside. Machines should be upgraded/ replaced in SDH Nakodar.
“I delivered a child through caesarian at the hospital but no food was provided though it is
mandatory under central sponsored scheme and LSCS cases are entitled for meals for 7
days”, said a patient at SDH Nakodar.
Doctors advised Ultrasound from outside and we had to spend Rs. 700 twice said a
patient at SDH Phillaur.
“I have Rasoli and when I visited hospital the doctors said they don‟t have treatment at
the hospital. All type of treatment should be made available at CHC level”, said a patient
at CHC Kala Bakra.
Attendant of a patient at CHC Kartarpur said, “Daily we were asked to buy medicines
from outside chemist shops, when we expressed our inability to buy after 16 days, then
doctor wrote the medicines which were available inside the hospital medical store.”
We were forced to buy most of the medicines from outside. We never got all the
medicines prescribed from the hospital‟s medical store reported another patient at CHC
Kartarpur.
110
Another respondent at the CHC informed that doctors were not available during holidays,
only nurses attend the patients at such times. Moreover, no lab tests are done at hospital
though I was suffering from Typhoid.
One patient praised the doctors at DH Tarn Taran that his operation was very well done
by the doctors but hospital needs to reduce waiting time to consult a doctor. There should
be a separate line for senior citizens.
Respondents at DH Tarn Taran suggested that lab test reports should be made available as
soon as the examination of tests is done. They had to wait till 1:30 pm (fixed time) to get
the reports.
Another respondent at DH Tarn Taran said that his son was suffering from bleeding
disorder Hemophilia. When the problem occurs, an injection of Rs. 3500 needs to be
given twice a day. Delhi government is providing treatment of this disease for free but
there is no such facility provided by government of Punjab.
Respondents from CHC Sur Singh reported that they were forced to go to Amritsar as
there is neither any doctor nor any medicine available at the hospital. Doctors remained
absent most of the time, may be due to other works/ duties assigned to the doctors.
Sign boards are not displayed to provide information that subsidized medicines are also
available at the Jan Aushadhi Store. I regularly visit this hospital and today I come to
know about this store after a long time a respondent at DH Hoshiarpur informed.
Another patient at DH Hoshiarpur suggested that number of beds in the emergency
should be increased. Even after one day of admission no bed had been made available to
him due to the shortage of beds.
Though the OPD registration charge was Rs. 10 but if you need immediate consultation,
doctor will charge Rs. 100 to check the patient said a patient at SDH Mukerian.
A respondent at CHC Tanda reported that she had paid fee of Rs. 3000 to avail outsource
doctor services for the caesarian operation at the hospital otherwise they were referring
her to SDH Dasuya. It shows the non-availability of specialist doctor in the PHSC
hospital which is a common problem in many hospitals of PHSC in Punjab.
Respondents at CHC Tanda suggested that the parking fee for the vehicles inside the
hospital premises should be abolished.
A patient at DH Ludhiana complained that he had prostate problem. Doctors were
referring him to Patiala as no doctor and required apparatus were available for the
111
treatment of this problem. He didn‟t have money to go to Patiala. All services should be
made available at the district hospitals.
One patient at DH Ludhiana informed that some NGOs are helping the patients. He was
getting the free medicines from Nikhil Singhal Noble Trust and Eknoor Trust and food
from the sewa. Eknoor Trust beared the expenses of his operation.
Another patient at DH Ludhiana argued that he had been asked to get MRI done from
outside worth Rs. 7000. In Delhi it is free why such facilities are not provided in Punjab.
A patient at SDH Jagraon complained that every time he came at the hospital, he always
had to share the bed with other patients. So, number of beds should be increased in the
hospital.
A patient at SDH Rampura Phool said that doctors asked for MRI of brain but he didn‟t
have money for this costly procedure. Such facilities should be provided to the poor
people free of cost.
An old patient at CHC Bhagta Bhai Ka said, “Only one week medicine is given from the
medical stores. As I am old it is difficult for me to come again and again from the village.
Even doctor wrote medicine for 1 month on the prescription slips. It should be allowed
for senior citizens to take medicine for longer period because the frequent visits to the
hospital add extra cost to the poor patients.
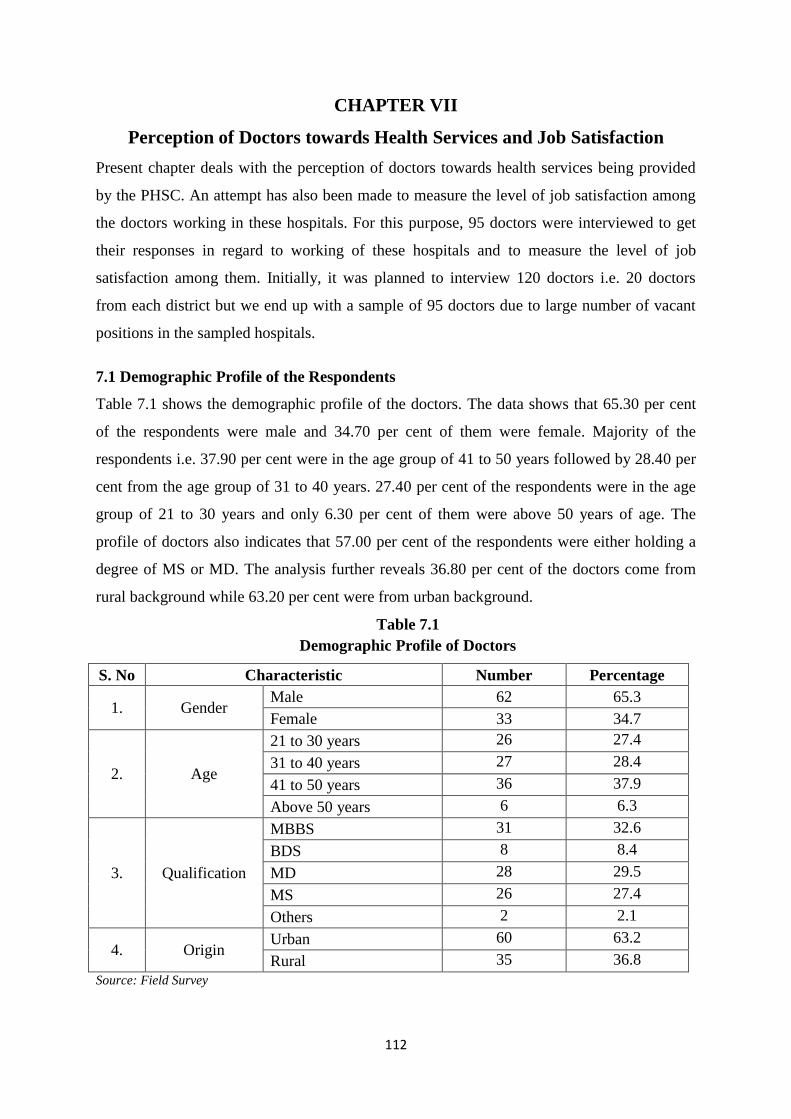
112
CHAPTER VII
Perception of Doctors towards Health Services and Job Satisfaction
Present chapter deals with the perception of doctors towards health services being provided
by the PHSC. An attempt has also been made to measure the level of job satisfaction among
the doctors working in these hospitals. For this purpose, 95 doctors were interviewed to get
their responses in regard to working of these hospitals and to measure the level of job
satisfaction among them. Initially, it was planned to interview 120 doctors i.e. 20 doctors
from each district but we end up with a sample of 95 doctors due to large number of vacant
positions in the sampled hospitals.
7.1 Demographic Profile of the Respondents
Table 7.1 shows the demographic profile of the doctors. The data shows that 65.30 per cent
of the respondents were male and 34.70 per cent of them were female. Majority of the
respondents i.e. 37.90 per cent were in the age group of 41 to 50 years followed by 28.40 per
cent from the age group of 31 to 40 years. 27.40 per cent of the respondents were in the age
group of 21 to 30 years and only 6.30 per cent of them were above 50 years of age. The
profile of doctors also indicates that 57.00 per cent of the respondents were either holding a
degree of MS or MD. The analysis further reveals 36.80 per cent of the doctors come from
rural background while 63.20 per cent were from urban background.
Table 7.1
Demographic Profile of Doctors
S. No Characteristic Number Percentage
1. Gender Male 62 65.3
Female 33 34.7
2. Age
21 to 30 years 26 27.4
31 to 40 years 27 28.4
41 to 50 years 36 37.9
Above 50 years 6 6.3
3. Qualification
MBBS 31 32.6
BDS 8 8.4
MD 28 29.5
MS 26 27.4
Others 2 2.1
4. Origin Urban 60 63.2
Rural 35 36.8
Source: Field Survey
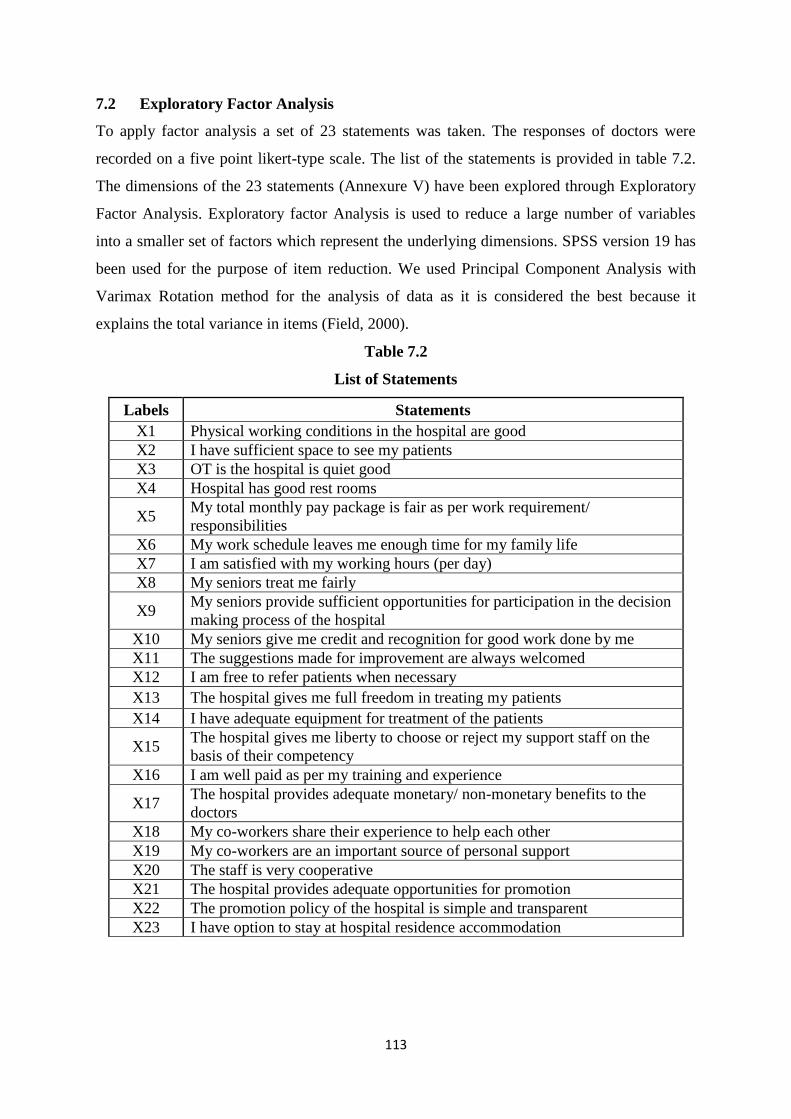
113
7.2 Exploratory Factor Analysis
To apply factor analysis a set of 23 statements was taken. The responses of doctors were
recorded on a five point likert-type scale. The list of the statements is provided in table 7.2.
The dimensions of the 23 statements (Annexure V) have been explored through Exploratory
Factor Analysis. Exploratory factor Analysis is used to reduce a large number of variables
into a smaller set of factors which represent the underlying dimensions. SPSS version 19 has
been used for the purpose of item reduction. We used Principal Component Analysis with
Varimax Rotation method for the analysis of data as it is considered the best because it
explains the total variance in items (Field, 2000).
Table 7.2
List of Statements
Labels Statements
X1 Physical working conditions in the hospital are good
X2 I have sufficient space to see my patients
X3 OT is the hospital is quiet good
X4 Hospital has good rest rooms
X5 My total monthly pay package is fair as per work requirement/
responsibilities
X6 My work schedule leaves me enough time for my family life
X7 I am satisfied with my working hours (per day)
X8 My seniors treat me fairly
X9 My seniors provide sufficient opportunities for participation in the decision
making process of the hospital
X10 My seniors give me credit and recognition for good work done by me
X11 The suggestions made for improvement are always welcomed
X12 I am free to refer patients when necessary
X13 The hospital gives me full freedom in treating my patients
X14 I have adequate equipment for treatment of the patients
X15 The hospital gives me liberty to choose or reject my support staff on the
basis of their competency
X16 I am well paid as per my training and experience
X17 The hospital provides adequate monetary/ non-monetary benefits to the
doctors
X18 My co-workers share their experience to help each other
X19 My co-workers are an important source of personal support
X20 The staff is very cooperative
X21 The hospital provides adequate opportunities for promotion
X22 The promotion policy of the hospital is simple and transparent
X23 I have option to stay at hospital residence accommodation
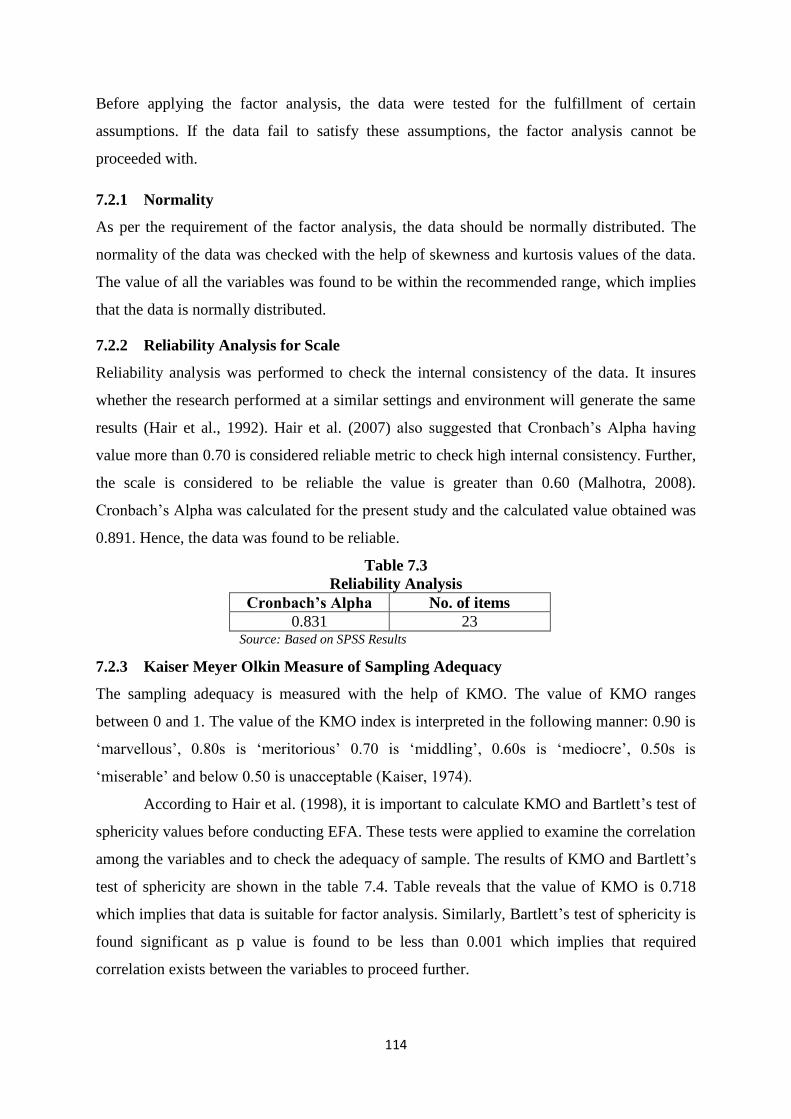
114
Before applying the factor analysis, the data were tested for the fulfillment of certain
assumptions. If the data fail to satisfy these assumptions, the factor analysis cannot be
proceeded with.
7.2.1 Normality
As per the requirement of the factor analysis, the data should be normally distributed. The
normality of the data was checked with the help of skewness and kurtosis values of the data.
The value of all the variables was found to be within the recommended range, which implies
that the data is normally distributed.
7.2.2 Reliability Analysis for Scale
Reliability analysis was performed to check the internal consistency of the data. It insures
whether the research performed at a similar settings and environment will generate the same
results (Hair et al., 1992). Hair et al. (2007) also suggested that Cronbach‟s Alpha having
value more than 0.70 is considered reliable metric to check high internal consistency. Further,
the scale is considered to be reliable the value is greater than 0.60 (Malhotra, 2008).
Cronbach‟s Alpha was calculated for the present study and the calculated value obtained was
0.891. Hence, the data was found to be reliable.
Table 7.3
Reliability Analysis
Cronbach’s Alpha No. of items
0.831 23 Source: Based on SPSS Results
7.2.3 Kaiser Meyer Olkin Measure of Sampling Adequacy
The sampling adequacy is measured with the help of KMO. The value of KMO ranges
between 0 and 1. The value of the KMO index is interpreted in the following manner: 0.90 is
„marvellous‟, 0.80s is „meritorious‟ 0.70 is „middling‟, 0.60s is „mediocre‟, 0.50s is
„miserable‟ and below 0.50 is unacceptable (Kaiser, 1974).
According to Hair et al. (1998), it is important to calculate KMO and Bartlett‟s test of
sphericity values before conducting EFA. These tests were applied to examine the correlation
among the variables and to check the adequacy of sample. The results of KMO and Bartlett‟s
test of sphericity are shown in the table 7.4. Table reveals that the value of KMO is 0.718
which implies that data is suitable for factor analysis. Similarly, Bartlett‟s test of sphericity is
found significant as p value is found to be less than 0.001 which implies that required
correlation exists between the variables to proceed further.
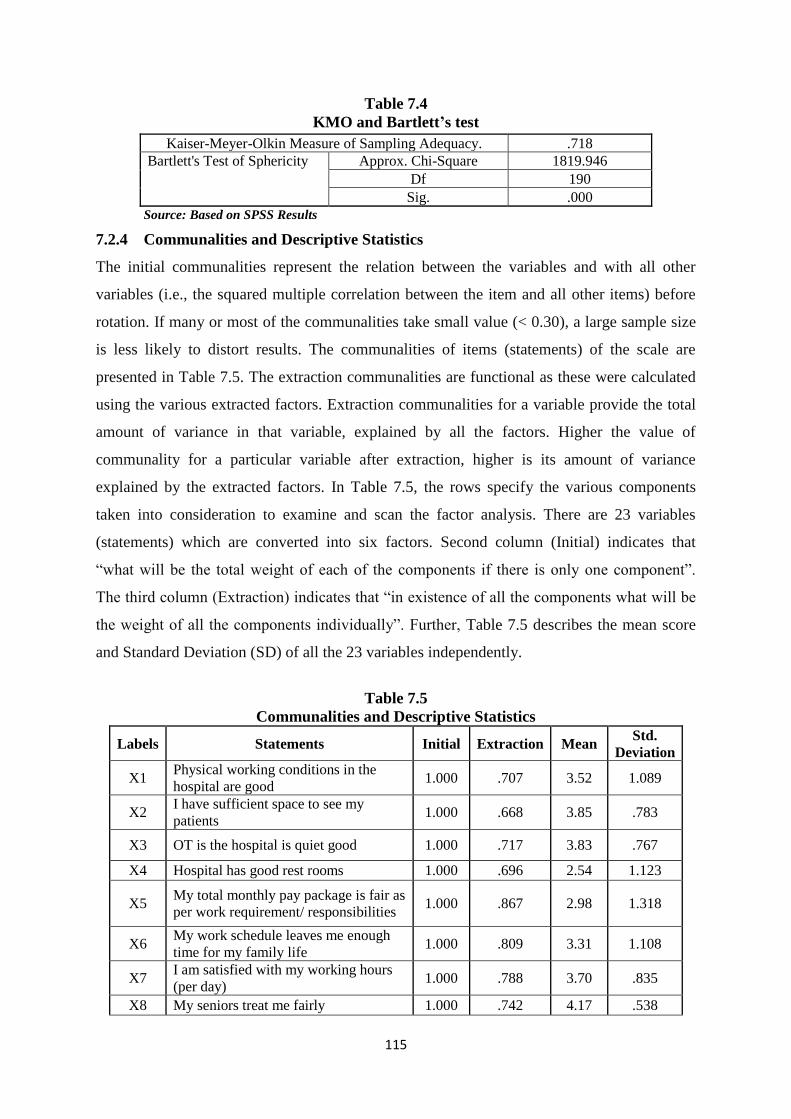
115
Table 7.4
KMO and Bartlett’s test
Kaiser-Meyer-Olkin Measure of Sampling Adequacy. .718
Bartlett's Test of Sphericity Approx. Chi-Square 1819.946
Df 190
Sig. .000
Source: Based on SPSS Results
7.2.4 Communalities and Descriptive Statistics
The initial communalities represent the relation between the variables and with all other
variables (i.e., the squared multiple correlation between the item and all other items) before
rotation. If many or most of the communalities take small value (< 0.30), a large sample size
is less likely to distort results. The communalities of items (statements) of the scale are
presented in Table 7.5. The extraction communalities are functional as these were calculated
using the various extracted factors. Extraction communalities for a variable provide the total
amount of variance in that variable, explained by all the factors. Higher the value of
communality for a particular variable after extraction, higher is its amount of variance
explained by the extracted factors. In Table 7.5, the rows specify the various components
taken into consideration to examine and scan the factor analysis. There are 23 variables
(statements) which are converted into six factors. Second column (Initial) indicates that
“what will be the total weight of each of the components if there is only one component”.
The third column (Extraction) indicates that “in existence of all the components what will be
the weight of all the components individually”. Further, Table 7.5 describes the mean score
and Standard Deviation (SD) of all the 23 variables independently.
Table 7.5
Communalities and Descriptive Statistics
Labels Statements Initial Extraction Mean Std.
Deviation
X1 Physical working conditions in the
hospital are good 1.000 .707 3.52 1.089
X2 I have sufficient space to see my
patients 1.000 .668 3.85 .783
X3 OT is the hospital is quiet good 1.000 .717 3.83 .767
X4 Hospital has good rest rooms 1.000 .696 2.54 1.123
X5 My total monthly pay package is fair as
per work requirement/ responsibilities 1.000 .867 2.98 1.318
X6 My work schedule leaves me enough
time for my family life 1.000 .809 3.31 1.108
X7 I am satisfied with my working hours
(per day) 1.000 .788 3.70 .835
X8 My seniors treat me fairly 1.000 .742 4.17 .538
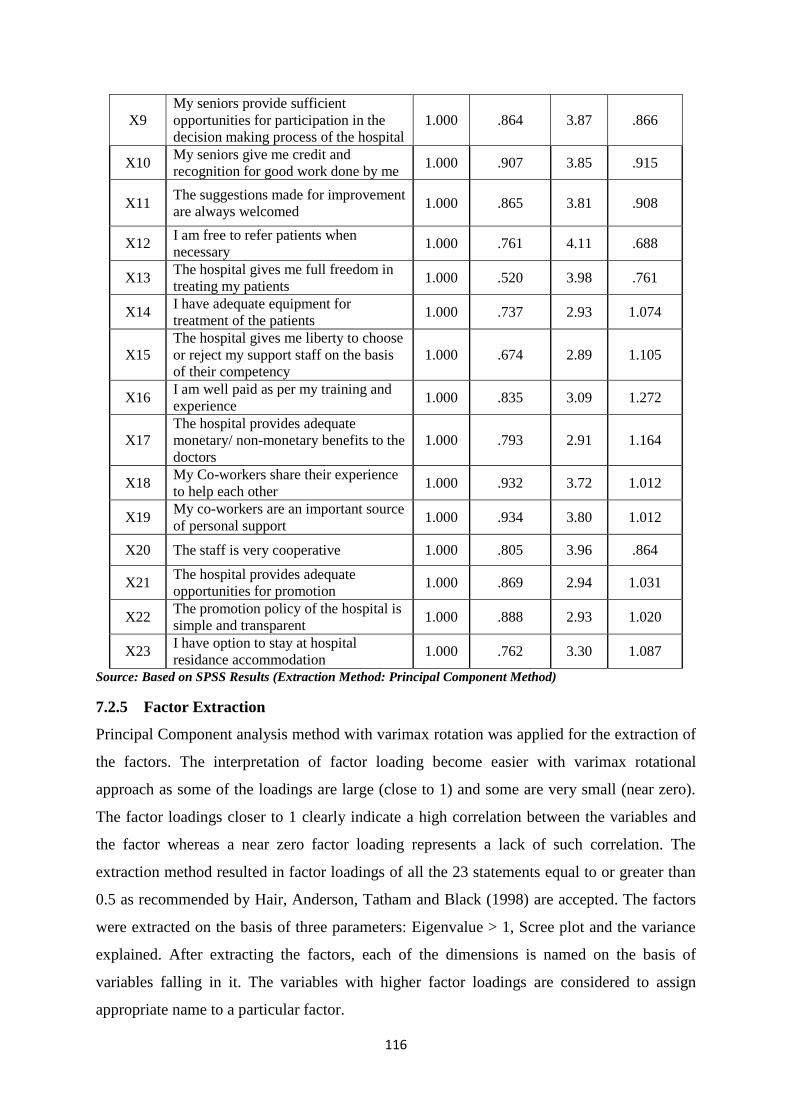
116
X9
My seniors provide sufficient
opportunities for participation in the
decision making process of the hospital
1.000 .864 3.87 .866
X10 My seniors give me credit and
recognition for good work done by me 1.000 .907 3.85 .915
X11 The suggestions made for improvement
are always welcomed 1.000 .865 3.81 .908
X12 I am free to refer patients when
necessary 1.000 .761 4.11 .688
X13 The hospital gives me full freedom in
treating my patients 1.000 .520 3.98 .761
X14 I have adequate equipment for
treatment of the patients 1.000 .737 2.93 1.074
X15
The hospital gives me liberty to choose
or reject my support staff on the basis
of their competency
1.000 .674 2.89 1.105
X16 I am well paid as per my training and
experience 1.000 .835 3.09 1.272
X17
The hospital provides adequate
monetary/ non-monetary benefits to the
doctors
1.000 .793 2.91 1.164
X18 My Co-workers share their experience
to help each other 1.000 .932 3.72 1.012
X19 My co-workers are an important source
of personal support 1.000 .934 3.80 1.012
X20 The staff is very cooperative 1.000 .805 3.96 .864
X21 The hospital provides adequate
opportunities for promotion 1.000 .869 2.94 1.031
X22 The promotion policy of the hospital is
simple and transparent 1.000 .888 2.93 1.020
X23 I have option to stay at hospital
residance accommodation 1.000 .762 3.30 1.087
Source: Based on SPSS Results (Extraction Method: Principal Component Method)
7.2.5 Factor Extraction
Principal Component analysis method with varimax rotation was applied for the extraction of
the factors. The interpretation of factor loading become easier with varimax rotational
approach as some of the loadings are large (close to 1) and some are very small (near zero).
The factor loadings closer to 1 clearly indicate a high correlation between the variables and
the factor whereas a near zero factor loading represents a lack of such correlation. The
extraction method resulted in factor loadings of all the 23 statements equal to or greater than
0.5 as recommended by Hair, Anderson, Tatham and Black (1998) are accepted. The factors
were extracted on the basis of three parameters: Eigenvalue > 1, Scree plot and the variance
explained. After extracting the factors, each of the dimensions is named on the basis of
variables falling in it. The variables with higher factor loadings are considered to assign
appropriate name to a particular factor.
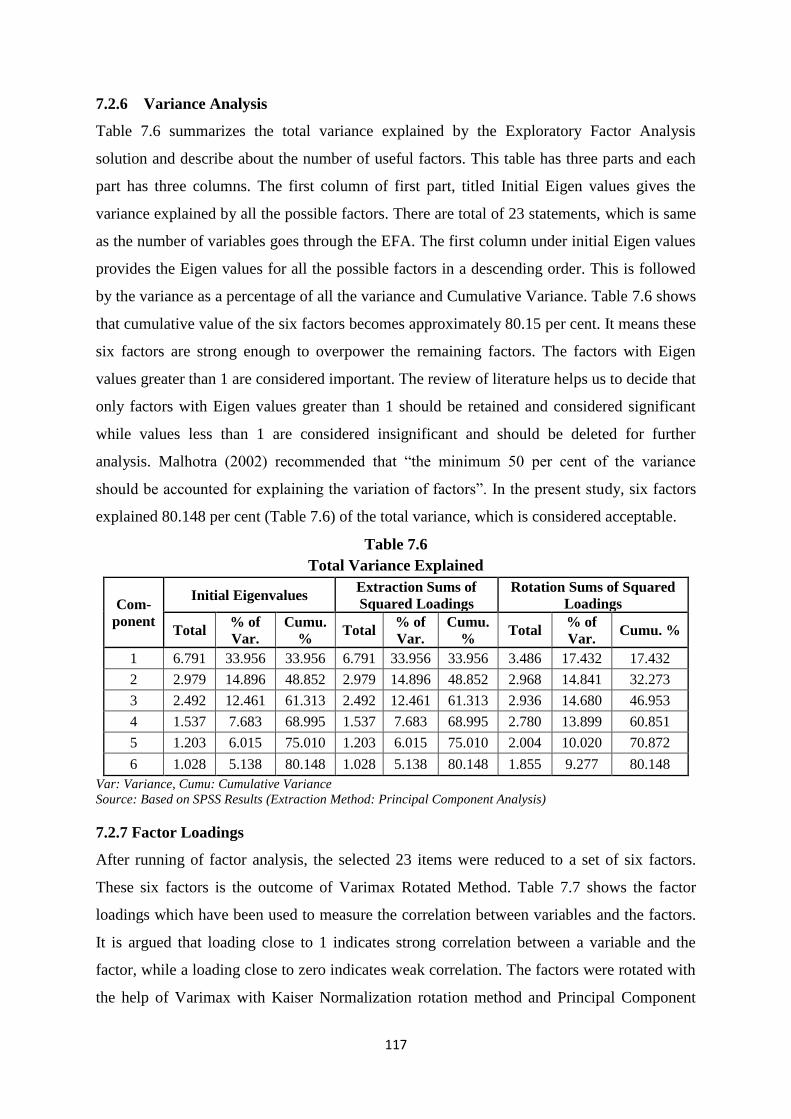
117
7.2.6 Variance Analysis
Table 7.6 summarizes the total variance explained by the Exploratory Factor Analysis
solution and describe about the number of useful factors. This table has three parts and each
part has three columns. The first column of first part, titled Initial Eigen values gives the
variance explained by all the possible factors. There are total of 23 statements, which is same
as the number of variables goes through the EFA. The first column under initial Eigen values
provides the Eigen values for all the possible factors in a descending order. This is followed
by the variance as a percentage of all the variance and Cumulative Variance. Table 7.6 shows
that cumulative value of the six factors becomes approximately 80.15 per cent. It means these
six factors are strong enough to overpower the remaining factors. The factors with Eigen
values greater than 1 are considered important. The review of literature helps us to decide that
only factors with Eigen values greater than 1 should be retained and considered significant
while values less than 1 are considered insignificant and should be deleted for further
analysis. Malhotra (2002) recommended that “the minimum 50 per cent of the variance
should be accounted for explaining the variation of factors”. In the present study, six factors
explained 80.148 per cent (Table 7.6) of the total variance, which is considered acceptable.
Table 7.6
Total Variance Explained
Com-
ponent
Initial Eigenvalues Extraction Sums of
Squared Loadings
Rotation Sums of Squared
Loadings
Total % of
Var.
Cumu.
% Total
% of
Var.
Cumu.
% Total
% of
Var. Cumu. %
1 6.791 33.956 33.956 6.791 33.956 33.956 3.486 17.432 17.432
2 2.979 14.896 48.852 2.979 14.896 48.852 2.968 14.841 32.273
3 2.492 12.461 61.313 2.492 12.461 61.313 2.936 14.680 46.953
4 1.537 7.683 68.995 1.537 7.683 68.995 2.780 13.899 60.851
5 1.203 6.015 75.010 1.203 6.015 75.010 2.004 10.020 70.872
6 1.028 5.138 80.148 1.028 5.138 80.148 1.855 9.277 80.148
Var: Variance, Cumu: Cumulative Variance
Source: Based on SPSS Results (Extraction Method: Principal Component Analysis)
7.2.7 Factor Loadings
After running of factor analysis, the selected 23 items were reduced to a set of six factors.
These six factors is the outcome of Varimax Rotated Method. Table 7.7 shows the factor
loadings which have been used to measure the correlation between variables and the factors.
It is argued that loading close to 1 indicates strong correlation between a variable and the
factor, while a loading close to zero indicates weak correlation. The factors were rotated with
the help of Varimax with Kaiser Normalization rotation method and Principal Component
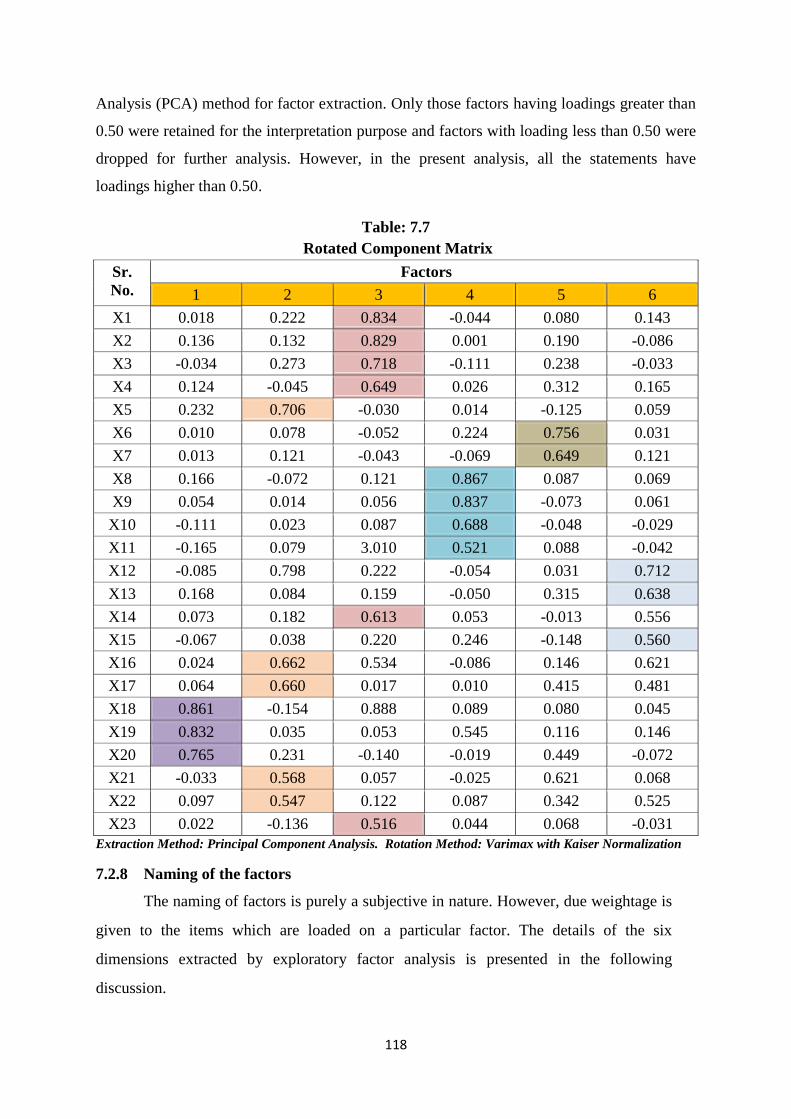
118
Analysis (PCA) method for factor extraction. Only those factors having loadings greater than
0.50 were retained for the interpretation purpose and factors with loading less than 0.50 were
dropped for further analysis. However, in the present analysis, all the statements have
loadings higher than 0.50.
Table: 7.7
Rotated Component Matrix
Sr.
No.
Factors
1 2 3 4 5 6
X1 0.018 0.222 0.834 -0.044 0.080 0.143
X2 0.136 0.132 0.829 0.001 0.190 -0.086
X3 -0.034 0.273 0.718 -0.111 0.238 -0.033
X4 0.124 -0.045 0.649 0.026 0.312 0.165
X5 0.232 0.706 -0.030 0.014 -0.125 0.059
X6 0.010 0.078 -0.052 0.224 0.756 0.031
X7 0.013 0.121 -0.043 -0.069 0.649 0.121
X8 0.166 -0.072 0.121 0.867 0.087 0.069
X9 0.054 0.014 0.056 0.837 -0.073 0.061
X10 -0.111 0.023 0.087 0.688 -0.048 -0.029
X11 -0.165 0.079 3.010 0.521 0.088 -0.042
X12 -0.085 0.798 0.222 -0.054 0.031 0.712
X13 0.168 0.084 0.159 -0.050 0.315 0.638
X14 0.073 0.182 0.613 0.053 -0.013 0.556
X15 -0.067 0.038 0.220 0.246 -0.148 0.560
X16 0.024 0.662 0.534 -0.086 0.146 0.621
X17 0.064 0.660 0.017 0.010 0.415 0.481
X18 0.861 -0.154 0.888 0.089 0.080 0.045
X19 0.832 0.035 0.053 0.545 0.116 0.146
X20 0.765 0.231 -0.140 -0.019 0.449 -0.072
X21 -0.033 0.568 0.057 -0.025 0.621 0.068
X22 0.097 0.547 0.122 0.087 0.342 0.525
X23 0.022 -0.136 0.516 0.044 0.068 -0.031
Extraction Method: Principal Component Analysis. Rotation Method: Varimax with Kaiser Normalization
7.2.8 Naming of the factors
The naming of factors is purely a subjective in nature. However, due weightage is
given to the items which are loaded on a particular factor. The details of the six
dimensions extracted by exploratory factor analysis is presented in the following
discussion.
119
Factor I: Relationship with Co-workers
This factor has emerged as the most important and three statements are loaded on
this factor. The data reveals that all the variables loaded on this factor have high factor
loadings which show the significance of this factor i.e. support of co-workers to
performing doctors. Statements X18, X19, X20 are loaded on this factor. It implies that
the support of co-workers is very important for the performing doctor.
Factor II: Monetary benefits and Career Development
The second factor is named as “Monetary benefits and Career Development”
includes five statements and all the variables on this factor have high value of correlation
i.e. greater than 0.5 which proves that all the variables are closely related to the factor.
Statements X5, X16, X17, X21, X22 are loaded on this factor. So, the monetary benefits
and career development has emerged as the second important factor.
Factor III: Workplace Environment
The third factor has the highest number of statements i.e. six that makes this factor
very important to consider. This factor is obtained on the basis of responses of doctors in
regard to their satisfaction with environment at the workplace. Statements X1, X2, X3, X4,
X14, X23 are loaded on this factor. This factor highlighted that the workplace environment
plays a very important role for the better outcomes.
Factor IV: Relationship with Seniors
The fourth factor that has emerged from the factor analysis is named as
'Relationship with seniors' and four items are loaded on this factor. This factor helps us to
understand the extent of team work among the medical professionals. Statements X8, X9,
X10, X11 are loaded on this factor. In medical profession, team work is very important as
most of the diseases are multidimensional.
Factor V: Extent of Workload
This factor accounting for 10.020 per cent of the variance has been named as
'Extent of Workload'. It is related to the amount of burden on the doctors during the
performance of their job and the time available for their personal life. The two items,
namely, X6 and X7 are loaded on this factor.
120
Factor VI: Level of Autonomy at Workplace
Three statements are loaded on the last factor. Autonomy refers to the degree of
freedom given to the employee to perform his/her job. Statements X12, X13 and X15 are
loaded on this factor.
Hence, the factor analysis summarized the 23 statements into 6 factors. So, the
application of exploratory factor analysis has enabled us to achieve our objective of
getting six factors on the basis of 23 variables which are important job dimensions to
carry forward future analysis as well as to suggest for the formulation of suitable health
policy.
Overall Job Satisfaction Among Doctors
An attempt was also made to get the overall response of doctors on the basis of one
statement and the mean obtained was 3.62 which indicate that most of the doctors were
satisfied with their job. But when we analyzed satisfaction level of doctors who were MBBS
with their job then mean value decreased to 3.29 which shows that satisfaction level was low
among MBBS doctors. This may be due to low pay structure and more workload for newly
joined doctors. It is pertinent to mention that Punjab government is not paying full salary to
their employees as per their entitlement in all the departments. A newly appointed employee
is to work on basic pay for first three years. It is after three years that an employee will get
full pay which is also applicable in health department.
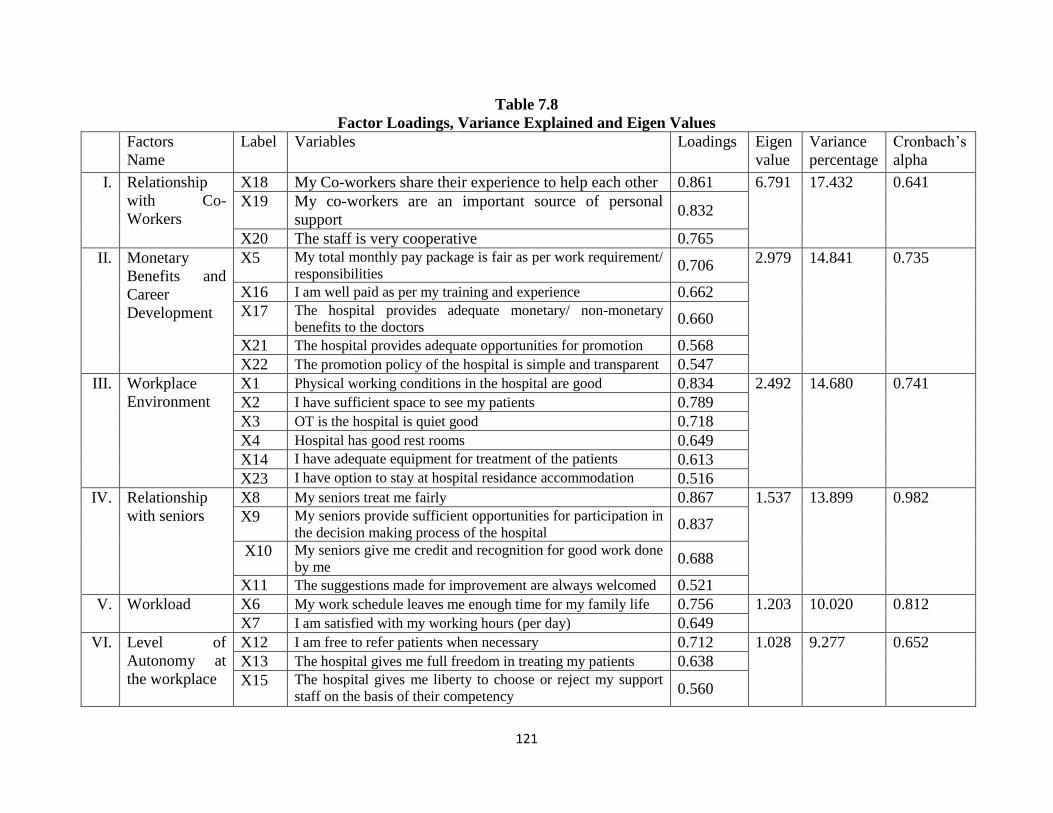
121
Table 7.8
Factor Loadings, Variance Explained and Eigen Values
Factors
Name
Label
Variables Loadings Eigen
value
Variance
percentage
Cronbach‟s
alpha
I. Relationship
with Co-
Workers
X18 My Co-workers share their experience to help each other 0.861 6.791 17.432 0.641
X19 My co-workers are an important source of personal
support 0.832
X20 The staff is very cooperative 0.765
II. Monetary
Benefits and
Career
Development
X5 My total monthly pay package is fair as per work requirement/
responsibilities 0.706
2.979 14.841 0.735
X16 I am well paid as per my training and experience 0.662
X17 The hospital provides adequate monetary/ non-monetary
benefits to the doctors 0.660
X21 The hospital provides adequate opportunities for promotion 0.568
X22 The promotion policy of the hospital is simple and transparent 0.547
III. Workplace
Environment
X1 Physical working conditions in the hospital are good 0.834 2.492 14.680 0.741
X2 I have sufficient space to see my patients 0.789
X3 OT is the hospital is quiet good 0.718
X4 Hospital has good rest rooms 0.649
X14 I have adequate equipment for treatment of the patients 0.613
X23 I have option to stay at hospital residance accommodation 0.516
IV. Relationship
with seniors
X8 My seniors treat me fairly 0.867 1.537 13.899 0.982
X9 My seniors provide sufficient opportunities for participation in
the decision making process of the hospital 0.837
X10 My seniors give me credit and recognition for good work done
by me 0.688
X11 The suggestions made for improvement are always welcomed 0.521
V. Workload X6 My work schedule leaves me enough time for my family life 0.756 1.203 10.020 0.812
X7 I am satisfied with my working hours (per day) 0.649
VI.
Level of
Autonomy at
the workplace
X12 I am free to refer patients when necessary 0.712 1.028 9.277 0.652
X13 The hospital gives me full freedom in treating my patients 0.638
X15 The hospital gives me liberty to choose or reject my support
staff on the basis of their competency 0.560
122
Doctor’s Opinion towards health care services offered by PHSC on the basis of Field
Observations
The comments recorded during the field survey are presented below along with their suggestions.
However, the name of the doctor/ hospital has been kept secret.
Emergency Medical Officers are less in number. Basic infrastructure is not as per standards.
Required equipments to treat the patients are not available. There is no system to ensure
security of doctors.
Overall system needs improvement. At least 3-4 security guards should be available at night.
Hospitals are highly unsecure. 24x7 hours security should be made available.
Political involvement in the healthcare services should be checked. Political transfers are
done when the illegal work of influential person is not done and one has to pay huge price to
come back to his/her family.
There should be separate wings for child delivery. Moreover, laparoscope and trauma
training should be provided to Emergency Medical Officers.
To deal the emergency cases separate doctors should be deputed. Specialist doctors should
not be involved in Medico-legal cases. Direct feedback of the system from the doctors should
be implemented. Frequent training or conferences should be made compulsory for every
doctor. Subsidized books should be provided to specialist doctors. Access to internet and
journals should be provided in the hospitals.
More generic medicines should be made available and more staff is needed in order to carry
out the smooth functioning of the hospital.
There is a need for increase in staff strength and number of beds in the hospital. Sometimes
80+ patients are admitted in our 50 bedded hospital. It affects the efficiency and quality of
services provided in these hospitals.
Regular funds should be provided for the maintenance of existing equipments and
infrastructure which is lacking at present.
Medicine stock should be increased as per requirements of the hospital. The dealing staff and
the doctors have to face the reaction of the public due to the non-availability of sufficient
medicines.
Purchase of quality medicines from good companies should be done.
123
There is need to pay good perks to specialist doctors as per their experience and working
hours. Equipments needs up gradation/replacement.
There is a need for sufficient manpower to maintain hygiene and good sanitation conditions
in the wards and washrooms twenty four hours. Hygiene and infection control committees
are required to be set in each hospital at all levels.
The quality of medicines is a serious issue and should be addressed.
Many of the PHSC run hospitals are without proper boundary wall. Funds should be made
available for the construction of the boundary walls.
The principle of equal pay for equal work should be followed. Presently, doctors are under-
paid which de-motivate them. Highly qualified doctors are under paid during the probation
period as per the new rules implemented by the Punjab government.
Infrastructure should be modernized, medicines should be made available all the time and
better equipments and facilities should be provided.
Separate rooms are required for the admission of the patients. Sometimes the non-availability
of separate rooms in PHSC run hospitals compels the patients to move to private hospitals.
One doctor said, “I am satisfied with what I am doing but dissatisfied what government is
doing with regard to initiatives taken for better health services”.
Many times patients become aggressive when they come with their own prescription and
compel the doctors to approve the same to get it free from the dispensary. The failure to
accept their proposal leads to crisis.
Beds of modern type are required which are patient friendly. There is shortage of nursing
staff. Maximum of the time, 50 per cent of medicines are not available in stock. Protein
powder needed for pregnant women remains out of stock all the time which is very much in
demand.
Sometimes patient forces us for treatment as per their choice. They want quick results which
is not possible in case of chronic diseases.
Many cases admitted in hospitals in critical condition. Sometimes they come to hospital after
getting wrong treatment from unqualified doctors and blame us for not treating their patients
in a proper manner.
124
CHAPTER VIII
Summary, Conclusion and Recommendations
Good health is considered to be a pre-requisite for the socio-economic development of a country.
In the present times, the weightage of health parameters for the ranking of the countries at the
International level has got special attention. Moreover, the role of state either in the form of
direct provision of health care services or regulation of the supply of health care by the private
sector has been considered essential to ensure equitable access of health services to lower section
of the society.
A brief look on the International Health Scenario reveals that the access to health services
is not free from controversies. WHO in 2008 identified five common shortcomings of health care
delivery at the global level. Firstly, public spending on health services often benefits the rich
more than the poor in high and low-income countries alike. Secondly, it has been found that
about 100 million people annually fall into poverty because they have to pay for health care from
their pockets. Thirdly, health services for poor and marginalized groups are often highly
fragmented and severely under resourced while developmental aid further adds to the
fragmentation. Fourthly, poor designing of health system has been failed to ensure safety and
hygiene standards. Fifth, misdirected care i.e. resource allocation clusters around curative
services at great cost, neglecting the potential of primary prevention and health promotion to
prevent up to 70 per cent of the disease burden.
The misery of the Indian health sector is that out of the total private health expenditure
87.20 per cent was out of pocket expenditure which makes India the most privatized health
sector in the world. The high proportion of out of pocket expenditure puts financial burden on
the poor leading to household spending a major share of their consumption expenditure on
health. The low level of government spending on health has resulted in low utilization of public
health care services. Due to unavailability and inefficiency of public health services, the poor
people have been forced to use the services of expensive and unregulated private sector. It
exposes the poor people to financial risk and sometimes even results in poverty. Some initiatives
have been taken in order to ensure proper utilization of the released funds. For this purpose the
centre government framed a new health policy in 2012 in which the allocations were linked to
the performance of the states as a result of which the utilization pattern of states have improved.
The empirical studies relating to health sector in India reveals that the public sector has
deteriorated over the period of time.
125
All the above mentioned problems have become more complicated with the
implementation of neo-liberal model of development since 80s. India is not an exception to all
these developments. Many studies have pointed out that disparities exist between rural and urban
areas as well as distribution of resources between the two important functions of health sector i.e.
preventive and curative. According to one study, the share of public health services is just one-
third of total expenditure and rest is spent on family welfare programs. Contradictions have also
been found between health policy documents and the actual practice.
Further, review of literature relating to India reveals that despite of policy changes at the
national and state level, the delivery of health services at the grass-root level is below average
which demands urgent attention of all the stake holders. Being on the concurrent list the health
services are left largely as the responsibility of the states for their execution. Among the Indian
states, Punjab is relatively a small state with high per capita income and was at the fore front of
India‟s green revolution and contributed to make India self-sufficient in food grains. It is among
the first few states in the country with 100 percent road connectivity in rural areas. The GDP of
Punjab was at Rs. 398170 crores in 2018-19 and the per capita income was Rs 153061 in the
same year. Punjab has also been considered number one state in the infrastructure index prepared
by several agencies at the national level.
In spite of all these positive developments the health outcomes in many dimensions i.e.
maternal and infant mortality rates have not reached to the goal set as the standards in
Millennium Development Goals and Sustainable Development Goals. Over the period of time,
Punjab which was ranked 1st in terms of Net State Domestic Product (NSDP) in 1980 has slipped
to 15th
rank in 2018-19. It has now become a debt-burdened state of India as government used to
borrow for paying off the salaries, pensions and providing subsidies. The debt of Punjab which
was estimated 1.95 lakh crores in 2017-18 has further increased to 2.12 lakh crores estimated in
budget 2018-19. This financial crisis has affected public spending in every sector specially the
health sector. As a result, the public health share out of the total budget expenditure has declined
from around 9 per cent in 1980-81 to 6.97 per cent during 1989-90. It has further declined to
4.35 per cent in 2004-05 which was just 3.81 per cent of the total annual budget of Punjab during
2016-17. Further, within the health sector share of medical institutions has also gone down.
Moreover, the rising cost of health services has become a major issue. Also, most of the
government hospitals in Punjab are overcrowded and private health sector services are becoming
out of reach of common public.
126
After the implementation of new economic policy in 1991, the public health services
could not remain unaffected for long. Punjab government prepared a proposal in 1995, to revamp
the health services with the financial assistance from World Bank. It was felt that the standard of
curative health services including diagnostic services in most of District Hospitals, Sub-
divisional Hospitals and Community Health Centers in Punjab was a source of inconvenience
and dissatisfaction to the general public. Hence, a process of reform was initiated with the help
of assistance from World Bank for the improvement of health services in terms of access as well
as quality by establishing Punjab Health Systems Corporation (PHSC) in 1996. The PHSC was
set-up by enacting “The Punjab Health Systems Corporation Act, 1996 (Punjab Act No. 6 of
1996)”. At the outset this ambitious project‟s start-up was delayed due to continuing debate
around the PHSC and constraint in the flow of funds. Finally, PHSC was established as a non-
commercial statutory Corporation without a revenue stream, and it was originally funded by
loans and grants from the World Bank and the state government. It was set up with the financial
assistance (US$106.10 million) from World Bank, with an objective to upgrade health services at
secondary level. Specifically the main objectives of PHSC were as follows:
(a) To improve efficiency in the allocation and use of health resources in the Punjab State
through policy and institutional development; and
(b) To improve the performance of the health care system in the State through improvements in
the quality, effectiveness and coverage of health services at the first referral level and selective
coverage at the primary level, so as to improve the health status of the people, especially the
poor, by reducing mortality, morbidity and disability.
In order to revamp the secondary level health care services PHSC was supposed to help in:
(a) Adding and renovating hospital building at the block, sub-divisional and district
headquarters;
(b) Supplementing accommodation for essential staff;
(c) Making provision of more ambulances and better machinery and equipment;
(d) Increasing body strength at some places;
(e) Additional hospital linen and accessories;
(f) Maintaining funds for building, vehicles, machinery and equipment; and,
(g) Cleanliness, repair and up-keep of all buildings.
Initially, the Corporation took over 166 Institutions, which includes district hospitals,
sub-divisional hospitals and community health centres. 86 Medical Institutions were situated in
127
rural areas and 80 were in urban areas. Two training institutes viz. State Institute of Health and
Family Welfare, Mohali and State Institute of Nursing and Paramedical Sciences, Badal, District
Muktsar have also been constructed and were brought under PHSC institutions. Out of the total
allocation of Rs.450 crores for PHSC, the outlay for procurement under various components was
in the following order : Rs.124.64 crores for major/minor other equipments; Rs.83.24 crores for
hospital furniture and other supplies; medicines and lab supplies Rs.22.45 crores, MIS/IEC
Material Rs.9.85 crore and vehicles Rs.9.10 crores. Out of the above plan out lay procurement of
worth Rs.118.28 crores has been done by PHSC which comprise equipment valuing Rs.63.53
crores, Rs.17.96 cr. on drugs, Rs.11.04 cr. on hospital furniture, Rs.7.65 cr. on supplies, Rs.8.20
cr. on vehicles, Rs.9.90 cr. on MIS/IEC. This project ended in the year 2002, and since then the
Government of Punjab is supervising it through PHSC. At present there are 176 health
institutions under PHSC, out of which 21 are district hospitals, 2 special hospitals, 34 sub –
divisional hospitals and 119 community health centres. Subsequent to the completion of World
Bank Project, PHSC also got the budget from State Govt. for procurement of medicine and
supplies for PHSC hospitals during the year 2004-05.
In the light of above discussion, the present study was planned to evaluate the working of
PHSC in the light of objectives to be achieved to enhance access of health services and the
improvement of quality of these services.
Objectives of the Study
The present study has been planned to focus on the following objectives:
1. To analyse the health scenario at the national level with special reference to National Health
Policy, 2017;
2. To examine the present status and problems of public health care services in Punjab;
3. To study the working of Punjab health systems Corporation (PHSC) in terms of provision of
access to quality health care services;
4. To examine the perception of user of health services provided by PHSC;
5. To identify the factors which influence the level of satisfaction among doctors working in
PHSC hospitals; and
6. To suggest suitable recommendations for the improvement of access and quality of public
health services in Punjab.
128
Universe of the study
The universe of the study includes all the District Hospitals, Sub-Divisional Hospitals
and Community Health Centers (CHC) under Punjab Health Systems Corporation (PHSC), all
the doctors working in these hospitals and the patients (both in-patients and out-patients) who got
treatment from the hospitals. Responses of hospital staff, doctors and patients have been taken in
three separate research schedules for achieving the objectives of the research.
The present study is based on both secondary and primary data. Primary data have been
collected with the help of three structured research schedules, namely, the doctors working in
Punjab Health Systems Corporation, second schedule was filled up from the officials working in
PHSC. The third research schedule was filled up from the users of the services provided by the
Punjab Health Systems Corporation. 30 hospitals were visited during the period September 2016
to October 2017.
Sampling Method
The data were collected from 30 hospitals across 6 districts of Punjab, namely, Amritsar,
Tarn Taran, Jalandhar, Hoshiarpur, Ludhiana and Bathinda. The due weightage has been given to
all the three geographical regions of Punjab, namely, Amritsar and Tarn Taran of Majha region,
Jalandhar and Hoshiarpur from Doaba region & Ludhiana and Bathinda from Malwa region. At
first stage, from each region, 2 districts have been selected. In each district, 5 hospitals have
been selected, namely, 1 District Hospital, 2 Sub-Divisional Hospitals and 2 Community Health
Centers. Thus, total ten hospitals were selected from each region. These districts also represent
substantial part of the international border area with Pakistan, namely Amritsar and Tarn Taran,
the interstate border area with Himachal Pradesh, namely Hoshiarpur and the central part of
Punjab, namely, Jalandhar, Ludhiana and Bathinda having border with Haryana. At the first
stage, the hospitals were selected by proportionate stratified random sampling technique. At the
second stage, the doctors and patients were selected by applying convenience random sampling
technique.
After selecting the hospitals at three levels, namely, District Hospital, the Sub Divisional
Hospital and the Community Health Centers, a representative sample of patients was taken at the
second level. In order to measure the user‟s perception about the service providence, a sample of
300 patients (from both In Patient Department and Out Patient Department) was taken. The
respondents were interviewed at the time of their exit from the hospitals. Further, 50 respondents
129
were selected from each district at three levels. A convenience random sampling has been
followed for the selection of respondents.
Further, a sample of 95 doctors was taken from these hospitals of Punjab to study their
perception in regard to the working of these hospitals and to measure the level of job satisfaction
among the doctors. After the collection of data the advance statistical tools like factor analysis
were applied for the analysis of data.
Findings of the study
General Health Scenario in India
The analysis of data relating to crude birth rate, crude death rate and infant mortality rate during
the post-reforms period reveals that India has achieved better targets. However, the problem of
Indian health sector is that out of the total health expenditure, 87.2 per cent was out of pocket
expenditure which makes it most privatized health sector in the world. The high proportion of
out of pocket expenditure puts financial burden on the poor, leading to households spending a
major share of their consumption expenditure on health. The low level of government spending
on health has resulted in low utilization of public care services. Due to unavailability and
inefficiency of the public health services, the poor people have been forced to use the services of
expensive and unregulated private sector. It exposes the poor people to financial risk and
sometimes even pushes them in poverty. According to NSSO report, the percentage of medical
conditions not treated due to unaffordability has increased from 15 to 28 in rural areas between
1986-87 to 2004. The report reveals that the major source of finance for both urban and rural
people to pay the health care costs is the household income. Unfortunately, one-fourth of the
rural patients are forced to borrow money for their treatment.
According to 71st round report (2015) of NSSO nearly 85.90 per cent of people in rural
areas and 82.00 per cent in urban areas were not covered by any of government funded,
employer insurance or the private insurance scheme.
Further, health being a state subject, the total government expenditure on health in India
comes from both centre and state governments. However, until 2013, the health spending by the
states as a percentage of total state expenditure has remained low and none of the states has been
able to meet the standards.
India has also shown consistent improvement in population stabilization, with a decrease
in decadal growth rate both in percentages and absolute terms. However, the persistent challenge
130
on population stabilization front is the declining sex ratio. India has child sex ratio (0-6 years) of
919 females per 1000 males and it is worse in urban areas with 905 females compared to rural
areas (923) as per the Situation Analyses report on health, 2017 of government of India.
Further, anemia in woman and rising occurrence of non-communicable diseases in India
has been highlighted as a major public health challenge. According to WHO estimates non-
communicable diseases (with mostly preventable risk factors) account for 60 per cent of all
deaths and significant morbidity in India. The situation analyses report noted that there has been
a steady rise in mental illness in the country. According to a recent survey one in every four
women and 10 per cent of men suffer from depression in India. The analysis of data highlight
that over 63 million persons are pushed to poverty every year due to health care costs mainly due
to rise in the out of pocket expenditure in India.
Global evidence on health spending shows that unless a country spends 5-6 per cent of its
GDP on health with government expenditure being a major part, basic health care needs are
seldom met. The government spending on health care in India was only 1.15 per cent of GDP as
per report. This is 3.8 per cent of total government expenditure accounts for 28.6 per cent of total
health spending. This translates in absolute terms to just Rs. 1042 per capita at current market
prices. The union government share of this is only Rs. 365 per capita (0.40 per cent og GDP)
while state government share translates to about Rs. 677 per capita (0.75 per cent of GDP) at
base line scenario.
Perhaps the single most important policy pronouncement of the NHP 2002 articulated in
the 10th
, 11th
and 12th
Five year plans and in NRHM framework, was the decision to increase
public health expenditure to 2 per cent to 3 per cent of the GDP. As a result, public health
expenditure rose briskly in the first few years of NRHM. But at the peak of its performance it
started stagnating at about 1.04 per cent of the GDP.
Growth of Health Sector Infrastructure
As per the latest statistics relating to rural health sector, there were 1,58,417 sub-centers
(SCs), 25743 primary health centers (PHCs) and 5624 community health centers (CHCs)
functioning in the country as on March, 2018.
The analysis of data reveals that number of Sub Centres (SCs) had been increased by 12391
during the period 2005-2018 from 1,46,026 in 2005 to 1,58,417 by March 2018. However,
the share of different states in this growth is not uniform. The contribution of NRHM which
131
was launched in 2005 as a flagship programme is visible to this growth. The percentage of
sub-centers functioning in government buildings had increased from 49.7 per cent in 2005 to
72.2 per cent in 2018.
Number of PHCs has increased by 2507 during 2005 to 2018, from 23236 to 27413.
However, mix trend is observed in different states. The analysis of data further reveals that
percentage of PHCs functioning in government buildings has increased significantly from 28
per cent in 2005 to 92.9 per cent in 2018.
The number of CHCs has increased by 2278 during 2005-2018. However, this increase is
confined to selective states. The percentage of CHCs functioning in government buildings
has increased from 91.6 per cent in 2005 to 99.2 per cent in 2018 over the period of 13 years
of post NRHM programme.
The total number of First Referral Unit (FRU) was only 33,369 as on 31st March, 2018 in
entire rural India.
The manpower position in the rural health care system still has not improved much. An
overall shortfall in the posts of HW(F)/ ANM at SC and PHC was 5.9 per cent of the total
requirement as per Indian Public Health Standards (IPHS) norms. However, the shortfall in
case of allopathic doctors in PHCs was 14.3 per cent of the total existing requirement for
existing infrastructure which affect the delivery of quality services in rural India.
Further, it has been noticed that number of specialist doctors at CHCs has declined from 4156 in
2017 to 4074 in 2018, which is a serious concern for the policy makers. The latest data on
manpower in rural public health sector reveals that there is a shortfall of 81.9 per cent specialists
at CHCs during the year 2018 in comparison with the IPHS norms.
Public Health Care in Punjab
Public health sector of Punjab is also facing all those problems which have been highlighted at
the national level in the situation analyses report on health sector published in 2017. The
financial crisis in Punjab has affected the Public health system. The analysis of data reveals that
public health expenditure in Punjab (as a percentage of total budget expenditure) has
continuously declined over the last three and half decades from nearly 10 per cent in 1980-81 to
6.97 per cent in 1989-90 which further declined to 4.30 per cent in 2004-05 and 3.81 per cent of
total annual budget in 2016-17. The low government health expenditure at the state levels has led
to the deterioration of the health services over the period of time despite of the introduction of
132
new policies to improve the public health system of Punjab. The public health sector is facing the
problem of poor infrastructure and shortage of manpower (both doctors and supporting staff).
Moreover, the state government like the central government has not given due importance to the
preventive health care measures to check the incidence of non-communicable disease like
diabetes, cardiovascular diseases and cancers which has put a serious challenge to health sector
in Punjab.
The absence of regulatory system for the private health players is another serious
challenge for the health sector of Punjab. The deficiency of modern equipments, the shortage of
specialist doctors and supporting staff has impacted the access to quality health services provided
by the public health sector at all levels i.e. primary, secondary and tertiary. The poor quality of
services in public health sector has forced the large majority of population to avail private health
services. The high cost private health services have increased the cost of health services many
fold which is pushing the middle and poor section towards the poverty and sometimes to commit
suicide due to the increase in out of pocket expenditure on health. The empirical studies
conducted in Punjab support fully the deterioration of public health system in Punjab.
The reforms introduced after 1991, namely, the formation of Punjab Health System
Corporation (PHSC), Public-Private partnership, the introduction of user charges from the
patients and decentralization of the rural health services could not contribute much to improve
the access and quality of health services in Punjab. Some researchers have pointed out that these
new experiments by the government have further weakened the public health system in Punjab in
general and rural health system in particular. The fragmentation of the meager funds allocated to
the public health system has further harmed the public system in Punjab.
The problem of corruption, poor management, political interference and favoritism
continued in PHSC as it is being controlled by the same officials who were managing the
previous system. Contrary to the objective of increasing health financing, the government
allocation to secondary health services declined from 25 per cent of total health expenditure in
1994 to 19 per cent in 2003. It is interesting to note that the Directorate of Public Enterprises and
Disinvestment, Punjab in their policy for disinvestment (2002) recommended the winding-up of
Punjab Health System Corporation due to its failure to improve the health system of Punjab since
its inception. On the other hand, the word bank II state development project implementation
report found it to be a success and suggested the continuation of the corporation. Finally, the
133
PHSC was converted from an autonomous body to a government entity under the Department of
Health and Family Welfare Punjab from 2002 onwards.
The analysis of data related to NRHM under which the state gets funding for health
sector with formation of NRHM in 2005, reveals that during the period 2005-06 to 2012-13, 47.6
per cent of the total funds released remained unspent in Punjab while this percentage for other
states like Kerala was 17.10 per cent, Assam 7.10 per cent and Rajasthan only 4.70 per cent. It
shows the failure of Punjab government to utilize the funds received under the NRHM.
The analysis of data relating to physical infrastructure and manpower to deliver the health
services in Punjab is also not encouraging. In terms of total number of medical institutions, total
number of beds and total number of doctors, the situation improved from 1971 to 1991.
However, the Punjab witnessed a negative growth rate during the post-reforms period from
1991-2010 and onwards. This decline has impact on population served per institution and
availability of beds in Punjab during the post-reforms period. The recent data reveals that even
the population served per doctor has drastically increased to 9817 as on 31.12.2017 which was
much lower even during the post-reforms period. It may be the result of faulty recruitment policy
of the government adopted in the recent past as well as shortage of funding for the health sector.
These developments have resulted into the decline of in-patients in the public health system
during the post-reforms period in Punjab.
Further, the per capita expenditure on health has also increased which put extra burden on
the patients to spend more from their pocket. Moreover, Punjab is facing the serious problem of
increasing cancer patients and other non-communicable diseases due to change in life style and
poor standards of environment.
Status of Existing Infrastructure in PHSC in Punjab
The major findings of the study reveals that the PHSC committed to provide free consultation
to all irrespective of the income groups but later the user charges were introduced and
charged from all the patients except the holders of yellow card (below poverty line
population).
It has been found that the utilization of PHSC services at all levels has declined after the
imposition of user charges. The study further found that the user charges have been further
increased over the period of time.
134
The study further found that the free medicines are also not available regularly. Many of the
tests which were conducted at the different levels of PHSC are being denied to the patients
which was introduced after the formation of PHSC.
The provision of ambulance services was also made available by the PHSC at all the three
levels which is also not working properly as most of the ambulance running in PHSC
hospitals are more than ten years old and are ill-equipped and are not capable enough to deal
with emergencies. Most of the times these ambulances are used for other miscellaneous
works like transportation of the medicines from the warehouse to the hospitals. Maximum
burden of transporting patients is being carried out by centrally NRHM funded 108
ambulances, which is free for few marked services while other patients are charged Rs. 10
per kilometer.
The field visits to the PHSC run hospitals has revealed that the infrastructure of these
hospitals is not in good condition.
Further, the study found that a difference between the sanctioned and functional beds under
the PHSC in Punjab was found on the basis of the information recorded through the field
visits and the information provided under the RTI. This difference was observed in 13
hospitals out of 30 in terms of number of functional beds and number of sanctioned beds.
Moreover, the condition of the beds and the mattresses at some of the hospitals was found to
be of very poor quality.
Further, the study found that a large number of sanctioned posts of doctors were found vacant
as per the information collected from selected hospitals. It was found that the percentage of
the vacant sanctioned posts was 21.54 per cent in case of specialist doctors while the same
was 45.90 per cent in case of the medical officers in the District hospitals. The status of Sub-
divisional hospitals has also not been found good. For example, 23.15 per cent positions of
the specialist doctors were vacant while the percentage of the vacant sanctioned posts in case
of medical officer was 50.72 per cent. Similarly, in case of the community health centres
71.11 per cent positions of the specialist doctors were found vacant at the time of the survey.
The study found that the road connectivity to all these hospitals was good at all the three
levels because Punjab has good road connectivity.
Similarly, the water and electricity supply was also found satisfactory at all the three levels.
However, some hospitals were not having backup generators to meet the emergencies.
135
The study found that all the hospitals were having ramps but the provision of lifts was only
available at the district level hospitals and not at the SDHs and CHCs.
The ambulance services in all these hospitals were made available through centrally
sponsored 108 ambulance service of NRHM. However, all the hospitals had at least one
ambulance provided by PHSC except district hospital Hoshiarpur. However, many hospitals
at SDH level were not having the ambulance services. Similarly, five sampled CHCs were
not having a single ambulance provided by PHSC while rest of the hospitals had one
ambulance each.
All the hospitals had at least one minor OT.
In case of DH only Ludhiana district had two air conditioners in emergency ward and
Bathinda had one AC in burn-ward. All the other hospitals even at district level were found
without the provision of ACs. The study further found that in case of Sub-divisional hospitals
only 4 hospitals out of 12 had the provision of AC rooms/ wards whereas 7 hospitals had
only the provision of air-coolers in their wards.
In case of the laundry services, majority of the hospitals had outsourced this service.
The other major problem in all the PHSC run hospitals is the lack of proper security
arrangements for the doctors as well as for the patients.
Lighting system as well as the proper sign-board system was also missing.
The study found the average level of cleanliness in majority of the hospitals and this problem
becomes more serious as we move from district level to CHCs. The major reason of poor
cleanliness is the lack of proper staff to meet this requirement.
The majority of the hospitals were maintaining the availability of functional beds in their
hospitals as per the sanctioned strength, however, this problem was more serious in case of
the CHCs in which nine out of the twelve hospitals were found to have less functional beds
as compared to sanctioned.
Moreover, the study found that there is a declining trend among the patients to avail the
provision of in-patients in most of the PHSC run hospitals. It has been found during the
survey that the CHCs are performing the role of a referral hospital rather than providing all
kind of services to the patients at their doorsteps which lead to the higher cost of health
services in rural Punjab.
136
None of the district hospitals were found to have the provision of MRI scanning while only
two out of six hospitals were having CT scanning. Of course all the hospitals were found to
have X-ray and ultrasound facilities. At the same time, all the SDHs were without the
provision of MRI and CT scanning while only nine hospitals were found to have ultrasound
scanning services even at the sub-divisional level whereas X-ray facility was available in all
the hospitals. In case of CHCs, they have the provision of X-ray only. Only one CHC was
found to have ultrasound scanning service. So, the lack of these modern diagnostic facilities
reflects the poor quality of health facilities in the PHSC run hospitals even in the modern
times when these facilities are very important for the doctors to show their competency. It is
unfortunate that the highly qualified doctors are blamed for the poor health services in Punjab
while they are not equipped with the modern equipments to serve their patients.
Another important finding of the study is that only two district hospitals were having
ventilator support system and four had the provision of Dialysis services. This situation was
worse in case of SDHs in which only one hospital had the provision of dialysis services at the
time of survey. None of the CHCs were found to have ventilator support system and dialysis
services. This is again a serious issue as the rural people are living at the mercy of almighty if
they face any emergency and need an artificial support system for the survival of the system.
The only satisfactory situation in case of the availability of mortuaries and post-mortem
services in all the PHSC run hospitals.
Users’ Perception towards Delivery of Health Services by PHSC
The study found that on an average, services were utilized more by females as compared to
males in the sampled hospitals. The higher share of female patients may be due to the reason
that females are more prone to sickness as compare to male members.
The study further found that the more than 50 per cent patients were in the age group 16-45
years at all the three levels of hospitals.
The level of education among the respondents reveals that more than 50 per cent of the
respondents were either illiterate or have education up to primary level.
The study also found that the more than 60 per cent of the patients fall in the category of low
income group i.e. having income between Rs. 2001-10000 per month. So, the analysis of data
further found that the share of the low income group patient was as high as 80 per cent in
137
case of the District Hospitals. It implies that higher income group is not availing services
provided by PHSC in Punjab.
The occupational distribution of respondents reveals that large majority of respondents come
from the labour class or the small and marginal farmers.
The distribution of respondents on rural-urban basis reveals that as most of the CHCs were in
rural areas therefore, 88.50 per cent of the respondents belong to rural areas followed by
70.20 per cent in SDHs and 58.30 per cent in District Hospitals. So, it implies that the rural
people avail higher share of services provided by the PHSC.
The distribution of respondents on the basis of land holding reveals that about 64.40 per cent
of the respondents were landless. And only 9.1 per cent have land more than 5 acres.
The caste-wise distribution of respondents reveals that the share of general class was 36 per
cent, SC/ST was 45.50 per cent, OBC have a share of 14.20 per cent and others have 4.30 per
cent share.
The analysis of data reveals that the majority of the respondents mentioned inexpensive
treatment and availability of skilled doctors as the main reasons for selecting the PHSC
hospitals.
The distribution of patients on the basis of in and out patients reveals that in case of district
hospitals and CHCs the OPD had higher percentage as compared to IPD patients. However,
in case of SDHs the share of IPD was higher among the selected respondents.
The analysis of data in regard to the period of stay of in-patients at different levels reveals
that majority of the patients stay for less than five days in these hospitals for their treatment.
The distribution on the basis of nature of treatment of the respondents reveals that the share
of non-surgery patients was 63.40 per cent while the share of patients coming for surgical
procedure was 36.60 per cent.
The distribution of the patients on the basis of timings to visit hospital reveals that large
majority of the patient visit hospital from 8AM to 2PM. However, the distribution on the
basis of waiting period to get consultation of the doctors was found quite satisfactory.
The responses of the OPD patients in regard to the quality of services in the hospitals reveals
that more than 50 per cent of the patients rated the various services as of average quality.
However, the overall score of average quality services was found more than 70 per cent in all
type of hospitals.
138
Similarly, the perception of IPD patients in regard to the quality of services in PHSC
hospitals reveals that more than 50 per cent of the patients rated their experience as of
average quality.
The rating of patients in regard to the behaviour of service providers reveals that 85 per cent
of the patients rated the behaviour of doctors as good while 78 per cent of the patients rated
the behaviour of nurses as good and 75 per cent of the patients rated the behaviour of the
supporting staff as good. On the other hand, the awareness of the patients in regard to the
availability of information about rules and regulations, about diseases and treatment and
about lab test was found very low in regard to all type of hospitals.
The experience of the patients in regard to availability of medicines reveals that the patients
were not satisfied and it was found that more than 70 per cent of the patients were forced to
buy medicines from the market. So, this finding further supports the general perception that
the large majority of the patients pay from their pocket to get their treatment if they fell sick.
Among the important suggestions, the patients have ranked the availability of all medicines
in the hospitals as rank 1 followed by the availability of diagnostic facilities as well as the
provision of free medicines from the hospitals.
The level of satisfaction among the users of the hospital services reveals that more than 50
per cent of the respondents have shown their satisfaction with the provision of services made
available in these hospitals.
Doctors’ Perception and Level of Satisfaction in PHSC Hospitals
The demographic profile of the doctors shows that majority of the doctors working in these
hospitals were male. The large majority of the doctors were below the age of 50 years.
The share of the MBBS doctors was 32.60 per cent followed by BDS 8.40 per cent, MD
29.50 per cent, MS 27.20 per cent and others 2.10 per cent.
The analysis of the region of the doctors reveals that 63.20 per cent of the doctors come from
urban background whereas 36.80 per cent of the doctors belong to rural background. This
share is in contrast to the share of the patients in which large majority of the patients belongs
to the rural areas.
The findings of the factor analysis reveal that the major factors which emerge from the
analysis are relationship with the co-workers which got highest accumulative percentage of
17.43 per cent. The second factor is monetary benefits and career development which had the
139
share of 14.84 per cent. Workplace environment emerged as the third important factor which
has share of 14.68 per cent followed by relationship with seniors as fourth factor with 13.90
per cent. The workload emerged as the fifth factor with 10.02 per cent and level of autonomy
at the workplace as sixth factor with 9.28 per cent share.
The responses of the doctors in regard to their overall satisfaction on the basis of one
question reveal that the level of satisfaction among the MBBS doctors was on the lower side.
This may be due to the fact that the MBBS doctors are paid lower salaries as per the new
rules of the government under which the doctors are forced to work on basic pay for first
three years of their services as a result of which they have meager salaries even after paying
higher fees for the completion of their degrees.
Recommendations and Policy Implications
The study recommends that regulations are required to ensure quality and affordability of
drugs. At present, the regulatory mechanism at all level is not effective at both national and
state level. The Situation Analyses Report on Health Sector, 2017 has highlighted this aspect
which has been further taken care in New Health Policy, 2017, Government of India.
However, this aspect is still missing in the state of Punjab. No efforts have been made in
regard to the formulation of long run health policy.
The quantity and quality of infrastructure is not as per the International standards not even as
per IPHS norms in India which has reflection on the functioning of health sector in Punjab.
The number of hospitals, number of beds and number of doctors are not available as per the
norms at the national level. This is also a major problem which the hospitals are facing at
primary, secondary and tertiary level in Punjab. In spite of the reforms introduced in the
health sector of Punjab, the availability of quality health services in Public funding hospitals
is missing, particularly to the lower section of the society.
It has been pointed out by the researchers at national level and at state level that patients are
forced to avail health services from private sector which put extra financial burden on the
patients and pushes the poor families into poverty. The patients are forced to pay for the
private health services as well as the high cost medicines which contribute about 80 per cent
of the cost of patients care. It has been found that both branded drugs as well as the branded
generics are available at higher prices than the actual cost in the market. A major issue is that
generic drugs are not bio-equivalent to the branded drugs. The government should ensure the
140
quality and bio-availability of generic drugs at par with the branded to ensure quality at
affordable prices as has been pointed out by the former director general of the ICMR, Dr. R.
Kumar, recently. The National Pharmaceutical Pricing Authority of India (NPPA) has
reported that leading companies are selling the same drug in the same dosage under different
brand names and at widely different prices. The retail price is marked up steeply, varying
from 100 per cent to 5000 per cent. Cipla for instance sells the anti-allergic Cetrizine at Rs 30
under the Alerid brand and at Rs. 2.20 under the name Okacet for 10 tablets. Now the poor
patients can not differentiate which is branded and which is not branded drug due their
illiteracy and ignorance and are subjected to pay more to buy such medicines from the
market. Therefore, there is an urgent need to regulate the sale of drugs to provide relief to the
patients. It could be done easily if the government takes the responsibility to buy these
generic drugs in bulk and provide through hospitals run pharmacies. The Punjab government
has made such attempt to provide free medicines to the patients which was short living. At
present, the Delhi government has already made it a reality by developing Mohalla Clinics
and low price medicines through government pharmacies.
Another important issue is the shortage and non-availability of modern diagnostic facility in
the Public sector hospitals. The facility of ultra sound, which is a basic requirement, was not
available even at SDHs under the PHSC in Punjab. It has been reported by the doctors
working in the PHSC that it put question mark on their competency when they are compelled
to diagnose the patient without the help of modern aids or the patients are advised to get
these tests done from private sector which put extra cost on the poor patients as most of the
patients come from poor section of the society to avail health services from PHSC.
There is an urgent need to increase the manpower in the PHSC hospitals at all levels. The
shortage of doctors, particularly the specialists in the different fields is a major cause of low
access and poor quality of health services in the PHSC run health institutions. More than 50
per cent of the doctors‟ positions were lying vacant in the PHSC run health institutions. The
situation has reached to a level that honorable Punjab and Haryana High Court Chandigarh
has declared the right to health as a fundamental right before directing the Punjab
government to fill the vacancies in the District Hospital, Hoshiarpur recently (The Tribune,
30 January, 2020). It is pertinent to mention that high level panel set-up by the 15th
Finance
Commission, Government of India on reforms in the health sector, recently suggested
declaring the right to health as a fundamental right.
141
Furthermore, there is a need to strengthen the manpower in regard to supporting staff,
namely, nurses and pharmacists who play an important role for the delivery of health services
in the hospitals. The poor security arrangement is another important issue which has been
raised by the patients as well as doctors and staff at all levels.
The lack of cleanliness is another important issue which has been highlighted by the users.
Maintenance of cleanliness is the basic requirement in case of health services. However,
insufficient staff to handle the sanitation work is a major hurdle in addition to the non-
availability of material required for this purpose.
The study found that the infrastructure in these hospitals is not only inadequate rather is of
poor quality. The required instruments for diagnostic purpose are not available in these
hospitals though the creation of a high quality infrastructure was the major objective of
PHSC. At present, the most of the ambulances purchased by the PHSC are not operative
which forced the poor patients to avail expensive private transport service during
emergencies.
The government statistics reveal that the number of patients on account of non-
communicable diseases is increasing at alarming rate particularly, the diabetes, cancer, heart
and drug addiction patients. Therefore, government must prepare itself to deal with the
situation. The government has made some efforts to provide financial support to cancer
patients, which is only meant for special category of patients. There is an urgent requirement
to increase financial assistance to the cancer and drug addicted patients in all segments of the
society and set-up special hospitals to deal with the situation.
The study further recommends for a comprehensive health policy by considering preventive
and promotive health care system for universal access to good quality health services without
leaving anyone at affordable price. The emphasis should be on increased access,
improvement in quality and lowering of cost of health care delivery.
The National Health Policy, 2017 has proposed more than 8 per cent of the state budget on
health by 2020. Therefore, the study recommends that Punjab government should insure
higher funding to strengthen the public health system in Punjab which has declined to 3.81
per cent of the total budget expenditure in 2016-17.
The study further proposed that government should create a single directorate of health
services and all the institutions providing health services should be merged for the judicious
142
use of infrastructure and limited manpower of the public health including PHSC run
institutions.
Further, government should revive the mobile health services in Punjab to cater the needs of
rural and border areas where health services are not available which could save the poor from
both expenditure on health as well as the high transport cost to carry the patients to distant
places.
The study also recommends that as the health is subject of the concurrent list under which
both centre and state provide finances for the public health services. The centre instead of
imposing its own policies on the state government should allocate finance to the respective
state governments so the state may plan its own health policy to strengthen the public health
system. The governments should focus to build up a comprehensive public health system
rather than running after the achievement of targets to avail the centre government funding
schemes.
Last but not the least, the public health sector should be given more autonomy to plan and
execute by engaging the health experts rather than bureaucrats. There should be strong
regulatory system to control both the public and private health institutions.
Moreover, the public should be made aware about the government schemes meant for the
poor sections of the society to save them from the clutches of the greedy private hospitals
which are pushing them into poverty.
i
Bibliography
Journals and Books
Ahuja, R., & De, I. (2004). Health insurance for the poor: Need to strengthen healthcare
provision. Economic and Political Weekly, 39(41), 4501-4503.
Ashtekar, S. (1999). Reforms and health care. Economic and Political Weekly, 34(41), 2908-
2911.
Athreya, V. B., & Rao, M. (2006). Education and health in the draft eleventh plan approach
paper. Social Scientist, 34(9), 21-33.
Bajpai, V. (2014). Implementation of the Janani Sishu Suraksha Karyakram in Uttar Pradesh:
Some observations and concerns. The Indian Journal of Social Work, 75(4), 573-594.
Bajpai, V. (2014). The challenges confronting public hospitals in India, their origins, and
possible solutions. Advances in Public Health, 1-27.
Baru, R. V. (2003). Privatisation of health services: A South Asian perspective. Economic
and Political Weekly, 38(42), 4433-4437.
Basu, A. M. (1990). Cultural influences on health care use: two regional groups in
India. Studies in Family Planning, 21(5), 275-286.
Bhat, R. (1993). The private/public mix in health care in India. Health Policy and
Planning, 8(1), 43-56.
Bhat, R. (1996). Regulation of the private health sector in India. The International Journal of
Health Planning and Management, 11(3), 253-274.
Bhat, R. (2000). Issues in health: Public-private partnership. Economic and Political Weekly,
35(52/53), 4706-4716.
Bhate-Deosthali, P., Khatri, R., & Wagle, S. (2011). Poor standards of care in small, private
hospitals in Maharashtra, India: implications for public-private partnerships for
maternity care. Reproductive Health Matters, 19(37), 32-41.
Duggal, R. (1997). Health care budgets in a changing political economy. Economic and
Political Weekly, 32(20/21), 1197-1200.
ii
Ellis, R. P., Alam, M., & Gupta, I. (2000). Health insurance in India: Prognosis and
prospectus. Economic and Political Weekly, 35(4), 207-217.
Filmer, D., Hammer, J. S., & Pritchett, L. H. (2000). Weak links in the chain: A diagnosis of
health policy in poor countries. The World Bank Research Observer, 15(2), 199-224.
Ghuman, B. S., & Mehta, A. (2009). Health care services in India: Problems and
prospects. International Conference on the Asian Social Protection in Comparative
Perspective, 7-9.
Ghuman, B.S. and Mehta, A. (2005). Health Care for the Poor in India with Special
Reference to Punjab State. Paper presented at the Workshop on Health for the Poor
in Asia, Beijing. Retrieved from www.napsipag.org.
Ghuman, S & Sidhu, A.S (2016), Status of Health Services in Punjab: A Comparative Study
of Government and Private Hospitals, Unpublished Doctoral Thesis, Guru Nanak Dev
University, Amritsar.
Gill, S. S., & Ghuman, R. S. (2000). Rural health: Proactive role for the state. Economic and
Political Weekly, 35(51), 4474-4477.
Gill, S. S., Singh, D. S., & Brar, J. S. (2010). Globalization and Indian State: Education,
Health, and Agricultural Extension Services in Punjab. Delhi: Aakash Books.
Gokhale, M. K., Rao, S. S., & Garole, V. R. (2002). Infant mortality in India: Use of maternal
and child health services in relation to literacy status. Journal of Health, Population
and Nutrition, 20(2), 138-147.
Gupta, M. D. (2005). Public Health in India: Dangerous neglect. Economic and Political
Weekly, 40(49), 5159-5165.
Hammer, J., Aiyar, Y., & Samji, S. (2007). Understanding government failure in public
health services. Economic and Political Weekly, 42(40), 4049-4057.
Jeffery, R. (1988). The Politics of Health in India. United States: University of California
Press.
Kethineni, V. (1991). Political economy of state intervention in health care. Economic and
Political Weekly, 26(42), 2427-2433.
iii
Kumar, C., & Prakash, R. (2011). Public-private dichotomy in utilization of health care
services in India. Consilience, 5(1), 25-52.
Lalneizo, D., & Reddy, S. (2010). Health status of children in North Eastern states of
India. Indian Anthropologist, 40(2), 37-52.
Latief, H. (2010). Health provision for the poor Islamic aid and the rise of charitable clinics
in Indonesia. South East Asia Research, 18(3), 503-553.
Nair, P. R. G. (1974). Decline in birth rate in Kerala: An explanatory hypothesis about the
relationship between demographic variables, Health Service and Education. Economic
and Political Weekly, 9(6-7-8).
Nanda, A. R., & Ali, A. (2006). Health sector: Issues and challenges. India Social
Development Report, 18-32.
National Institute of Health and Family Welfare (2008). A study to review the health care
delivery system provided by punjab health systems corporation (PHSC), Punjab. New
Delhi.
Paul, S., Balakrishnan, S., Gopakumar, K., Sekhar, S., & Vivekananda, M. (2004). State of
India’s public services: Benchmarks for the states. Economic and Political Weekly,
39(9), 920-933.
Prinja, S., Gupta, A., Verma, R., Bahuguna, P., Kumar, D., Kaur, M., & Kumar, R. (2016).
Cost of delivering health care services in public sector primary and community health
centres in North India. PLOS ONE, 11(8), 1-15.
Priya, R., Sagar, A., Dasgupta, R., & Acharya, S. (2004). CMP on health: Making India
world class. Economic and Political Weekly, 39(27), 2971-2974.
Purohit, B. C., & Siddiqui, T. A. (1994). Utilisation of health services in India. Economic and
Political Weekly, 29(18), 1071-1080.
Qadeer, I. (2000). Health care systems in transition III. India, Part I. The Indian
experience. Journal of Public Health, 22(1), 25-32.
Radha, M. (2011). Problems and prospects of health care services in India. Asian Journal of
Research in Business Economics and Management, 1(3), 88-97.
iv
Ramana, G. N., Sastry, J. G., & Peters, D. (2002). Health transition in India: Issues and
challenges. The National Medical Journal of India, 15, 37-42.
Randhawa, G., & Sidhu, A. S. (2011). Status of public health care services during the process
of liberalization: A study of Punjab. Pravara Management Review (PMR), 10(2), 10-
15.
Rao, M. G., & Choudhury, M. (2008). Inter-State Equalisation of Health Expenditures in
Indian Union. National Institute of Public Finance and Policy. Retrieved from
https://www.nipfp.org.in/media/medialibrary/2013/04/wp_2012_100.pdf
Selvaraj, S., & Karan, A. K. (2009). Deepening health insecurity in India: Evidence from
national sample surveys since 1980s. Economic and Political Weekly, 44(40), 55-60.
Sengupta, A., & Nundy, S. (2005). The private health sector in India. BMJ, 331, 1157–1158.
Singh, A. C. (2012). High dependency on quacks–is there a gap in the public health care
delivery system? reflections from a district located in the Thar desert
(India). Consilience, 8(1), 128-143.
Singh, N. (2011). Public-Private Partnerships for Health Care in Punjab. CASI Working
Paper Series, 11-02, 61-70.
Singh, N. D. (2010). Rural healthcare and indebtedness in Punjab. Economic and Political
Weekly, 45(11), 22-25.
Singh, S., Kaur, P., & Rochwani, R. (2013). Patient satisfaction levels in a tertiary care
medical college hospital in Punjab, North India. Int J Res Dev Health, 1(4), 172-182.
Walsh, K. (1997). Public services and market mechanisms: Competition, contracting and the
new public management. England: Macmillan International Higher Education.
Walsh, K., Deakin, N., Smith, P., Spurgeon, P., & Thomas, N. (1997). Contracting for
change: contracts in health, social care, and other local government services. Oxford:
Oxford University Press.
Yesudian, C. A. K. (1999). Pattern of utilisation of health services: Policy
implications. Economic and Political Weekly, 34(5), 300-304.
v
Reports
American Association of Physicist in Medicine (2016) Report of task group: Application of
risk analysis method to radiation therapy quality management, 2016.
Government of India (2017). National Health Policy, Ministry of Health and Family Welfare.
-----. Situation Analyses: Backdrop to National Health Policy, Ministry of Health and Family
Welfare.
Government of India (2016). Economic Survey 2015-16-Volume I.
Government of India (2014) National Service Scheme 71st Round. Social Consumption:
Education and Health (January'2014 - June'2014)
Government of India (2008). Economic Survey 2002-03. New Delhi: Ministry of Finance.
-----. Rural Health Statistics, Ministry of Health and Family Welfare, Statistics Division.
Government of Punjab (2004). Human Development Report 2004.
Government of Punjab (1996). Punjab Health System Corporation Act 1996.
NCMH (2005). Report of the national commission on macroeconomics and health. New
Delhi: Ministry of Health and Family Welfare, Government of India.
UN Office of the High Commissioner for Human Rights (OHCHR) (2008), Fact Sheet No.
31. The Right to Health, 31, 1-48. Retrieved from
https://www.refworld.org/docid/48625a742.html
WDR (1993). World Development Report: Investing in Health. New York: Oxford University
Press.
WHO (2008). The world health report on primary health care: Now more than ever. Geneva:
WHO.
WHO (2010). The world health report on health systems financing: The path to universal
coverage. Geneva: WHO.
World Bank (2011). World Development Report, 2011.
World Bank (2013). World Development Report, 2013.
vi
News Articles
Bose, S. M. (2012, February 23). At the Cost of Health. The Tribune, p. 9.
Konan, P. (2006, November 24). Opinion: The healthcare tourism conundrum. The Hindu.
Kumar, R. (2019, December 30). Unfair trade practices plague pharma sector. The Tribune,
p. 9.
Malik, S. (2020, January 30). Right to health fundamental, fill vacant posts, HC directs state.
The Tribune, p. 3.
Sawhney, U. (2012, June 18). Punjab pays for misplaced priorities. The Tribune.
United Nations (2020, February 5). 1 in 10 Indians will develop Cancer during lifetime:
WHO. The Tribune.
Usha Rai, affordable healthcare for rural women, the Tribune, November23, 2010.
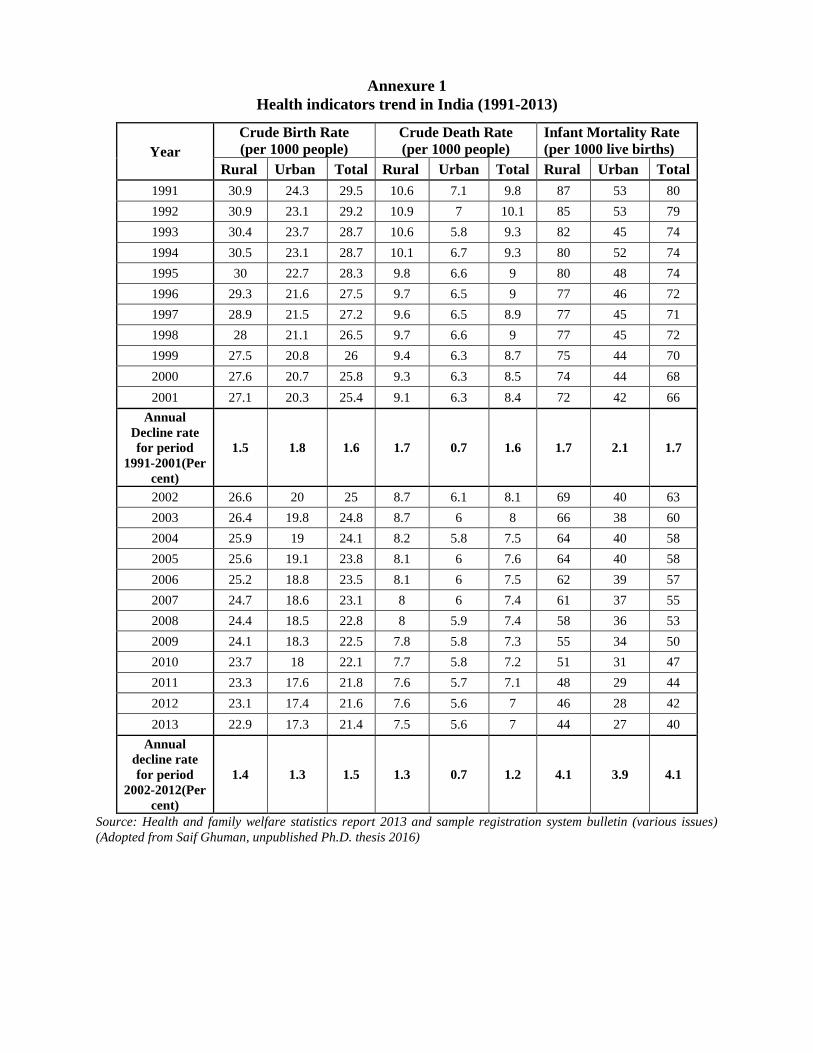
Annexure 1
Health indicators trend in India (1991-2013)
Year
Crude Birth Rate
(per 1000 people)
Crude Death Rate
(per 1000 people)
Infant Mortality Rate
(per 1000 live births)
Rural Urban Total Rural Urban Total Rural Urban Total
1991 30.9 24.3 29.5 10.6 7.1 9.8 87 53 80
1992 30.9 23.1 29.2 10.9 7 10.1 85 53 79
1993 30.4 23.7 28.7 10.6 5.8 9.3 82 45 74
1994 30.5 23.1 28.7 10.1 6.7 9.3 80 52 74
1995 30 22.7 28.3 9.8 6.6 9 80 48 74
1996 29.3 21.6 27.5 9.7 6.5 9 77 46 72
1997 28.9 21.5 27.2 9.6 6.5 8.9 77 45 71
1998 28 21.1 26.5 9.7 6.6 9 77 45 72
1999 27.5 20.8 26 9.4 6.3 8.7 75 44 70
2000 27.6 20.7 25.8 9.3 6.3 8.5 74 44 68
2001 27.1 20.3 25.4 9.1 6.3 8.4 72 42 66
Annual
Decline rate
for period
1991-2001(Per
cent)
1.5 1.8 1.6 1.7 0.7 1.6 1.7 2.1 1.7
2002 26.6 20 25 8.7 6.1 8.1 69 40 63
2003 26.4 19.8 24.8 8.7 6 8 66 38 60
2004 25.9 19 24.1 8.2 5.8 7.5 64 40 58
2005 25.6 19.1 23.8 8.1 6 7.6 64 40 58
2006 25.2 18.8 23.5 8.1 6 7.5 62 39 57
2007 24.7 18.6 23.1 8 6 7.4 61 37 55
2008 24.4 18.5 22.8 8 5.9 7.4 58 36 53
2009 24.1 18.3 22.5 7.8 5.8 7.3 55 34 50
2010 23.7 18 22.1 7.7 5.8 7.2 51 31 47
2011 23.3 17.6 21.8 7.6 5.7 7.1 48 29 44
2012 23.1 17.4 21.6 7.6 5.6 7 46 28 42
2013 22.9 17.3 21.4 7.5 5.6 7 44 27 40
Annual
decline rate
for period
2002-2012(Per
cent)
1.4 1.3 1.5 1.3 0.7 1.2 4.1 3.9 4.1
Source: Health and family welfare statistics report 2013 and sample registration system bulletin (various issues)
(Adopted from Saif Ghuman, unpublished Ph.D. thesis 2016)
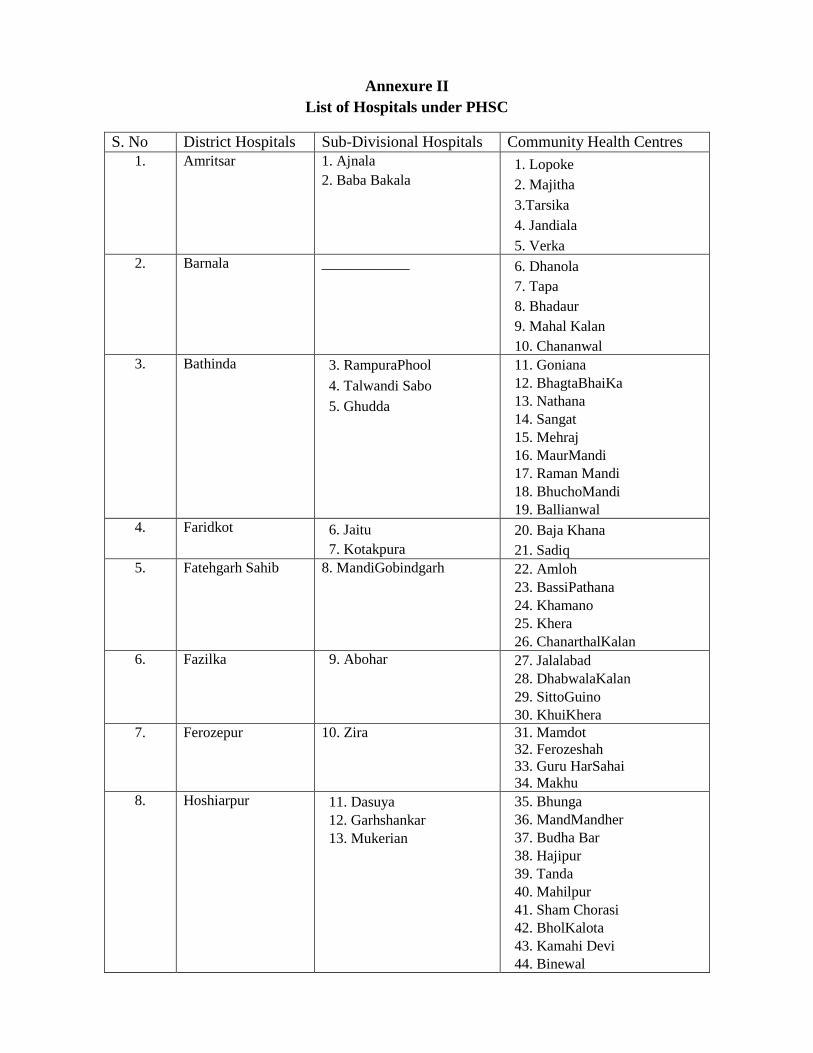
Annexure II
List of Hospitals under PHSC
S. No District Hospitals Sub-Divisional Hospitals Community Health Centres
1. Amritsar 1. Ajnala
2. Baba Bakala 1. Lopoke
2. Majitha
3.Tarsika
4. Jandiala
5. Verka
2. Barnala ____________ 6. Dhanola
7. Tapa
8. Bhadaur
9. Mahal Kalan
10. Chananwal
3. Bathinda 3. RampuraPhool
4. Talwandi Sabo
5. Ghudda
11. Goniana
12. BhagtaBhaiKa
13. Nathana
14. Sangat
15. Mehraj
16. MaurMandi
17. Raman Mandi
18. BhuchoMandi
19. Ballianwal
4. Faridkot 6. Jaitu
7. Kotakpura
20. Baja Khana
21. Sadiq
5. Fatehgarh Sahib 8. MandiGobindgarh 22. Amloh
23. BassiPathana
24. Khamano
25. Khera
26. ChanarthalKalan
6. Fazilka 9. Abohar 27. Jalalabad
28. DhabwalaKalan
29. SittoGuino
30. KhuiKhera
7. Ferozepur 10. Zira 31. Mamdot
32. Ferozeshah
33. Guru HarSahai
34. Makhu
8. Hoshiarpur 11. Dasuya
12. Garhshankar
13. Mukerian
35. Bhunga
36. MandMandher
37. Budha Bar
38. Hajipur
39. Tanda
40. Mahilpur
41. Sham Chorasi
42. BholKalota
43. Kamahi Devi
44. Binewal
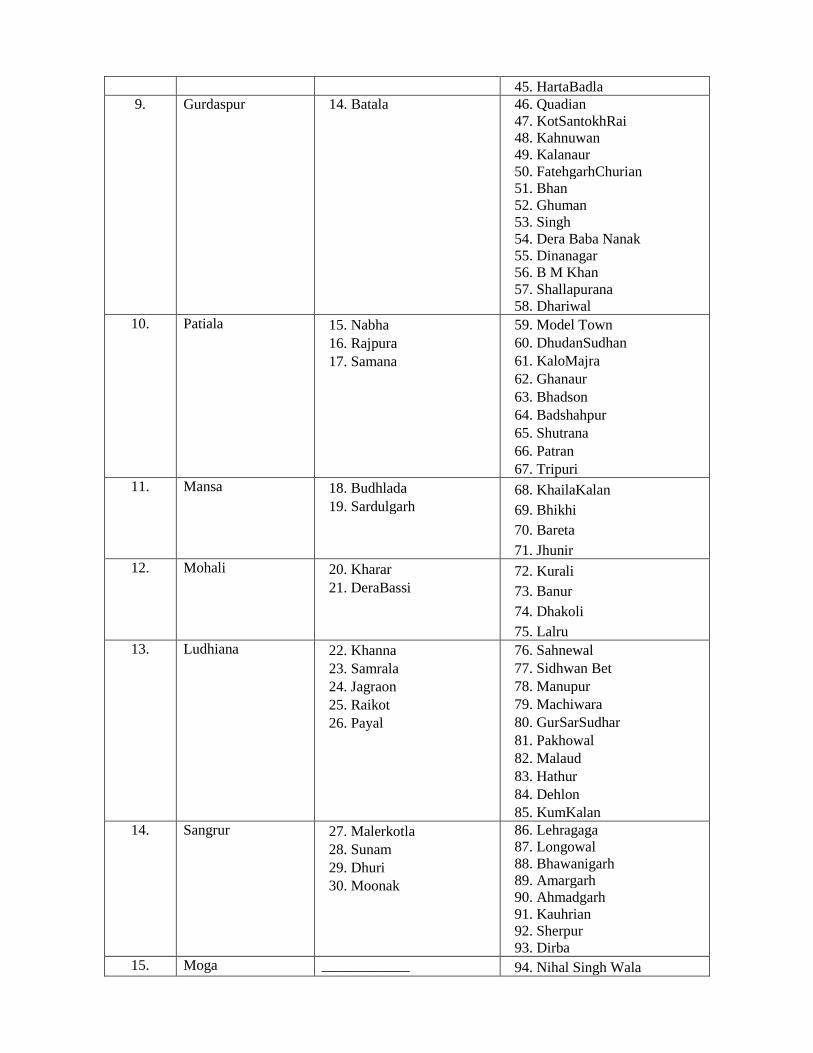
45. HartaBadla
9. Gurdaspur 14. Batala 46. Quadian
47. KotSantokhRai
48. Kahnuwan
49. Kalanaur
50. FatehgarhChurian
51. Bhan
52. Ghuman
53. Singh
54. Dera Baba Nanak
55. Dinanagar
56. B M Khan
57. Shallapurana
58. Dhariwal
10. Patiala 15. Nabha
16. Rajpura
17. Samana
59. Model Town
60. DhudanSudhan
61. KaloMajra
62. Ghanaur
63. Bhadson
64. Badshahpur
65. Shutrana
66. Patran
67. Tripuri
11. Mansa 18. Budhlada
19. Sardulgarh
68. KhailaKalan
69. Bhikhi
70. Bareta
71. Jhunir
12. Mohali 20. Kharar
21. DeraBassi
72. Kurali
73. Banur
74. Dhakoli
75. Lalru
13. Ludhiana 22. Khanna
23. Samrala
24. Jagraon
25. Raikot
26. Payal
76. Sahnewal
77. Sidhwan Bet
78. Manupur
79. Machiwara
80. GurSarSudhar
81. Pakhowal
82. Malaud
83. Hathur
84. Dehlon
85. KumKalan
14. Sangrur 27. Malerkotla
28. Sunam
29. Dhuri
30. Moonak
86. Lehragaga
87. Longowal
88. Bhawanigarh
89. Amargarh
90. Ahmadgarh
91. Kauhrian
92. Sherpur
93. Dirba
15. Moga ____________ 94. Nihal Singh Wala
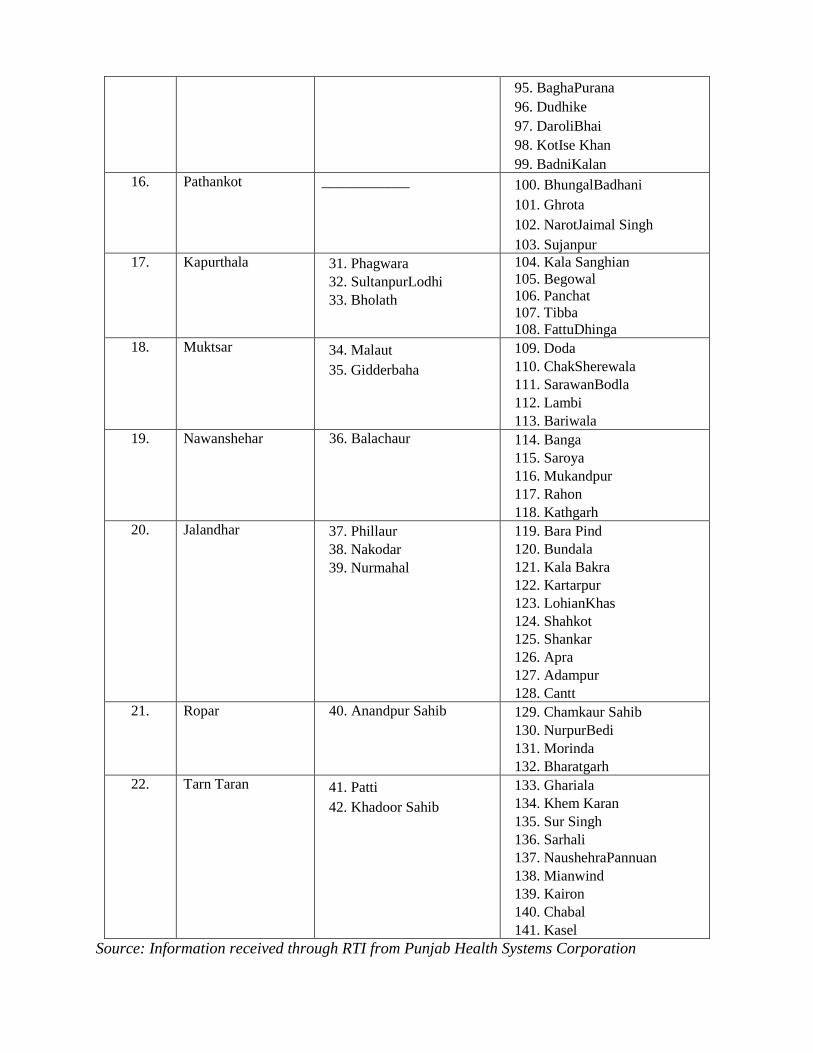
95. BaghaPurana
96. Dudhike
97. DaroliBhai
98. KotIse Khan
99. BadniKalan
16. Pathankot ____________ 100. BhungalBadhani
101. Ghrota
102. NarotJaimal Singh
103. Sujanpur
17. Kapurthala 31. Phagwara
32. SultanpurLodhi
33. Bholath
104. Kala Sanghian
105. Begowal
106. Panchat
107. Tibba
108. FattuDhinga
18. Muktsar 34. Malaut
35. Gidderbaha
109. Doda
110. ChakSherewala
111. SarawanBodla
112. Lambi
113. Bariwala
19. Nawanshehar 36. Balachaur 114. Banga
115. Saroya
116. Mukandpur
117. Rahon
118. Kathgarh
20. Jalandhar 37. Phillaur
38. Nakodar
39. Nurmahal
119. Bara Pind
120. Bundala
121. Kala Bakra
122. Kartarpur
123. LohianKhas
124. Shahkot
125. Shankar
126. Apra
127. Adampur
128. Cantt
21. Ropar 40. Anandpur Sahib 129. Chamkaur Sahib
130. NurpurBedi
131. Morinda
132. Bharatgarh
22. Tarn Taran 41. Patti
42. Khadoor Sahib
133. Ghariala
134. Khem Karan
135. Sur Singh
136. Sarhali
137. NaushehraPannuan
138. Mianwind
139. Kairon
140. Chabal
141. Kasel
Source: Information received through RTI from Punjab Health Systems Corporation
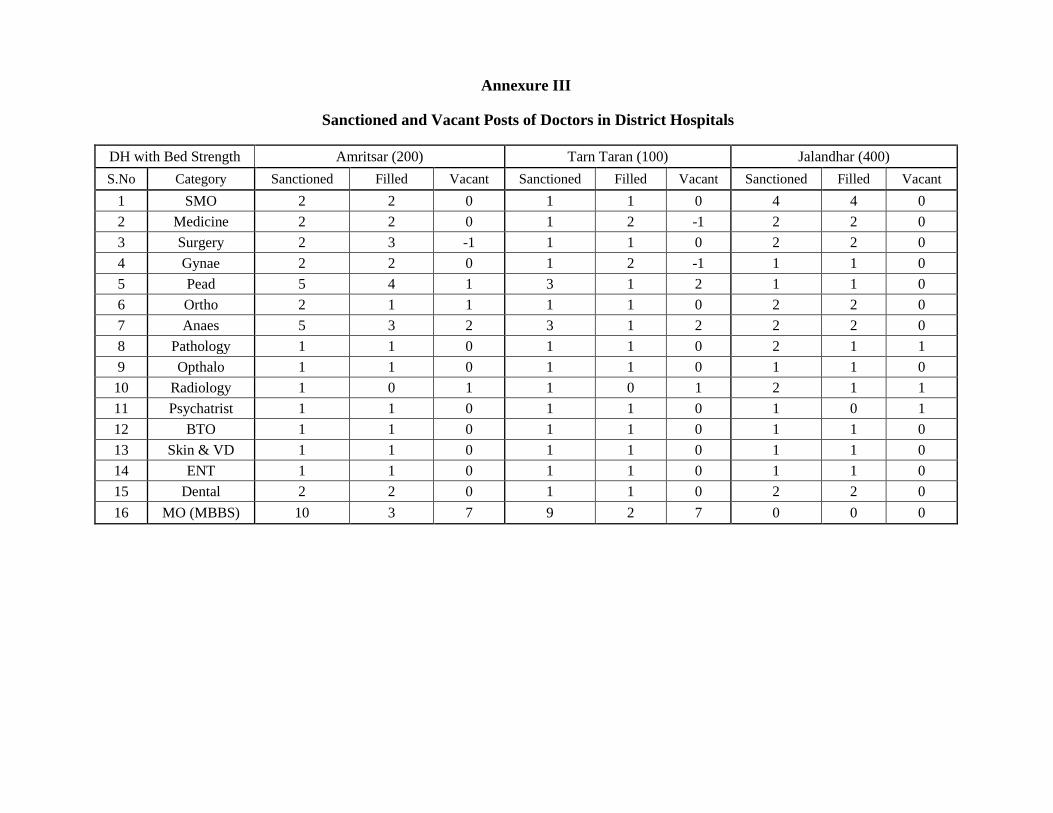
Annexure III
Sanctioned and Vacant Posts of Doctors in District Hospitals
DH with Bed Strength Amritsar (200) Tarn Taran (100) Jalandhar (400)
S.No Category Sanctioned Filled Vacant Sanctioned Filled Vacant Sanctioned Filled Vacant
1 SMO 2 2 0 1 1 0 4 4 0
2 Medicine 2 2 0 1 2 -1 2 2 0
3 Surgery 2 3 -1 1 1 0 2 2 0
4 Gynae 2 2 0 1 2 -1 1 1 0
5 Pead 5 4 1 3 1 2 1 1 0
6 Ortho 2 1 1 1 1 0 2 2 0
7 Anaes 5 3 2 3 1 2 2 2 0
8 Pathology 1 1 0 1 1 0 2 1 1
9 Opthalo 1 1 0 1 1 0 1 1 0
10 Radiology 1 0 1 1 0 1 2 1 1
11 Psychatrist 1 1 0 1 1 0 1 0 1
12 BTO 1 1 0 1 1 0 1 1 0
13 Skin & VD 1 1 0 1 1 0 1 1 0
14 ENT 1 1 0 1 1 0 1 1 0
15 Dental 2 2 0 1 1 0 2 2 0
16 MO (MBBS) 10 3 7 9 2 7 0 0 0
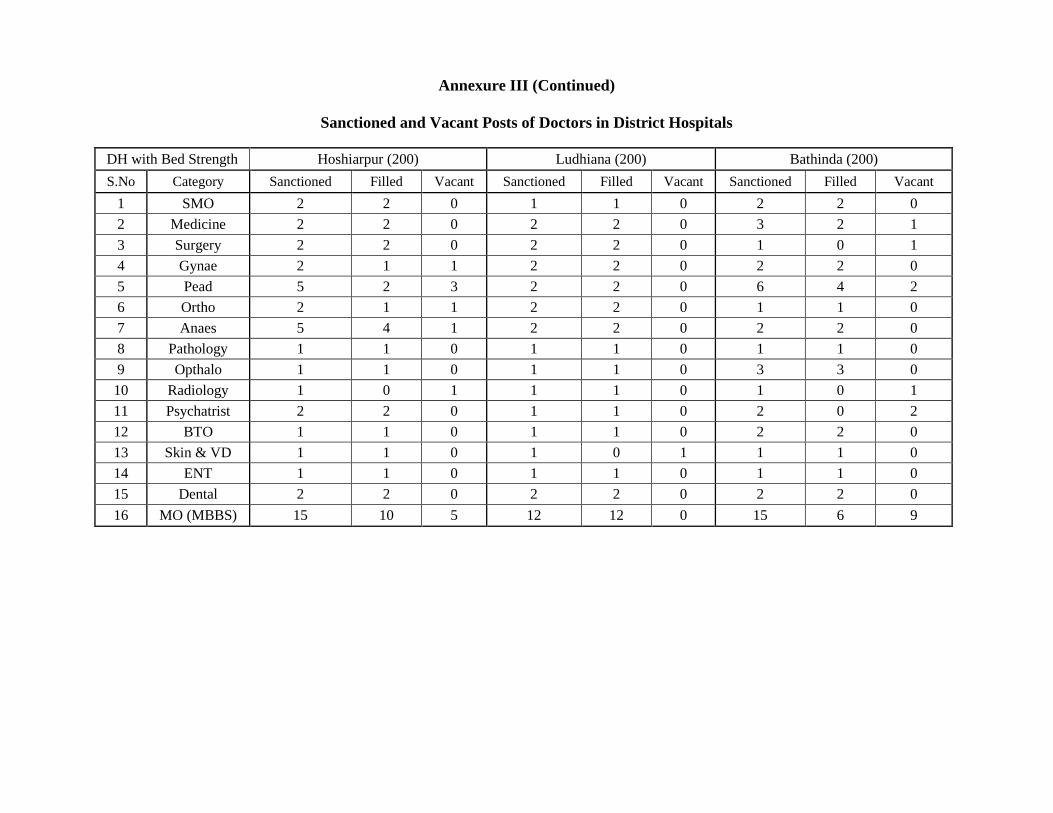
Annexure III (Continued)
Sanctioned and Vacant Posts of Doctors in District Hospitals
DH with Bed Strength Hoshiarpur (200) Ludhiana (200) Bathinda (200)
S.No Category Sanctioned Filled Vacant Sanctioned Filled Vacant Sanctioned Filled Vacant
1 SMO 2 2 0 1 1 0 2 2 0
2 Medicine 2 2 0 2 2 0 3 2 1
3 Surgery 2 2 0 2 2 0 1 0 1
4 Gynae 2 1 1 2 2 0 2 2 0
5 Pead 5 2 3 2 2 0 6 4 2
6 Ortho 2 1 1 2 2 0 1 1 0
7 Anaes 5 4 1 2 2 0 2 2 0
8 Pathology 1 1 0 1 1 0 1 1 0
9 Opthalo 1 1 0 1 1 0 3 3 0
10 Radiology 1 0 1 1 1 0 1 0 1
11 Psychatrist 2 2 0 1 1 0 2 0 2
12 BTO 1 1 0 1 1 0 2 2 0
13 Skin & VD 1 1 0 1 0 1 1 1 0
14 ENT 1 1 0 1 1 0 1 1 0
15 Dental 2 2 0 2 2 0 2 2 0
16 MO (MBBS) 15 10 5 12 12 0 15 6 9
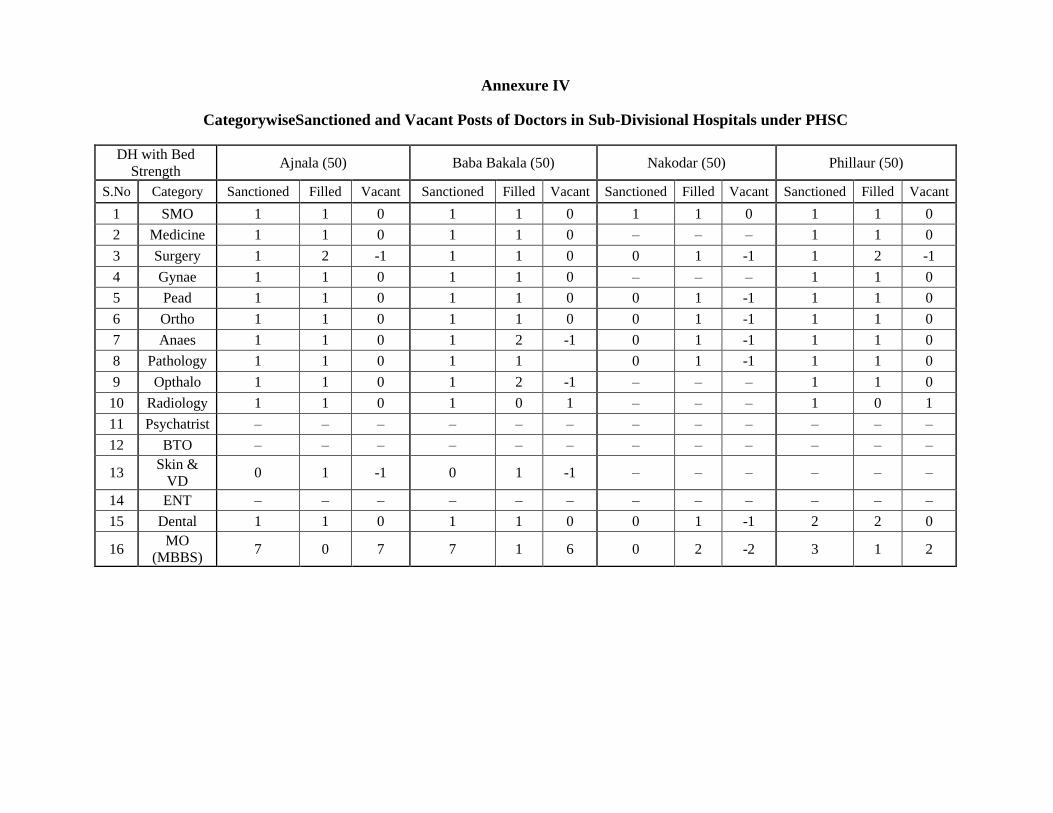
Annexure IV
CategorywiseSanctioned and Vacant Posts of Doctors in Sub-Divisional Hospitals under PHSC
DH with Bed
Strength Ajnala (50) Baba Bakala (50) Nakodar (50) Phillaur (50)
S.No Category Sanctioned Filled Vacant Sanctioned Filled Vacant Sanctioned Filled Vacant Sanctioned Filled Vacant
1 SMO 1 1 0 1 1 0 1 1 0 1 1 0
2 Medicine 1 1 0 1 1 0 – – – 1 1 0
3 Surgery 1 2 -1 1 1 0 0 1 -1 1 2 -1
4 Gynae 1 1 0 1 1 0 – – – 1 1 0
5 Pead 1 1 0 1 1 0 0 1 -1 1 1 0
6 Ortho 1 1 0 1 1 0 0 1 -1 1 1 0
7 Anaes 1 1 0 1 2 -1 0 1 -1 1 1 0
8 Pathology 1 1 0 1 1 0 1 -1 1 1 0
9 Opthalo 1 1 0 1 2 -1 – – – 1 1 0
10 Radiology 1 1 0 1 0 1 – – – 1 0 1
11 Psychatrist – – – – – – – – – – – –
12 BTO – – – – – – – – – – – –
13 Skin &
VD 0 1 -1 0 1 -1 – – – – – –
14 ENT – – – – – – – – – – – –
15 Dental 1 1 0 1 1 0 0 1 -1 2 2 0
16 MO
(MBBS) 7 0 7 7 1 6 0 2 -2 3 1 2
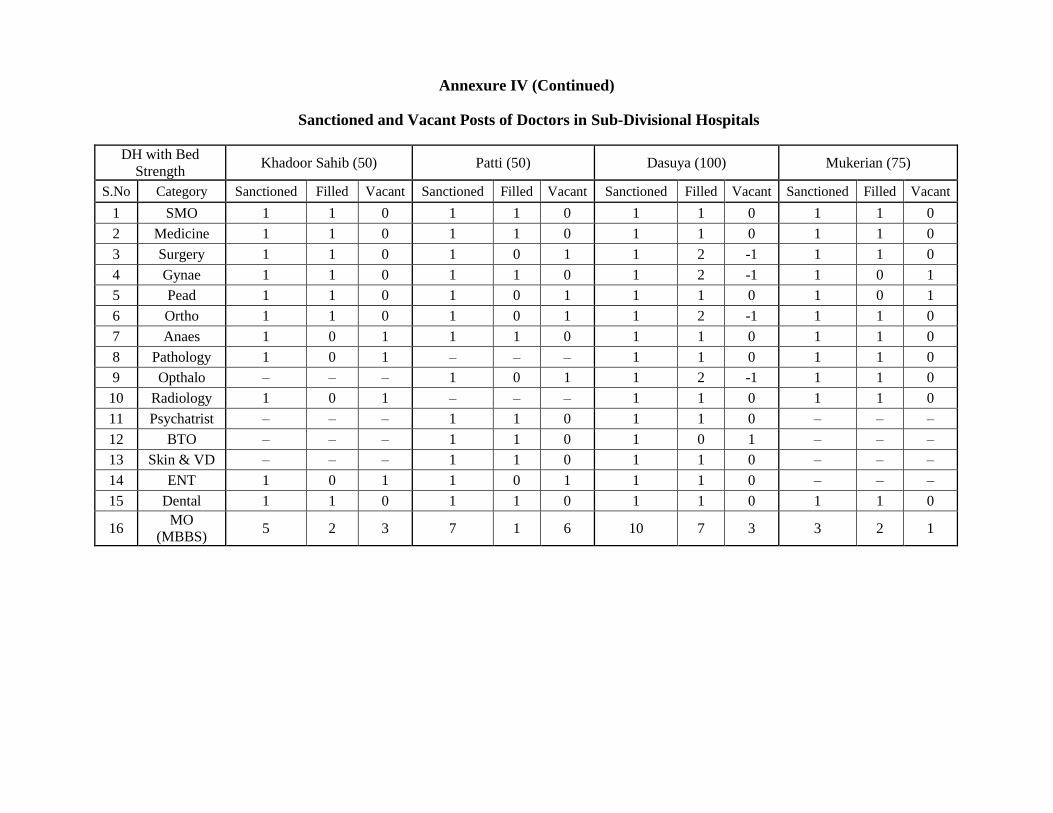
Annexure IV (Continued)
Sanctioned and Vacant Posts of Doctors in Sub-Divisional Hospitals
DH with Bed
Strength Khadoor Sahib (50) Patti (50) Dasuya (100) Mukerian (75)
S.No Category Sanctioned Filled Vacant Sanctioned Filled Vacant Sanctioned Filled Vacant Sanctioned Filled Vacant
1 SMO 1 1 0 1 1 0 1 1 0 1 1 0
2 Medicine 1 1 0 1 1 0 1 1 0 1 1 0
3 Surgery 1 1 0 1 0 1 1 2 -1 1 1 0
4 Gynae 1 1 0 1 1 0 1 2 -1 1 0 1
5 Pead 1 1 0 1 0 1 1 1 0 1 0 1
6 Ortho 1 1 0 1 0 1 1 2 -1 1 1 0
7 Anaes 1 0 1 1 1 0 1 1 0 1 1 0
8 Pathology 1 0 1 – – – 1 1 0 1 1 0
9 Opthalo – – – 1 0 1 1 2 -1 1 1 0
10 Radiology 1 0 1 – – – 1 1 0 1 1 0
11 Psychatrist – – – 1 1 0 1 1 0 – – –
12 BTO – – – 1 1 0 1 0 1 – – –
13 Skin & VD – – – 1 1 0 1 1 0 – – –
14 ENT 1 0 1 1 0 1 1 1 0 – – –
15 Dental 1 1 0 1 1 0 1 1 0 1 1 0
16 MO
(MBBS) 5 2 3 7 1 6 10 7 3 3 2 1
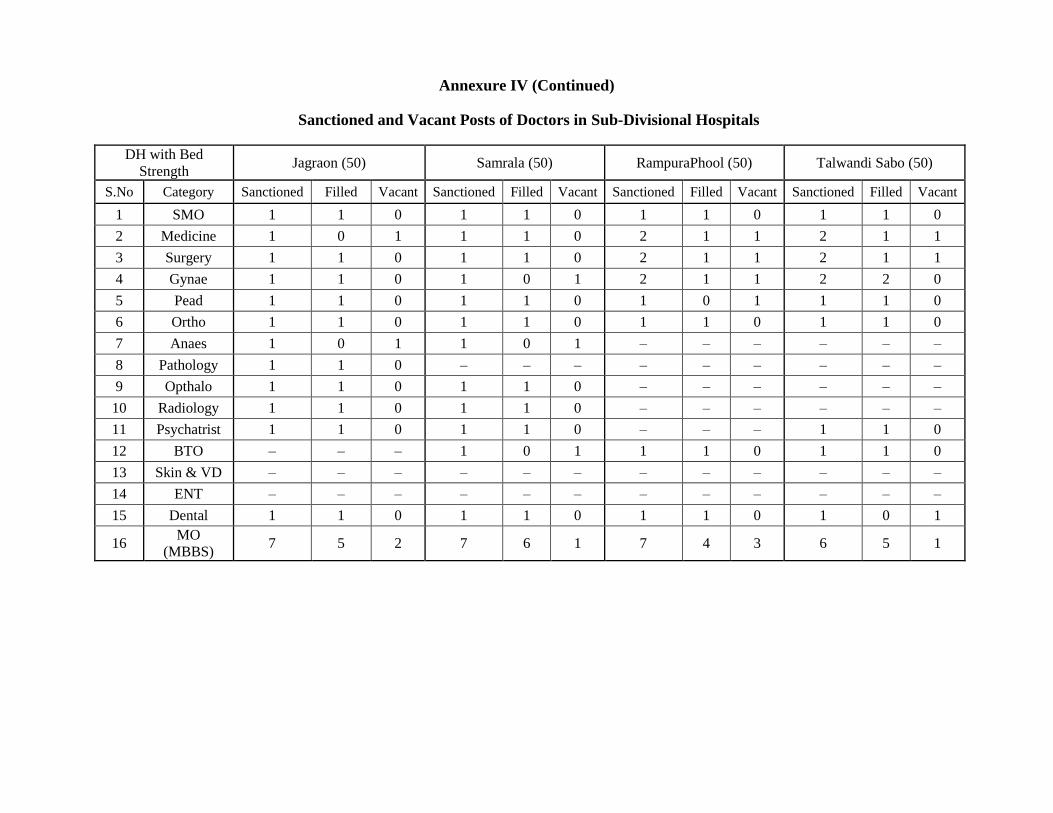
Annexure IV (Continued)
Sanctioned and Vacant Posts of Doctors in Sub-Divisional Hospitals
DH with Bed
Strength Jagraon (50) Samrala (50) RampuraPhool (50) Talwandi Sabo (50)
S.No Category Sanctioned Filled Vacant Sanctioned Filled Vacant Sanctioned Filled Vacant Sanctioned Filled Vacant
1 SMO 1 1 0 1 1 0 1 1 0 1 1 0
2 Medicine 1 0 1 1 1 0 2 1 1 2 1 1
3 Surgery 1 1 0 1 1 0 2 1 1 2 1 1
4 Gynae 1 1 0 1 0 1 2 1 1 2 2 0
5 Pead 1 1 0 1 1 0 1 0 1 1 1 0
6 Ortho 1 1 0 1 1 0 1 1 0 1 1 0
7 Anaes 1 0 1 1 0 1 – – – – – –
8 Pathology 1 1 0 – – – – – – – – –
9 Opthalo 1 1 0 1 1 0 – – – – – –
10 Radiology 1 1 0 1 1 0 – – – – – –
11 Psychatrist 1 1 0 1 1 0 – – – 1 1 0
12 BTO – – – 1 0 1 1 1 0 1 1 0
13 Skin & VD – – – – – – – – – – – –
14 ENT – – – – – – – – – – – –
15 Dental 1 1 0 1 1 0 1 1 0 1 0 1
16 MO
(MBBS) 7 5 2 7 6 1 7 4 3 6 5 1
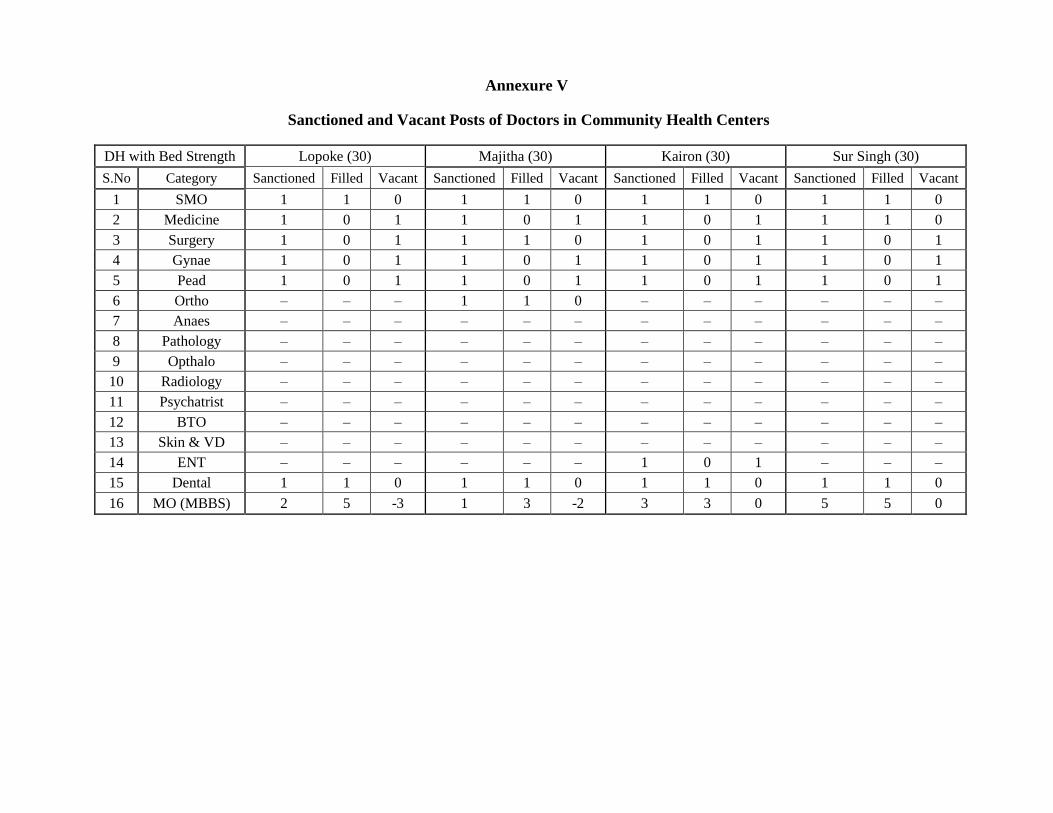
Annexure V
Sanctioned and Vacant Posts of Doctors in Community Health Centers
DH with Bed Strength Lopoke (30) Majitha (30) Kairon (30) Sur Singh (30)
S.No Category Sanctioned Filled Vacant Sanctioned Filled Vacant Sanctioned Filled Vacant Sanctioned Filled Vacant
1 SMO 1 1 0 1 1 0 1 1 0 1 1 0
2 Medicine 1 0 1 1 0 1 1 0 1 1 1 0
3 Surgery 1 0 1 1 1 0 1 0 1 1 0 1
4 Gynae 1 0 1 1 0 1 1 0 1 1 0 1
5 Pead 1 0 1 1 0 1 1 0 1 1 0 1
6 Ortho – – – 1 1 0 – – – – – –
7 Anaes – – – – – – – – – – – –
8 Pathology – – – – – – – – – – – –
9 Opthalo – – – – – – – – – – – –
10 Radiology – – – – – – – – – – – –
11 Psychatrist – – – – – – – – – – – –
12 BTO – – – – – – – – – – – –
13 Skin & VD – – – – – – – – – – – –
14 ENT – – – – – – 1 0 1 – – –
15 Dental 1 1 0 1 1 0 1 1 0 1 1 0
16 MO (MBBS) 2 5 -3 1 3 -2 3 3 0 5 5 0
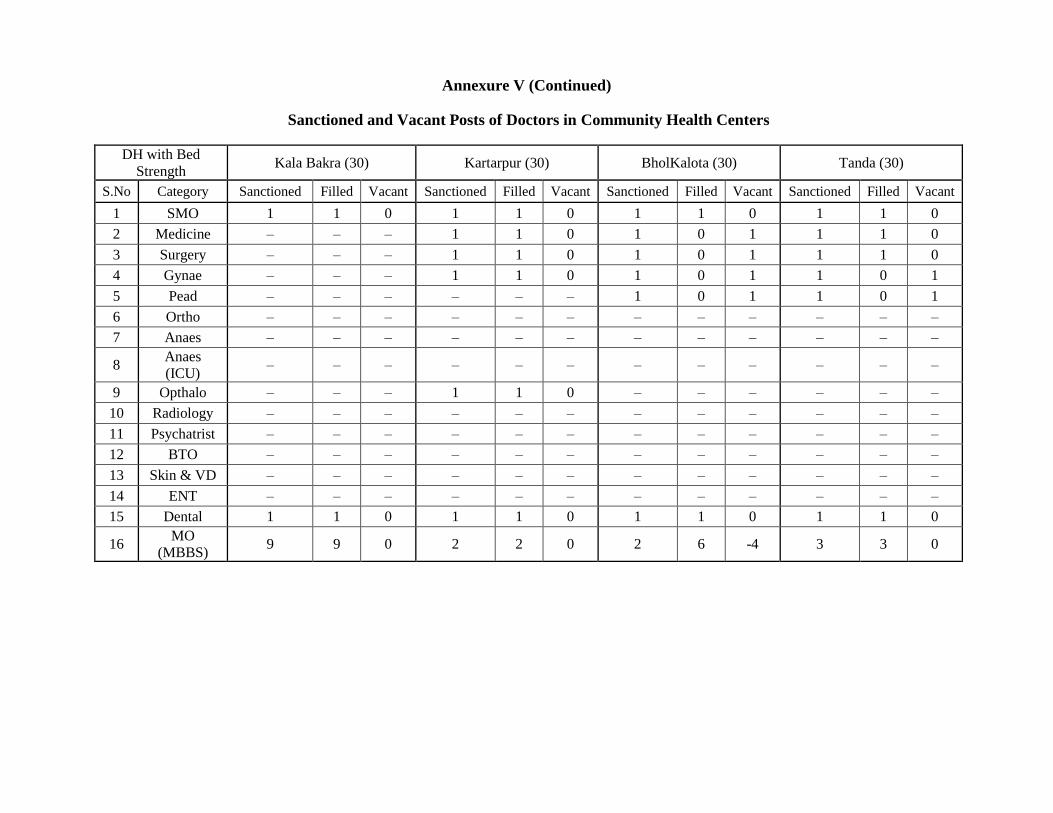
Annexure V (Continued)
Sanctioned and Vacant Posts of Doctors in Community Health Centers
DH with Bed
Strength Kala Bakra (30) Kartarpur (30) BholKalota (30) Tanda (30)
S.No Category Sanctioned Filled Vacant Sanctioned Filled Vacant Sanctioned Filled Vacant Sanctioned Filled Vacant
1 SMO 1 1 0 1 1 0 1 1 0 1 1 0
2 Medicine – – – 1 1 0 1 0 1 1 1 0
3 Surgery – – – 1 1 0 1 0 1 1 1 0
4 Gynae – – – 1 1 0 1 0 1 1 0 1
5 Pead – – – – – – 1 0 1 1 0 1
6 Ortho – – – – – – – – – – – –
7 Anaes – – – – – – – – – – – –
8 Anaes
(ICU) – – – – – – – – – – – –
9 Opthalo – – – 1 1 0 – – – – – –
10 Radiology – – – – – – – – – – – –
11 Psychatrist – – – – – – – – – – – –
12 BTO – – – – – – – – – – – –
13 Skin & VD – – – – – – – – – – – –
14 ENT – – – – – – – – – – – –
15 Dental 1 1 0 1 1 0 1 1 0 1 1 0
16 MO
(MBBS) 9 9 0 2 2 0 2 6 -4 3 3 0
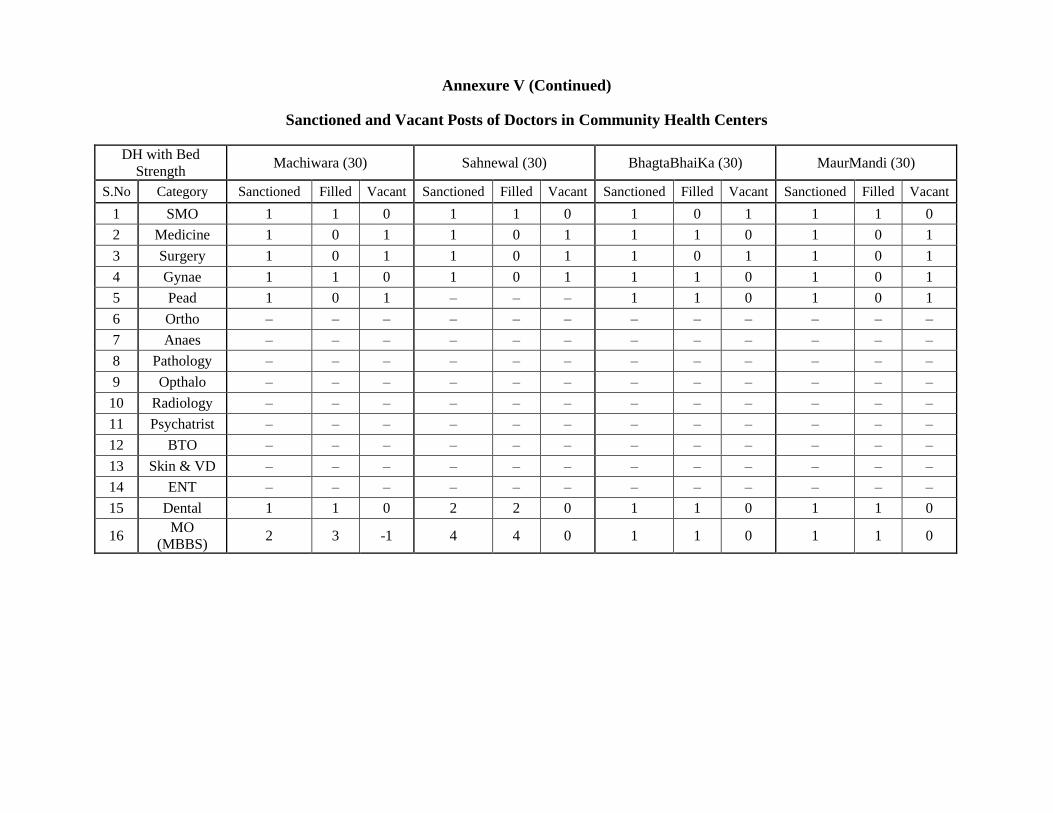
Annexure V (Continued)
Sanctioned and Vacant Posts of Doctors in Community Health Centers
DH with Bed
Strength Machiwara (30) Sahnewal (30) BhagtaBhaiKa (30) MaurMandi (30)
S.No Category Sanctioned Filled Vacant Sanctioned Filled Vacant Sanctioned Filled Vacant Sanctioned Filled Vacant
1 SMO 1 1 0 1 1 0 1 0 1 1 1 0
2 Medicine 1 0 1 1 0 1 1 1 0 1 0 1
3 Surgery 1 0 1 1 0 1 1 0 1 1 0 1
4 Gynae 1 1 0 1 0 1 1 1 0 1 0 1
5 Pead 1 0 1 – – – 1 1 0 1 0 1
6 Ortho – – – – – – – – – – – –
7 Anaes – – – – – – – – – – – –
8 Pathology – – – – – – – – – – – –
9 Opthalo – – – – – – – – – – – –
10 Radiology – – – – – – – – – – – –
11 Psychatrist – – – – – – – – – – – –
12 BTO – – – – – – – – – – – –
13 Skin & VD – – – – – – – – – – – –
14 ENT – – – – – – – – – – – –
15 Dental 1 1 0 2 2 0 1 1 0 1 1 0
16 MO
(MBBS) 2 3 -1 4 4 0 1 1 0 1 1 0
