uganda cfsva 2013
TRANSCRIPT

Comprehensive
Food Security
And Vulnerability
Analysis (CFSVA)
Uganda
April 2013

Contents Acknowledgments .................................................................................................................................. 1 1. Key findings .................................................................................................................................... 1 2. Background to the CFSVA .............................................................................................................. 2
Objectives of the CFSVA ..................................................................................................................... 2 How to measure food security and nutrition ..................................................................................... 2
Food security ................................................................................................................................... 2 Nutrition .......................................................................................................................................... 3
3. Uganda context .............................................................................................................................. 4 Uganda produces a wide range of food ............................................................................................. 5 Food availability varies by season and region .................................................................................... 8 Food market structure, market integration and food prices ............................................................. 8
4. Overview of food security and nutrition ..................................................................................... 12 Urban vs rural food insecurity .......................................................................................................... 15 Nutrition – stunting is ‘serious’ and wasting is ‘poor’ ...................................................................... 16
5. Who are the food insecure and malnourished? .......................................................................... 17 The poor ........................................................................................................................................... 17 Households headed by women ........................................................................................................ 19 Subsistence farmers ......................................................................................................................... 20
6. Where are the food insecure and malnourished? ...................................................................... 22 Northern Uganda .............................................................................................................................. 22 Western Uganda ............................................................................................................................... 25
7. Other factors that drive food insecurity in Uganda .................................................................... 26 Agricultural constraints .................................................................................................................... 27 Seasonality ........................................................................................................................................ 29 Climate .............................................................................................................................................. 31 Sources of food ................................................................................................................................. 32 Other shocks ..................................................................................................................................... 34
8. Drivers of malnutrition ................................................................................................................. 35 Poor quality diet ............................................................................................................................... 35 Maternal health and young child feeding practices ......................................................................... 36 Illness, disease and immunization of young children ....................................................................... 37
9. Conclusion .................................................................................................................................... 40 Annex I Overview of the food security situation in Uganda ................................................................. 41 Annex 2 Market integration and prices ................................................................................................ 43 Annex 3 Caloric computation Uganda based on UNPS 2009/10 .......................................................... 43

1
Acknowledgments This comprehensive food security and vulnerability analysis (CSFVA) is a collaboration between the
World Food Programme (WFP) Uganda and the Uganda Bureau of Statistics (UBOS). It is funded by
the Bill and Melinda Gates Foundation. Angela Kiconco, Stephen Baryahirwa and James Muwonge
worked on the report on behalf of UBOS alongside Richard Baslisrwa and Kenneth Anyanzo from the
WFP country office, and Genevieve Chicoine from the WFP Regional Kampala Office. Astrid
Mathiassen, Siemon Hollema and Katy Williams provided technical support from WFP headquarters.
1. Key findings Nationally almost half (48%) of Ugandans were food energy deficient between September
2009 and August 20101. The proportion was relatively similar across regions, but spiked at
59% in northern Uganda, which is the most food insecure region. Some 12% of northern
households were surviving on one meal a day compared with 6.3% at the national level.
Low dietary diversity2 was a key problem especially in western Uganda. Nationally over a
third of Ugandans had low dietary diversity rising to well over half in the western region
(55%). The region also had the highest rates of childhood stunting.
Nearly 5% of Ugandans had poor food consumption, which reflects an extremely unbalanced
diet, that is devoid of protein and chiefly comprised of starchy maize or matooke (plantain)
flavoured with some vegetables. Seventeen percent had borderline food consumption,
which means they consumed a slightly more varied diet with more pulses, vegetables and
sugars, but still barely any animal proteins, milk or fruit.
A third of Ugandan children were stunted, 14% severely so, and the rate was “serious”3 in
western (42%) and eastern (36%) Uganda. Rural Ugandans were also more likely to be
stunted than urban (37% vs 14%).
Nationally, 5% of under fives were wasted with children in rural areas three times more
likely to have acute malnutrition than urban. In northern and central regions wasting was
rated ‘poor’ on the basis of the WHO guidelines (i.e. above 5%), peaking at 7% in northern
Uganda. Overall, 15% of under fives were underweight, though again prevalence was higher
in rural Uganda and the north.
Food insecurity was more of a rural phenomenon across all food security indicators except
for caloric deficiency. Rural dwellers may tend to consume more calories by bulking up on
staples to fuel them to carry out a higher level of manual work, but they are more likely to
forego diversity in their diet by comparison with their urban counterparts.
Food insecurity and malnutrition were strongly associated with monetary poverty (here
measured by the expenditure quintile4). Despite Uganda’s progress in reducing the incidence
of poverty, the absolute number of poor people has increased due to population growth and
poverty remains firmly entrenched in rural areas, especially in the northern region. About
30% of all rural people still live below the national rural poverty line.
The poorest households in rural Uganda were the most dependent on purchasing their food,
making them highly vulnerable to food price rises for the foods they need to buy.
1 Their regular diet fails to provide them with the minimum dietary energy requirement
1 to lead an active and healthy life
2 They consumed food from fewer than five out of seven food groups in the week leading up to the survey,
3According to WHO thresholds the chronic malnutrition situation in these regions is considered “serious” (30-39%).
4 The expenditure quintiles rank the population from the poorest 20% to the richest 20% based on household aggregate
consumption expenditure.

2
A fifth of households depend on ‘rural mixed subsistence farming only’5 for their livelihood
and these farmers constituted some of the poorest (37% live below the national poverty line
and 52% were in the two lowest expenditure quintiles). They scored particularly badly on the
diversity indicators - more than half (52%) had low dietary diversity. But the food security
situation of subsistence farmers improves dramatically when they diversify their income by
engaging in ‘non-agricultural enterprises’ too.
The almost total dependence on rain-fed agriculture means harvests were way below their
potential, especially in drought prone areas such as Karamoja. Nearly three quarters (74%)
of northern Ugandan households said they had suffered drought /irregular rains in the year
preceding the survey, which nearly always led to a decline in food production (94%) and
income (81%) forcing two fifths of them to change their dietary patterns.
2. Background to the CFSVA The data for the analysis is from the Uganda National Panel Survey (UNPS) 2009/2010. This is the
first round of the panel survey to be included on an annual basis. The first wave of data collection
ran from September 2009 through August 2010 and the sample used for this analysis consisted of
2,563 households. The UNPS is representative at the national, urban/rural and regional levels (north,
east, west and central regions). The survey includes core information for food security analysis such
as food consumption, poverty, nutrition and livelihoods.
This UNPS survey program is a part of the Living Standards Measurement Study-Integrated Surveys
on Agriculture (LSMS-ISA), a household survey project implemented by the Living Standards
Measurement Study (LSMS) unit within the Development Research Group at the World Bank. The
LSMS-ISA project collaborates with the national statistics offices in Sub-Saharan Africa (SSA) to
design and implement systems of multi-topic, nationally representative panel household surveys
with a strong focus on agriculture.
Objectives of the CFSVA
The overall objective of the CFSVA is to provide information on the food security, vulnerability to
food security and nutritional status in Uganda by:
Establishing the distribution of food insecure and vulnerable households in the context of the
human, social, physical and natural capital.
Establishing the various risks that households are exposed to and the coping mechanisms they
employ.
Evaluating the causal relationships between factors that determine food and nutrition security.
Evaluating the effects of seasonality on food security outcomes
How to measure food security and nutrition
Food security
‘Food security’ defines a situation in which all people at all times have physical and economic access
to sufficient, safe and nutritious food which meets their dietary needs and food preferences for an
active and healthy life (FAO, 1996). 5 Subsistence farmers are defined as persons who grow crops largely for home consumption though they occasionally sell
any surpluses for money.

3
This report provides an overview of food security at the national (urban and rural) and regional level
in Uganda. Food security depends upon three main factors:
Availability of food -This is the extent to which sufficient quantity and quality of food is physically
present in an area. This includes food found in markets, produced on local farms or home gardens or
provided as food aid or gifts.
Access to food - Even if food is available people cannot always access it. Food access is ensured
when communities, households and all individuals have enough resources to obtain sufficient
quantity and quality of food for a nutritious diet through a combination of home production, stocks,
purchase, barter, gifts, borrowing or food aid.
Utilization of food - Even if food is available and can be accessed, inefficient absorption of food by
the body will lead to malnutrition. Food utilisation may be affected by endemic disease, unsafe
drinking water, poor sanitation or lack of appropriate nutritional knowledge, especially child feeding
practices.
Nutrition
The nutritional status of a population can be assessed by anthropometric measurements of the most
vulnerable i.e., children under the age of five and women, as well as micro-nutrient measurements.
The critical period is the first thousand days of a child’s life. When deprived of nutritious food, a
child’s physical development is impaired and he or she matures into an adult that is less likely to
reach his or her optimal cognitive development and is more prone to disease. This adult will be less
productive with a far greater likelihood of being stuck in poverty, thereby perpetuating the cycle of
food insecurity and malnutrition.
Malnutrition is not a simple problem with a single cause and silver bullet solution. Its immediate
causes are inadequate dietary intake and illness which can create a vicious circle: a malnourished
child is more susceptible to illness and inversely when a child is ill, he/she is more prone to becoming
malnourished. Children entering this cycle can fall into a potentially fatal spiral as one condition
perpetuates the other.
These immediate causes of malnutrition have underlying causes themselves, such as inadequate
access to food in a household, insufficient health services, an unhealthy living environment and
inadequate care for women and children.
There is no single measure to judge food security and nutrition status, but a variety of measurement
techniques provide insight into the many aspects of consumption and nutrition.
In this analysis the state of household food insecurity is assessed by:
Measuring the quantity of food
that its members consume
Households consuming less than a threshold amount of calories required
to stay healthy and maintain regular physical activity can be classified as
food insecure. Daily energy consumption needs vary according to the age,
build, sex and activity levels of household members ( FAO/WHO/UNU
200). When it lacks energy, the body compensates by slowing down its
physical and mental activities.
Measuring the quality/diversity
of food that its members
consume
Households consuming a, non-diversified, unbalanced and unhealthy diet,
can be classified as food insecure. Hungry people spend a larger share, if
not all, of their food budget on macronutrient dense staples, such as rice
and wheat, which provide cheap and accessible sources of calories. They
don’t consume nutrient dense foods providing a good source of protein

4
and micronutrients. Therefore the less varied the food intake by members
of a household, the more likely they are to be food insecure. Dietary
diversity can be captured by simply measuring the number of food groups
(out of seven) that a household consumes over a reference period of
seven days.
Calculating the food
consumption score
This combines food diversity, food frequency (the number of days each
food group is consumed) weighted by the relative nutritional importance
of different food groups. Cereals, tubers and root crops are assigned a
weighting of 2; pulses a weighting of 3; vegetables, relish and fruit 1;
meat, eggs, fish and dairy 4; sugar, oils, fats and butter 0.5. The food
consumption score uses standardized thresholds that subsequently divide
households into three groups: poor food consumption, borderline food
consumption and acceptable food consumption.
Measuring nutrition This is done by comparing the anthropometric indicators for children
under the age of five (stunting, wasting and underweight) against a
healthy reference population as defined by the World Health
Organisation. Stunting or low height-for- age is defined as having a height
at least two standard deviations below the median height for a reference
population. Stunting among children is a strong nutritional indicator for
chronic food insecurity as insufficient calorie intake translates into
reduced child growth. Underweight or low weight-for-age is similarly
defined and reflects both chronic and acute malnutrition. Wasting is based
on standardized weight-for-height and low values can be a measure of
acute malnutrition.
Food security can be transitory or chronic in nature. Transitory food insecurity is of a temporary
nature and caused by a negative event such as a natural disaster, illness of household member or
loss of employment. Chronic food insecurity is the persistent inability of a household to meet its
dietary needs over a long period. Its main underlying cause is poverty and is characterized by
seasonal shortages of food. Transitory food insecurity can lead to chronic food insecurity.
The above illustrates the complexity of measuring food security outcomes. Household coping
strategies include a reduction of the quantity or the quality of their food consumption. However
both are measures of food insecurity. Households that meet both the quantity and quality
thresholds are classified as food secure while those that are unable to meet one or either are food
insecure.
3. Uganda context
Uganda has plentiful natural resources including fertile soils, regular rainfall, abundant lakes and
rivers, deposits of copper, gold and other minerals and an estimated 3 billion barrels of soon-to-be-
tapped oil reserves.
Since the mid eighties it has rebounded from civil war and economic collapse to become relatively
peaceful, stable and prosperous. While the global economic downturn has hit exports, GDP growth
was still relatively strong at 6.7% in 2010/2011. On the back of subdued export performance, high
inflation and subsequent tightening of monetary policy to restore macroeconomic stability, GDP

5
growth is expected to slow to 4.3% in FY2011/12 and not beyond 5% in FY2012/2013.6 In 2011 the
trade deficit stood at $3.2bn. Exports totalled $2.5bn in 2011 with coffee (22%), fish, tea and
tobacco the main export products, chiefly to Uganda’s neighbours (S Sudan, DR Congo and Kenya)
and, to a lesser extent, the EU. Imports totalled $5.7bn, largely consisting of petrol and related
products and road vehicles.
Uganda has made enormous progress in reducing poverty, halving the countrywide incidence from
56% of the population in 1992 to 24.5% in 2009/2010.7 The reduction in poverty in urban areas has
been especially marked. But the absolute number of poor people has increased due to population
growth. Nearly 7.5 million Ugandans - or a quarter of the population - still live below the poverty
line. Poverty remains firmly entrenched in rural areas, which are home to 87% of Ugandans. About
30% of all rural people still live below the national rural poverty line.
More than a quarter of Ugandans are illiterate, which locks them into a cycle of low paid work and
perpetuates poverty and food insecurity. While the primary school attendance rate is 81%, the
enrolment rate in secondary school (13-18 years) sinks to 17% (35% in urban Uganda versus 14% in
rural).8
At more than six children per woman9 the total fertility rate10 is the second highest in the world after
Niger11. Uganda’s population of about 33 million is growing by 3.2% a year and was projected to
reach 34.1 million by mid 2012.12
Although the incidence of HIV/AIDS has been reduced from around 10.5% in 1991 stabilising at
about 6.5% since 2001, the actual number of people living with the disease has increased, now
standing at 1.2 million (up from 1 million from 1991 – 2006).13 The pandemic has killed large
numbers of young adults and orphaned 1.2 million children, placing an extra economic burden on
those who care for them.
The lives of hundreds of thousands of people in the north have been blighted by one of Africa's most
brutal rebellions by the cult-like Lord's Resistance Army (LRA) led by Joseph Kony. Over the last two
decades, tens of thousands have been abducted and killed and 1.8 million displaced14. The impact on
people’s lives in the north, especially in the north east district of Karamoja, cannot be under-
estimated, although progress has been made in addressing the displacement situation with almost
80% of IDPs having returned to their villages 15.
Uganda produces a wide range of food
Endowed with large fresh-water resources as well as favourable soil conditions and climate, Uganda
has great agricultural potential.
6 The World Bank
7 UBOS The official poverty line for Uganda is based on the cost of the basic food and non-food essentials and was
calculated from the 1992 household budget survey, updated for spatial and temporal differences using price indices. 8 Uganda Demographic and Health Survey 2011
9 Demographic and Health Survey 2011
10 The average number of children that would be born if all women lived to the end of their child bearing years
11 UDHS 2006
12 Uganda Bureau of Statistics (2007), Projections of Demographic trends in Uganda 2007-2017; vol. 1
13 UNAIDS
14 OCHA
15 OCHA

6
Overall about 81% of all households (4.2 million) are engaged in agriculture16 though it’s as high as
95%, 93% and 91% in the northern, western and eastern regions respectively and dips to 74% in
central Uganda.
Although the contribution of the agricultural sector to the economy is declining, it is still the
mainstay of the economy, employing two thirds of the country’s 11.5 million-strong workforce and
contributing 22.5% to GDP.17
Agricultural households grow a wide variety of crops with maize, beans, bananas, cassava and sweet
potatoes the most commonly grown. In fact more than 1.5m households grow maize, beans and
bananas and more than a million grow cassava and sweet potatoes.18 These five crops are grown in
the highest quantities, but added to this many households grow millet, sorghum, rice, field peas,
cow peas, pigeon peas, groundnuts, simsim, soya beans and Irish potatoes.
According to UN Food and Agriculture Organisation (FAO) figures the country produces enough
plantain and cassava – the two most important staples – to feed its people. And it produces a
surplus of maize and beans, enabling it to export a large quantity of maize and to a lesser extent
beans to neighbouring deficit countries such as Kenya and South Sudan. (see Table below)
Production of sorghum, rice, beans, groundnuts, field peas, cow peas, simsim, soya beans, cassava,
Irish and sweet potatoes all increased between UNHS 2005/06 and the Uganda Census of Agriculture
2008/09.
Central and Western Uganda are the major banana producing regions while eastern Uganda is the
main maize producing region, see table 1. The Northern region produces fewer food crops (maize,
bananas, beans and sweet potatoes) than other regions.
Crop Central Eastern Northern Western
Maize 712 948 376 587
Beans 263 180 95 314
Cassava 471 435 415 116
Bananas for food 4,296 239 35 3,430
Sweet Potatoes 423 458 278 313
16
A household is said to be engaged in agriculture if any member of the household is involved in cultivating crops during the first and/or the second cropping season. 17
Ministry of Agriculture, Animal Industries and Fisheries 18
Uganda Census of Agriculture 2008/2009
Table 1: Production of major crops (‘000 metric tons) by region

7
64
8
74
82
83
61
0 20 40 60 80 100
National
Kampala
Western
Northern
Eastern
Central
Percentage
Commodity 2007 2008 2009 2010 2011 2007-2011 average
Maize 101,233
66,671
94,440
166,251
89,246
103,568
Beans and other Legumes
22,532
37,211
38,140
24,417
35,920
31,644
Sesame seeds 5,945
14,154
12,107
12,065
14,841
11,822
Soya beans 5,798
3,250
2,630
918
1,579
2,835
Source: FAO CountryStat data for Uganda
Table 2: Uganda's staple food exports (metric tons)
Livestock production in Uganda
contributes 5.2% to total GDP and is an
integral part of the agricultural system
in many parts of the country with 69%
of households engaged in it.19 According
to FAO figures livestock numbers have
increased by about 150,000 each year
from 6 million in 2000 to 7.7 million in
2010. There has been a 3% increase
between 2009 and 2010 thanks to
steady efforts to control animal diseases
and an improvement in livestock
production systems because of routine
livestock extension interventions20. The eastern and northern regions are the main livestock farming
areas (figure 1).
But prolonged seasonal dry spells, particularly in Karamoja in the north east limit livestock access to
pastures and water, reducing livestock production and forcing pastoralists and agro pastoralists to
migrate westward to dry season grazing areas.21
A fifth of Uganda’s surface area is under water with five major lakes (Victoria, Albert, Kyoja, Edward
and George) and 160 minor lakes, rivers and wetlands. It has an estimated production potential of
over 800,000 metric tonnes (MT) of fish although the current catch is estimated at 475,000 MT. This
is attributed to the inadequate capacity of Beach Management Units in fisheries management, the
resurgence of water hyacinth and emergence of new weeds, lack of species specific management
plans, use of inappropriate fishing gear and lack of clear understanding of the economies of fisheries
development. No working cold rooms were recorded at landing sites in 2010 (although five had been
recorded in 2008) and just 4% of landing sites have mains electricity, required for ice making and
cooling facilities. Fish exports almost halved between 2007 and 2010 to 15.42 MT..22
19
Livestock refers to all animals and birds kept or reared specifically for agricultural purposes including cattle, sheep, goats, pigs, horses, poultry, rabbits and donkeys. The definition is regardless of the number owned. 20
Ministry of Agriculture, Animal Industry and Fisheries, Statistical Abstract 2011 21
FEWSNET Food Security Outlook September 2009-August 2010 22
Ministry of Agriculture, Animal Industry and Fisheries, Statistical Abstract 2011
Figure 1: Percentage of households engaged in livestock farming by region (%)

8
So, since Uganda’s fertile soils and generally clement climate enable households throughout the
country to grow a wide variety of staples and to farm livestock, food availability is not a major
problem for Uganda as a whole.
Food availability varies by season and region
However food availability is seasonal with a marked divide between ‘bimodal’ and ‘unimodal’
regions. Most of Uganda has a sub tropical ‘bimodal’ climate with two rainy seasons (March – June
and mid August – December) with dry seasons following them. This means it has two growing
seasons with the first season harvests taking place between June and August and the second from
November to January.
Unlike the rest of Uganda, Karamoja, which comprises five districts (Abim, Kaabong, Kotido, Moroto
and Nakapiripirit) has a ‘unimodal’ climate with roughly six months of rains (April – October)
followed by a six month dry season so it benefits from only one annual harvest, normally around the
month of October. This means that the effects of a poor harvest are felt more keenly in Karamoja
than elsewhere in the country, because the resulting ‘food gap’ lasts for twice as long. Its hunger
season generally lasts from April through to the following harvest (Sept/Oct) though it can often
start earlier if the previous harvest has been poor because of climatic conditions. In fact the region
experienced three consecutive seasons of poor harvests (2006 – 2009) with delayed, lower than
normal and poorly distributed rains reducing crop yields, pastures and livestock production and
prompting high crop prices – all of which led to greater food insecurity. In July 2009 FEWSNET
reported that some 1.15 million people in Karamoja were food insecure rising to about 1.4 million by
January 2010. More than 95% of the region’s population were reliant on WFP food aid.
The seasonality of the cropping calendar as well as extreme weather conditions affect the supply of
food commodities in the markets, and when supply is more scare food price levels rise.
Food market structure, market integration and food prices Ugandans are fairly market dependent and markets are the main source of food calories for about
50% of Ugandan households. This contributes to households’ vulnerability to food insecurity if food
prices rise sharply.
Smallholder farmers produce most of the food that passes through the market outlets in the
country. Their lack of proper storage facilities and limited access to credit and sources of income
compel them to sell their surpluses immediately after harvest. Consequently, the marketing chains
are long with a number of intermediaries operating between farmers in producing areas and
consumers.
Cereals are the most traded food items with maize taking the largest share in terms of market
volumes handled. Maize is grown in all regions, with the Eastern region accounting for the largest
portion of total production.
The maize market is structured such that there are players at the local, regional as well as national
levels. Assemblers, who are also mainly farmers, buy grain from other farmers’ markets to resell to
consumers or local and regional wholesalers. Although some of the assemblers operate
independently, they can also act as agents for wholesalers.
Note that many of the actors in the maize market also handle other produce, such as rice and beans,
so the market structure for these commodities tends to be similar to that of maize. The main

9
difference is that there is more done to add value to maize (milling flour of different grades) and
involves millers at different levels.
WFP is also one of the major wholesale buyers of maize grain - and to a lesser extent beans - in
Uganda, both for its food assistance programmes within Uganda as well as programmes in
neighbouring countries and the Horn of Africa region.
The fresh food market tends to be more loosely structured, although it follows a similar pattern to
that of the cereals and grain market. Food items such as fresh potatoes and cassava are sold by
farmers on an ad hoc basis, mostly at village level markets, and usually to raise money to meet
particular needs or to buy other food items.
Beyond this level, travelling traders play a significant role. These traders work with village
middlemen who scout for the produce until sufficient quantities can be raised. The travelling traders
then collect the aggregated bulk that they mainly transport to the capital Kampala, where they sell
to wholesalers, who supply different vendors around various markets in the city. However it is not
uncommon, depending on availability of the produce, for the wholesalers to engage in retail sales at
the same time.
Monthly wholesale maize and beans prices across Ugandan markets for the period January 2006 to
December 2012 exhibit strong co-movement. Further, prices are well correlated over time and
distance between markets, indicating a relatively strong level of market integration (Annex 2, tables
A2 and A3). Increased investment in road infrastructure and improved access to real time market
information thanks to the widespread presence, affordability and use of mobile phone services for
checking price information may have contributed to this.
23 Adapted from IPRA and WFP, Making the Market Work for the Food-Insecure in Uganda: A Market Profile, Final Report Kampala, 25 September 2007
Production Rural
market
Urban market
Cross-border
market
Farm
ers
Assemblers/ small traders
Wholesalers
Processors
Wholesalers Retailers Wholesalers/
WFP
Retailers Wholesalers/
processors
South Sudan, Kenya, etc
Consumers Exporters/ WFP
Figure 2: Marketing chain for locally produced major staples (maize and beans) in Uganda
23

10
There was a sharp increase in nominal wholesale maize prices in 2008 and 200924. This was followed
by a sharp decline in prices in 2010 because of bumper harvests in 2009/2010 resulting from
favourable weather conditions and the fact that producers upped their output in response to the
high prices in 2008/2009. (See figure 3)
There has been a general increase in nominal wholesale beans prices since January 2006 with some
decline in 2010 following the bumper harvests of 2009/2010. In both 2011 and 2012, wholesale
beans prices increased substantially during the lean/hunger season (March-May) and fell after the
first season harvest (June-September). (See figure 4)
Figure 3: Nominal wholesale maize price trends in selected Uganda markets 2006-2012
Figure 4: Nominal wholesale beans price trends in selected Uganda markets 2006-2012
When adjusted for inflation using all-items Consumer Price Indices (CPI), the increase in wholesale maize and beans prices becomes less pronounced, with notable increases during the lean (pre-harvest) seasons of both 2011 and 2012. Similarly, when wholesale beans prices are adjusted for
24 This section uses wholesale maize and beans price data collected by Farmgain Africa over the last seven years.
0
200
400
600
800
1,000
1,200
1,400
1,600
Jan
May
Sep
Jan
May
Sep
Jan
May
Sep
Jan
May
Sep
Jan
May
Sep
Jan
May
Sep
Jan
May
Sep
2006 2007 2008 2009 2010 2011 2012
Pri
ce (
UG
X/k
g)
Arua
Kabale
Kamplala_Kisenyi
Kiboga
Lira
Masaka
Masindi
Mbarara
Soroti
Tororo
0
500
1,000
1,500
2,000
2,500
3,000
Jan
May
Sep
Jan
May
Sep
Jan
May
Sep
Jan
May
Sep
Jan
May
Sep
Jan
May
Sep
Jan
May
Sep
2006 2007 2008 2009 2010 2011 2012
Pri
ce (
UG
X/k
g)
Kampala_Kiseyni
Arua
Kabale
Kiboga
Masaka
Masindi
Mbarara
Soroti
Tororo
11
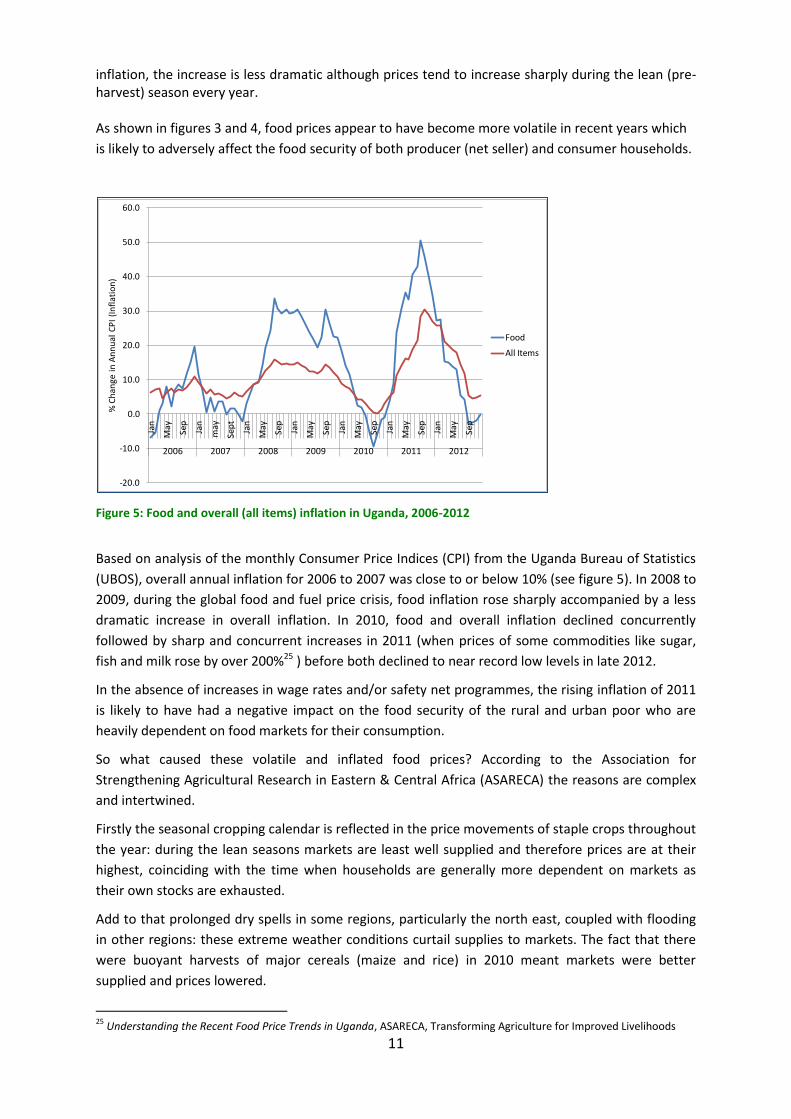
inflation, the increase is less dramatic although prices tend to increase sharply during the lean (pre-harvest) season every year. As shown in figures 3 and 4, food prices appear to have become more volatile in recent years which
is likely to adversely affect the food security of both producer (net seller) and consumer households.
Figure 5: Food and overall (all items) inflation in Uganda, 2006-2012
Based on analysis of the monthly Consumer Price Indices (CPI) from the Uganda Bureau of Statistics
(UBOS), overall annual inflation for 2006 to 2007 was close to or below 10% (see figure 5). In 2008 to
2009, during the global food and fuel price crisis, food inflation rose sharply accompanied by a less
dramatic increase in overall inflation. In 2010, food and overall inflation declined concurrently
followed by sharp and concurrent increases in 2011 (when prices of some commodities like sugar,
fish and milk rose by over 200%25 ) before both declined to near record low levels in late 2012.
In the absence of increases in wage rates and/or safety net programmes, the rising inflation of 2011
is likely to have had a negative impact on the food security of the rural and urban poor who are
heavily dependent on food markets for their consumption.
So what caused these volatile and inflated food prices? According to the Association for
Strengthening Agricultural Research in Eastern & Central Africa (ASARECA) the reasons are complex
and intertwined.
Firstly the seasonal cropping calendar is reflected in the price movements of staple crops throughout
the year: during the lean seasons markets are least well supplied and therefore prices are at their
highest, coinciding with the time when households are generally more dependent on markets as
their own stocks are exhausted.
Add to that prolonged dry spells in some regions, particularly the north east, coupled with flooding
in other regions: these extreme weather conditions curtail supplies to markets. The fact that there
were buoyant harvests of major cereals (maize and rice) in 2010 meant markets were better
supplied and prices lowered.
25
Understanding the Recent Food Price Trends in Uganda, ASARECA, Transforming Agriculture for Improved Livelihoods
-20.0
-10.0
0.0
10.0
20.0
30.0
40.0
50.0
60.0
Jan
May
Sep
Jan
may
Sep
t
Jan
May
Sep
Jan
May
Sep
Jan
May
Sep
Jan
May
Sep
Jan
May
Sep
2006 2007 2008 2009 2010 2011 2012
% C
han
ge i
n A
nn
ual
CP
I (I
nfl
atio
n)
Food
All Items

12
17
10
15
20
16 15
9
16
5
5
6
4 6
3
6
5
0
5
10
15
20
25
30
Pe
rce
nta
ge
Poor FC
Borderline FC
The high food prices in Uganda are also linked to rising food and fuel prices in the international
markets and varying exchange rates. For example high fuel prices affect the production and
transportation costs of food items. The onset of high inflation in June 2009 coincided with a time
when the Ugandan shilling was weak against the US dollar and fuel prices were on the rise.
According to ASARECA higher food production districts tend to have lower and relatively more stable
prices compared to lower production districts. To illustrate this Masindi and Kabale, which are high
producers of maize and beans, recorded the lowest average prices when the country was facing
surging food prices.
4. Overview of food security and nutrition This chapter gives a general snapshot of the Uganda diet and the household level food security
situation by examining several indicators including the food consumption score, staple dependency,
food energy deficiency and dietary diversity (please refer back to methodology section 2.2).
More than a fifth (20.3%) of Ugandans have ‘unacceptable’ food consumption (i.e., 4.7% poor and
15.6% borderline), which represents a marked improvement on the 2009 CFSVA when 6.3% had
poor food consumption and 21.3% borderline. As explained above this measurement combines food
diversity, food frequency (the number of days each food group is consumed) and the relative
nutritional importance of different food groups. The 4.7% of households with poor food
consumption – rising to over 6% in northern and central regions as well as Kampala - have an
extremely unbalanced diet, that is likely energy- deficient, devoid of protein and chiefly comprised of
starchy maize or matooke (plantain) flavoured with some vegetables.
Those living in rural Uganda are more likely to have unacceptable food consumption than those in
urban (21.5% vs 20.3%). Westerners fare much better on the food consumption score than
elsewhere with fewer than 3% of households having poor food consumption and 14.6% borderline.
Ugandans consume a
wide range of staples by
comparison with most
countries in the region,
deriving 69% of their
food energy from them.
Plantains (matooke),
cassava and maize are
the most important
staples in terms of
caloric intake followed
by sweet potatoes. Rice
and wheat are not
traditional staples but
they are growing in
importance especially for urban and high income households. Beans, groundnuts, sorghum, millet,
Irish potatoes, peas, simsim and green leafy vegetables generally complement a diet of staples.
Figure 6: Percentage of households with poor and borderline food consumption

13
On average Ugandans eat cereals every day, vegetables six days a week and pulses four times a
week. Fruits, animal protein (meat/fish) and milk are consumed twice a week, though less frequently
in northern and western Uganda (see figure 7). Predictably urban Ugandans (especially those in
Kampala) and the wealthier eat considerably more fruits, meat, fish, eggs, milk, oil and sugar than
rural Ugandans who are more dependent on cereals and pulses.
Figure 7: Number of days food groups were consumed in the previous week
In the week preceding the survey those with poor food consumption consumed cereals on about
four days only and vegetables on two, figure 7. Other food groups barely registered in their diet
except for some sugar (1.4 days). Those with borderline food consumption consume a slightly more
varied diet with more pulses, vegetables and sugars, but still barely any animal proteins, milk or
fruit. Comparison of these findings with the 2009 CFSVA report indicates that, generally, all food
groups are being consumed slightly more frequently – except for beans.
7
7
7
7
7
7
4
4
6
5
3
4
6
6
6
6
6
6
2
3
2
2
2
2
2
3
1
2
2
2
2
3
2
1
2
2
4
6
2
3
4
5
3
5
2
3
3
4
0 10 20 30 40
National
Kampala
Western
Northern
Eastern
Central
Cereals
Pulses
Vegetables
Fruits
Meat/Fish
Milk
Sugar
Oil
-
7
14
21
28
35
42
49
56
0 9 14 19 24 29 34 39 44 49 54 59 64 69 74 79 84 89 94 99 104 109
To
tal
foo
d d
ays
FCS
cereals and tubers pulses vegs fruits anim protein milk oil and fat sugars
Poor Consumption
Borderline Consumption
Acceptable Consumption
Figure 8: Cumulative days of food consumption and dietary diversity

14
Nationally almost half (48%) of Ugandans are food energy deficient, i.e., their regular diet fails to
provide them with the minimum dietary energy requirement26 to lead an active and healthy life (see
figure 8 and Annex 3). The proportion is relatively similar across regions, although it spikes at 59% in
northern Uganda.
Figure 9: Percentage of population that are energy deficient
Figure 10: Percentage of households with low dietary diversity
26
Population with daily energy consumption below daily energy requirements (based on age/sex/activity level of HH members) according to FAO 2004. Recommendation for light activity see IFPRI 2007 appendix 8
48
46
46
59
43
46
49
47
0 10 20 30 40 50 60 70
National
Kampala
Western
Northern
Eastern
Central
Urban
Rural
Percentage
39
22
55
35
37
33
22
43
0 10 20 30 40 50 60
National
Kampala
Western
Northern
Eastern
Central
Urban
Rural
Percentage

15
Low dietary diversity remains a key problem especially in western Uganda. On average nationally
over a third of Ugandans have low dietary diversity i.e., they consumed food from fewer than five
out of seven food groups (cereals/tubers, pulses/nuts, vegetables, fruits, milk, meat/fish/eggs, and
oil) in the week leading up to the survey. But in the western region well over half (55%) have a diet
that’s lacking in diversity.
Staple dependency is considerably higher in rural (71%) than urban (59%) Uganda (see appendix
table 1). Nearly half of rural households obtain a very high share (more than 75%) of their energy
from staples - much higher than the fifth that do so in Kampala and other urban areas. Eastern and
western Ugandans are the most staple dependent by region, with households deriving on average
around three quarters of their energy from staples in both regions - and more than half of
households gaining a very high share from staples. The poorer the household, measured by the
expenditure quintile the more likely it is to be staple dependent and obtain more than three
quarters of its energy from staples.
As figure 11 shows some 12% of northern households are surviving on one meal a day. Overall two
in five households restrict themselves to two meals a day though the proportion is again higher for
those living in the north and west where nearly half of households eat just twice daily. Meanwhile
three quarters of Kampala residents consume three meals daily.
Urban vs rural food insecurity Figure 12 summarizes household food security status (urban vs rural) using the indicators discussed
above but also includes poverty27 and high expenditure on food. Those with high expenditure on
food (more than 65% of their total household expenditure, including from their own production is
spent on food) and those living in poverty are likely to be more vulnerable to food insecurity because
they have less of a buffer when confronted with a shock such as food price rises, illness or accident
of a household member or adverse climatic events such as floods or drought.
27
The official poverty line for Uganda is based on the cost of the basic needs, food and non-food essentials. It was calculated from the household budget survey in 1992, and is updated for spatial and temporal differences using price indices.
6
5
4
12
5
6
40
21
48
47
41
33
53
73
49
40
54
61
0 20 40 60 80 100 120
National
Kampala
Western
Northern
Eastern
Central
Percentage
One meal
Two meals
Three or moremeals
Figure 11: Percentage of households consuming one, two and three meals a day by region (%)

16
Food insecurity is more of a rural phenomenon across all food security indicators except for caloric
deficiency. The relatively high caloric deprivation in urban areas may be because out of household
consumption is higher, yet under-reported, coupled with the fact that rural dwellers tend to
consume more calories to fuel them to carry out a higher level of manual labour. So rural Ugandans
are more likely to bulk up on staples to meet their energy requirements but forego diversity in their
diet by comparison with their urban counterparts.
As we will discuss later (Where are the food insecure), the western region fares worst on dietary
diversity and high dependency on staples for energy, even though it has a lower prevalence of
households with inadequate food consumption. The north fares worst on energy deficiency, poverty
and higher share of expenditure on food.
Nutrition – stunting is ‘serious’ and wasting is ‘poor’
Stunting or height-for-age is associated with poor overall economic conditions, chronic or repeated
infections as well as long term inadequate nutrient intake. It is not sensitive to recent, short-term
changes in dietary intake, rather it is a strong indicator of chronic under nutrition. When deprived of
nutritious food – especially during the critical first thousand days of life, a child’s physical
development is impaired and he or she matures into an adult that is less likely to reach his or her
cerebral potential and is more prone to disease. This adult will be less productive with a far greater
likelihood of being stuck in poverty, thereby perpetuating the cycle of food insecurity and
malnutrition.
As figure 13 illustrates, a third of Ugandan children are stunted, 14% severely so, and the rate is
“serious”28 in western (42%) and eastern (36%) Uganda. Rural Ugandans are more likely to be
stunted than their urban counterparts (37% vs 14%).
Nationally, the prevalence of wasting or global acute malnutrition (GAM) in under fives is 5% with
children in rural areas three times more likely to have acute malnutrition as urban children (2%). In
northern and central regions it is rated ‘poor’ on the basis of the WHO guidelines (i.e. above 5%),
28
According to WHO thresholds the chronic malnutrition situation in these regions is considered “serious” (30-39%).
47 48
22
42
29
36 37
48
20
15
22
8 8
14
0
10
20
30
40
50
60
Energydeficient
>75% energyfrom staples
FCS below 35 4 or less foodgroups
Povertyheadcount
>65% shareof
expenditureon food
Stunted
Rural
Urban
Figure 12: Summary of Uganda’s food security indicators (urban vs rural)

17
Analysing poverty in Uganda
The official poverty line for Uganda is based on the cost of the basic food and non-food essentials and was calculated from the 1992 household budget survey, updated for spatial and temporal differences using price indices. The food poverty line represents the cost of a food bundle of the poorest 50% of the population that provides the necessary energy requirements per person per day (around 2,300 kilocalories).
The non food poverty line represents an allowance for basic non food needs of the population whose total consumption is near to the food poverty line.
A household is defined as poor if its total expenditure per capita (including purchases, in-kind and consumption from own production) falls below the poverty line.
peaking at 7.2% in northern Uganda. This finding is consistent with the preliminary estimates of the
most recent Uganda Demographic and Health Survey - UDHS 2011.
Overall, 15% of under fives are underweight (low weight for a specific age and sex) though again
prevalence is higher in rural Uganda than urban. The severe underweight rate has risen slightly since
UDHS 2006 from 4% to 5%. The highest underweight rate is in the northern region at 18% and the
lowest in Kampala at 11%. The highest rate of severe underweight is in the eastern region (6%).
Figure 13: Nutritional status (stunting, underweight and wasting) of children 6-59 months (%)
5. Who are the food insecure and malnourished?
The poor
Uganda has made enormous progress in reducing
poverty, slashing the countrywide incidence from 56%
of the population in 1992 to 24.5% in 2009. The
reduction of poverty in urban areas has been especially
marked. Notwithstanding these gains, however, the
absolute number of poor people has increased due to
population growth. And poverty remains firmly
entrenched in rural areas, home to 87% of Ugandans.
Approximately 30% of all rural people still live below
the national rural poverty line.
The poorer the household, the more likely it is to be
food energy deficient, to have low dietary diversity,
derive more energy from staples and have poor or
borderline food consumption (see figure 14). Some
15% of the bottom fifth of the population (in terms of
expenditure) have a poor food consumption score,
compared with a 4.7% average, and three quarters
have low dietary diversity (i.e., they consume food
from fewer than four food groups) and an energy
37
14
34 33
29
36
30
42
13
34
18
8
17 15 16 17 18 17
11
15
6 2 5 4 6 5 7
4 1 5
0
5
10
15
20
25
30
35
40
45
Pe
rece
nta
ge
Stunting
Underweight
Wasting

18
deficient diet.
Figure 14: Food security indicators by expenditure quintile
There is also a direct relationship between poverty and malnutrition. As figure 15 shows, the poorer
the household the more likely it is to have stunted and underweight children.
Figure 15: Childhood malnutrition by expenditure quintiles
Poverty is often the root cause of food insecurity because poor households lack the resources
required to access enough nutritious food to live a healthy active life. Poor households are unable to
invest in the inputs required to boost their own yields. Poor farmers may have to sell any surplus
soon after harvest to earn income and repay debts, at once exposing themselves to fluctuating
market prices as well as not being able to benefit from selling when prices rise.
The extreme poor have no financial buffer to protect them from shocks such as accident or illness of
a household member or poor harvests/crop failure due to drought. In times of such stress
households often resort to corrosive coping mechanisms that may involve reducing food intake and
83
61
41
27 24
60
53 48
39
21
53
23
16 10 10
74
49
39
25
17
0
10
20
30
40
50
60
70
80
90
Quintile 1(lowest 20% )
Quintile 2 Quintile 3 Quintile 4 Quintile 5(highest 20%)
Pe
rce
nta
ge o
f h
ou
seh
old
s
Energy deficient More than 75% of energy from staples FCS<=35 Food groups <=4
40 42
36
29
20 22
21
17
13
10
7 5 5 5 4
0
5
10
15
20
25
30
35
40
45
Quintile 1(lowest)
Quintile 2 Quintile 3 Quintile 4 Quintile 5(highest)
Pe
rce
nta
ge
Stunted
Underweight
Wasted

19
25
36
14
4
46
29
46
20
5
53
0 20 40 60
Poverty headcount
HHs consuming fewer thanfive food groups
Borderline FC HHs (>21&<35)
Poor FC HHs (21 or less)
Energy deficient HHs
Percentage
Female
Male
removing children from school, coping strategies that often perpetuate a cycle of poverty and
further undermine their already fragile food security status.
Other indicators of poverty – such as poor sanitation and unimproved drinking water also correlate
with food insecurity indicators. Hence households with no toilet facilities and/or non improved
drinking water sources are more likely to have borderline food consumption, derive more energy
from staples, be energy deficient and have poor dietary diversity. More than a quarter of Uganda
households (28%) have unimproved drinking water and 7% no toilet facilities (see figure 16). In the
north almost a quarter of households have no toilets, whilst drinking water sources are least
improved in central and western Uganda.
Figure 16: Percentage of households with non improved drinking water source and no toilet by region
Households headed by women
A quarter of households headed by a woman have inadequate food consumption compared with
about a fifth of those headed by a man. As figure 17 shows some 46% have low dietary diversity
(36% for male headed). More than half of women headed households are energy deficient
compared with 46% of those headed
by a man. Underscoring all of this is
the fact that women-headed
households tend to be poorer. Why?
Female heads are less likely to take
out loans (44.5% vs 39%) or access
credit than male household heads:
credit or loans could be used for
smoothing out consumption over the
year or investment in productive
activities. Women are probably
likely to work far longer hours than
men and bear the double burden of
ensuring that their households are
fed adequately while caring for
dependents – not only children but often the sick, the elderly and orphaned children.
39
13
24
39
8
28
4 7
23
1 7
0
5
10
15
20
25
30
35
40
45
Pe
rce
nta
ge
Non- improved drinkingwater source
No toilet facility
Figure 17: Food security indicators by sex of head

20
77
66
78 76
91
52
29 26
42
78
0
10
20
30
40
50
60
70
80
90
100
Central Eastern Northern Western Kampala
Pe
rce
nta
ge o
f h
ou
seh
old
he
ads
Male
Female
Across all regions women household heads are far less likely to be able to read or write. As figure 18
illustrates the literacy levels of women household heads in rural Uganda – especially in the north and
east are very high. Lack of schooling, poverty, and food insecurity go hand in hand. Children from
the poorest households are forced to drop out of school for lack of money and to work to contribute
to household income.
As illiterate adults they
are less likely to secure
well-paid positions,
locking them into a
cycle of poverty and
food insecurity.
Figure 18: Literacy of household head by sex and region (%)
Subsistence farmers
Grouping Ugandan households into different ‘livelihoods’ (see figure 19) according to the income
activity they chiefly rely upon reveals that almost a fifth are dependent on ‘rural mixed subsistence
farming only’, 29 while almost the same percentage are reliant on non agricultural enterprises, wage
employment and a mix of non agricultural enterprises with rural mixed subsistence.
Figure 19: Distribution of households by livelihood strategies
According to UBOS in 2009/2010 three quarters of the working population were self employed and
two thirds worked in agriculture. Those households engaged in subsistence farming scattered
throughout the country constitute some of Uganda’s poorest. Their monthly average expenditure is
29
Subsistence farmers are defined as persons who grow crops largely for home consumption though they occasionally sell any surpluses for money.
1
2
2
2
5
8
19
20
21
21
0 5 10 15 20 25
Transfers (pension, allowances, social security)
Property income
Commercial farming
Urban subsistence agric
Remittances
Subsistence crop farming and local remittances
Rural mixed subsistence only
Rural mixed subsistence and non agric…
Wage employment
Non agric enterprises
Percentage of households

21
far below that of all other livelihood groups at just 46,100 Ugandan shillings per adult male
equivalent a month (US$19) and over half of that is spent on food.
Figure 20: Average monthly expenditure per adult male equivalent by livelihood groups (Ugandan shillings)
Rural mixed subsistence farmers have the highest proportion in the lowest two expenditure quintiles
(52%) and, at 45%, the highest percentage with little or no education (followed by ‘rural mixed
subsistence farmers and non agricultural enterprises’). Western Uganda has the highest
concentration of households dependent on this livelihood strategy (31%) followed by eastern (22%)
and northern (16%).
Given their wealth status and lack of education it’s not surprising that subsistence farmers have
failed to benefit from Uganda’s steady economic growth and modernization. In remote rural areas,
smallholder farmers are likely not to have access to the vehicles and roads they need to transport
their produce. They lack inputs and technology to help them increase their yields and reduce pests
and disease. They lack access to financial services, which would enable them to boost their incomes
– both by improving and expanding their production, and by establishing small enterprises30.
As figure 21 illustrates a quarter of subsistence farmers have unacceptable food consumption. They
score particularly badly on the diversity indicators and poverty: 37% are poor and more than half
(52%) have low dietary diversity and derive more than 75% of their energy from staples. Energy
deficiency is more in line with the other livelihoods.
Households reliant on a combination of subsistence crop farming and local remittances fare no
better. Again a quarter have unacceptable food consumption, more than half are energy deficient
and 47% have low dietary diversity. They are more likely to have no formal education and to be in
the lowest two expenditure quintiles.
However, when rural subsistence farmers also engage in non-agricultural enterprises their food
security situation improves dramatically (15% have unacceptable food consumption), indicating that
subsistence farming is positive if the household is diversifying its income.
30
www.ifad.org
52,600
70,600
94,200
105,900
149,500
94,600
78,500
46,100
55,200
100,200
76,000
Rural mixed subsistence + non-agric…
Commercial farming
Wage employment
Non-agric enterprises
Property income
Transfers (pension, allowances, social…
Remittances
Rural mixed subsistence only
Subsistence crop and local remittance
Urban subsistence agric.
Total
Monthly spend (Ugandan shillings)

22
Figure 21: Food security indicators by selected livelihood groups
6. Where are the food insecure and malnourished?
Northern Uganda
Northerners are far more likely to be lacking in food energy than Ugandans elsewhere in the
country: some 54% are food energy deficient compared with an average of 48% nationally. They are
more likely to have poor food consumption (6.2% vs 4.6% national average), which, as discussed
above, suggests they have an extremely limited and one sided diet. And some 12% of northern
households are surviving on one meal a day compared with 6.3% at the national level.
Households in this part of the country spend a higher share of their overall expenditure on food than
other regions (56% vs. 51% average). In fact some 45% spend more than 65% of their overall income
on food (nationally 30% of households spend more than this portion of their income on food).
25
52
46
52
37
25
47 45 48
30
15
29 32
43
26
0
10
20
30
40
50
60
Pe
rce
nta
ge o
f h
ou
seh
old
s Rural mixed subsistencefarming only
Subsistence with localremittances
Rural subsistence withnon farm enterprises
48
43
20
39
26
30
34
54
31
22
34
42
45
30
0 20 40 60
Energy deficient
>75% energy from staples
FCS below 35
4 or less food groups
Poverty headcount
>65% share of expenditureon food
Stunted
Percentage
Northern
National
Figure 22: Selected food insecurity indicators, northern Uganda vs national

23
In the survey households were asked whether they had faced a situation when they did not have
enough food to feed the household members in the year before the survey (September 2008 –
2009). Nationally some 44% of households responded that they had –rising to 74% in northern
Uganda.
Figure 23: Households that reported they did not have enough to eat by region Sept 08-09 (%)31
Northern Uganda has the highest rate of acute childhood malnutrition (wasting) at 7%, some two
percentage points higher than the national average, and the highest rate of underweight children at
18%, three percentage points higher than the national rate.
Many of the factors underlying food insecurity and malnutrition are most severe in northern
Uganda. Firstly 43.5% of the population is poor32 – much higher than the national average of 26%.
These people cannot access enough nutritious food to live a healthy and active life and are
continually forced to skip meals and cut portion sizes.
Housing is much more rudimentary in the north with more than half living in huts with thatched
roofs and earth floors. 13% have more than five people sharing a room, almost double the national
average. Sanitation is much poorer than elsewhere in the country with almost a quarter of
households devoid of toilet facilities and forced to defecate in the bush. Of course both factors are
an indicator of poverty but poor quality housing and sanitation can also lead to disease, a leading
cause of malnutrition.
31
Note this is not a quantitative measure, but a perception 32
This is using the national poverty line
44
32
35
74
50
30
32
47
0 20 40 60 80
National
Kampala
Western
Northern
Eastern
Central
Urban
Rural
Percentage

24
Figure 24: Housing, sanitation and crowding: northern Uganda vs national average
With the exception of acute respiratory infection, child illness rates (diarrhoea, bloody diarrhoea and
fever) are the highest in the country. Furthermore, vaccination rates for children (for Tuberculosis,
Diphtheria, whooping cough (Pertuasis), Tetanus, Hepatitis B, Haemophilus Influenza, Polio and
Measles) are the lowest in the country. A fifth of communities have experienced epidemic outbreaks
since 2008, the highest in the country.
Figure 25: Child illness by region in the two weeks preceding the survey
The dependency ratio is the highest (1.7 vs 1.4 national average) and more than a third of
households (34%) are headed by women (against a 29% national average), see table 3. Almost 9% of
household heads have a physical/mental impairment which is considerably higher than the national
average of 6%. Northern households tend to have a lower percentage of working age men, though
higher proportion of dependent boys and higher percentage of elderly men and women. Only a
quarter of women can read and write which is well below the average for other regions (see figure
18 above).
52
13
90.5
82
23
16 7
69
30
7
0
10
20
30
40
50
60
70
80
90
100
% of HHsliving in a
hut
% of HHswith > 5
people perroom
% of HHswith earth
floor
% of HHswith
thatchedroofs
% of HHswith no
toilet
Pe
rce
nta
ge
North
Uganda
29
37 38
31
12
20
37
19
44
30
25
30
52 56
60
37
0
10
20
30
40
50
60
70
Central Eastern Northern Western
% with diarrhoea
% with bloody diarrhoea
% with acute respiratoryinfection
Fever

25
Average
dependency
ratio
% of
female
headed
HHs
% of HH
heads with
physical/
mental
impairment
Males
(0-15)
Males
(16-
60)
Males
(>60)
Females
(>60)
Northern 1.7 34.3 8.8 52.5 37.6 10 12.8
Uganda 1.4 28.6 5.9 49.9 41.3 8.7 10.8
Table 3: Demographic statistics northern Uganda vs national average
Some three quarters of northern households suffered drought in the year preceding the survey,
which negatively affected their levels of income, food production and food purchase. As discussed
above, Karamoja’s erratic rainfall variability coupled with poorer soil fertility makes it a particularly
difficult region to farm. This, coupled with sporadic civil insecurity, cattle raiding and livestock
diseases, renders many Karamojong generally chronically food insecure with a hunger period
normally extending from April to July when stocks are lowest or depleted. This period may start as
early as February following a particularly poor harvest in the past year. Livestock diseases include
Pest des Petits Ruminants, a highly contagious disease affecting sheep and goats.
When households suffer drought it hits or even destroys their produce (96% of cases reporting
drought) and their income (85% of households that reported this shock) because they no longer
have any surplus to sell, which in turn impedes their ability to buy food (71.5%).
Many of these food security and malnutrition indicators may be linked to the conflict that has
blighted the lives of hundreds of thousands of people in the north for 20 years, particularly the
Acholi people in the districts of Gulu, Kitgum and Pader.
Tens of thousands have been abducted and killed, and 1.3 million displaced (OCHA). It has been
described as one of the most effective guerrilla armies in Africa.
Conflict disrupts all aspects of the rural economy and affects everyone, irrespective of their socio-
economic status. Its multi-dimensional effect on livelihoods and food security should not be
underestimated. Protracted insurgency and civil insecurity have limited internally displaced persons’
(IDPs) movements and access to adequate land to cultivate crops over many years leading to their
limited capacity to produce and access adequate food supplies. It has also eroded the traditional
livelihoods of IDP communities and limited their livelihood options. Inadequate access to healthcare,
safe drinking water and sanitation limits IDPs’ proper utilization of available food and leads to
disease outbreaks and malnutrition.
Western Uganda Generally this region does not have such an issue regarding lack of food energy, especially when
compared with the north. However, lack of diversity is a major problem. Some 55% have low dietary
diversity i.e., they consume food from fewer than five of the seven33 food groups (on average 39%
have low diversity). Western Ugandans eat fruit, meat, fish, milk, sugar and oil less frequently than
the average and derive less of their energy from these foods, but they consume cereals and pulses
more frequently and are more dependent on them for energy. Fewer than half of households enjoy
three meals a day.
33
Recall that sugar is not counted as a food group in the diversity score as it does not considered a nutritious food group.

26
Figure 26: Selected food insecurity indicators - western Uganda vs national average
As discussed in the previous analyses, the west has the highest share of subsistence farmers, who
tend to be heavily dependent on their own production with little recourse to supplementary income
to buy food. As we will see further on households that rely mainly on their own production tend to
produce and consume enough food/ sufficient energy, but they lack variety in their diets i.e they are
less likely to eat a sufficiently diverse diet. This helps explains why the region has the highest rates of
childhood stunting in the country at 42% compared with an average of 34%.
Poverty rates are the second highest in the country, but at 30% the situation is not nearly as severe
as in the north. Alongside the north, primary school enrolment is the lowest at 70% for boys and
73.5% for girls, though literacy rates are better than other rural regions.
7. Other factors that drive food insecurity in Uganda As we have seen poverty is strongly associated with the food insecurity indicators. It could be said to
be the chief driving force behind food insecurity because the poor cannot produce or purchase the
quantity and/or quality of food required to ensure their families are healthy and well nourished.
Poor children are more likely to drop out of school and therefore less likely to command well paid
jobs as adults, ensuring a cycle of deprivation and increased vulnerability to food insecurity. In
addition households headed by women are more likely to be poor and less food secure than those
headed by men as are the uneducated, elderly and those reliant on less secure livelihood activities
such as subsistence farming in particular. This section focuses on additional issues particularly
relevant to food insecurity.
48
43
20
39
26
30
34
40
52
17
59
30
37
42
0 20 40 60 80
Energy deficient
>75% energy from staples
FCS below 35
4 or less food groups
Poverty headcount
>65% share of expenditure on food
Stunted
Percentage
Western
National

27
Agricultural constraints
As far as agricultural production and yields are concerned, land scarcity and access are constraints.
On average Ugandan agricultural households have 1.34 hectares (3.3 acres) and 61% cultivate less
than a hectare. Those in the north have more land available, but often it takes them longer to reach
it (figures 27 and 28).
While it takes the majority less than 15 minutes to access their land, 13% have to walk between half
an hour and an hour to tend to their land. In the north, almost a fifth (19%) of farmers take two
hours or more to access some of their land, which could be a factor that prevents them from
cultivating well or frequently, thereby limiting food availability.
Just 10% of agricultural households accessed credit in the five years up to 2009/2010.34 This is one
factor that limits farmers’ use of inputs including improved seed, fertilizers, herbicides/ fungicides
and traction power, which is widely regarded as a major constraint to agricultural productivity
34
UBOS
3.3
1.7
2.9
4.9
3
2.5
0 1 2 3 4 5 6
National
Kampala
Western
Northern
Eastern
Central
Estimated number of acres
82
93
83 89
61
87
18 16 20 20 21 20
12 10 13 13 10 13 9 10 12 12 10 12 0
10
20
30
40
50
60
70
80
90
100
Central Eastern Northern Western Kampala National
Pe
rce
nta
ge
Less than 15 minutes 15-30 minutes
30-60 minutes Two hours or more
Figure 27: Acreage available per household
Figure 28: Time taken for households to reach at least one parcel of their land, by region

28
growth in Uganda.35 Out of the 3.95 million farming households just 30,000 use tractors and the
same number use irrigation.36 This high dependence on rainfed crop production exposes farmers to
the vagaries of the climate, especially to prolonged periods of low rainfall and drought. Karamoja in
the north east has a uni-modal season with unreliable climatic conditions. These are fragile, dry and
sub-humid regions where the extreme variability of rainfall and soil fertility means that farming
presents a challenge. Here, household-level production often falls short of minimum household
needs, rendering families particularly vulnerable to food insecurity. In October 2009 WFP was
providing rations to 1.15 million people living in the Karamoja region.37
Figure 29: Percentage of households using fertilizer by region
The results from the survey show that use of organic fertilizers is very low at 6%, with farmers in the
central and western regions slightly more likely to use it (10%). The use of chemical fertilizers is
almost negligible throughout the country with only 1.5% reporting use of it. Just 5% of households
use pesticides/herbicides - varying from 10% in the central region to 2% in the north (figure 29).38
Central households are generally better connected to markets (to buy inputs and sell outputs) than
those elsewhere. As figure 30 shows Ugandans, on average, have to travel around half a kilometre
to buy agricultural output/produce, agricultural input and non-agricultural produce. In the east and
especially the north farming households have to travel further to purchase the agricultural inputs
needed to boost their production.
35
Ministry of Finance Planning and Economic Development (MFPED), 2008, MAAIF, 2010 36
Ministry of Agriculture, Animal Industry and Fisheries, Statistical Abstract 2011 37
FEWSNET Food Security Outlook September 2009 – August 2010 38
Please note these statistics refer to all farmers and not just subsistence
10
3
10
6
2
3
1 2
10
5
2
3
5
0
2
4
6
8
10
12
Central Eastern Northern Western National
Pe
rce
nta
ge
Organic fertilizer
Inorganic fertilizer
Pesticide/ herbicides

29
Figure 30: Average distance of household to nearest market by region
If Uganda is to be able to feed its fast growing population it needs to increase yields in a sustainable
way. The almost total dependence on rain fed agriculture means harvests are way below their
potential especially in drought prone areas such as Karamoja where seasonal lack of stocks and
limited market supplies combine with high food prices to create recurring acute food insecurity.39
Seasonality
As discussed in the Context chapter above most of the country has two rainy seasons (March – June
and mid August – December), which gives it two growing seasons and two harvests (June - August
and November – January). Hence there is a natural variation in food availability and security as the
figure below shows with both poor diversity and energy deficiency peaks coinciding around March –
April 2010 for the bimodal regions.
Figure 31: Selected food insecurity indicators for bimodal regions (excluding the north)
39
FEWSNET Food Security Outlook, September 2009 – August 2010
0.4
0.8
1.1
0.5
0.6
0.3
0.4
0.5 0.5
0.4
0.3
0.6
0.5
0.6
0.5
0
0.2
0.4
0.6
0.8
1
1.2
Dis
tan
ce in
km
s
Selling agricultural inputs
Selling agriculturaloutputs/produce
Selling non-agriculturalproduce

30
It is the households in the five north eastern districts that are far more exposed to seasonal food
insecurity because the Karamoja region has just one rainy season and one harvest. If that harvest is
poor, as it was from 2006 – 2009, the onset of the lean season is much earlier than April, which is
when it tends to start following a good October harvest.
Since the survey is only representative at regional level we look at the north as a whole rather than
drilling down to district level. Some 74% of northern households said they had suffered drought
/irregular rains between September 2008-2009 (see figure 32), which confirms the rainfall pattern
for that year (FEWSNET). However, it should be noted that the following years have registered
rainfall patterns often beyond average likely leading to a general increase in food security and
decreasing malnutrition rates (including in Karamoja).
In the north, as figure 33 shows, households’ energy deficiency tended to peak (around 80% of
households) as early as November - December 2009, well before the usual onset of the hunger
season. From then households may have boosted their food security by increasing their
consumption of foods such as sweet potatoes and cassava, through fuel wood and charcoal sales
and collection of wild fruits and berries, according to FEWSNET. Thus, this picture does not reflect
the “normal” seasonal pattern of food availability.
Figure 33: Food energy deficiency and low diversity in northern Uganda Sept 09 - Aug 10
53
36
74
43
3
46
0
10
20
30
40
50
60
70
80
Central Eastern Northern Western Kampala National
Pe
rce
nta
ge
Figure 32: Percentage of households that experienced drought/irregular rains in previous year by region

31
Climate According to the State of Environment Report for Uganda, 2008, ‘climate change is already affecting
food security in the country through reduced production of major food crops as a result of increased
occurrence of droughts, floods, and soil erosion through landslides’ (NEMA, 2008: 82). Prolonged dry
spells hit agricultural productivity, cut yields from rain-fed agriculture, and kill livestock, while floods
pose immediate danger to lives, livelihoods and property and have the potential to cause
widespread crop damage. Temperature increases can lead to the emergence of new crop pests and
crop and animal diseases which will also endanger food security by affecting yields. Already, climate
change is thought to be adversely affecting the suitability of certain areas to the growth of
traditional food crops such as beans, cassava, maize and matoke (Oxfam, 2008).
For those that do not depend so directly on utilization of the land, such as the urban poor, the
impacts of prolonged droughts, flood events and temperature increases are still likely to impact on
food security through increased food prices.
In the north-eastern Karamoja region, consecutive years of crop failure and low livestock
productivity due to erratic weather conditions and below normal rainfall have had a strong and
adverse impact on food security throughout the sub-region. From 2001, the weather patterns have
been extreme and intense, resulting in frequent extended dry spells (2002, 2004, 2006, 2007, 2008,
2009). The 2010/2011 rainfall deficit caused an estimated loss and damage value of $1.2bn or 7.5%
of Uganda’s GDP.40
Nearly all households that experienced drought, claimed the shock had led to a decline in food
production (94%) and income (81%). When confronted with these falls in income and production,
two fifths were forced to change their dietary patterns, such as eating less preferred food, cutting
portion sizes and the number of meals they eat or skipping meals. As indicated above, some 12% of
northern households are surviving on one meal a day and nearly half of households in the north and
west eat just twice daily. This diet -related coping mechanism is coupled with relying on savings
(17%) while 11% find non-farm employment and 9% rely on help from family and friends.
Floods are also a major concern. In 2007, the eastern Teso region experienced its heaviest rainfall in
35 years (One World, 2008). An estimated 50,000 households were affected, many people faced
food insecurity due to the loss of their first and second season harvests, and water and sanitation
facilities were severely impacted (NEMA, 2008). In Butaleja district in the eastern region of Uganda,
in March 2010, floods submerged crop fields and vital infrastructure including some roads, schools
and houses (OCHA, 2010).
In March 2010, following unusually heavy rains, landslides occurred in the Bududa district of the
Mount Elgon region. Landslides buried three whole villages and caused numerous deaths. Hundreds
of households were displaced, two primary schools were destroyed and the main health centre
serving the area was severely damaged.
40
The 2010-2011 Integrated Rainfall Variability Impacts, Needs Assessment abd Drought Risk Management Strategy, Department of Disaster Risk Management, Officer of the Prime Minister

32
Sources of food The rate of dependency on bought food vs home produced indicates the extent to which households
are vulnerable to high food prices. On average Ugandans tend to derive around half of their calories
from home produced food and half from purchased but this masks a wide variation between urban
and rural households. Unsurprisingly rural households are far more likely to produce their own than
urban with 56% of their calories home produced and 38% bought compared with 12% home
produced for urban and 82% purchased. (In each case the remaining 6% is given in kind).
By region, westerners rely substantially more on their own production than the other regions: on
average 64% of the calories eaten in a western household come from own production. Meanwhile
central Ugandans are more market dependent, deriving 53% from purchase, while northerners are
equally dependent on purchase and own production. (Figure 34)
Figure 34: Share of calories by source of food and region
In rural Uganda, energy sufficiency is more closely associated with home production: among the
food energy sufficient households, 60% of their caloric consumption is derived from food they
produce compared to 52% in energy deficient households. This may be because the energy deficient
households are unable to produce sufficient quantities of food to meet their own consumption
needs and are often caloric deficient. These households presumably lack the economic means to
purchase their production shortfalls in sufficient quantities.
53
37 44
33
93
42
56 45 64
2 5 6 11
3 5
-
10
20
30
40
50
60
70
80
90
100
Central Eastern Northern Western Kampala
Pe
rce
nta
ge Share in-kind
Share from ownproduction
Share purchased

33
Figure 35: Energy deficiency/sufficiency by source of food (urban vs rural) However, energy sufficiency merely reflects whether households are able to consume enough
energy to meet their dietary needs and does not depict the quality of the diet, particularly the
consumption of micronutrient-rich foods which may not offer a lot of kilocalories. In fact, as figure
36 demonstrates, home production is more closely associated with high staple consumption, an
indicator of low diversity/poor quality diet. Households that buy a higher share of food are likely to
have a better quality diet (i.e. less than 75% of their energy comes from staples) than those who are
mostly consuming food from their own production. (i.e. in rural settings, those who gain less than
three quarters of their energy from staples buy 43% of their food, while those who gain more than
three quarters from staples buy 32%).
Thus these figures indicate that households producing their own food - most probably a staple - tend
to cover their energy needs, but not their diversity requirements.
Figure 36: Staple dependency (reflecting diet quality) levels by food source (urban vs rural)
35 42
82 83
60 52
12 11
6 6 6 6
-
10
20
30
40
50
60
70
80
90
100
energysufficient
energydeficient
energysufficient
energydeficient
Rural Urban
Pe
rce
nta
ge
Share in-kind
Share from ownproduction
Share purchased
43 32
86
64
50 63
8
27
6 6 5 9
-
10
20
30
40
50
60
70
80
90
100
Less than 75%energy from
staples
More than 75%energy from
staples
Less than 75%energy from
staples
More than 75%energy from
staples
Rural Urban
Pe
rce
nta
ge
Share in-kind
Share from ownproduction
Share purchased

34
Figure 37 shows the share of calories from each source (purchase, own production and in kind) by
the five expenditure quintiles for rural and urban Uganda. It demonstrates that the wealthiest rural
households (quintile 5) are the only quintile that is purchasing more food than they are producing
(48% vs. 46%)). These households are likely to be engaged in income generating activities beyond
subsistence agriculture and are presumably purchasing more expensive food items such as meat and
dairy. This figure also shows that households in the poorest quintile in rural Uganda are more
dependent on purchase than those in other quintiles (2-4), making them highly vulnerable to price
rises for the foods they need to buy.
For urban Uganda, the picture is reversed: the poorest (quintile 1) are more dependent on own
production than the others with calories derived from own production decreasing with each quintile.
But overall, since urban households are generally much more reliant on purchase they are more
vulnerable to fluctuating food prices.
Other shocks
As discussed above drought is the main shock reported by Ugandan households. In addition, in
central Uganda one in ten households had suffered crop pest and disease as well as serious
illness/accident of at least one income earner. Unsurprisingly income falls if a main earner is
incapacitated by illness or an accident and food production is cut if crops are diseased or damaged.
Changing patterns of eating is also the most common recourse for those hit by crop pests and
disease (a fifth are forced to employ this strategy) followed by changing cropping practices and
relying on savings (both 11%).
Meanwhile when income earners are struck by illness or accident, households tend to be more able
to rely on unconditional help from family and friends and on savings, though 8% still resort to
changing their eating patterns. See table 4.
37
33
34
36
48
63
74
86
88
88
54
62
61
60
46
27
20
11
8
5
9
6
5
5
6
10
6
3
4
7
- 20 40 60 80 100
Quintile 1
Quintile 2
Quintile 3
Quintile 4
Quintile 5
Quintile 1
Quintile 2
Quintile 3
Quintile 4
Quintile 5
RU
RA
LU
RB
AN
Percentage
Share purchased
Share from ownconsumption
Share in-kind
Figure 37: Source of calories by expenditure quintile (urban vs rural)

35
Hazard/shock Main impact on food availability and
access
Food consumption related
coping strategies
1. Drought/rainfall
deficit, a major issue
in northern Uganda
for three in four
households,
averaging 46% of
households
nationally
Almost 100% of rural households that suffer this shock report that it hits their production/harvest, thereby decreasing staple food availability. For more than 80% of households in eastern, northern and western Uganda this shock hits their income. Food prices are bound to rise and half of households say it affects their food purchases/access
The main coping strategy is to change dietary habits (39%), such as reducing portion size, relying on less preferred food or skipping meals
2. Serious illness/accident of income earner(s) reported by one in 10 households in central Uganda. Also serious illness/accident of other HH member reported by 6.2% of households
Inevitably for almost all households reporting this shock it hits their income (more than 90%) because of the reduced earning capacity. This is bound to impact on food purchases
8% changed their eating patterns involuntarily
3. Crop pests & diseases - only really reported in central and eastern Uganda by 11% and 8% of households respectively
For three quarters experiencing this shock it hits their income and, inevitably, for almost all (90% of eastern and 82% of central households) it hits food production
A fifth were forced to change their dietary patterns
4. Theft of money/theft of agricultural assets – chiefly a central issue reported by 7% and 8% of households respectively
For more than 60% this impacts on their income. Theft of agricultural assets has a high impact on food production (60%). A fifth of households that are victims of money theft are less able to purchase food.
The main coping mechanism for those whose agricultural assets have been stolen is to change eating habits (12%). 5% of those who have experienced money theft adopt food related strategies though the first recourse is to rely on savings or help from friends/relatives
Table 4: Main shocks that households experienced, their impact and how families coped
8. Drivers of malnutrition
Poor quality diet Inadequate food intake -either in quantity or quality- is an important cause of malnutrition. As we
have seen nearly half of the Ugandan population is food energy deficient while many rural Ugandans
in particular have a diet that is poor in micronutrient rich foods such as meat, fish, fruit and dairy.
Children in households that are more food insecure (using the indicators ‘share of expenditure on
food’, ‘food consumption score’, ‘dietary diversity’ and ‘high share of energy from staples’) are more
likely to be stunted. For instance, households in the western region are far more likely to have a low
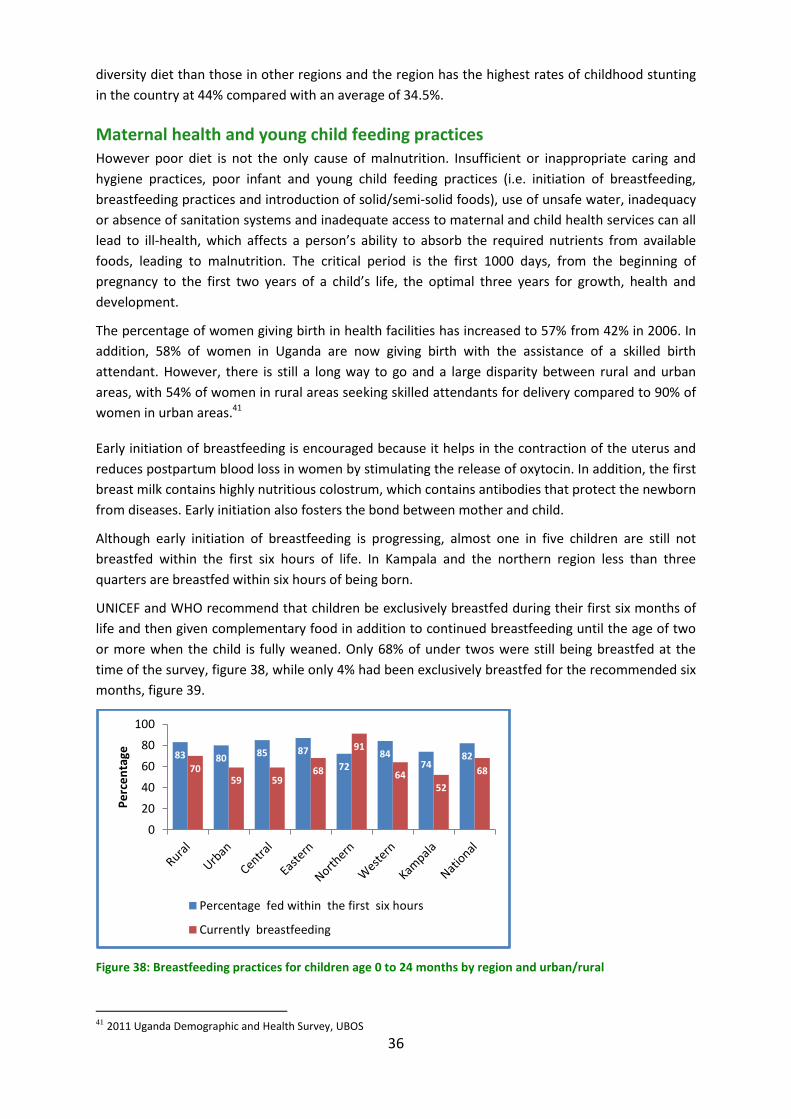
36
diversity diet than those in other regions and the region has the highest rates of childhood stunting
in the country at 44% compared with an average of 34.5%.
Maternal health and young child feeding practices However poor diet is not the only cause of malnutrition. Insufficient or inappropriate caring and
hygiene practices, poor infant and young child feeding practices (i.e. initiation of breastfeeding,
breastfeeding practices and introduction of solid/semi-solid foods), use of unsafe water, inadequacy
or absence of sanitation systems and inadequate access to maternal and child health services can all
lead to ill-health, which affects a person’s ability to absorb the required nutrients from available
foods, leading to malnutrition. The critical period is the first 1000 days, from the beginning of
pregnancy to the first two years of a child’s life, the optimal three years for growth, health and
development.
The percentage of women giving birth in health facilities has increased to 57% from 42% in 2006. In
addition, 58% of women in Uganda are now giving birth with the assistance of a skilled birth
attendant. However, there is still a long way to go and a large disparity between rural and urban
areas, with 54% of women in rural areas seeking skilled attendants for delivery compared to 90% of
women in urban areas.41
Early initiation of breastfeeding is encouraged because it helps in the contraction of the uterus and
reduces postpartum blood loss in women by stimulating the release of oxytocin. In addition, the first
breast milk contains highly nutritious colostrum, which contains antibodies that protect the newborn
from diseases. Early initiation also fosters the bond between mother and child.
Although early initiation of breastfeeding is progressing, almost one in five children are still not
breastfed within the first six hours of life. In Kampala and the northern region less than three
quarters are breastfed within six hours of being born.
UNICEF and WHO recommend that children be exclusively breastfed during their first six months of
life and then given complementary food in addition to continued breastfeeding until the age of two
or more when the child is fully weaned. Only 68% of under twos were still being breastfed at the
time of the survey, figure 38, while only 4% had been exclusively breastfed for the recommended six
months, figure 39.
Figure 38: Breastfeeding practices for children age 0 to 24 months by region and urban/rural
41 2011 Uganda Demographic and Health Survey, UBOS
83 80 85 87
72 84
74 82
70 59 59
68
91
64 52
68
0
20
40
60
80
100
Pe
rce
nta
ge
Percentage fed within the first six hours
Currently breastfeeding

37
Figure 39: Percentage of children exclusively breastfed for six months
On average infants were breastfed for 14 months, though northern and the poorest children tend to
be breastfed for longer (18 months and 16 months respectively).
Supplementary feeding is usually discouraged before the age of six months because it exposes
infants to pathogens and increases their risk of infection. In addition, it decreases infants’ intake of
breast milk and in households with low welfare levels, the supplementary food given is usually less
nutrient-dense. It is recommended that a child is introduced to solid/semi solid food and fluids at six
months since breast milk alone is no longer sufficient to maintain the child’s optimal growth.
Ugandan children are on average introduced to complementary foods at 5.4 months.
Illness, disease and immunization of young children Childhood immunization against preventable diseases as well as prompt and appropriate treatment
for diseases like malaria and diarrhoea is vital if child malnutrition is to be prevented.
On the basis of sub-clinical data, vitamin A deficiency is considered a severe public health problem
among children. Vitamin A is a fundamental micronutrient for the proper functioning of one’s
immune system, and is useful in maintaining the epithelial tissue in the body. Deficiency not only
increases the severity of some infectious diseases like measles and diarrhoea in children, but also
slows recovery from illnesses and may result in impaired vision or blindness. It can be obtained from
breast milk, other milk, liver, eggs, fish, butter, red palm oil, mangoes, papayas, carrots, pumpkins
and dark green vegetables. Since the human liver can store an adequate amount of vitamin A for
between four and six months, periodic dosing (usually every six months) is one way to ensure that
children are protected from deficiency.
Almost seven in ten children age 0 to 24 months were reported to have taken a vitamin A capsule in
the six months preceding the survey with those in urban areas (87%) and Kampala (85%) more likely
to have been given one. However, only six in ten children in northern and western Uganda were
given the capsule in the last six months before the survey.
4
3
8
3
4
2
3
4
0
1
2
3
4
5
6
7
8
9
Pe
rce
nta
ge

38
Figure 40: Vitamin A supplementation among children aged 0 to 24 months by region and urban/rural
Infection is categorized as an immediate cause of malnutrition among children (UNICEF, 1999)
because it depletes the critical body stores of protein, energy, minerals and vitamins. A dual
response on nutrition and infection is therefore needed for an optimal response in preventing the
deterioration of children’s nutritional status.
Diarrhoea is usually caused by exposure to and use of contaminated water and unhygienic practices
in food preparation and disposal of excreta. Severe diarrhoea causes dehydration and high mortality
rates. Overall, a third of under twos had diarrhoea in the two weeks preceding the survey. Again,
the poorest rural children in the northern region of Uganda were more likely to be afflicted.
Furthermore, a fifth revealed the diarrhoea contained blood rising to around a third in the north.
In spite of the risk of dehydration resulting from an episode of diarrhoea, almost half (45%) of under
fives were given the same or somewhat less to drink and 36% were given much less to drink. 42 A
fifth were given less to eat and one in ten were not given anything.
Figure 41: Percentage of children that had diarrhoea or bloody diarrhoea by region and urban/rural
42
This is how the responses were pre-coded in the questionnaire, so ‘much less’ is a subjective quantity.
69
85
61
61
76
73
87
66
0 50 100
National
Kampala
Western
Northern
Eastern
Central
Urban
Rural
Percentage
21
17
19
37
20
12
8
23
33
15
31
38
37
29
22
34
0 10 20 30 40
National
Kampala
Western
Northern
Eastern
Central
Urban
Rural
Percentage
% with diarrhoea
% with bloody diarrhoea

39
Similarly around a third (32.5%) of under twos were reported to have had a cough during which
he/she breathed faster than usual with short quick breaths, or had difficulty breathing in the two
weeks preceding the survey. There was no difference in prevalence between urban and rural
Uganda, but these acute respiratory infections were more common among children in the central
region (44%), and those from households in the lowest (39%) and, curiously, the highest (39%)
expenditure quintiles.
Malaria remains one of the leading causes of childhood morbidity and mortality in Uganda and is
usually signalled by fever. Half of the 0 to 24 month old children had a fever in the two weeks
preceding the survey though fewer did in urban areas (42%).43 Once again the prevalence was
considerably higher among children in the north (60%).
Figure 42: Percentage of children under two that had acute respiratory infection and/or fever by region and
urban/rural
The prevalence of vaccinations is a general proxy for access to healthcare. More than a quarter
(27%) of children hadn’t been vaccinated against measles and a fifth hadn’t been vaccinated against
diphtheria, pertussis (whooping cough) and tetanus. Again children in the north were less likely to be
vaccinated than elsewhere while girls were less likely to have received a measles immunisation than
boys (67% vs 71%). The poorer the household the less likely the children were to be immunised
against measles or DPT3 with the proportion having been vaccinated generally decreasing with each
decreasing expenditure quintile.
As figure 16 above shows, fewer than three quarters (72%) of households accessed improved water
overall.44 Close to four in every ten households in the western and central regions (39% respectively)
were still using non-improved sources of drinking water.
The survey findings further reveal that slightly over three-quarters (76%) of households reported
that their members usually used covered pit latrines while 7% had no access to a toilet facility,
though this average figure is highly skewed by the situation in northern Uganda, where some 23%
were still forced to defecate in the bush.
43
Note this is not a figure representing malaria itself but an association 44
Improved water sources include piped water, public taps, boreholes, protected well/spring, rain water and gravity flow schemes.
33
31
30
25
30
44
33
33
50
40
37
60
56
52
42
51
0 20 40 60 80
National
Kampala
Western
Northern
Eastern
Central
Urban
Rural
Percentage
% with fever
% with acute respiratoryinfection

40
9. Conclusion
The LSMS has proved a valuable source of food security information and this analysis has illustrated
the value of WFP collaborating with Uganda’s statistical bureau in spite of the fact that the number
of households covered were relatively few.
The report confirms that food security cannot be viewed in one dimension: while the north suffers
most from seasonal food deficits exacerbated by drought, it is in the west that lack of food diversity
and stunting are more concerning. As underlined in this report, special attention needs to be given
to the north which suffers from so many of the factors that underlie food insecurity and malnutrition
such as regular rainfall deficits, the effects of a long conflict, low education levels and extreme
poverty. Lower level analysis, particularly in these regions is required to ascertain how programme
and policy decisions could target these areas.
The poorest sections of society have been excluded from Uganda’s steady economic transformation.
The absolute numbers of poor are likely to rise if so many continue to remain illiterate and if the
fertility rate and population growth does not abate. Poverty is entrenched in rural areas and the
poorer the household, the more likely it is to be food energy deficient, to have low dietary diversity,
derive more energy from staples and have poor or borderline food consumption. In addition, the
poorest rural households are more market dependent than the middle quintiles, meaning they are
more exposed to high food prices, which have hit Ugandans in recent years largely due to poor
harvests prompted by rainfall deficits, that have disrupted the expected seasonal pattern.
Illiteracy rates remain appallingly high especially amongst women in northern and eastern Uganda.
This urgently needs addressing to help women out of a cycle of low paid work, poverty and poor
child feeding and caring practices.
Smallholder farmers need to be able to invest in inputs and improved techniques, but are prevented
from doing so since they lack income opportunities and access to credit. They need inputs and
infrastructures to be able to take full advantage of Uganda’s fertile soils and abundant water sources
in order to boost their yields, as well as to protect them from the unpredictable vagaries of Uganda’s
climate, such as rainfall shortages, floods and rising temperatures.
A household’s overall food security status greatly impacts on the nutritional status of the under
fives. This is very much the case in western Uganda where stunting rates are at their highest and
dietary diversity is the most limited.
But other factors need to be addressed to improve child nutrition in Uganda. Morbidity rates in
children could be lowered by improving hygiene practices and treatment for diarrhoea, boosting
immunisation and vitamin A coverage, and taking action to lower malaria rates. Programmes must
be created (or scaled up if they already exist) to promote the benefits of early initiation of
breastfeeding and adequate child feeding practices.

41
Annex I Overview of the food security situation in Uganda Table A1
Food Quantity Food Quality Economic Vulnerability
Calories per
capita per day
Calories per adult equiv.per
day
% pop. energy
deficient
Mean share
of calories
from staples
% of HHs with
> 75% energy
from staples
Mean FCS
% of HHs with poor
food consumptio
n
% of HHs with
borderline food consum
ption
Mean dietary
diversity score
% HHs consuming
<=4 food groups
Poverty head-count
Mean share of exp. on
food
% HHs with >
65% of exp. on
food
% HHs with
>75% of exp. on
food
# obs
National 2167 2958 47.6 68.8 42.6 52 4.7 15.6 4.8 38.7 25.7 50.7 29.6 4 2523
Rural / Urban
Rural 2147 2954 47.4 71 47.7 50 4.6 16.9 4.7 42.5 29.1 53 36.1 4.5 1952
Urban 2271 2978 48.6 58.5 19.5 60 4.9 9.9 5.4 22.1 7.9 40.3 8 1.8 571
Region
Kampala 2412 3129 45.9 54.2 10.4 62 6.2 8.6 5.5 21.7 1.9 38.4 3.5 1.5 183
Central without Kampala
2160 2936 46.3 67.7 40.6 53 6 14.6 5 32.6 15.1 46.8 20.1 4 575
Eastern 2223 3075 43.3 73.6 53.9 52 3.8 20.4 4.9 36.6 26.1 53 35.5 4 584
Northern 1910 2637 58.9 64.8 33.6 48 6.2 15.8 4.8 35.3 43.5 55.6 45.3 6.3 613
Western 2238 3050 45.5 73.1 51.3 52 2.6 14.6 4.3 54.8 29.2 52.8 36.8 3.1 568
Expenditure quintile
Quintile 1 1227 1698 83 75 59.8 36 14.6 35.8 3.8 73.8 56.8 48.4 7.2 453
Quintile 2 1817 2514 60.9 72.8 53.3 46 2.3 20.8 4.4 48.8 55.9 43.5 4.4 493
Quintile 3 2219 3066 40.8 71.6 47.9 51 2.8 13.1 4.8 39 53.9 40.2 2.7 484
Quintile 4 2582 3581 26.9 68.3 38.5 58 0.3 9.2 5.3 25 50.9 27.3 3.5 504
Quintile 5 3058 4016 24.3 59.1 21.3 64 4.6 4.8 5.6 17.4 39.3 9.6 2.9 589
Sex of head
Male 2191 2982 46 69.3 43.8 53 4.5 14 4.9 35.9 24.7 50.7 29.1 3.7 1791
Female 2090 2880 52.6 67.7 39.5 49 5.2 19.9 4.6 45.8 29 50.5 30.9 4.9 732

42
Food Quantity Food Quality Economic Vulnerability
Calories per
capita per day
Calories per adult equiv.per
day
% pop. energy
deficient
Mean share of calories
from staples
% of HHs
with > 75%
energy from
staples
Mean FCS
% of HHs with poor
food consumption
% of HHs with
borderline food
consumption
Mean dietary
diversity score
% HHs consuming
<=4 food groups
Poverty head-count
Mean share of exp. on
food
% HHs with >
65% of exp. on
food
% HHs with
>75% of exp. on
food
# obs
Liv
elih
ood g
roups
Rural mixed subsistence farming and non farm enterprising
2292 3163 43.1 71.5 47.8 53 2 13.1 5 29.4 26.2 53 32 3 502
Commercial Farming
2172 3025 54.5 65.8 31.6 58 0 5.8 5.1 31.8 22.2 47.5 18.5 1.9 47
Wage Employment
2106 2874 46.7 64.7 35.5 53 5.7 15.6 4.8 38 22.7 48.9 26.5 4.9 509
Non-agric Enterprises
2109 2852 50.6 65.1 33.4 56 5.9 11.1 5 33.2 19.3 46.5 20.2 2.7 521
Property Income 2525 3262 41.5 63.8 30.5 63 0 11.8 5.7 16.5 0 37.4 5.9 0 41
Transfers (pension, allowances, social security)
2118 2760 48.4 65.3 31.3 59 7.8 13.4 4.7 44.1 8.8 40.9 7.8 3.2 34
Remittances 2063 2817 48.3 69.1 47.7 46 10 23.2 4.4 49.5 24.3 50.4 32.1 6.5 129
Rural mixed subsistence only
2120 2926 48.3 73.5 52.8 47 3.7 20.8 4.4 51.8 36.6 56 45.5 5 442
Subsistence crop farming and local remittances
2177 2951 51.6 73.5 53.8 46 5.5 19.8 4.5 47.1 30.4 53.9 44.9 5.6 199
Urban subsistence agriculture
2242 2865 51.9 67 35.8 52 4.8 20 4.9 33.6 18.8 45.1 15.4 2.2 93

43
Annex 2 Market integration and prices
Table A2 Correlation coefficient of first differences for wholesale maize prices in selected Uganda markets
Markets Arua Kabale
Kamplala/ Kisenyi Kiboga Lira Masaka Masindi Mbarara Soroti Tororo
Arua 1
Kabale .538** 1
Kamplala/ Kisenyi .369
** .477
** 1
Kiboga .532
** .537
** .797
** 1
Lira .393
** .587
** .703
** .723
** 1
Masaka .529
** .734
** .711
** .799
** .803
** 1
Masindi .412
** .532
** .851
** .865
** .774
** .811
** 1
Mbarara .648
** .652
** .487
** .678
** .672
** .807
** .622
** 1
Soroti .634
** .627
** .649
** .766
** .669
** .798
** .768
** .798
** 1
Tororo .559
** .587
** .785
** .854
** .744
** .821
** .862
** .722
** .851
** 1
**. Correlation is significant at the 0.01 level (2-tailed).
Table A3 Correlation coefficient in first differences for wholesale beans prices in selected Uganda markets
Markets Kampala/ Kiseyni Arua Kabale Kiboga Masaka Masindi
Mbarara Soroti Tororo
Kampala/ Kiseyni
1
Arua .688** 1
Kabale .536
** .611
** 1
Kiboga .703
** .679
** .627
** 1
Masaka .717
** .713
** .740
** .706
** 1
Masindi .710
** .624
** .651
** .728
** .753
** 1
Mbarara .699
** .694
** .610
** .763
** .788
** .663
** 1
Soroti .701
** .806
** .695
** .717
** .763
** .756
** .740
** 1
Tororo .717
** .694
** .741
** .801
** .780
** .736
** .780
** .814
** 1
**. Correlation is significant at the 0.01 level (2-tailed).
Annex 3 Caloric computation Uganda based on UNPS 2009/10 We have followed FAO, 2008 and IFPRI’s (Smith, 2007) guidelines for calculating calories per capita. In particular, for items with missing on quantity or conversion factor we impute the caloric consumption by dividing the value of the consumption by the cost per calorie. This is mainly consumption in restaurants, but includes also some “other” food groups. Note that the caloric figures as presented in UBoS, Statistical Abstract 2010, do not include imputation of calories, the figures stated in this report are given in Table . For comparison, following the similar method the caloric figures from 2009-10 give results as Table A5, column 3. Column 2 shows the results when
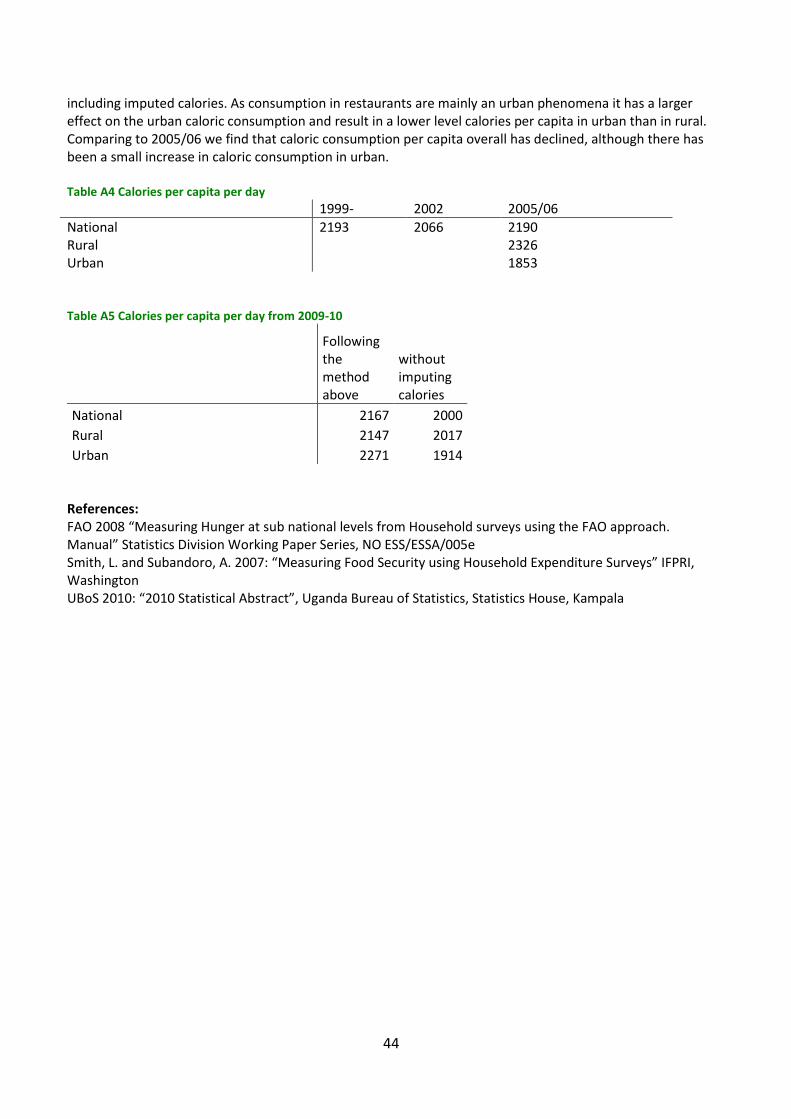
44
including imputed calories. As consumption in restaurants are mainly an urban phenomena it has a larger effect on the urban caloric consumption and result in a lower level calories per capita in urban than in rural. Comparing to 2005/06 we find that caloric consumption per capita overall has declined, although there has been a small increase in caloric consumption in urban. Table A4 Calories per capita per day
1999- 2002 2005/06
National 2193 2066 2190 Rural 2326 Urban 1853 Table A5 Calories per capita per day from 2009-10
Following the method above
without imputing calories
National 2167 2000
Rural 2147 2017
Urban 2271 1914 References: FAO 2008 “Measuring Hunger at sub national levels from Household surveys using the FAO approach. Manual” Statistics Division Working Paper Series, NO ESS/ESSA/005e Smith, L. and Subandoro, A. 2007: “Measuring Food Security using Household Expenditure Surveys” IFPRI, Washington UBoS 2010: “2010 Statistical Abstract”, Uganda Bureau of Statistics, Statistics House, Kampala