uganda bureau of statistics
TRANSCRIPT

UGANDA BUREAU OF STATISTICS
MIGRATION AND TOURISM
Report IV (2002 – 2006)
THE UGANDA BUREAU OF STATISTICS P.O. BOX 7186, KAMPALA, TEL: 041 – 70 6000 Fax: 041 - 237553 E-mail: [email protected]
Website: www.ubos.org January 2008
Migration and Tourism Statistics 2002 - 2006
i
PREFACE:
Tourism is a fast growing sector in the Ugandan economy. It is therefore important that reliable,
accurate and timely statistics about the sector are made available for policy formulation, planning,
regulation, marketing and monitoring and evaluation of the tourism sector. Of special interest is
the volume of tourists, their characteristics and their expenditures in Uganda.
The Uganda Bureau of Statistics (UBOS) in fulfilling its mandate as the source of official
information is glad to release this Migration and Tourism Report V. This is the fifth report in the
series, previous ones having been published in 1995, 2001, 2003 and 2005. The current report
presents the salient findings based on information collected from immigration cards and national
parks for the years 2002 to 2006.
The Uganda Bureau of Statistics wishes to recognize and appreciate the support from sister
government ministries and agencies. These include the Immigration Department in the Ministry of
Internal Affairs, which is the source of the Immigration Cards, The Ministry of Tourism, Trade and
Industry, and the Uganda Wildlife Authority.
John B. Male Mukasa
EXECUTIVE DIRECTOR

Migration and Tourism Statistics 2002 - 2006
ii
TABLE OF CONTENTS:
PREFACE:.........................................................................................................................................i TABLE OF CONTENTS: .................................................................................................................. ii List of Figure .................................................................................................................................... iii Tables: ............................................................................................................................................. iii Glossary of Terms: .......................................................................................................................... iv 1.1 Background............................................................................................................................... 1 1.2 Source of data: ......................................................................................................................... 1 1.3 Arrangement of this report........................................................................................................ 3 2. International Arrivals.................................................................................................................. 4 2.1 Total Arrivals............................................................................................................................. 4 2.2 Arrivals by Entry point............................................................................................................... 4 2.3 Arrivals by mode of Transport .................................................................................................. 5 2.4 Arrivals by Sex: 2002 – 2006.................................................................................................... 6 2.5 Arrivals by Age: 2002 – 2006 ................................................................................................... 7 3. International Departures ............................................................................................................. 9 3.1 Total departures ....................................................................................................................... 9 3.2 Total departures by mode of transport ..................................................................................... 9 3.3 Departures by sex .................................................................................................................. 10 3.4 Total departures by exit point ................................................................................................. 11 4.0 Gross and Net Movements..................................................................................................... 13 4.1 Gross movements .................................................................................................................. 13 4.2 Net movements ...................................................................................................................... 13 5.0 Tourism................................................................................................................................... 14 5.1 Visitor arrivals ......................................................................................................................... 14 5.2 Visitor arrivals by place of origin 2004 – 2006........................................................................ 15 5.3 Visitor arrivals by month 2002 – 2006 .................................................................................... 15 5.4 Visitor arrivals by mode of transport ....................................................................................... 16 5.6 Visitor - arrivals by purpose of visit......................................................................................... 18 5.7 Visitor - arrivals by usual country of residence....................................................................... 19 5.8 Visitors to the National Parks ................................................................................................ 21

Migration and Tourism Statistics 2002 - 2006
iii
List of Figure
Figure 1.1: Map of Uganda showing entry/exit points ..................................................................... 2 Figure 2.1: Total Arrivals (‘000’s) from 2002 - 2006 ....................................................................... 4 Figure 2.2: Total Arrivals by main entry points in 2006 .................................................................. 5 Figure 2.3: Arrivals by mode of transport; 2002 – 2006 .................................................................. 6 Figure 2.4: Percentage total arrivals by sex: 2002 – 2006.............................................................. 7 Figure 3.1: Total departures ‘000’ from 2002 – 2006 ...................................................................... 9 Figure 3.2: Departures ‘000’ by mode of transport 2002–2006..................................................... 10 Figure 3.3: Percentage Departures by sex from 2002 – 2006 ...................................................... 11 Figure 3.4: Percentage departures by exit point from 2002 – 2006 .............................................. 12 Figure 5.1: Visitor arrivals by year 2002- 2006.............................................................................. 14 Figure 5.2: Percentage Visitor arrivals by region of origin 2004- 2006 ......................................... 15 Figure 5.4: Visitor arrivals by mode of transport, 2001 – 2004 ..................................................... 17 Figure 5.5: Visitor arrivals through Entebbe Airport (000’s) .......................................................... 18 Figure 5.6: Visitors (Citizens and Foreigners) to National Parks (000’s) ...................................... 21
Tables:
Table 4.1: Gross and net movements ........................................................................................... 13 Table 5.1: Visitor - arrivals by month 2002 - 2006......................................................................... 16 Table 5.2: Percentage visitor arrivals by purpose of visit .............................................................. 19 Table 5.3: Percentage distribution of visitor arrivals by country of residence 2002 - 2006........... 20 Appendix Tables: ........................................................................................................................... 22 Table A1: Total Arrivals and Departures in Uganda, 2002 – 2006............................................... 22 Table A2: Total Arrivals by sex, 2003- 2006 ................................................................................. 22 Table A3: Total arrivals by age group, 2004 – 2006 ..................................................................... 22 Table A4: Entebbe Arrivals, 2002– 2006..................................................................................... 23 Table A5: Migration Statistics: Entebbe Departures, 2002 - 2006 ................................................ 23 Table A6: Migration Statistics: Malaba and Busia Arrivals, 2002 – 2006...................................... 24 Table A7: Migration Statistics: Malaba and Busia Departures, 2002 – 2006................................ 24 Table A8: Migration Statistics: Mutukula, Western and Northern Borders Arrivals, 2002 – 2006. 25 Table A9: Migration Statistics: Mutukula, Western and Northern Borders .................................... 25 Table A10: Tourist arrivals by country of usual residence, 2002 - 2006 ....................................... 26 Table A11: Percentage tourist arrivals by country of residence, 2002 - 2006 ............................. 27 Table A12: Tourist Arrivals by Month 2002 – 2006 ....................................................................... 28 Table A13: Tourism basic indicators, 2002 – 2006 ....................................................................... 28 Table A14: Visitors to the National Parks (Citizen and Foreigners) 2002 – 2006......................... 29

Migration and Tourism Statistics 2002 - 2006
iv
Glossary of Terms:
The following concepts and definitions have been adopted in this release, which are in conformity with the definitions adopted by the World Tourism Organization (WTO) and the Statistical Division of the United Nations.
Arrivals: refer to both Visitors and Residents entering Uganda through formal entry points.
Departures: refer to both Visitors and Residents leaving Uganda via formal exit points.
Tourism: comprises the activities of persons travelling to and staying in places outside their usual environment for not more than one consecutive year for leisure, business and other purposes not related to the exercise of an activity remunerated from within the place visited.
Visitor: refers to any person travelling to a place other than that of his/her usual environment for less than 12 consecutive months and whose main purpose of the trip is other than the exercise of an activity remunerated from within the place visited.
A Tourist: is a visitor who stays at least one night in collective or private accommodation in the place visited.
An international visitor: is an international visitor who stays at least one night in collective or private accommodation in the country visited.
A Traveller: is any person on a trip between two or more localities. An international traveller refers to any person on a trip between two or more localities in different countries.
Ugandan residents: are persons residing in Uganda (Uganda citizens and persons with
permanent residence from other countries) who leave the country temporarily.

Migration and Tourism Statistics 2002 - 2006
1
1. Background
1.2 Source of data:
Uganda is a land locked country and has common borders with Kenya in the East, Sudan in the
North, Tanzania and Rwanda in the South and Democratic Republic of Congo to the West. There
are several gazatted entry/exit points along the territorial boundaries. Legal movements across
Ugandan borders as well as formal immigration into Uganda are controlled by Directorate of
Passport and Citizenship, under the jurisdiction of the Ministry of Internal Affairs. Information on
formal movements of a person is obtained from all points of entry/exit. Information on both arrival
and departure cards (see Appendix 2) that are administered by the Immigration Department staff
and later cards are delivered at UBOS for data capture.
Statistics collected from persons using those entry/exit points include among others classification
by port of entry, Country of usual residence, purpose of entry, mode of travel, age and sex of
persons arriving and departing.
Information about visitors to the National Parks is obtained from the Uganda Wildlife Authority
(UWA).

Migration and Tourism Statistics 2002 - 2006
2
Figure 1.1: Map of Uganda showing entry/exit points
Map of Uganda showing entry/exit pointsN
%
%
%
%
%
%
%
% %%
% % %
%
% %
%
%
%
%
Oraba
Lia
Vurra
Goli
Mpondwe
Ishasha
Kyanika
Katuna
Kamwezi
Merami Kikagati Mutukula
Entebbe
Port be llBusia
Malaba
Lwakhakha
Suam river
TANZANIA
RWANDA
DR CONGO
SUDAN
KENYA
Bunagana
Atiak
100 0 100 200 Km
Figure 1.1 shows the official entry points, which include Entebbe International Airport.

Migration and Tourism Statistics 2002 - 2006
3
1.3 Arrangement of this report
In addition of this chapter, chapters 2 and 3 look at the international arrivals and
departures respectively. Chapter 5 isolates the tourists from all the arrivals.
For purposes of presentation of results by entry/exit points 4 major points have
been identified namely Entebbe, Malaba, Busia and Katuna

Migration and Tourism Statistics 2002 - 2006
4
2. International Arrivals
Arrivals refer to international travellers entering Uganda through formal entry points respective of their residence status.
International movements have been increasing for the past 2 decades as shown in appendix Table A1.
2.1 Total Arrivals
The total annual arrivals in the past five years (2002 – 2006) generally have been increasing as illustrated in Figure 2.1 below. Total arrivals increased from 524,000 in 2002 to 770,000 in 2006 a 47 percent in five years. This gives an average increase of 49,200 persons per year. However the year 2005 experienced a decline in arrivals, this might be attributed to slow business in Kenya and some misunderstanding with Rwanda.
Figure 2.1: Total Arrivals (‘000’s) from 2002 - 2006
524
586
738
662
770
0
100
200
300
400
500
600
700
800
900
2002 2003 2004 2005 2006
Year
Total arrivals (000's)
2.2 Arrivals by Entry point
Figure 2.2 shows that most of the travellers in into the country come in through Entebbe Airport and the level of traveller for the past five years has been increasing steadily from about 170,000 arrivals in 2002 to 305,000 arrivals in 2006.
Total Arrivals increased by 16% between 2005 to 2006.

Migration and Tourism Statistics 2002 - 2006
5
The Figure 2.2 below reveals that Katuna border post has also an increase in the traffic flows while Busia and Malaba traffic flows has been up and down.
Figure 2.2: Total Arrivals by main entry points in 2006
0
50,000
100,000
150,000
200,000
250,000
300,000
350,000
Entebbe Katuna Busia Malaba Mutukula Other
Entry point
Arrivals
2002 2003 2004 2005 2006
The share of Entebbe Airport in the total arrivals has also increased over time from 32 percent in 2002 o 39 percent in 2006.
2.3 Arrivals by mode of Transport
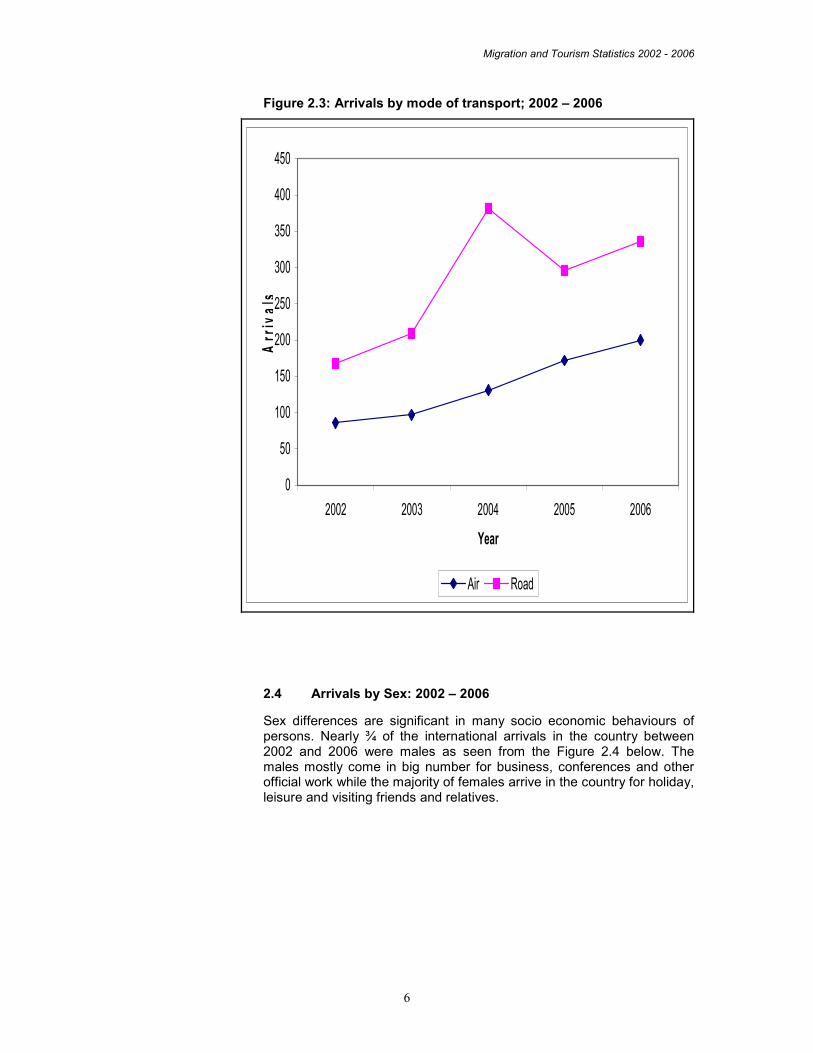
The ‘mode of transport’ used in a trip is defined as the conveyance used to cover the greatest distance. Two major types are identified in Uganda namely Air and Road transport. Very few travellers use Water transport at Port Bell. Figure 2.3 below shows the number of arrivals by mode of transport,
between 2002 and 2006. Road transport was the most commonly used
mode of international arrivals in Uganda this is attributed to the country
being land locked. Out of the 769,662 international arrivals in 2006, 60
percent used road transport and the remaining 40 percent used air.
However, it has been noted that there was a steady increase in
international arrivals using air transport. The share has increased from
32 percent in 2002 to 40 percent in 2006.
Arrivals by Air dominated total arrivals in all year except 2004.
Migration and Tourism Statistics 2002 - 2006
6
Figure 2.3: Arrivals by mode of transport; 2002 – 2006
0
50
100
150
200
250
300
350
400
450
2002 2003 2004 2005 2006
Year
Arr
ivals
Air Road
2.4 Arrivals by Sex: 2002 – 2006
Sex differences are significant in many socio economic behaviours of persons. Nearly ¾ of the international arrivals in the country between 2002 and 2006 were males as seen from the Figure 2.4 below. The males mostly come in big number for business, conferences and other official work while the majority of females arrive in the country for holiday, leisure and visiting friends and relatives.

Migration and Tourism Statistics 2002 - 2006
7
Figure 2.4: Percentage total arrivals by sex: 2002 – 2006
70
27 28 3027 26
72 747373
0
10
20
30
40
50
60
70
80
2002 2003 2004 2005 2006
Year
Perc
enta
ge
Male Female
2.5 Arrivals by Age: 2002 – 2006
There are considerable differences in motives of travel between different age groups. The Figure 2.5 below reveals that the majority of international travelers are in the age group 25 – 44 years the group which is relatively young, economically active people and traveling mainly a family their percentage is above 50 percent for the years under consideration. Travellers aged 45-64 years constitute over 20 percent of all travellers comprise of middle-aged, economically active people and traveling mainly without children. The youngsters, constituting the important market of youth travel comes third in the row and those in 65+ take the forth position and are mainly considered a retired.

Migration and Tourism Statistics 2002 - 2006
8
Figure 2.5: Percentage arrivals by age group: 2002 - 2006
12.3
55.4
22.9
2.1
55.9
14.4
2.7
22.3
1.83.02.6
4.7
55.4
13.4
2.9
22.3
2.1 4.0
0.0
10.0
20.0
30.0
40.0
50.0
60.0
0-14 15-24 25-44 45-64 65+ not stated
Age
Perc
entage
2004 2005 2006

Migration and Tourism Statistics 2002 - 2006
9
3. International Departures
Departures are persons moving out of the country through gazzeted exit points. This is irrespective of the citizenship or residence status.
3.1 Total departures
There was a general increase in departures from 510,000 in 2002 to
756,000 in 2006. However, there was a decline in departure in the year
2005. The decline in the departures in 2005 was attributed to mainly to
the slow business opportunities in Kenya, Tanzania and Rwanda as
travelers to those countries there main purpose is business.
Figure 3.1: Total departures ‘000’ from 2002 – 2006
510,014
567,806
696,350
578,220
755,876
0
100,000
200,000
300,000
400,000
500,000
600,000
700,000
800,000
2002 2003 2004 2005 2006
Years
Departure
s
3.2 Total departures by mode of transport
Figure 3.2 below shows that most departures from the country were by
road and it increased between 2002 and 2006. The number of persons
who left the country by air has also been growing at a slow rate as seen
from the Figure 3.2 below.

Migration and Tourism Statistics 2002 - 2006
10
Figure 3.2: Departures ‘000’ by mode of transport 2002–2006
174192
205227
308
336
376
491
351
448
0
100
200
300
400
500
600
2002 2003 2004 2005 2006
Years
Departures '000'
Air Road
3.3 Departures by sex
Figure 3.3 below reveals that there were more males leaving the country
compared to the females in all years under consideration. Overall, the
majority of the departures from the country to other countries were males
constituting of over 70 percent in al years.

Migration and Tourism Statistics 2002 - 2006
11
Figure 3.3: Percentage Departures by sex from 2002 – 2006
71 70 72
27 29 30 28 26
7473
0
10
20
30
40
50
60
70
80
2002 2003 2004 2005 2006
Year
Perc
enta
ge d
eparture
s
Male Female
3.4 Total departures by exit point
Each port of exit from a country is specific to a given mode of transport,
and therefore analysis of mode of transport can be undertaken from port
of exit statistics. The greatest number of persons departing from Uganda
to other countries through single exit point uses mostly air transport
through Entebbe Airport which accounted for 40 percent in 2006, Busia
and Katuna registered 37 percent each and other border posts
contributed the least percent of 23 percent of the total departure in the
same year.

Migration and Tourism Statistics 2002 - 2006
12
Figure 3.4: Percentage departures by exit point from 2002 – 2006
39.7
22.5
14.8
2.9 3.2
17.0
0
5
10
15
20
25
30
35
40
45
Entebbe Katuna Busia Malaba Mutukula Other
Exit point
Perc
enta
ge
2002
2003
2004
2005
2006

Migration and Tourism Statistics 2002 - 2006
13
4.0 Gross and Net Movements
This chapter looks at the gross and net movements over time.
4.1 Gross movements
Gross movements are the sum of all travels (arrivals and departures).
This information is useful in managing the capacity of entry/exit points.
Table 4.1: Gross and net movements
Year Arrivals Departures Net migration Gross (arrivals plus
departures)
2002 524,000 510,000 14,000 1,034,000
2003 586,000 568,000 18,000 1,154,000
2004 738,000 696,000 42,000 1,434,000
2005 662,000 578,000 84,000 1,240,000
2006 769,000 756,000 13,000 1,525,000
Overall the trend shows an increasing number of international travel from
1 million in 2002 to 1.5 in 2006, representing 48 percent increase in the 5
year period (7.7% per annum). If this rate is maintained the total flow is
expected to increase to 2.3 million in 2011.
4.2 Net movements
Net movement is the difference between arrivals and departures. It
reflects the net addition to the country’s population because of
international travel.
Table 4.1 above shows the net addition to the country’s population is
minimal e.g only 172,000 over 5-year period. This constitutes less than 1
percent of the total population of the country in 2006. Because of the
small population of this population, no deeper analysis on the
characteristics of the net movement is done.

Migration and Tourism Statistics 2002 - 2006
14
5.0 Tourism
Visitor arrivals are persons travelling to a place other than that of their
usual environment for less than 12 consecutive months and whose main
purpose of the trip is other than the exercise of an activity remunerated
from within the place visited.
One of the sources of tourism statistics is the immigration registration
form (arrival and departure cards) completed by an international traveler
at the point of arrival/departure, from the country. These cards provide a
wide range of information of relevance for the planning, marketing and
monitoring of tourism in the country. Table A10 shows that 70 percent of
the total arrivals into Uganda came for tourism in 2006.
5.1 Visitor arrivals
There were about 540,000 visitor arrivals out of 770,000 total arrivals in
the country this was more than 2/3 of total arrivals. There was an
increase in the number of visitor arrivals from about 470,000 in 2005 to
540,000 in 2006, representing a growth of 15 percent. It is believed that
improved security in the northern Uganda and economy has contributed
to the growth of the Tourism sector; where by a number of visitors come
into Uganda for various reasons.
Figure 5.1: Visitor arrivals by year 2002- 2006

Migration and Tourism Statistics 2002 - 2006
15
5.2 Visitor arrivals by place of origin 2004 – 2006
Figure 5.2 below shows that most visitors - arrivals in the country were
from Africa, which accounted for over 70 percent of all arrivals, Europe
contributes second largest number of visitors, while America comes third
in ranking and mostly residents of the United States of America.
Figure 5.2: Percentage Visitor arrivals by region of origin 2004- 2006
0
10
20
30
40
50
60
70
80
90
Africa AMERICA ASIA EUROPE Middle East OCEANIA Other/not
stated
Region
Percentage
2004 2005 2006
5.3 Visitor arrivals by month 2002 – 2006
Table 5.1 below shows visitor - arrivals by month for the period 2002 –
2006. The monthly distributions for the years 2004 - 2006 showed that
there is no clear pattern of in the visitor arrivals in the years under
consideration. In the year 2006 the peak period was in the months of
August and September, while in the year 2005 the peak was realized in
the months of March and May.

Migration and Tourism Statistics 2002 - 2006
16
Table 5.1: Visitor - arrivals by month 2002 - 2006
Month
2002
2003
2004
2005
2006
January 20,000 23,000 45,000 38,000 29,000
February 18,000 24,000 43,000 36,000 35,000
March 19,000 23,000 48,000 45,000 42,000
April 18,000 22,000 46,000 42,000 41,000
May 22,000 16,000 50,000 47,000 42,000
June 20,000 23,000 35,000 34,000 48,000
July 25,000 29,000 36,000 41,000 48,000
August 23,000 24,000 40,000 44,000 52,000
September 25,000 30,000 41,000 37,000 51,000
October 24,000 32,000 42,000 32,000 49,000
November 17,000 25,000 40,000 34,000 47,000
December 24,000 36,000 46,000 37,000 51,000
Total 254,000 306,000 512,000 468,000 539,000
5.4 Visitor arrivals by mode of transport
Figure 5.4 below shows road transport as the most commonly used
mode of travel for visitor - arrivals. In the year 2006, Uganda received
about 539,000 visitors, of whom 336,000 arrived in the country by road.
This is due to the fact that most visitors into the country come from
mainland Africa especially from our neighbour Kenya and Rwanda. Air
transport through recorded about 200,000 arrivals in the same year and
most of the visitors by air come from overseas mainly from Europe and
America.
Generally visitor arrivals by air have steadily increasing and road
transport from 2002 – 2004 increased and later in 2005 declined and
then increased again in 2006.

Migration and Tourism Statistics 2002 - 2006
17
Figure 5.4: Visitor arrivals by mode of transport, 2001 – 2004
0
50
100
150
200
250
300
350
400
450
2002 2003 2004 2005 2006
Year
Arrivals
Air Road
5.5 Arrivals through Entebbe Airport The Figure 5.5 above reveals that there is a continuous increase in the number of visitor arrivals through Entebbe Airport since 2002. Most overseas visitors into Uganda pass through Entebbe Airport and on average the Airport handles 137,000 visitor arrivals per year (2002 – 2006). A 16% increase in traffic flows of visitors through Entebbe International airport was recorded between 2005 and 2006.

Migration and Tourism Statistics 2002 - 2006
18
Figure 5.5: Visitor arrivals through Entebbe Airport (000’s)
8697
131
172
200
0
50
100
150
200
250
2002 2003 2004 2005 2006
Year
No. of visitors
5.6 Visitor - arrivals by purpose of visit
Table 5.2 provides information on the percentage distribution of visitor
arrivals by purpose of visit into the country. Of the total number of visitors
17 percent came to visit friends and relatives in 2006, then 13 percent
traveled into the country for business and workshops and only 6 percent
indicated that they came into the country for leisure, recreation and
holidays in the same year 2006.
Those who came for other reasons and who didn’t state the reason of
entry, accounted for 64 percent of the total visitor arrivals. The higher
percentage of other category is due to poor administration of the entry
forms during filling by the travelers at the entry points.
Entebbe traffic inflow
increased by 16%.
Migration and Tourism Statistics 2002 - 2006
19
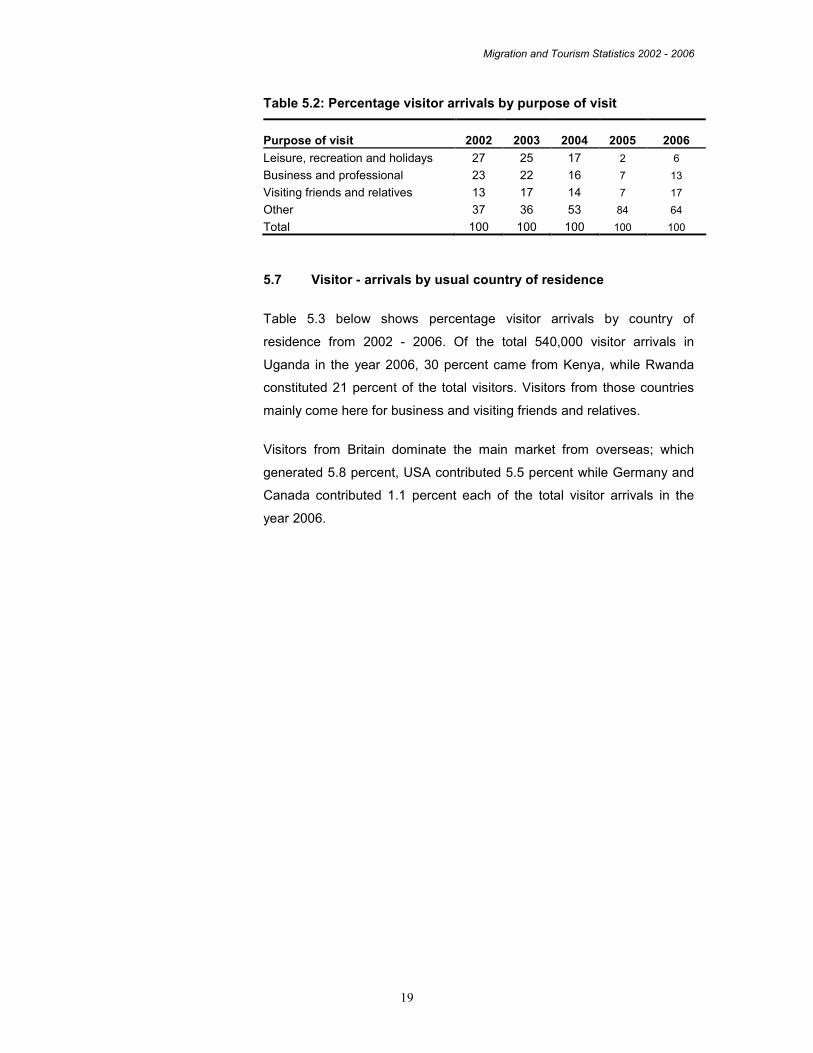
Table 5.2: Percentage visitor arrivals by purpose of visit
Purpose of visit 2002 2003 2004 2005 2006
Leisure, recreation and holidays 27 25 17 2 6
Business and professional 23 22 16 7 13
Visiting friends and relatives 13 17 14 7 17
Other 37 36 53 84 64
Total 100 100 100 100 100
5.7 Visitor - arrivals by usual country of residence
Table 5.3 below shows percentage visitor arrivals by country of
residence from 2002 - 2006. Of the total 540,000 visitor arrivals in
Uganda in the year 2006, 30 percent came from Kenya, while Rwanda
constituted 21 percent of the total visitors. Visitors from those countries
mainly come here for business and visiting friends and relatives.
Visitors from Britain dominate the main market from overseas; which
generated 5.8 percent, USA contributed 5.5 percent while Germany and
Canada contributed 1.1 percent each of the total visitor arrivals in the
year 2006.

Migration and Tourism Statistics 2002 - 2006
20
Table 5.3: Percentage distribution of visitor arrivals by country of
residence 2002 - 2006
Country of Residence 2002 2003 2004 2005 2006
Africa
Kenya 31.7 37.4 42.929.6 29.8
Tanzania 9.3 10.0 13.31.3 0.9
Rwanda 20.6 16.4 12.817.2 20.7
Other Africa 14.3 12.9 10.4 12.3 14.2
AMERICA
USA 4.7 4.3 3.74.7 5.2
Canada 0.9 0.8 0.71.1 1.1
Other America 0.3 0.2 0.20.3 0.3
ASIA
India 2.2 2.2 1.82.3 2.2
China 0.4 0.4 0.40.5 0.5
Japan 0.2 0.2 0.20.3 0.3
Other Asia 0.8 0.8 1.1 1.3 1.1
EUROPE
United Kingdom 6.0 5.6 4.46.0 5.8
Germany 1.3 1.2 0.81.1 1.1
Netherlands 0.9 0.8 0.61.0 1.0
Other Europe 5.1 5.3 3.7 5.2 5.3
Middle East 0.5 0.5 0.40.6 0.6
OCEANIA
Australia 0.4 0.4 0.40.7 0.7
New Zealand 0.1 0.1 0.10.1 0.1
Other & Not Stated 0.3 0.5 2.12.8 0.8
Total Percentage 100.0 100.0 100.0100.0 100.0
Total Arrivals 254,219 305,720 512,379467,728 538,586
Migration and Tourism Statistics 2002 - 2006
21
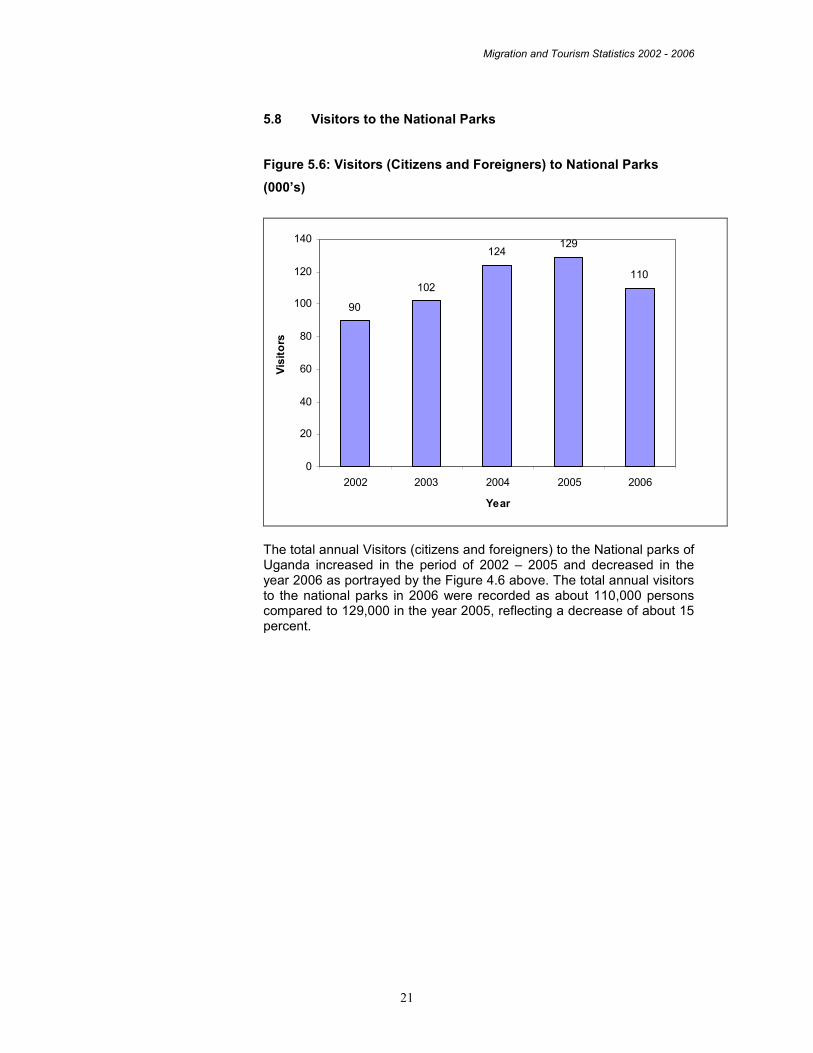
5.8 Visitors to the National Parks
Figure 5.6: Visitors (Citizens and Foreigners) to National Parks
(000’s)
90
102
124129
110
0
20
40
60
80
100
120
140
2002 2003 2004 2005 2006
Year
Visitors
The total annual Visitors (citizens and foreigners) to the National parks of Uganda increased in the period of 2002 – 2005 and decreased in the year 2006 as portrayed by the Figure 4.6 above. The total annual visitors to the national parks in 2006 were recorded as about 110,000 persons compared to 129,000 in the year 2005, reflecting a decrease of about 15 percent.

Migration and Tourism Statistics 2002 - 2006
22
Appendix Tables:
Table A1: Total Arrivals and Departures in Uganda, 2002 – 2006
Period Arrival Departure
Resident Non- resident Total Resident Non- resident Total
2002 180,025 344,133 524,158 183,702 326,312 510,014
2003 186,225 400,486 586,711 190,051 377,755 567,806
2004 225,739 512,379 738,118 231,109 465,241 696,350
2005 194,393 467,728 662,121 188,951 389,269 578,220
2006 231,067 538,595 769,662 254,064 501,812 755,876
Quarters
2005
Jan - March 50,483 119,696 170,179 46,765 99,062 145,827
Apr - June 51,821 122,463 174,284 42,928 94,589 137,517
Jul - Sept 47,640 122,469 170,109 51,410 110,050 161,460
Oct - Dec 44,449 103,100 147,549 47,848 85,568 133,416
2006
Jan - March 49,566 106,813 156,379 51,175 97,116 148,291
Apr - June 57,172 131,593 188,765 60,064 118,432 178,496
Jul - Sept 62,621 151,228 213,849 70,109 147,105 217,214
Oct - Dec 61,708 148,961 210,669 72,716 139,159 211,875
Source: Ministry of Internal Affairs and Uganda Bureau of Statistics
Table A2: Total Arrivals by sex, 2003- 2006
2003 2004 2005 2006
Quarter Male Female
Both sexes
Male Female Both sexes Male Female
Both sexes Male Female
Both sexes
1st 95,793 33,699 129,492 138,959 59,127 198,086 119,552 48,503 168,055 112,886 43,297 156,183
2nd 98,252 33,367 131,619 132,783 54,443 187,226 127,423 44,885 172,308 136,793 51,728 188,521
3rd 115,778 44,360 160,138 109,318 54,834 164,152 124,206 45,726 169,932 157,172 56,314 213,486
4th 112,691 50,702 163,399 128,083 54,280 182,363 106,647 40,673 147,320 158,010 52,151 210,161
Total 422,520 162,128 584,648 509,143 222,684 731,827 477,828 179,787 657,615 564,861 203,490 768,351
Source: Ministry of Internal Affairs and Uganda Bureau of Statistics Note: Those who did not indicate their sex on the card are excluded.
Table A3: Total arrivals by age group, 2004 – 2006
Age Year
0 - 14 15 - 24 25 - 44 45 - 64 65+ Not stated Total
2004 19,743 106,433 412,419 164,375 13,325 21,915
738,210
2005 17,464 81,129 366,928 151,352 14,215 31,049 662,137
2006 22049 102,857 426,476 171,368 15,918 30,994 769,662

Migration and Tourism Statistics 2002 - 2006
23
Table A4: Entebbe Arrivals, 2002– 2006
Ugandans Non- Ugandans
Period
Non -resident
Resident
Non-Residen
t
Total Residen
t
Western Europe
Other Europ
e North
America COMESA Other Africa
Other & Not
Stated Total
Grand
Total
2002 51,622 3,902 55,524 15,808 30,250 502 13,412 22,472 13,753 18,343 114,540 170,0642003 61,033 4,279 65,312 15,825 34,443 532 14,727 23,418 14,151 33,574 136,671 201,9832004 61,633 6,400 68,033 18,611 37,193 975 18,677 28,335 19,871 19,578 143,240 211,2732005 69,702 8,180 77,882 22,380 48,841 2,193 23,259 37,152 26,136 25,802 185,763 263,6452006 81,346 9,011 90,357 23,842 57,556 2,232 29,417 44,013 30,128 27,694 214,882 305,239Quarters 2004 1st 15,297 1,160 16,457 4,827 9,371 205 4,420 6,788 4,329 5,618 35,558 52,0152nd 17,578 1,280 18,858 4,857 8,806 202 5,810 8,250 5,931 5,540 39,396 58,2543rd 12,895 1,706 14,601 4,607 9,140 311 4,418 6,338 4,529 4,306 33,649 48,2504th 15,863 4,320 20,183 4,320 9,876 257 4,029 6,959 5,082 4,114 34,637 52,7542005 1st 14,380 1,664 16,044 6,326 10,755 474 5,128 8,457 5,749 6,136 43,025 59,0692nd 18,353 2,068 20,421 6,814 11,169 955 6,141 10,340 7,624 7,728 50,771 71,1923rd 18,092 1,726 19,818 5,066 14,016 351 6,752 9,897 6,514 6,224 48,820 68,6384th 18,877 2,722 21,599 4,174 12,901 413 5,238 8,458 6,249 5,714 43,147 64,7462006 1st 16,083 1,480 17,563 5,664 12,448 485 6,116 8,729 6,520 6,326 46,288 63,8512nd 18,475 2,150 20,625 5,751 11,632 574 7,612 9,857 7,941 7,241 50,608 71,2333rd 21,624 1,934 23,558 6,393 16,773 592 8,428 11,863 7,262 7,042 58,353 81,9114th 25,164 3,447 28,611 6,034 16,703 581 7,261 13,564 8,405 7,085 59,633 88,244
Source: Ministry of Internal Affairs and Uganda Bureau of Statistics
Table A5: Migration Statistics: Entebbe Departures, 2002 - 2006
Ugandans Non- Ugandans
Period
Non -resident
Resident
Non-Reside
nt
Total Resident
Western
Europe Other Europe
North America COMESA
Other Africa
Other & Not
Stated Total
Grand Total
2002 56,881 3,916 60,797 17,789 28,986 490 13,260 23,190 13,357 16,059 113,131 173,928 2003 63,064 3,819 66,883 14,274 27,820 428 11,318 20,142 11,111 39,624 124,717 191,600 2004 61,319 7,500 68,819 19,333 35,031 940 17,368 26,778 17,834 19,376 136,660 205,479 2005 61,834 8,113 69,947 24,950 39,086 1,712 19,757 30,866 21,327 19,595 157,293 227,240 2006 83,924 9,793 93,717 32,965 52,566 2,777 28,734 45,761 27,319 23,769 213,891 307,608 Quarters 2004 1st 14,696 3,379 18,075 3,968 9,070 173 3,808 5,801 3,455 6,474 32,749 50,824 2nd 17,743 1,580 19,323 4,939 8,468 240 4,682 8,052 5,373 4,920 36,674 55,997 3rd 13,924 1,535 15,459 4,583 9,220 239 4,990 6,005 4,172 3,961 33,170 48,629 4th 14,956 1,006 15,962 5,843 8,273 288 3,888 6,920 4,834 4,021 34,067 50,029 2005 1st 12,238 2,642 14,880 4,832 9,019 593 3,640 6,164 4,429 4,516 33,193 48,073 2nd 13,481 1,448 14,929 5,842 7,573 289 4,156 7,447 4,580 4,358 34,245 49,174 3rd 19,873 2,604 22,477 7,072 13,716 398 7,555 9,267 6,811 6,132 50,951 73,428 4th 16,242 2,419 18,661 7,204 8,778 432 4,406 7,988 5,507 4,589 38,904 56,565 2006 1st 16,255 3,175 19,430 7,091 11,412 650 5,547 7,815 5,352 4,965 42,832 62,262 2nd 17,234 1,749 18,983 6,817 9,672 529 5,961 9,998 6,390 5,014 44,381 63,364 3rd 24,965 2,658 27,594 8,283 17,245 762 9,750 13,088 7,434 7,041 63,603 91,226 4th 25,470 2,211 27,021 10,774 14,237 836 7,476 14,860 8,143 6,749 63,075 90,756
Source: Ministry of Internal Affairs and Uganda Bureau of Statistics

Migration and Tourism Statistics 2002 - 2006
24
Table A6: Migration Statistics: Malaba and Busia Arrivals, 2002 – 2006
Ugandans Non- Ugandans
Period Resident Non- Total Resident Non –resident Grand
Resident
Western
Other
North
Other Other & Total Total
Europe Europe America COMESA Africa Not Stated
2002 87,225 2,156 89,381 6,468 2,955 226 1,498 97,296 3,349 31,573 143,365 232,746 2003 80,338 1,896 82,234 7,263 3,179 206 1,424 133,496 3,506 30,789 179,863 262,097 2004 101,107 3,920 105,027 12,253 4,383 312 2,440 194,062 41,986 4,870 260,306 365,333 2005 64,949 3,420 68,369 8,797 3,817 377 1,931 119,388 25,116 3,758 163,184 231,553 2006 62,841 3,501 66,342 10,002 3,450 381 2,203 134,875 24,739 2,872 178,522 244,864 Quarter 2004 1st 31,493 1,060 32,553 4,503 1,255 94 652 57,064 14,143 1,336 79,047 111,600 2nd 27,224 1,066 28,290 3,400 959 64 579 56,903 10,651 1,269 73,825 102,115 3rd 21,012 805 21,817 2,857 1,363 95 778 45,603 9,615 1,229 61,540 83,357 4th 21,378 989 22,367 1,493 806 59 431 34,492 7,577 1,036 45,894 68,261 2005 1st 20,325 997 21,322 3,054 1,207 106 612 38,276 9,707 1,289 54,251 75,573 2nd 17,265 880 18,145 2,349 876 160 553 32,210 6,898 867 43,913 62,058 3rd 15,390 774 16,164 1,936 1,159 65 460 28,226 5,356 979 38,181 54,345 4th 11,969 769 12,738 1,458 575 46 306 20,676 3,155 623 26,839 39,577 2006 1st 15,224 780 16,004 2,686 838 68 412 26,284 6,046 815 37,149 53,153 2nd 18,169 1,042 19,211 2,712 900 126 678 38,237 7,425 682 50,760 69,971 3rd 17,370 929 18,299 2,688 1,038 110 660 39,599 6,833 743 51,671 69,970 4th 12,078 750 12,828 1,916 674 77 453 30,755 4,435 632 38,942 61,770
Source: Ministry of Internal Affairs and Uganda Bureau of Statistics
Table A7: Migration Statistics: Malaba and Busia Departures, 2002 – 2006
Ugandans Non- Ugandans Grand
Period Resident Non- Total Resident Non –resident Total
Resident
Western Other North Other Other &
Total
Europe Europe America COMESA Africa Not Stated
2002 76,352 1,938 78,290 5,928 3,402 486 1,588 84,895 6,735 31,361 134,395 212,685 2003 76,941 1,815 78,756 6,476 3,233 239 1,483 111,954 5,634 48,386 177,405 256,161 2004 101,343 4,599 105,942 10,244 5,297 258 2,836 168,402 33,527 6,287 226,851 332,793 2005 58,686 2,883 61,569 8,099 3,419 195 1,740 97,597 20,476 3,196 134,722 196,291 2006 62,481 2,707 65,188 11,391 4,199 253 2,562 128,000 24,215 2,991 173,611 238,799 Quarter 2004 1st 28,834 1,480 30,314 2,656 1,336 71 638 44,981 9,168 1,712 60,562 90,876 2nd 24,510 1,403 25,913 2,997 1,199 50 820 48,956 9,346 2,586 65,954 91,867 3rd 28,092 1,041 29,133 2,603 1,918 80 942 44,167 8,527 1,312 59,549 88,682 4th 19,907 675 20,582 1,988 844 57 436 30,298 6,486 677 40,786 61,368 2005 1st 18,990 1,052 20,042 2,483 1,030 71 463 31,011 6,886 1,131 43,075 63,117 2nd 14,205 667 14,872 1,909 760 23 478 26,440 5,570 791 35,971 50,843 3rd 13,502 588 14,090 1,983 1,049 46 511 22,512 4,553 742 31,396 45,486 4th 11,989 576 12,565 1,724 580 55 288 17,634 3,467 532 24,280 36,845 2006 1st 14,213 887 15,100 2,172 982 28 427 24,427 5,244 840 34,122 49,222 2nd 16,951 620 17,571 2,629 872 71 788 32,401 6,775 711 44,247 61,818 3rd 16,699 700 17,399 2,850 1,576 99 841 37,108 6,869 887 50,230 67,629 4th 14,618 500 15,118 3,740 767 55 506 34,064 5,327 553 45,012 60,130
Source: Ministry of Internal Affairs and Uganda Bureau of Statistics

Migration and Tourism Statistics 2002 - 2006
25
Table A8: Migration Statistics: Mutukula, Western and Northern Borders Arrivals, 2002 –
2006
Ugandans Non- Ugandans
Non-Period
Resident
Resident
Total Resident
Non -resident
Total Grand
Western Europe
Other Europe
North America
COMESA Other Africa
Other & not Stated Total
2002 17,470 348 17,818 1,359 1,790 66 689 60 195 12,800 103,394 121,2122003 20,018 338 20,356 1,748 1,746 54 719 68,538 11,523 17,947 102,275 122,6312004 28,623 4,438 33,061 3,512 2,525 182 953 86,383 29,955 4,941 128,451 161,5122005 26,043 3,295 31,343 2,522 3,001 251 1,315 89,398 33,351 7,747 137,585 166,9232006 49,875 2,715 52,590 3,161 3,451 196 1,838 130,404 25,329 2,590 166,969 219,559Quarter 2004 1st 5,737 804 6,541 732 512 39 208 19,329 7,150 691 28,661 35,2022nd 4,110 1,008 5,118 594 406 32 208 14,866 6,575 869 23,550 28,6683rd 6,779 1,292 8,071 902 773 25 266 14,604 7,693 2,124 26,387 34,4584th 11,997 1,334 13,331 1,284 834 86 271 37,584 8,537 1,257 49,853 63,1842005
1st 5,807 584 6,391 591 734 56 252 18,721 8,188 604 29,146 35,5372nd 6,359 672 7,031 681 603 50 298 22,684 8,822 865 34,003 41,0343rd 6,502 853 7,355 654 1,161 103 478 22,985 11,389 3,001 39,771 47,1264th 7,375 1,186 8,561 596 503 42 287 25,008 4,952 3,277 34,665 43,2262006
1st 9,166 631 9,797 743 621 49 322 19,982 7,231 630 29,578 39,3752nd 11,210 781 11,991 855 597 39 433 27,235 5,498 913 35,570 47,5613rd 13,777 572 14,349 769 1,286 55 613 35,713 8,720 463 47,619 61,9684th 15,722 731 16,453 794 947 53 470 47,474 3,880 584 54,202 70,655
Source: Ministry of Internal Affairs and Uganda Bureau of Statistics
Table A9: Migration Statistics: Mutukula, Western and Northern Borders Departures, 2002 – 2006
Ugandans Non- Ugandans
Period Resident
Non-Resident
Total
ResidentNon- residents
Grand
Total
Western Europe
Other Europe
North America
COMESA Other Africa
Other & Not Stated Total
2002 24,695 415 25,110 1,979 2,429 86 896 62,030 11,890 18,785 98,095 123,2052003 27,350 348 27,698 1,946 2,001 88 793 59,827 9,159 18,533 92,347 120,0452004 35,252 3,549 38,801 3,618 2,738 130 1,220 78,470 28,698 4,403 119,277 158,0782005 32,847 2,447 35,294 2,535 3,781 202 1,462 80,717 27,152 3,546 119,395 154,6892006 59,964 3,084 63,048 3,339 4,372 128 2,153 108,297 24,633 3,499 146,421 209,469Quarter 2004 1st 7,692 306 7,998 573 503 44 261 16,964 5,362 392 24,099 32,0972nd 6,279 915 7,194 678 493 17 252 14,129 5,898 860 22,327 29,5213rd 5,867 1,390 7,257 913 846 27 354 11,715 6,183 2,245 22,283 29,5404th 15,414 938 16,352 1,454 896 42 353 35,662 11,255 906 50,568 66,9202005 1st 7,743 721 8,464 479 855 31 323 16,965 6,538 982 26,173 34,6372nd 6,809 983 7,792 682 682 61 404 18,754 7,915 1,210 29,708 37,5003rd 8,237 417 8,654 743 1,550 63 485 23,234 6,886 931 33,892 42,5464th 10,058 326 10,384 631 694 47 250 21,764 5,813 423 29,622 40,0062006 1st 10,856 990 11,846 588 772 25 369 16,148 5,762 1,297 24,961 36,8072nd 15,450 912 16,362 983 813 39 598 25,452 8,017 1,050 36,952 53,3143rd 16,496 479 16,975 816 1,617 41 666 30,652 6,982 610 41,384 58,3594th 17,162 703 17,865 952 1,170 23 520 36,045 3,872 542 43,124 60,989
Source: Ministry of Internal Affairs and Uganda Bureau of Statistics
Migration and Tourism Statistics 2002 - 2006
26
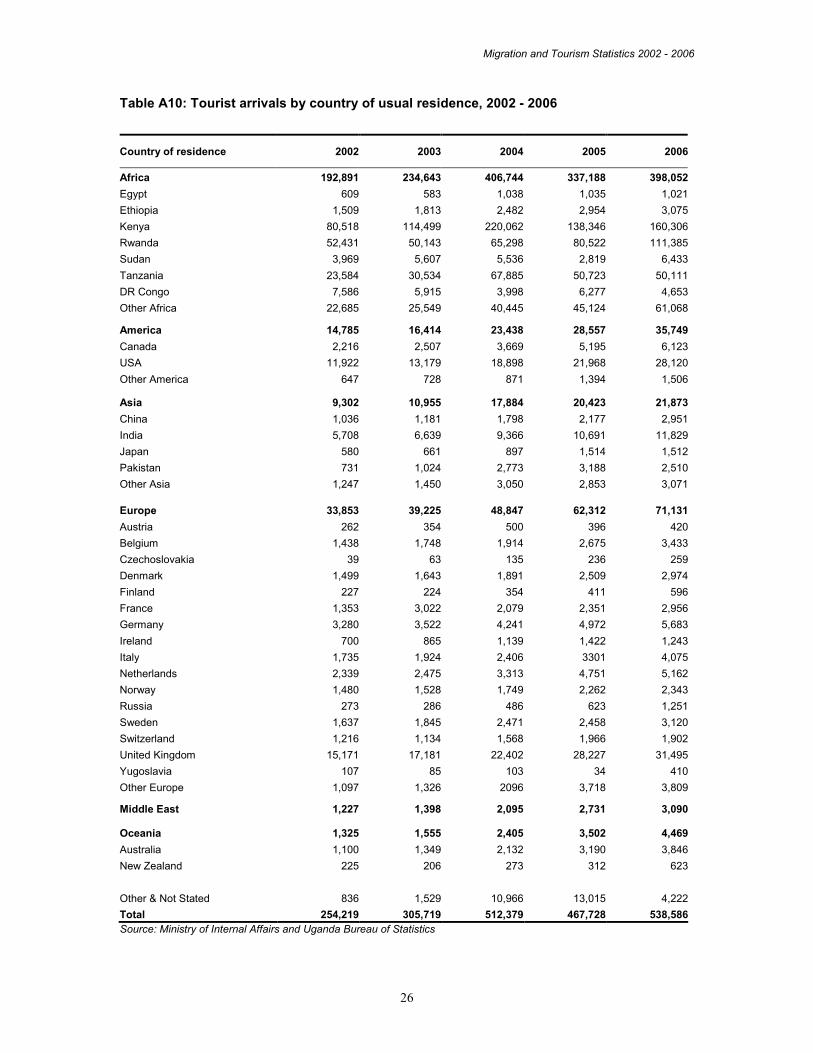
Table A10: Tourist arrivals by country of usual residence, 2002 - 2006
Country of residence 2002 2003 2004 2005 2006
Africa 192,891 234,643 406,744 337,188 398,052
Egypt 609 583 1,038 1,035 1,021
Ethiopia 1,509 1,813 2,482 2,954 3,075
Kenya 80,518 114,499 220,062 138,346 160,306
Rwanda 52,431 50,143 65,298 80,522 111,385
Sudan 3,969 5,607 5,536 2,819 6,433
Tanzania 23,584 30,534 67,885 50,723 50,111
DR Congo 7,586 5,915 3,998 6,277 4,653
Other Africa 22,685 25,549 40,445 45,124 61,068 America 14,785 16,414 23,438 28,557 35,749
Canada 2,216 2,507 3,669 5,195 6,123
USA 11,922 13,179 18,898 21,968 28,120
Other America 647 728 871 1,394 1,506 Asia 9,302 10,955 17,884 20,423 21,873
China 1,036 1,181 1,798 2,177 2,951
India 5,708 6,639 9,366 10,691 11,829
Japan 580 661 897 1,514 1,512
Pakistan 731 1,024 2,773 3,188 2,510
Other Asia 1,247 1,450 3,050 2,853 3,071
Europe 33,853 39,225 48,847 62,312 71,131
Austria 262 354 500 396 420
Belgium 1,438 1,748 1,914 2,675 3,433
Czechoslovakia 39 63 135 236 259
Denmark 1,499 1,643 1,891 2,509 2,974
Finland 227 224 354 411 596
France 1,353 3,022 2,079 2,351 2,956
Germany 3,280 3,522 4,241 4,972 5,683
Ireland 700 865 1,139 1,422 1,243
Italy 1,735 1,924 2,406 3301 4,075
Netherlands 2,339 2,475 3,313 4,751 5,162
Norway 1,480 1,528 1,749 2,262 2,343
Russia 273 286 486 623 1,251
Sweden 1,637 1,845 2,471 2,458 3,120
Switzerland 1,216 1,134 1,568 1,966 1,902
United Kingdom 15,171 17,181 22,402 28,227 31,495
Yugoslavia 107 85 103 34 410
Other Europe 1,097 1,326 2096 3,718 3,809 Middle East 1,227 1,398 2,095 2,731 3,090 Oceania 1,325 1,555 2,405 3,502 4,469
Australia 1,100 1,349 2,132 3,190 3,846
New Zealand 225 206 273 312 623
Other & Not Stated 836 1,529 10,966 13,015 4,222
Total 254,219 305,719 512,379 467,728 538,586
Source: Ministry of Internal Affairs and Uganda Bureau of Statistics

Migration and Tourism Statistics 2002 - 2006
27
Table A11: Percentage tourist arrivals by country of residence, 2002 - 2006
Country of Residence 2002 2003 2004 2005 2006
Africa
Kenya 31.7 37.3 42.9 29.5 29.9
Tanzania 9.3 10.0 13.2 10.8 9.3
Rwanda 20.6 16.4 12.7 17.2 20.4
Other Africa 14.3 12.9 10.4 14.5 14.2
AMERICA
USA 4.7 4.3 3.7 4.7 1.1
Canada 0.9 0.8 0.7 1.1 5.2
Other America 0.3 0.2 0.2 0.3 0.3
ASIA
India 2.2 2.2 1.8 2.3 2.2
China 0.4 0.4 0.4 0.5 0.6
Japan 0.2 0.2 0.2 0.3 0.3
Other Asia 0.8 0.8 1.1 1.3 1.0
EUROPE
United Kingdom 6.0 5.6 4.4 6.0 5.9
Germany 1.3 1.2 0.8 1.1 1.1
Netherlands 0.9 0.8 0.6 1.0 1.0
Other Europe 5.1 5.3 3.7 5.2 5.4
Middle East 0.5 0.5 0.4 0.6 0.6
OCEANIA
Australia 0.4 0.4 0.4 0.7 0.7
New Zealand 0.1 0.1 0.1 0.1 0.1
Other & Not Stated 0.3 0.5 2.1 2.8 0.8
Total Percentage 100.0 100.0 100.0 100.0 100.0
Total Arrivals 254,219 305,719 512,379 467,728 538,586
Source: Ministry of Internal Affairs and Uganda Bureau of Statistics

Migration and Tourism Statistics 2002 - 2006
28
Table A12: Tourist Arrivals by Month 2002 – 2006
Month 2002 2003 2004 2005
2006
January 20,000 23,000 45,000 38,000 29,000 February 18,000 24,000 43,000 36,000 35,000
March 19,000 23,000 48,000 45,000 42,000
April 18,000 22,000 46,000 42,000 41,000
May 22,000 16,000 50,000 47,000 42,000
June 20,000 23,000 35,000 34,000 48,000
July 25,000 29,000 36,000 41,000 48,000
August 23,000 24,000 40,000 44,000 52,000
September 25,000 30,000 41,000 37,000 51,000
October 24,000 32,000 42,000 32,000 49,000
November 17,000 25,000 40,000 34,000 47,000
December 24,000 36,000 46,000 37,000 51,000
Total 254,000 306,000 512,000 468,000 539,000
Source: Ministry of Internal Affairs and Uganda Bureau of Statistics
Table A13: Tourism basic indicators, 2002 – 2006
Unit 2002 2003 2004 2005 2006
Inbound tourism
Visitor arrivals '000 254 306 512 468 539
Visitor arrivals by region
Africa '000 192 235 407 337 398
Americas '000 15 16 23 29 36
Europe '000 34 39 49 62 71
Asia '000 9 11 18 20 22
Middle East '000 1 1 2 3 3
Oceania '000 1 2 2 4 4
Other & not stated '000 0.8 1 11 13 4
Visitor arrivals by mode of transport
Air '000 86 97 131 172 200
Road '000 168 209 381 296 336
Arrivals by purpose of visit
Leisure, recreation and holidays '000 69 77 86 9 30
Business and professional '000 59 67 81 31 72
Visiting friends and relatives '000 32 52 71 35 89
Other '000 94 110 274 393 345
Tourism expenditure
in the country of reference US$ M 185 265 321 327 375
Outbound Tourism
Departures '000 184 190 231 189 254
Source: Uganda Bureau of Statistics.

Migration and Tourism Statistics 2002 - 2006
29
Table A14: Visitors to the National Parks (Citizen and Foreigners) 2002 – 2006
National Parks 2002 2003 2004 2005 2006
Murchison Falls National Park 34,241 38,553 46,033 39,133 26,256
Queen Elizabeth national park 27,814 32,661 41,843 48,720 43,885
Kidepo Valley National Park 1,443 1,049 818 758 959
Lake Mburo National Park 10,800 11,692 15,118 16,181 12,508
Rwenzori Mountains National Park 268 435 592 906 948
Bwindi Impenetrable National Park 5,075 4,900 5,768 9,012 10,176
Mgahinga Gorrila National Park 1,485 2,506 3,337 1,910 2,071
Semliki National Park 802 1,179 1,755 1,949 2,584
Kibale National Park 4,899 5,998 5,463 6,490 7,741
Mount Elgon National Park 3,234 3,594 3,610 3,751 2,964
Total 90,061 102,567 124,337 128,810 110,092
Source: Uganda Wildlife Authority