©ufs the boomer opportunity: tapping the expertise of the metlife mature market institute® barbara...
TRANSCRIPT
©UFS
The Boomer Opportunity: Tapping the Expertise of the MetLife Mature Market Institute®
Barbara HowardGerontology ConsultantMetLife Mature Market InstituteMay 2006

2
“I get the ‘boomer’ part but I don’t get the ‘baby’ part.”
3
MetLife’s comprehensive resource on aging, retirement, and long-term care for MetLife and its business partners.
•Research & Polls•Public Education & Policy•Facts, Stats, Information•Training & Education•Consultation
www.maturemarketinstitute.com
Mature Market Institute
4
Media Leadership
• The Mature Market Institute positioned to provide Thought Leadership for MetLife
• Sponsored Retirement Income IQ media event to dispel myths and misconceptions about annuities
• Sponsored Long-Term Care IQ media event to dispel myths and misconceptions about long-term care
• Expert resource to major media resulting in coverage in the Wall Street Journal, the New York Times, CNN, ABC World News Tonight, and USA Today.

5
Today’s Presentation
Demographic Profile
Life Stages and Behaviors
Retirement and Beyond
How the MMI can help you

6

7
Meanwhile, outside the park
Two Stones tickets please, Senior Discount

8
0.0
0.5
1.0
1.5
2.0
2.5
3.0
3.5
4.0
4.5
5.0
5 15 25 35 45 55 65 75 85 95 100+
Millions
Age
BabyBoomers
Baby BoomersAs of 2006
Source: MetLife Mature Market Institute AnalysisPopulation Projections ProgramUS Census Bureau, 2000
Boomers are getting older …
9
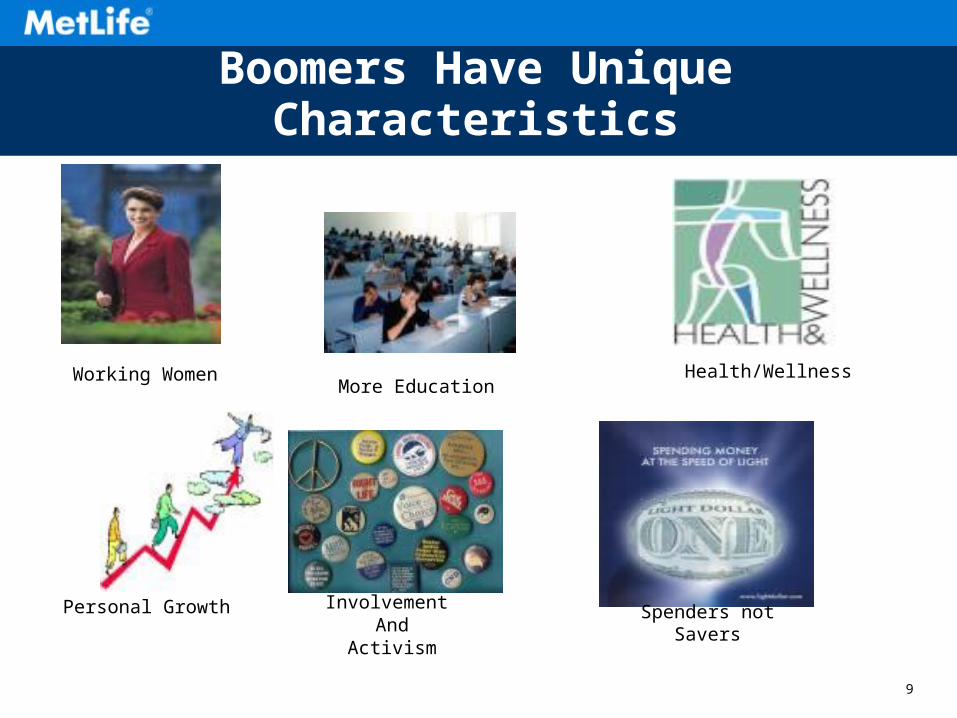
Boomers Have Unique Characteristics
Working WomenMore Education
Health/Wellness
Personal Growth Involvement And
ActivismSpenders not Savers

10
Boomer Formative Years
11
Longevity…The Greatest Risk
12
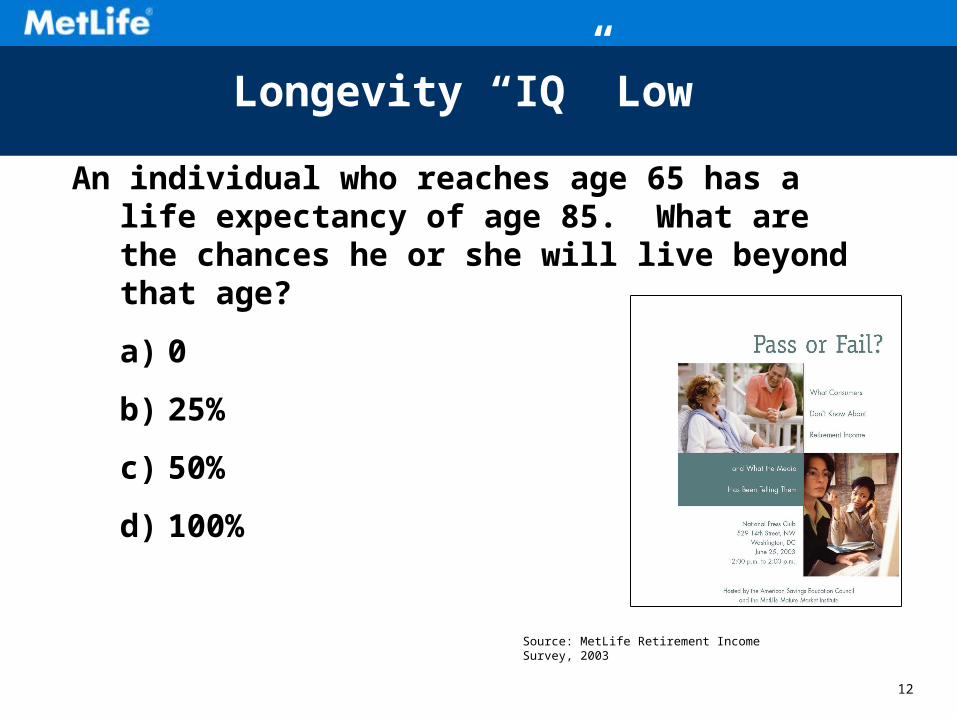
Longevity “IQ” Low
An individual who reaches age 65 has a life expectancy of age 85. What are the chances he or she will live beyond that age?
a) 0
b) 25%
c) 50%
d) 100%
Source: MetLife Retirement Income Survey, 2003
13
How do Boomers Feel about Retirement?

14
Boomers are Anxious About Retirement
• The number of boomers worried about retirement has almost doubled in four years.
• Younger boomers (41-49) are more likely to worry about retirement than older boomers (50-59) 39% vs. 30%
49%40%
19%
33%
LookForward toRetirement
Worry AboutRetirement
2001
2005
Source: The MetLife Survey of American Attitudes Toward Retirement: What’s Changed?, October 2005
15
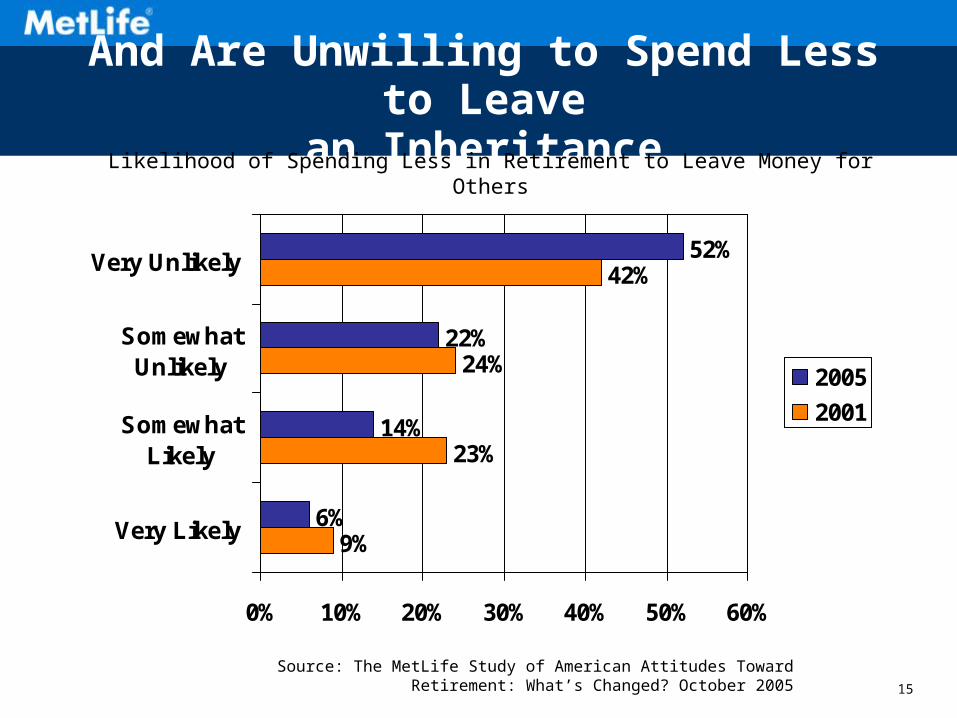
And Are Unwilling to Spend Less to Leave
an Inheritance
9%
23%
24%
42%
6%
14%
22%
52%
0% 10% 20% 30% 40% 50% 60%
Very Likely
SomewhatLikely
SomewhatUnlikely
Very Unlikely
2005
2001
Likelihood of Spending Less in Retirement to Leave Money for Others
Source: The MetLife Study of American Attitudes Toward Retirement: What’s Changed? October 2005
16
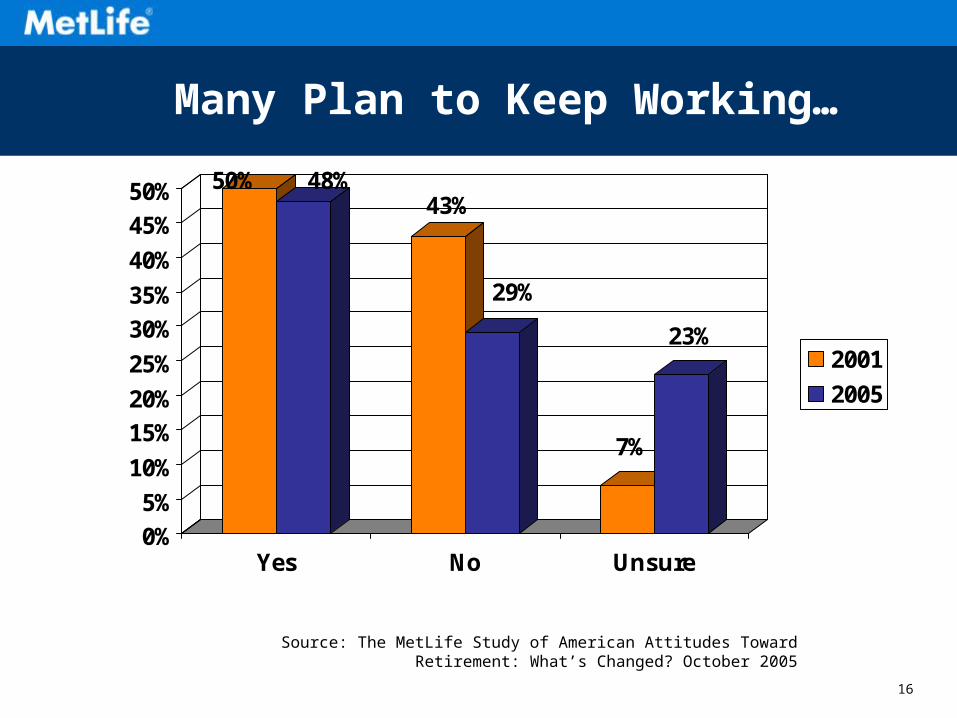
Many Plan to Keep Working…
50% 48%43%
29%
7%
23%
0%
5%
10%
15%
20%
25%
30%
35%
40%
45%
50%
Yes No Unsure
2001
2005
Source: The MetLife Study of American Attitudes Toward Retirement: What’s Changed? October 2005

17
To Keep Active and for Financial Reasons
42%
19%
17%
17%
69%
44%
30%
23%
0% 20% 40% 60% 80%
Want to KeepActive
Need Income
MaintainLifestyle
Want extras
2005
2001
Source: The MetLife Study of American Attitudes Toward Retirement: What’s Changed? October 2005

18
Aging and Disability
Disabilities over Age 65 Prevalence of Alzheimer’s Disease
Source: U.S. Dept. of Health & Human Services, July 2002
Source: Survey of Income and Program Participation, U.S.Census Bureau, March 2001
54.5%
37.6%
16.7%
0.0%
10.0%
20.0%
30.0%
40.0%
50.0%
60.0%
% With AnyDisability
% With SevereDisability
% Need Assistance
47%
19%
3%
0%5%
10%15%20%25%30%35%40%45%50%
65-74 75-84 85+

19
Perspectives on Caregiving and Long-Term Care
20
“There are only four kinds of people in this world ...
Those who have been caregivers
Those who currently are caregivers
Those who will be caregivers
Those who will need caregivers.”
Rosalynn Carter, 1997

21
Women are working
More divorces
Fewer or no children
Geographic separation
Care recipients living longer
Family Structures Have Changed
22
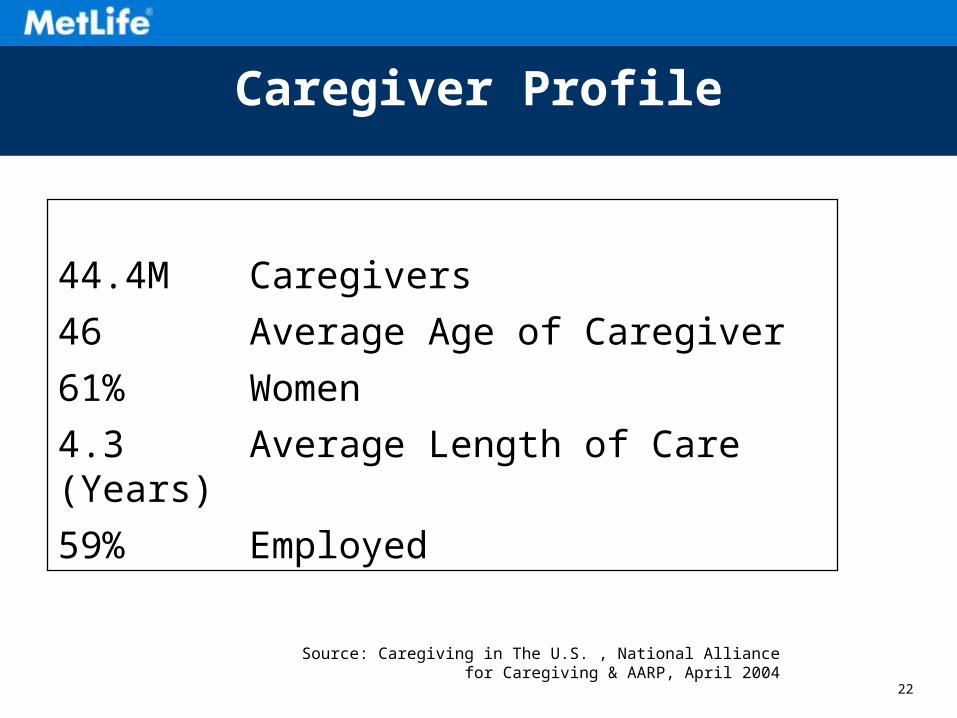
44.4M Caregivers
46 Average Age of Caregiver
61% Women
4.3 Average Length of Care (Years)
59% Employed
Source: Caregiving in The U.S. , National Alliance for Caregiving & AARP, April 2004
Caregiver Profile

23
•Annual Market Survey of Nursing Home, Home Care, and Assisted Living Costs
•Covers 87 major markets
Source: The MetLife Market Survey of Nursing Home & Home Care Costs, 2005, The MetLife Market Survey of Assisted Living Costs, 2005

24
2005 Major Findings•National average for a private room in a nursing home
•$203/day or $74,095 annually
•National average for a semi-private room in a nursing home•$176/day or $64,240 annually
•National average for a private room in an assisted Living facility
•$2,905/month or $34,860 annually
•Average hourly rate for Home Health Aid•$19/hour
•Average hourly rate for Homemaker/companion•$17/hour
Source: The MetLife Market Survey of Nursing Home & Home Care Costs, 2005, The MetLife Market Survey of Assisted Living Costs, 2005
25
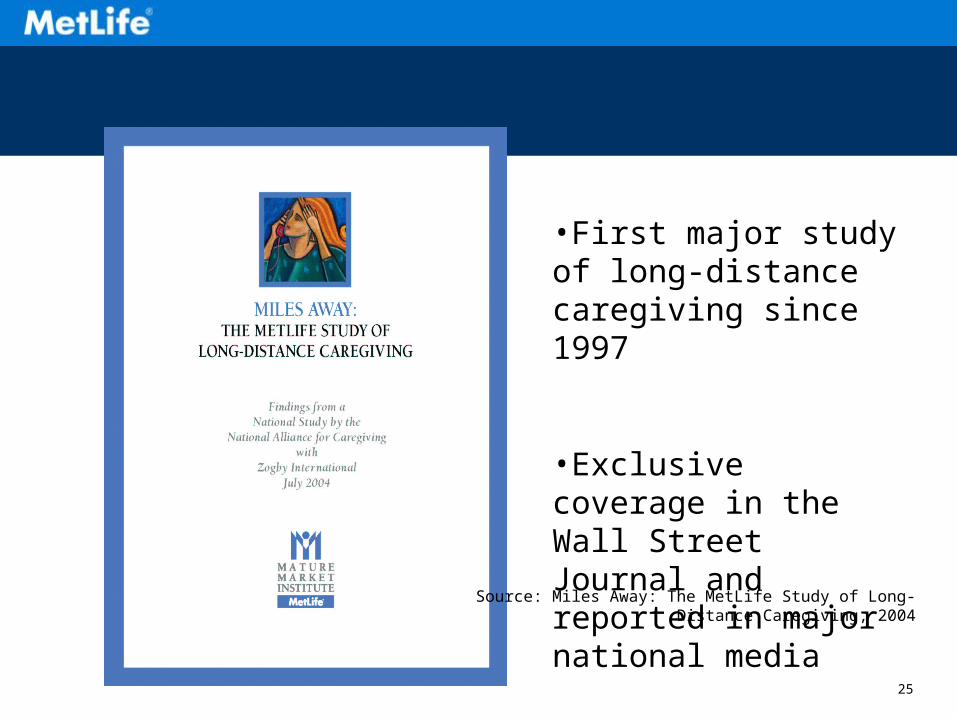
•First major study of long-distance caregiving since 1997
•Exclusive coverage in the Wall Street Journal and reported in major national media
Source: Miles Away: The MetLife Study of Long-Distance Caregiving, 2004

26
Miles AwayMajor Findings
•Caregivers live an average of 450 miles from care recipient and spend $392 monthly on travel and out-of-pocket expenses
•80% work either full or part-time
•44% rearrange work schedules
•36% miss days of work
•12% took a leave of absenceSource: Miles Away: The MetLife Study of Long-Distance Caregiving, 2004

27
Sons at WorkBalancing Employment and Eldercare
• Men are just as likely as women to be the primary caregiver
• Women perform more personal tasks than men
• Both men and women have little knowledge about company-sponsored programs
Source: The MetLife Study of Sons at Work, 2003

28
Study of Employed Caregivers: Does LTCI Make a Difference?
Employed caregivers of elders with LTCI are nearly twice as likely to stay in the workforce and have fewer social stresses
Source: The MetLife Study of Employed Caregivers: Does Long Term Care Insurance Make a Difference, 2001

29

30
Retirement Looming on The Horizon
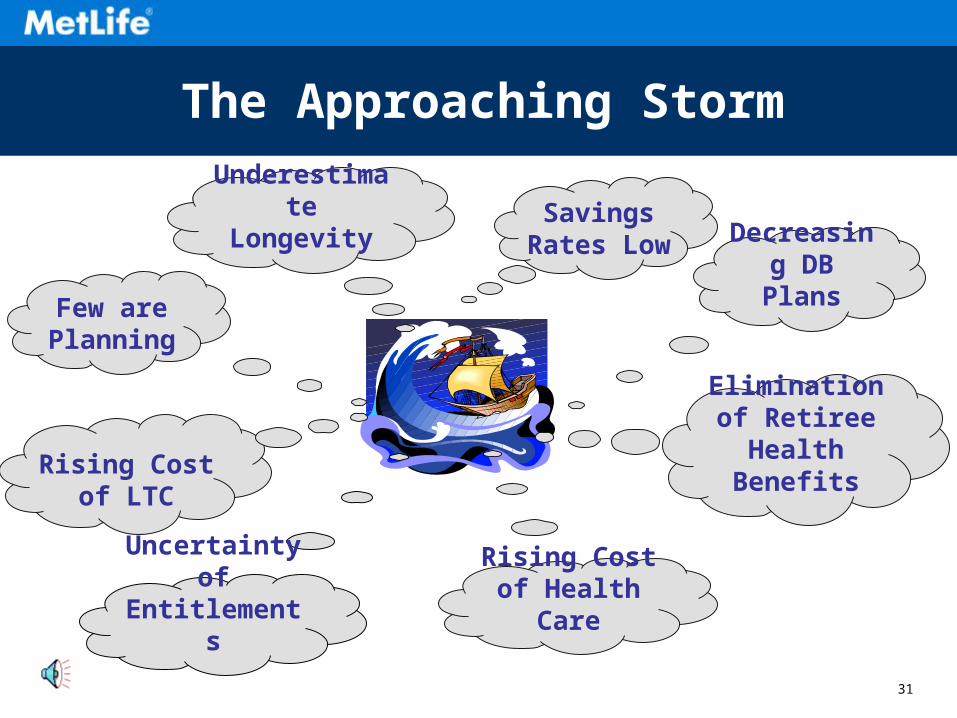
31
Savings Rates Low
Decreasing DB Plans
Elimination of Retiree Health
Benefits
Rising Cost of Health Care
Rising Cost of LTC
Few are Planning
Underestimate Longevity
The Approaching Storm
Uncertainty of Entitlements

32
Less than $25K
$25K - $49,999
$50K - $99,999
$100K - $249,999
$250K+
Retirement ReadinessBad News Savings Rates are Low
All
Workers
53
12
12
11
12
Ages
25-34
73
11
7
4
5
Ages
35-44
49
14
16
12
9
Ages
45-54
43
14
12
14
16
Ages
55+
43
8
12
11
26
L0408JHEC(0807)MLIC-LDAll figures are percentages. Source: EBRI, The 2006 Retirement Confidence Survey

33
Workers with Pension Coverage By Type Of Plan
0
10
20
30
40
50
60
Traditional DefinedBenefit Plan Only
Defined Contribution-401(k)-Only
Both
1981 1991 2001Source: U.S.Department of Labor (2002) and authors estimates based on Board of Governors, Survey of Consumer Finances (2001). From EBRI Issue Brief, January 2005
34
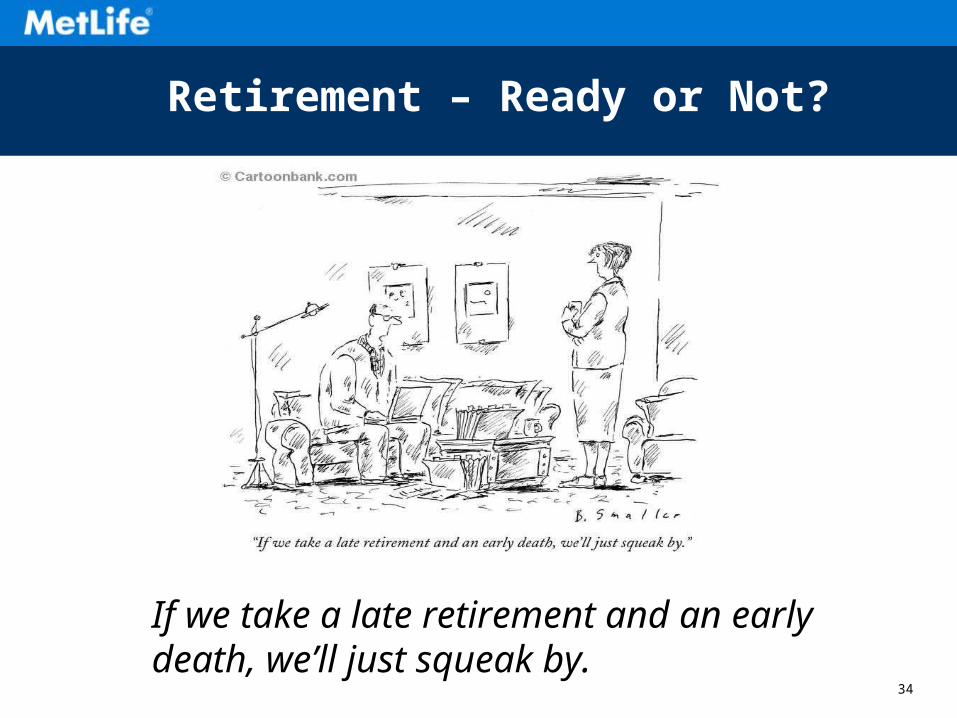
Retirement – Ready or Not?
If we take a late retirement and an early death, we’ll just squeak by.

35
Progress Toward Retirement Savings Goals
3%
24%
23%
22%
19%
9%
Already achievedgoals
On track for reachinggoals
Somewhat behind
Significantly behind
Haven't started
Don't have goals
Employee Perceptions of Progress Toward Retirement Savings Goals
Source: MetLife Employee Benefit Trends Study - 2004
36
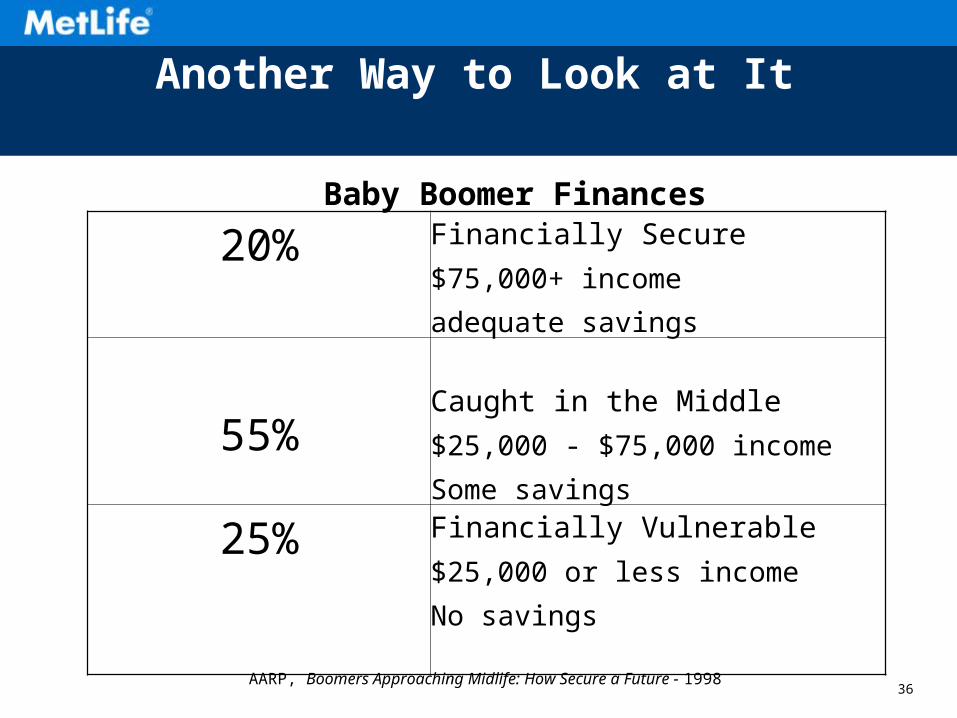
Another Way to Look at It
Source: AARP, Boomers Approaching Midlife: How Secure a Future:, 1998
20% Financially Secure
$75,000+ income
adequate savings
55%Caught in the Middle
$25,000 - $75,000 income
Some savings
25% Financially Vulnerable
$25,000 or less income
No savings
AARP, Boomers Approaching Midlife: How Secure a Future - 1998
Baby Boomer Finances

37
Glass Half Empty….Or Half Full

38
Boomer Window of Opportunity
Not yet retired
Better educated
Healthier
Interested in second careers
Not as concerned with leaving an inheritance
Assets in homes
Open to advice and assistance

39
Longevity Basics First
Income for life
Provide for spouse/dependents
Long-term care protection
Health care coverage
Legacy

40
The New Face of Aging

41
Barbara HowardMetLife Mature Market Institute
57 Greens Farms RoadWestport, CT 06880
(203) 454-5392Website
www.maturemarketinstitute.com
Metropolitan Life Insurance Company, New York, NYL06019SOI(exp0108)MLIC-LD