Überblick der bisher bearbeiteten themen - tu-ilmenau.de · synthesis to 22.2 (2008) background:...
TRANSCRIPT
© Fraunhofer
Überblick der bisher bearbeiteten Themen
2006 - 2013
Judith Liebetrau
Ilmenau
20.10.2014

© Fraunhofer

© Fraunhofer
Perceptual Evaluation of 5.1 Downmix Algorithms (2006)
Today:
Stereo in wide use
5.1 formats spreading in the home
Production in both formats is expensive
Cheaper solution
Production in 5.1 and automatic down‐mix
How good are the algorithms ?
How to measure quality ?
Artistic Mixes ?

© Fraunhofer
Perceptual Evaluation of 5.1 Downmix Algorithms (2006)
Experimental Design – Alternatives
ITU‐R BS.1116 (tripple stimulus with hidden reference)
only valid for small impairments
ITU‐R BS.1534 (multi stimulus with hidden reference and anchors)
Valid for intermediate quality
But… Artistic mix might sound very different
What is the reference ?
ITU‐R BS.1284
(Paired comparison)
© Fraunhofer
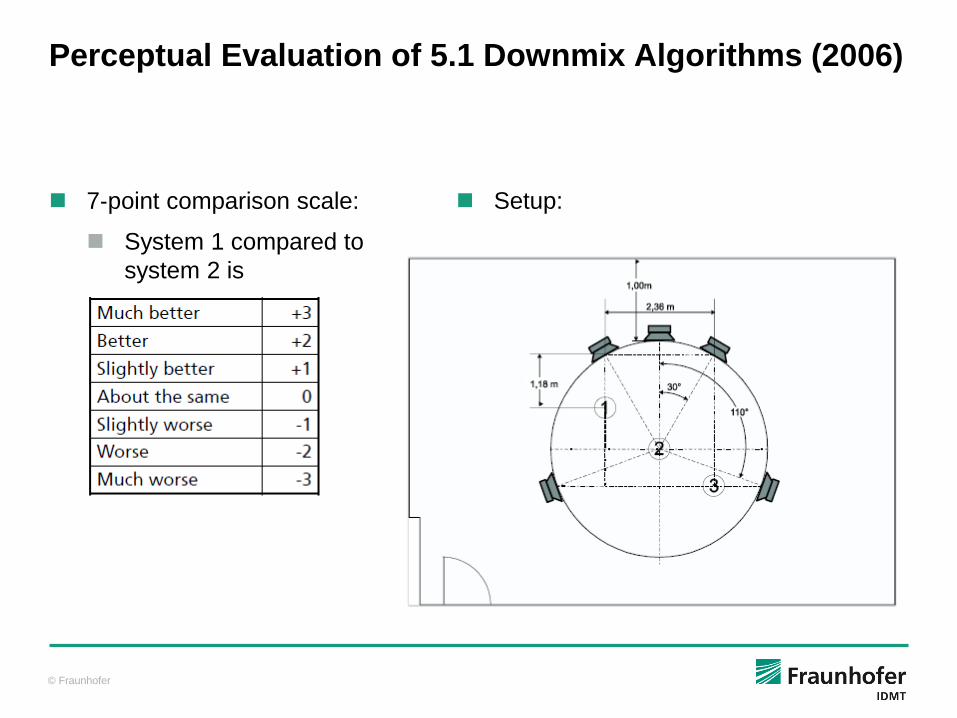
Perceptual Evaluation of 5.1 Downmix Algorithms (2006)
7‐point comparison scale:
System 1 compared to
system 2 is
Setup:

© Fraunhofer
Perceptual Evaluation of 5.1 Downmix
Algorithms (2006)

© Fraunhofer
Perceptual Evaluation of 5.1 Downmix
Algorithms (2006)

© Fraunhofer

© Fraunhofer
Perceptual Evaluation of 5.1 Blind Up-mix Algorithms
(2007)
5.1 formats spreading in the home: Broadcasting in 5.1 formats
5.1 formats enable increased sweet spot
Old content still in mono or stereo
Customers want to play their old content (CD, vinyl disc) in 5.1 format
Even new content sometimes stereo
Customers complain Broadcasters have to react

© Fraunhofer
Perceptual Evaluation of 5.1 Blind Up-mix Algorithms
(2007)
Solutions:
For broadcasting/new content:
Production in stereo and 5.1 (expensive)
Production in 5.1 and automatic down‐mix (only for new content)
Blind Up‐mix from Stereo to 5.1
How good are algorithms for up‐mix ?
How to measure quality ?

© Fraunhofer
Perceptual Evaluation of 5.1 Blind Up-mix Algorithms
(2007)
Experimental Design ‐ Alternatives:
ITU‐R BS.1116 (tripple stimulus with hidden reference)
only valid for small impairments
ITU‐R BS.1534 (MUSHRA)
Quality might be better than original
Experiment derived from MUSHRA
New Scale (Values ‐50 to +50)
Loop mode and near instantaneous switching
Reduce scale to the point “equal” and indication of direction

© Fraunhofer
Perceptual Evaluation of 5.1 Blind Up-mix Algorithms
(2007)

© Fraunhofer
Localization in Spatial Audio ‐ from Wave Field
Synthesis to 22.2 (2008)
Background:
Several approaches for realistic surround sound
Localization influences perception of quality
Localization resolution
Highest with infinite number of loudspeakers
Complex software model for reproduction
Increasing complexity of sound system = increasing costs
low complexity/costs required!
Goal:
Compromise between localization resolution and complexity

© Fraunhofer
Localization in Spatial Audio ‐ from Wave Field
Synthesis to 22.2 (2008)
Comparison of Sound Systems (“High resolution” – “low resolution”)
Localization horizontal and vertical layer
Steadiness of sound sources
Dimension of sound sources
Dependence on listening position
Development…
… of a listening test procedure, which provides the required information

© Fraunhofer
Localization in Spatial Audio ‐ from Wave Field
Synthesis to 22.2 (2008)

© Fraunhofer
Localization in Spatial Audio ‐ from Wave Field
Synthesis to 22.2 (2008)
Combination WFS ring, WFS ceiling, 3D-Audio-System (22.2)
Dimension 3.85m x 5.60m x 2.40m
158 LS + 6 Subs
Acoustical treatment of room

© Fraunhofer
Localization in Spatial Audio ‐ from Wave Field
Synthesis to 22.2 (2008)

© Fraunhofer
Localization in Spatial Audio ‐ from Wave Field
Synthesis to 22.2 (2008)
Training Session
Familiarization with all stimuli under test
Grading Phase
3 positions simultaneously
Judgment on paper
Stimulus played back twice
Decision where it was localized
Character of sound source (1) defined (4) diffuse

© Fraunhofer
Psychoakustische Banbreitenerweiterung (2009)
Kleine Lautsprecher
hohe Grenzfrequenz
Tieffrequente Anteile fehlen
Algorithmen zur psychoakustische Bandbreitenerweiterung
Frequenzverdopplung
Differenzton
Missing Fundamental (Residualton)
Originalsignal (wenig Tiefton) und bearbeitete Signale
Frage: Welches hat mehr Tieftonanteile?
Modifizierter MUSHRA

© Fraunhofer
AV discrepancy & the influence in vertical sound source
localization (2011)
Influence: Audio perception by vision
Ventriloquism‐effect

© Fraunhofer

© Fraunhofer

© Fraunhofer

© Fraunhofer

© Fraunhofer

© Fraunhofer
© Fraunhofer

© Fraunhofer
© Fraunhofer
Thema 1: Musik und Emotionen (2012)
Gewünscht: Messung von Emotionen während Musikhören
Problem der Beeinflussung von Probanden
Testmethode Free Choice Profiling:
Vorteil: Verwendung eigenes Vokabular
Berechnung gemeinsamer Wahrnehmungsraum
Pilotexperiment: Klassifikation von Tönen nach emotionalen Gehalt mittels
(FCP)
Wahrnehmungsraum erstellt

© Fraunhofer
Thema 1: Musik und Emotionen (2012)

© Fraunhofer
Thema 1: Musik und Emotionen (2012)
Dimensionen aus denen sich Emotionen zusammensetzen
Valence (positiv - negativ)
Arousal (hoch – niedrig)
Überprüfung wie gut FCP funktioniert

© Fraunhofer
Thema 1: Musik und Emotionen (2012)

© Fraunhofer
Thema 1: Musik und Emotionen (2012)

© Fraunhofer
Thema 1: Musik und Emotionen (2012)

© Fraunhofer
Thema 1: Musik und Emotionen (2012)
Ranking der Items entlang der Dimensionsachsen
40 Vergleichstest (4 Gruppenn a 10 Vergleiche)
<=> emotionaler Charakter (Valenz/Arousal)
kein Anker
keine quantifizierbare Skala
© Fraunhofer
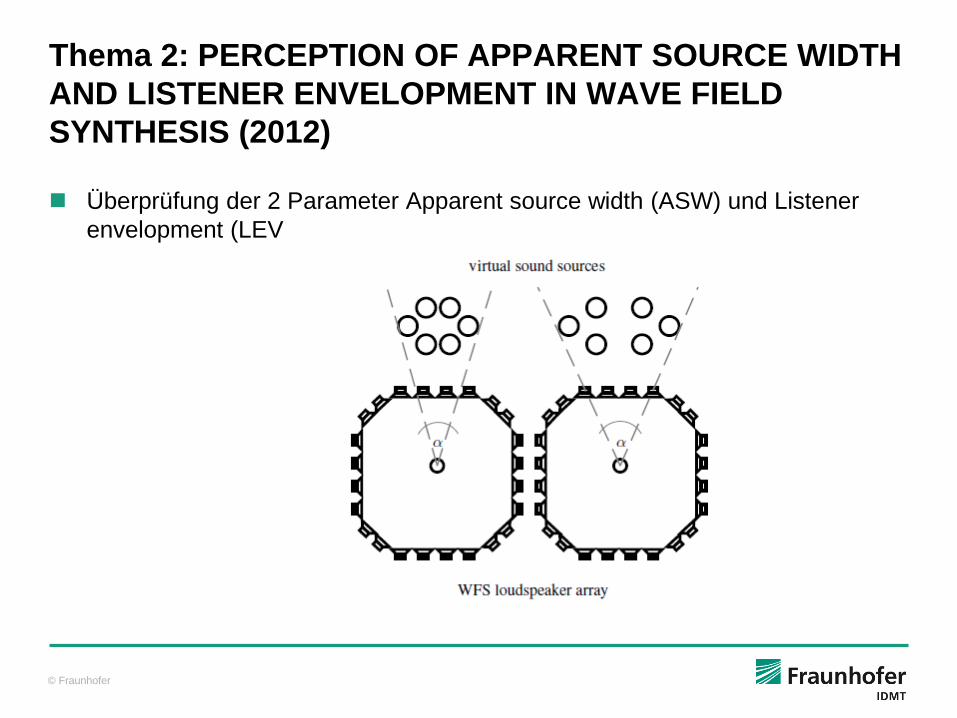
Thema 2: PERCEPTION OF APPARENT SOURCE WIDTH
AND LISTENER ENVELOPMENT IN WAVE FIELD
SYNTHESIS (2012)
Überprüfung der 2 Parameter Apparent source width (ASW) und Listener
envelopment (LEV

© Fraunhofer
Thema 2: PERCEPTION OF APPARENT SOURCE WIDTH
AND LISTENER ENVELOPMENT IN WAVE FIELD
SYNTHESIS (2012)
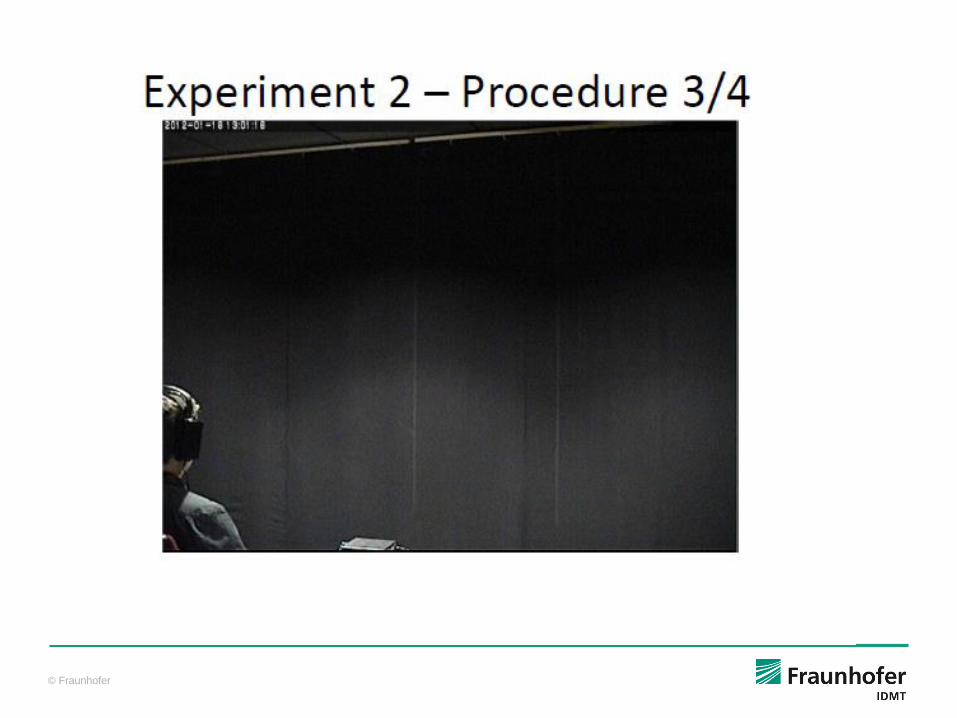
Test method:
Paired comparison
Is ASW smaller/ wider compared to the reference
Is LEV higher/ lower compared to the reference
Trainingsession before test:
presenation of maximum characteristics

© Fraunhofer
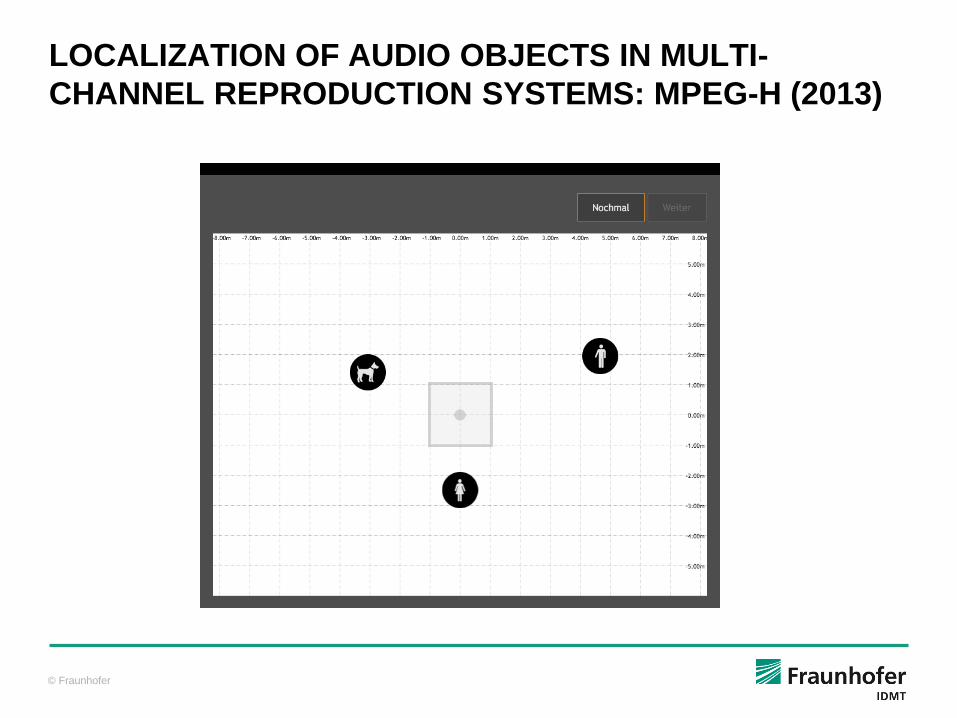
LOCALIZATION OF AUDIO OBJECTS IN MULTI-
CHANNEL REPRODUCTION SYSTEMS: MPEG-H (2013)
Spatial audio systems should create natural sound field
Perception of loudspeaker could influence this perception
Design of a localization test:
Without visual cues
Blindfolded
Moveable listening cubical
Different listening positions
Design of a Test GUI

© Fraunhofer
LOCALIZATION OF AUDIO OBJECTS IN MULTI-
CHANNEL REPRODUCTION SYSTEMS: MPEG-H (2013)
© Fraunhofer
LOCALIZATION OF AUDIO OBJECTS IN MULTI-
CHANNEL REPRODUCTION SYSTEMS: MPEG-H (2013)

© Fraunhofer
Und nun? Ideen für Tests WS 2014/2015
Lärmbewertung und Lärmmessung
Ermittlung von psychoakustischen Größen in der Wahrnehmung von
Wohlklang
Fehler bei der Auralisation von Arraydaten
Einfluss der Skalen auf die Bewertung bei Hörtests

© Fraunhofer
Es lärmt….
Lärm/Geräuschbewertung und -messung
Bewertung der Soundscape um einen herum (Café, Park, Hörsaal etc.)
Was muss man da alles aufnehmen?
Woraus setzt sich Lärmempfinden zusammen?
Ermittlung von psychoakustischen Größen in der Wahrnehmung von
Wohlklang
„objektive Maße“ Rauigkeit, Schärfe etc. (Signalanalyse)
Wie weit korrelieren diese mit subjektiver Empfindung?
Wie kann ich denn den Wohlklang messen?
Aus welchen Parametern setzt sich Wohlklang zusammen?

© Fraunhofer
Skalen und deren Auswirkung
Denkbar als alleinstehendes Thema oder Add-on zu anderen Themen
Wie unterscheiden sich die Ergebnisse bei Verwendung
Kontinuierliche vs. diskrete Skala
Radio buttons vs. Drop-down menüs