ucs fixing food - union of concerned scientists · 2019-10-10 · this union of concerned...
TRANSCRIPT
January 2016
Fixing FoodFresh Solutions from Five U.S. Cities
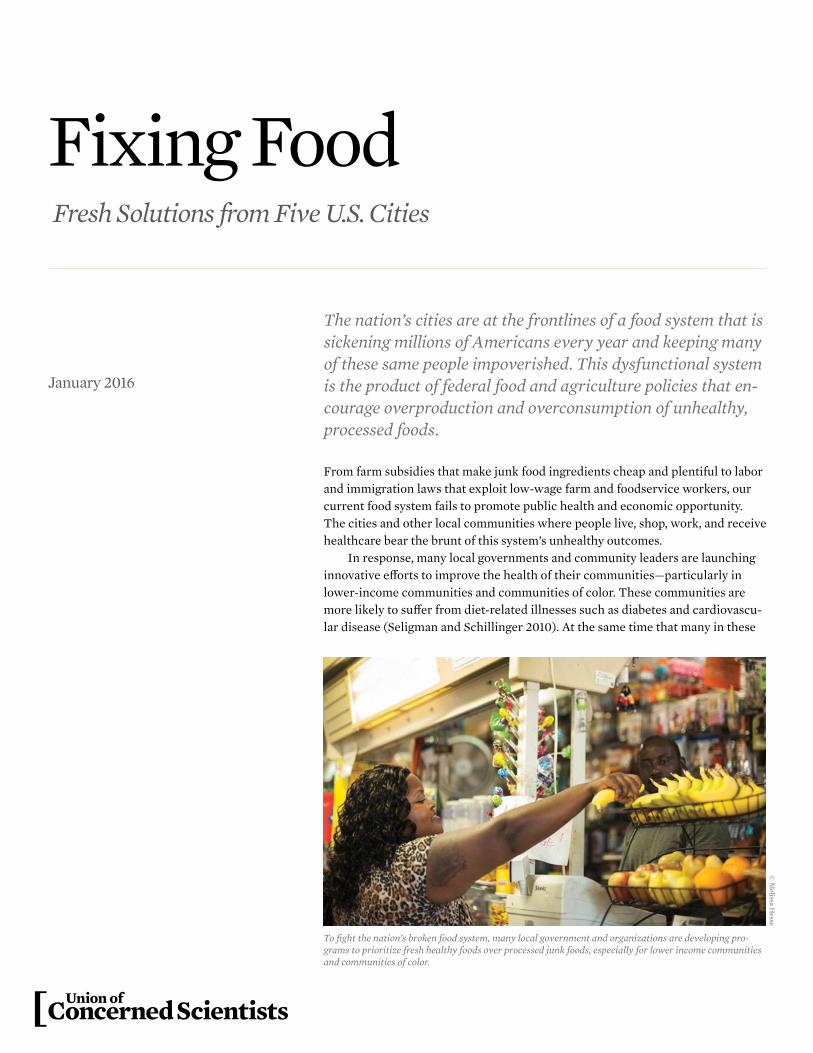
The nation’s cities are at the frontlines of a food system that is sickening millions of Americans every year and keeping many of these same people impoverished. This dysfunctional system is the product of federal food and agriculture policies that en-courage overproduction and overconsumption of unhealthy, processed foods.
© M
elissa Hesse
From farm subsidies that make junk food ingredients cheap and plentiful to labor and immigration laws that exploit low-wage farm and foodservice workers, our current food system fails to promote public health and economic opportunity. The cities and other local communities where people live, shop, work, and receive healthcare bear the brunt of this system’s unhealthy outcomes.
In response, many local governments and community leaders are launching innovative efforts to improve the health of their communities—particularly in lower-income communities and communities of color. These communities are more likely to suffer from diet-related illnesses such as diabetes and cardiovascu-lar disease (Seligman and Schillinger 2010). At the same time that many in these
To fight the nation’s broken food system, many local government and organizations are developing pro-grams to prioritize fresh healthy foods over processed junk foods, especially for lower income communities and communities of color.
2 union of concerned scientists
communities struggle with diet-related diseases, they also go hungry or are uncertain about where their next meals will come from. In an effort to remake a food system that is work-ing against the health of their neighborhoods’ residents, city officials and community leaders are experimenting with a variety of policies and programs aimed at increasing access to healthy food for people of all incomes and backgrounds.
This Union of Concerned Scientists (UCS) report docu-ments some of the innovative ways that local leaders are combating a broken food system. We highlight five urban communities that demonstrate the creativity and entrepre-neurial spirit of policy makers and community leaders who are implementing programs that help residents grow and sell healthy food, train the next generation of farmers, and bring healthy food to places where people gather. These case stud-ies may be models that other local communities can learn from and adapt to their own unique challenges and needs. They may also provide impetus for state and national advo-cates and leaders to scale these programs to reach more of the people who need them.
These case studies should also support the growing num-ber of organizations and individuals who have concluded that our nation’s food system—and the public policies that have created and entrenched it—requires a fundamental overhaul. Although the local policies and programs we document are still in their early stages, they collectively suggest the possi-bility of a different food system that could be centered on pro-moting healthy diets, ensuring environmental sustainability, and generating economic opportunity for all Americans. Lo-cal communities such as those we profile should not have to fight an unhealthy, unfair, and unsustainable food system or expend their resources and energies undoing the effects of such a system. Instead of stacking the deck against communi-ties, national policy should help create conditions that allow people in every community to take part in a healthy, equita-ble, and sustainable food system. This report offers a national policy recommendation to that end.
To select the five cities profiled here, UCS first reviewed a database of local food policies maintained by the Center for a Livable Future at the Johns Hopkins Bloomberg School of Public Health and identified a list of cities that had enacted multiple policies/programs (CLF 2015). We then cross-referenced that list with the National League of Cities’ healthier communities data-base (NLC 2015). Based on policy/program innovation, population size, and geographic location, the UCS research team narrowed the list of candidates to 10 cities. After interviewing various stakeholders in each commu-nity, we selected five cities to showcase on the basis of their demonstrated potential to address different kinds of disparities in the nation’s food system.
BOX 1.
How We Selected the Case Studies
Local communities should not have to fight an unhealthy, unfair, and unsustainable food system or expend their resources and energies undoing the effects of such a system.
Solving Local Food System Challenges from Urban Farm to Fork
We reviewed hundreds of initiatives taking place in dozens of U.S. cities (see Box 1), ultimately choosing five case studies that illustrate the challenges to accessing healthy food in cities and that provide models of creative solutions. Collectively, the five case studies show how local policies and programs can tackle food system challenges from farm to fork (see Box 3, p. 4).
The first case study highlights Oakland, CA, where urban farming arose in disadvantaged communities as a response to rapidly increasing cost of living. When urban farmers found themselves hampered by large municipal permit fees, a local food policy council—together with engaged residents—worked with the city government to remove the permit barrier, open-ing the door to the possibility of increased urban gardening and produce sales across the city. We also profile efforts underway in Memphis, TN, where a nonprofit organization has created a five-month program that trains a new generation of farmers in sustainable farming practices. This program has the potential to revamp a declining farm economy and provide economic opportunities for young agricultural entrepreneurs.
The case of Louisville, KY, shifts focus from food produc-tion to food distribution. While there is high demand for fresh produce throughout the city, some consumers have difficulty getting to grocery stores and farmers markets. In response, a community organization launched an innovative program that enables people in disadvantaged neighborhoods
3Fixing Food
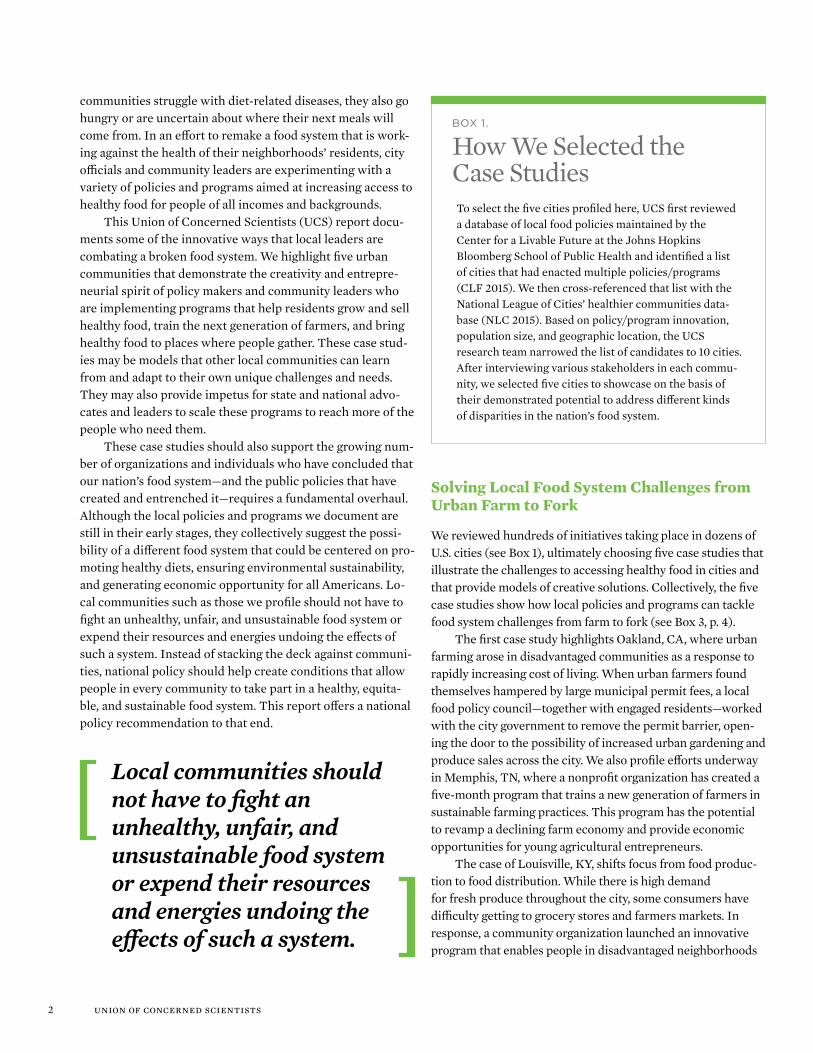
The five cities we profile—Oakland, Memphis, Louisville, Baltimore, and Minneapolis—have populations that range between 400,000 and 700,000 (Table 1). While whites account for nearly two-thirds of the populations in Louisville and Minneapolis, they account for only about one-third of the populations in Oakland, Memphis, and Baltimore. In each of the cities, the percentage of residents living below the poverty line exceeds the national average of 15 percent; in Baltimore and Memphis, these percentages are well above the national average: 24 and 27 percent, respectively.
Table 1 presents the prevalence of several diet-related chronic diseases in these cities. Among them, Louisville has
BOX 2.
Key Characteristics of Our Five Cities
Oakland Memphis Louisville Minneapolis Baltimore National
Demographic Information
Population 406,253 653,450 609,893 400,070 622,793 318,857,056
% White 26% 28% 71% 64% 30% 63%
% African American 28% 63% 23% 19% 64% 13%
% Hispanic or Latino 25% 7% 5% 11% 4% 17%
% Asian 17% 2% 2% 6% 2% 5%
Median Household Income $52,583 $36,912 $44,159 $49,885 $41,385 $53,046
% Living Below Poverty Line 21% 27% 18% 23% 24% 15%
Diet-Related Chronic Illness Prevalence
High Blood Pressure (Adults) 25% 36% 39% 17% 32% 31%
Diabetes (Adults) 6% 12% 10% 6% 14% 10%
Obesity (Adults) 18% 34% 29% 24% 36% 29%
Obesity (Children) 18% 18% 21% 11% 17% 16%
TABLE 1. Characteristics of Profiled Cities
SOURCES AND NOTES: DEMOGRAPHIC INFORMATION OBTAINED FROM U.S. CENSUS BUREAU (USCB 2015). DATA REPORTED FOR CHRONIC ILLNESSES IN OAK-LAND REPRESENTS ALAMEDA COUNTY (ACPHD 2014). DATA REPORTED FOR CHRONIC ILLNESSES IN MEMPHIS REPRESENTS SHELBY COUNTY (RMC 2013). LOUIS-VILLE DATA IS FROM LMPHW (2014) AND KCHFS (2013). MINNEAPOLIS DATA IS FROM CDC (2013A), CHCM (2012), CORY ET AL. (2010), AND PFH (2010). BALTIMORE DATA IS FROM BCHD (2013), CDC (2013B), BCHD (2012), AND BCHD (2009). NATIONAL DATA IS FROM UNITED HEALTH FOUNDATION (2015).
the highest childhood obesity rate (21 percent) and percentage of residents with high blood pressure (39 percent), while the percentage of adults who are diabetic (10 percent) and obese (29 percent) is the same as the national average. Diet-related illnesses are also a challenge in Baltimore and Memphis, as the prevalence of high blood pressure, diabetes, and obesity are greater than national averages. The prevalence of adult diet- related chronic diseases is lower in Minneapolis and Oakland than nationally. However, the childhood obesity rate in Oakland (18 percent) exceeds the national average of 16 percent.

4 union of concerned scientists
More than 800 acres of publicly owned land in Oakland could be used for food production and farming. Just 500 of these acres could produce as much as 48 percent of the vegetables consumed in the city.
major takeaway from this discussion was that even though the cities are markedly different from each other, they are all using food system reforms to rectify similar health and food access disparities.
Using Policy to Remove Barriers to Urban Farming and Promoting Food Justice in Oakland, CA
Oakland’s demographic profile is rapidly changing. Gentrifi-cation of Oakland’s neighborhoods has raised concerns among residents, particularly in communities of color, about retaining the city’s culture, quality of life, and housing affordability, as well as ensuring that policy deliberations consider their perspectives. In an effort to ensure such representation in initiatives taken to improve Oakland’s food system, the Oakland Food Policy Council (OFPC) was established to bring together diverse stakeholders to study the city’s food system and offer recommendations for policy change.1 The goal of the OFPC is to work with constituen-cies in Oakland by conducting research and community engagement to promote equitable and sustainable food poli-cies. The OFPC’s top policy priorities include economic security and development, food access, local and sustainable food procurement, and urban agriculture (OFPC 2015).
to pool resources—including food assistance benefits—and purchase food directly from local farmers at central gathering locations in neighborhoods, such as churches and community centers.
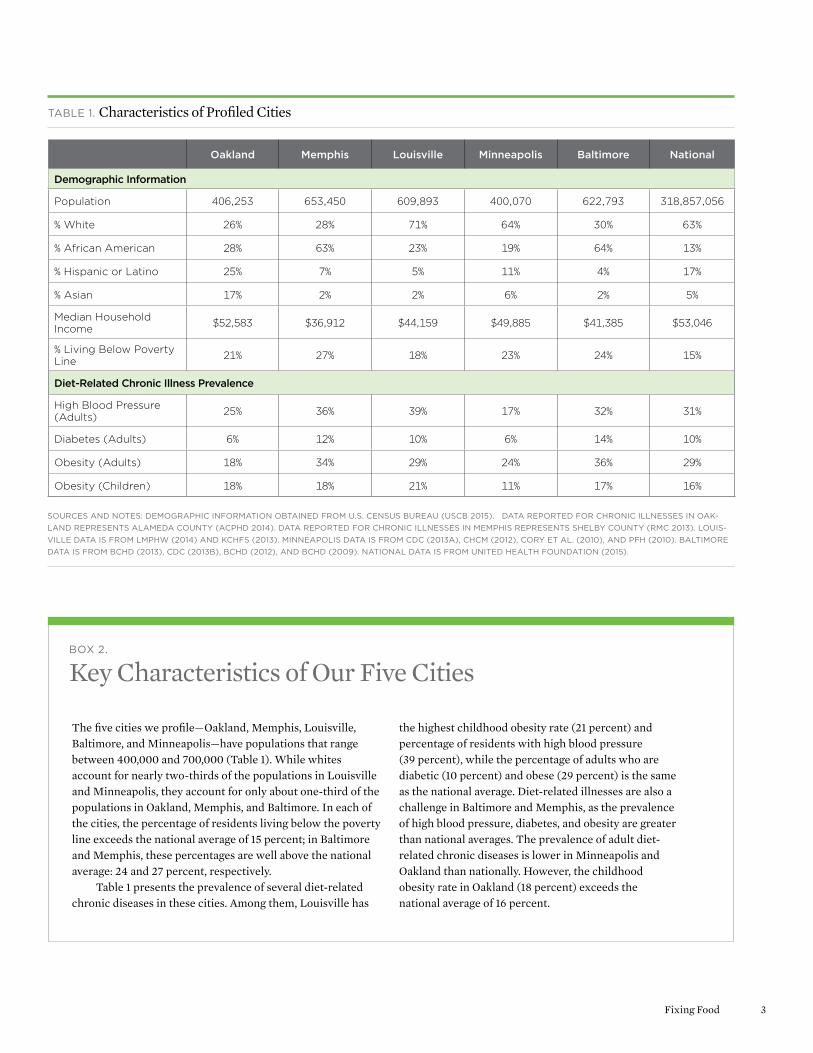
Our final two profiles highlight efforts to make healthy food purchases easier for urban residents facing time or transportation challenges. A city-sponsored program in Baltimore, MD, created a “virtual supermarket” that allows community members redeeming food assistance benefits to order groceries online from a local grocer and have them delivered to a nearby library or housing complex. And in Minneapolis, MN, the health department partnered with community organizations to assist the city’s corner store owners with marketing and promoting fruits and vegeta-bles—which they are required to stock by a citywide ordi-nance. Community-based organizations and local health departments in the greater Minneapolis region have since created other initiatives to complement the promotion of fresh produce in corner stores.
In addition to examining various policies and initiatives at work in these five cities, UCS convened a group of com-munity leaders from each of the cities (see Box 5, p. 16). The objective was to gain a better understanding of how leaders are navigating the current intricacies of the food system and what they hope to achieve with each of their programs. A
The five case studies featured in this report show how local policies and programs can address food system challenges at different points in the supply chain, from farm to fork.
BOX 3.
Case Studies across the Food System
Production
URBAN AGRICULTUREOakland, CA
FARMER TRAININGMemphis, TN
Distribution
FARM TO CONSUMERLouisville, KY
Consumption
HEALTHY FOOD AVAILABILITYMinneapolis, MN Baltimore, MD

5Fixing Food
In California, the Oakland Food Policy Council launched the Right to Grow campaign to promote food as a human right. In 2014, the group successfully removed permitting requirements for farming on vacant lots and selling the food to the community.
© L
ori E
anes
Community organizing is the OFPC’s key strategy for en-gaging Oakland’s diverse residents. The OFPC director, Esper-anza Pallana, explains that the OFPC “is a policy council, but it’s not just about policy. It’s about building relationships, in-cluding informal community leaders in the food conversation, and gaining trust.” One of its first priorities in accomplishing this objective was altering the structure of the committee so that its composition better reflected the community. When the OFPC initially formed, it was composed predominately of white individuals from academic and professional backgrounds who were not from communities affected by food insecurity. There is now improved representation of racially diverse popu-lations, with two seats of a 21-seat council reserved for youth members and two reserved for community members.
A POLICY SOLUTION TO ENSURE THE “RIGHT TO GROW AND SELL”
Urban agriculture has been a part of Oakland for decades. This practice has increased over time in low-income neigh-borhoods primarily because some Oakland neighborhoods
experienced redlining and decreased investment in the latter half of the twentieth century, which contributed to concen-trated poverty and, among other challenges, a lack of food retail establishments (McClintock 2011). Urban agriculture emerged as a means of providing healthy food and job train-ing in these neighborhoods. For example, in the 1960s and 1970s, the Black Panther Party operated a free breakfast pro-gram that turned food grown in local community gardens into meals served at Oakland schools, churches, and community centers (McClintock 2011).
Families in Oakland believe that selling food they have grown should be a right and that it is important to have a food system that enables local food producers to exist. To resi-dents, this capability reflects “food justice” because it con-nects people to their food source independent of corporations and promotes community self-sufficiency and resiliency. OFPC Director Pallana succinctly summarized the concept of food justice by stating, “Justice is power; we know we have achieved equity when communities of color hold power in the food system.”

6 union of concerned scientists
However, until recently, policy barriers prevented Oak-land residents from selling food they had grown. Oakland’s zoning rules allow residents to sell food grown in their own backyards if they obtain a permit, whereas growing and sell-ing food on vacant lots or other land without a residence re-quired a “conditional use” permit. Would-be growers viewed the permit and its nonrefundable $3,000 application fee as excessive and unfair, particularly since developers were able to get permits waived to expedite commercial projects. The OFPC believed that getting this policy changed was funda-mental to their long-term objective to promote urban agricul-ture throughout the city on blighted or vacant properties whose owners are in tax default.
In 2014, the OFPC launched the Right to Grow campaign to remove the permitting requirement and facilitate commu-nity sales of food. It collected over 500 petition signatures asking for a zoning change, and with the assistance of the planning commission and city council members, called for a hearing on the issue by Oakland’s planning department. After repeated scheduling delays, the OFPC turned for assistance to community members, who joined OFPC representatives in requesting that their issue be reviewed. After years of building relationships with the community, Pallana felt that community members helped the OFPC because, “People show up for peo-ple. They show up not just to make a point or for a cause—but for people.” The OFPC’s advocacy efforts proved successful on November 18, 2014, when the city implemented an ordinance that waived the permitting requirement, enabling residents to grow and sell food without a permit on land throughout the city, except in industrial zones or public parks.
POTENTIAL IMPACTS OF THE POLICY CHANGE ON FOOD CONSUMPTION IN OAKLAND
It is too early to evaluate the impacts of Oakland’s Right to Grow ordinance, as some urban gardening has thrived with-out selling food. However, the OFPC views its passage and implementation as an important step in a process of ratchet-ing up food cultivation across the city. In the absence of the permitting obstacle, urban farmers will find it easier to build on success stories such as City Slicker Farms in West Oak-land, which produced more than 220,000 pounds of food on 1.7 acres between 2001 and 2013 (City Slicker Farms 2013). City Slicker Farms sets prices that make its food affordable to those with lower incomes and uses proceeds to fund an edu-cation program for community gardening.
Research on the impacts of urban agriculture in Oakland and other cities reveals the potential for urban residents farm-ing publicly owned and formerly vacant land to produce large quantities of the foods—including high-value products such as vegetables and eggs (Rogus and Dimitri 2014)—needed to
Tennessee is a leading producer of tobacco and cotton but ranks in the bottom third among U.S. states for fruit and vegetable production.
address dietary deficiencies in many urban populations. One study in Detroit estimated that with commercial yields, urban farmers using just 74 percent of the city’s publicly owned va-cant land could produce three-quarters of the fresh vegeta-bles and nearly half the fresh fruit currently consumed in Detroit (Colasanti, Litjens, and Hamm 2010). Researchers have conducted similar analyses in Oakland, in one case find-ing that more than 800 acres of publicly owned land in Oak-land could be used for food production and that farming just 500 of these acres could produce as much as 48 percent of the vegetables consumed in the city (McClintock 2011). Another study estimated that 570 acres of backyard gardens, public easements, neighborhood gardens, edible landscaping, and commercial farms in Oakland could contribute to a scenario in which 30 percent of Oakland’s food supply was regionally sourced (Unger and Wooten 2006). Another benefit of urban agriculture is education: gardens help familiarize people with fresh produce that can be prepared at home (McCormack et al. 2010).
Thus, while much work remains for the OFPC as it pro-motes urban agriculture elsewhere around the city, getting the ordinance adopted was a significant accomplishment on the path toward food justice and policy engagement for Oak-land residents.
Training Sustainable Farm Entrepreneurs in Memphis, TN
A recent ranking of community health by state placed Ten-nessee near the bottom—forty-fifth in the nation. It has high rates of diet-related chronic disease (United Health Founda-tion 2015), and its farm sector is not well positioned to ad-dress this disease burden. Tennessee is a leading producer of tobacco and cotton but ranks in the bottom third among U.S. states for fruit and vegetable production (USDA 2012).
Farmers in Tennessee are aging, and the farm sector is in decline. Today, the average Tennessee farmer is 59 years old, and 90 percent are male (USDA 2012). Shelby County, where Memphis is located, experienced a 59 percent decline in

7Fixing Food
Roots Memphis opened its Farm Academy in 2013 to reverse the decline of farming in Shelby County, TN. The academy trains students in areas of agriculture, entrepreneurship, and sustainability.
© M
ike
Brow
n
active farms over five years, with just 411 farms remaining in 2012 (USDA 2012; USDA 2007). One factor contributing to the challenging economics of farming is low annual sales. Half the county’s farms had less than $2,500 in annual sales, and many operated at a loss (USDA 2012). Farming requires significant start-up costs: Usual start-up costs for beginning farmers in the Memphis area can vary widely, from roughly $10,000 to $25,000 in equipment plus the cost of land, which can range from $100,000 to more than $1 million (Riddle 2015). The inability to recoup these costs through future sales often makes farming challenging.
LAUNCHING THE FARM ACADEMY
The nonprofit urban farm, Roots Memphis, recently stepped in to help turn this situation around. The organization pur-sues a “triple bottom line” of social, economic, and environ-mental sustainability on its five-acre farm operation by growing fruits and vegetables without the use of chemicals and pesticides, using environmentally restorative soil and wa-ter farm practices, and selling its produce to community members and local businesses (Roots Memphis 2015).
In 2013, Roots Memphis started its Farm Academy to train the next generation of farmers in sustainable farming practices and small business management. The Farm Acade-my hosts a five-month program that includes classes on small
farm business entrepreneurship, planning and management, sustainable agriculture theory and practice, and small-farm production skills. Students are eligible for graduation upon submitting a business plan for a small farm. Executive direc-tor Wes Riddle says that students are required to “pencil in a profit before they plow one.” He wants students to have man-agement experience before they even start farming.
Once students’ business plans are approved, they manage a quarter-acre farm plot and must demonstrate the capacity to produce the crops stated in their business plans successful-ly. When the new farmers have completed this task, the Farm Academy assists them with securing access to land (either leased or purchased), with accessing start-up funds from community partners, and with marketing, legal work, ac-counting, and other matters.
The organization has set aside two of its five acres for the Farm Academy’s farmers-in-training. In 2015, there were eight farmers-in-training (two men and six women), each working on one-quarter of an acre. For the 2015–2016 grow-ing season, Roots Memphis expects to have between 12 and 15 students in the classroom, and, upon their graduation, will transition them to the field.
By using Roots Memphis’s relationships with community members and local businesses, the Farm Academy reduces barriers for new farmers trying to sell their produce. Riddle

8 union of concerned scientists
FIGURE 1. Shelby County Farm Estimates, 1997 to 2027
Shelby County Farms (Actual)
Shelby County Farms (Projected)
Num
ber
of F
arm
s
Roots Memphis Farm Academy could help train up to 112 additional farmers by 2027, which would help reverse the decline of the farm sector in the Memphis area.
1997 2002 2007 2012 20172014 20272022
estimates that without these relationships, farmers-in- training sales could be 50 to 60 percent lower and expenses would be much higher. Roots Memphis’s customer base has increased from 45 Community Supported Agriculture (CSA)2 members in the 2014 growing season to 200 in 2015. While Roots Memphis staff grow the majority of the pro-duce in the CSA boxes, some is produced by the farmers- in-training. CSA memberships make up 70 to 80 percent of Roots Memphis’s revenue. The other sales revenue comes from farmers markets, farm-to-office deliveries at 10 retail institutions, and between six and 12 restaurants.
THE FARM ACADEMY’S POTENTIAL TO SPUR ECONOMIC GROWTH IN THE MEMPHIS AREA
The Farm Academy opened during a critical time for Shelby County—the number of individuals going into farming has been decreasing steadily for the past 15 years. The Farm Academy could help train 112 additional farmers by 2027, reversing the decline of the county’s farm sector (see Figure 1).3 Based on USDA national estimates, a small farm selling vegetables, fruit, and nuts directly to consumers (via road-side stands, farmers markets, farm stands, and CSAs) and to
Farmer Academy Opened
d
institutions (grocery stores, restaurants, and regional distrib-uters) generates an average of $35,000 in local food sales per year (Low and Vogel 2011). Thus, by 2027, the Farm Acade-my’s projected 112 graduates could be generating upward of $4 million in local food sales annually.4
Providing Local Produce to Neighborhoods in Louisville, KY
Kentucky is home to Wendell Berry, whose writings have inspired national interest in local food systems in recent decades. Yet across the state and in Louisville especially, significant food access challenges persist. Community leaders have responded to some of these challenges and have organized to improve the accessibility of healthy foods such as fruits and vegetables in low-income neighborhoods.
New Roots, a nonprofit organization in Louisville, is increasing the affordability and accessibility of local food in neighborhoods with limited access to healthy foods through its Fresh Stop Market Program. New Roots’s founder, Karyn Moskowitz, describes a Fresh Stop Market as “a cross
800
700
600
500
400
300
200
100
0

9Fixing Food
Community members create a Fresh Stop Market by pooling money and federal SNAP benefits to purchase “shares” of food from local farmers.
between a fruit and vegetable flash mob and a family reunion” (New Roots 2015). A Fresh Stop Market is conceptually simi-lar to CSA programs, which have proliferated across the country. Community members create a Fresh Stop Market by pooling money and federal Supplemental Nutrition Assis-tance Program (SNAP) benefits to purchase “shares” of food from local farmers. However, in contrast to the standard CSA model in which a member pays for the entire share in full at the beginning of the season, Fresh Stop Market subscribers need only order a share in advance and pay prior to delivery.
Shares are mostly composed of fresh fruits and vegetables but may also include pasture-raised eggs; they are designed to feed two to four people. Deliveries are typically made during the evening on a biweekly basis, and each delivery includes a newsletter containing recipes. Shares are $12 for participants who qualify for food assistance benefits and $25 for others; mothers in the Special Supplemental Nutrition Program for Women, Infants, and Children (WIC) pay $6, and New Roots matches this payment. Fresh Stop Market sites, which include churches and one school, must be authorized SNAP retailers.
Another difference between the CSA model and a Fresh Stop Market is that while traditional CSAs are organized by individual farms, Fresh Stop Markets are organized by community members who approach New Roots staff about
In Louisville, KY, community-run Fresh Stop Markets provide local, healthy produce at an affordable cost in low-income neighborhoods. Participants pay one week in advance, using a variety of payment options, including SNAP.
© J
ames
Ben
nett
creating a market. Community and/or church members inter-ested in food justice invite New Roots into their community to learn about the feasibility of establishing a Fresh Stop Market site. New Roots then selects the sites having the most leadership potential. Residents from the neighborhood and surrounding neighborhoods lead the Fresh Stop Markets in coordination with New Roots. New Roots runs a leadership institute that trains community members so they can take over all aspects of Fresh Stop Market organizing and opera-tion. There were nine Fresh Stop Markets operating in Kentucky (seven in Louisville) in 2015.

10 union of concerned scientists
The Virtual Supermarket Program, administered by the Baltimore City Health Department, is expanding access to healthy affordable food to the city’s largest public housing communities. Above, a resident and a volunteer receive a delivery of groceries at the POWER House Community Center, located within the Perkins Homes community.
© Baltim
arket
The farms that supply food to the Markets are almost all within 100 miles of Louisville. New Roots recruits farmers from area farmers markets and other social networks with help from a Fresh Stop farmer, Andre Barbour of Barbour Farms. Barbour Farms is a fifth-generation family-owned- and-operated farm. Barbour’s involvement has been essential in connecting other small Kentucky farmers with customers—he says that he just enjoys “spreading the wealth to other small farmers” in the area. He also established an informal cooperative of African American farmers to provide produce for affordable CSAs, which enables them to pool resources, coordinate production with members based on their skills and knowledge, and mitigate financial risk to individual mem-bers by sharing pooled income.
FOOD PRODUCTS SOLD IN FRESH STOP MARKETS
UCS tabulated 2014 data collected by New Roots from the Shawnee neighborhood Fresh Stop Market, one of the larger Markets. The Shawnee Fresh Stop Market began in 2011 and is held at a church. The number of shares ranged from 56 to 88 in each of the 11 deliveries made to Shawnee in 2014; sales
per delivery ranged from $776 to $1,489, totaling more than $12,500. Frequently delivered produce included kale, cucum-bers, corn, onions, collards, tomatoes, zucchini, green beans, peppers, and apples.
Working with Local Government to Solve Food Access Challenges with Virtual Supermarkets in Baltimore, MD
Geographic proximity, transportation, and scheduling chal-lenges can make it difficult for residents in low-income neighborhoods to access grocery stores for healthier food purchases. Those receiving SNAP benefits have to be physi-cally present to make SNAP food purchases.
In 2010, the Baltimore City Health Department (BCHD) identified buildings in the city’s impoverished neighborhoods that could serve as conduits for online grocery ordering. The Virtual Supermarket Program started as a partnership be-tween BCHD, a grocer, and a library. The program enables community members to order from the grocer online and
11Fixing Food
then pick groceries up at the library. Unlike other online grocery ordering services, customers do not pay for grocer-ies until they are delivered. This structure provides custom-ers multiple payment options, including SNAP, credit, debit, and cash. BCHD obtained a grant to cover the grocer’s transportation costs so that residents do not have to pay a delivery fee.
The Virtual Supermarket Program also provides train-ing to residents so they can manage the program, giving the community greater ownership and control of the project. The program has subsequently expanded to four sites: one public library and three housing complexes. As of April 2015, more than 500 unique customers had placed over 4,000 orders totaling $132,000 (BCHD 2015). More in-depth data collection efforts are under way, including track-ing customer orders over time and quantifying the extent to which picking up groceries at a common location increases interactions among neighbors (Flamm 2015).
The Virtual Supermarket Program has overcome unan-ticipated challenges. The program was suspended for nine months in 2013 when the project’s original grocer went out of business. However, the program was relaunched at two ShopRite stores. The participating ShopRite store in How-ard Park opened in 2014 in an underserved community and is the largest grocery store in Baltimore; it was financed with funds from the Healthy Food Financing Initiative, a federal program that offers grants and loans to retailers to establish venues in underserved areas (TRF 2014). This ex-ample highlights how community interventions and federal programs intended to promote healthy food can comple-ment and reinforce each other.
DEMONSTRATION PROJECTS FOR ONLINE REDEMPTION
OF FOOD ASSISTANCE BENEFITS
SNAP recipients have historically not been able to redeem their benefits online because of security concerns. However, due in part to the success of the Virtual Supermarket Pro-gram, federal legislation was adopted in the 2014 Farm Bill that authorized demonstration projects wherein approved retailers would test the use of online technologies to pro-cess Electronic Benefit Transfer (EBT) transactions. If these projects prove successful, online benefit redemptions could become more common. One of the key attributes of the Vir-tual Supermarket Program is that it combined the ease of online ordering with a positive social shopping experience. Baltimore’s fostering of community engagement could be replicated by other agencies or institutions when imple-menting online benefit redemption programs.
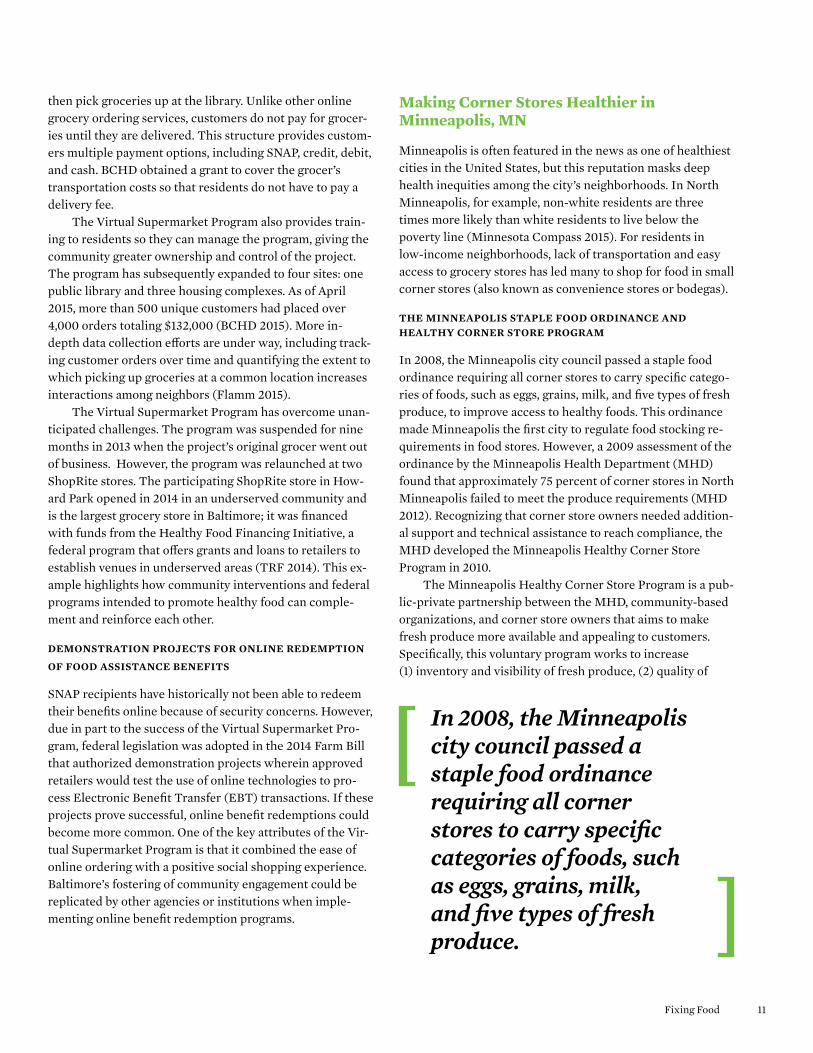
In 2008, the Minneapolis city council passed a staple food ordinance requiring all corner stores to carry specific categories of foods, such as eggs, grains, milk, and five types of fresh produce.
Making Corner Stores Healthier in Minneapolis, MN
Minneapolis is often featured in the news as one of healthiest cities in the United States, but this reputation masks deep health inequities among the city’s neighborhoods. In North Minneapolis, for example, non-white residents are three times more likely than white residents to live below the poverty line (Minnesota Compass 2015). For residents in low-income neighborhoods, lack of transportation and easy access to grocery stores has led many to shop for food in small corner stores (also known as convenience stores or bodegas).
THE MINNEAPOLIS STAPLE FOOD ORDINANCE AND HEALTHY CORNER STORE PROGRAM
In 2008, the Minneapolis city council passed a staple food ordinance requiring all corner stores to carry specific catego-ries of foods, such as eggs, grains, milk, and five types of fresh produce, to improve access to healthy foods. This ordinance made Minneapolis the first city to regulate food stocking re-quirements in food stores. However, a 2009 assessment of the ordinance by the Minneapolis Health Department (MHD) found that approximately 75 percent of corner stores in North Minneapolis failed to meet the produce requirements (MHD 2012). Recognizing that corner store owners needed addition-al support and technical assistance to reach compliance, the MHD developed the Minneapolis Healthy Corner Store Program in 2010.
The Minneapolis Healthy Corner Store Program is a pub-lic-private partnership between the MHD, community-based organizations, and corner store owners that aims to make fresh produce more available and appealing to customers. Specifically, this voluntary program works to increase (1) inventory and visibility of fresh produce, (2) quality of

12 union of concerned scientists
fresh produce, (3) store owners’ knowledge about handling and marketing fresh produce, and (4) fresh produce sales in corner stores. Between 2012 and 2013, 30 corner stores across the city participated in the Healthy Corner Store Program. Examples of Healthy Corner Store Program initiatives in-clude enhancing the appeal of fresh produce by moving it to the front of the store, arranging it in “grab and go” baskets at the cash register, placing “fresh produce” advertisements near store entrances, and listing produce prices in front of all items. Additionally, the MHD provided one-on-one technical assistance to store owners on produce handling and merchan-dising (MHD 2012).
After the Minneapolis Healthy Corner Store Program’s first year, community-based organizations sought to create
K’s Market is part of the Minneapolis Healthy Corner Store Program, developed by the Minneapolis Health Department. The program assists corner stores in comply-ing with recent legislation that requires small food stores to carry healthy fresh foods, and helps store owners use marketing techniques to increase healthy food sales.
© M
elissa Hesse
more promotional initiatives to encourage customers to purchase fresh produce in corner stores. For example, Appe-tite for Change partnered with the MHD to complement the Healthy Corner Store Program with a Fresh Fridays promo-tion program intended to increase weekend produce con-sumption. With funding from the Blue Cross Blue Shield of Minnesota, stores participating in the Healthy Corner Stores Program match fresh produce purchases up to a limit of three dollars per customer every Friday. Customers can pay with cash, EBT, or credit card. This promotional deal also helps corner stores sell produce that was not purchased during the week, thus helping to reduce spoilage and lost profits.
In a separate yet similar initiative in the nearby town of Lake Elmo, a community-based organization, Our Commu-nity Food Projects, partnered with the Washington County health department and the Lake Elmo Market to build a fresh produce section in the market’s corner store. Lake Elmo Market expanded the initiative in its second year by selling local produce grown in a community garden located directly across the street.
THE POTENTIAL FOR HEALTHY CORNER STORES TO IN-CREASE FRUIT AND VEGETABLE CONSUMPTION
North Minneapolis has 28 corner stores (ReferenceUSA 2015) across five of the area’s zip codes (University of Minnesota 2015). Five of the 28 are participating in the Minneapolis
Lake Elmo Market’s fresh produce section includes local produce grown in a community garden located directly across the street.

13Fixing Food
• Obesity: Excessive body fat measured by body mass index (BMI). BMI is weight (in kilograms) divided by height (in meters) squared. Adults are considered obese if their BMI is at or above 30.
• Type II Diabetes: A metabolic disorder that affects the way the body processes blood sugar. Left untreated or poorly managed, diabetes can cause kidney damage, blindness, and vascular insufficiencies leading to lower-limb amputations.
• High Blood Pressure: Higher-than-normal blood pressure (also called hypertension). The higher the blood pressure above normal, the greater the risk of heart disease.
• Heart Disease: Involves a narrowing of the small blood vessels that supply oxygenated blood to the heart (also known as coronary heart disease). The resulting blockage can lead to a heart attack.
• Stroke: Occurs when blood flow to part of the brain stops, as from a clogged artery, which can result in death or permanent brain damage.
BOX 4.
Leading Diet-Related Chronic Health Conditions
SOURCE: WHITENEY AND ROLFES 2012.
Healthy Corner Store Program, and more are anticipated to join as outreach and program recruitment with other stores continues.
Based on nine corner stores’ self-reported monthly finan-cial data, the MHD found that stores in the Minneapolis Healthy Corner Store Pilot Program had an average of $200 per month in produce sales, with $50 per month in profits. If all 28 corner stores in North Minneapolis participated in the Healthy Corner Store Program, approximately $5,600 per month could be generated in produce sales. These sales could yield up to 11,200 fruit and vegetable servings5 per month for community members, assuming they consumed all their pro-duce purchases.
The Healthy Corner Store Program is still in its early stages, but North Minneapolis officials hope that leveraging private-public partnerships to rectify food access challenges will reduce the health and economic disparities that exist be-tween neighborhoods in the greater Minneapolis area.
Analysis: Diet-Related Diseases Drive Up Healthcare Costs for Those Who Can Least Afford Them
Residents of the five cities we examined all face similar di-etary challenges and associated negative health impacts. But poor diets and inadequate access to healthy food extend far beyond these five cities. The challenges highlighted in these case studies are common to millions of urban, suburban, and rural Americans nationwide; they are the product of our na-tion’s broken food system.
The average American consumes just 1 cup of fruit and 1.7 cups of vegetables per day. Only 24 percent of Americans consume the amount of fruit and 13 percent the amount of vegetables recommended by federal dietary guidelines (Moore and Thompson 2015). Low-income Americans consume even fewer fruits and vegetables (Lin 2005), in part because they have less access to healthy foods and rely more on nutrient-poor processed foods (Morland, Wins, and Roux 2002).
Foods that are high in fiber, vitamins, and minerals— such as whole grains, fruits and vegetables, and lean meats—contain essential nutrients for supporting a healthy weight and protecting against chronic diseases (CDC 2009). When people consume too many unhealthy foods high in fat, sugar, and sodium and not enough healthy foods, they are more like-ly to develop diet-related chronic illnesses as indicated in Table 2 (p. 14).
As a result of poor diets exacerbated by ill-conceived pub-lic policies, millions of Americans now suffer from these debili-tating diseases which are described in more detail in Box 4.
UCS reviewed data from the U.S. Department of Health & Human Services’ Medical Expenditure Panel Survey (MEPS) to better understand the rates and impacts of chronic diet-related diseases for various groups in the United States. This survey of 26,000 patients nationwide in 2012 reveals stark differences among racial and socioeconomic groups in the prevalence of diet-related diseases and healthcare expendi-tures associated with those conditions (AHRQ 2015).6 Table 3 (p. 14) shows that certain diet-related chronic diseases dispro-portionately affect lower-income and African Americans. Spe-cifically, African Americans were more likely than whites or Hispanics to have been diagnosed with obesity, high blood pressure, diabetes, or as having suffered a stroke. Whites were most likely to have heart disease, while Hispanics had higher rates of obesity and diabetes relative to whites.
Differences in education and income levels among the racial/ethnic groups are likely associated with these health disparities. Table 3 (p. 14) also shows that whites were more likely than African Americans and Hispanics to have a college degree. Further, 58 percent of Hispanics did not have a high school degree, compared to only 25 percent of whites and 38 percent of African Americans. Hispanics and African Americans were approximately twice as likely as whites to

14 union of concerned scientists
TABLE 2. Diet Risk Factors and Chronic Diseases
TABLE 3. Chronic Conditions and Socioeconomic Status by Race/Ethnicity in the United States, 2012
Diet Risk Factors
Chronic Disease Low Fiber Intake
Low Vitamin/ Mineral Intake
High Fat Intake High Sugar IntakeHigh Sodium
Intake
Obesity 3 3 3
Type II Diabetes 3 3 3
High Blood Pressure 3 3 3
Heart Disease 3 3 3 3
Stroke 3 3
White African American Hispanic
Chronic Disease
Obesity 29% 41% 32%
Type II Diabetes 9% 13% 10%
High Blood Pressure 34% 43% 23%
Heart Disease 6% 4% 4%
Stroke 4% 5% 2%
Socioeconomic Status
Education
Less Than High School 25% 38% 58%
High School Degree or GED 26% 29% 20%
Some College 24% 23% 15%
College Degree or More 26% 11% 7%
Employment
Full Time or Part Time 60% 51% 57%
Income
Low-income 32% 59% 64%
Poor diets have been shown to increase the risk of a variety of costly chronic diseases. SOURCE: BASU ET AL. 2013; WHITENEY AND ROLFES 2012.
Note: All differences across groups are statistically significant at the p < 0.01 value.
SOURCE: ARHQ 2015.

15Fixing Food
be classified as low-income and were also more likely to be unemployed.
We further compared the total annual healthcare costs for those with and without diet-related chronic diseases covered by public insurance programs, including Medicare, Medicaid, and military health insurance for active military, veterans, and their families. As shown in Figure 2, patients diagnosed with a diet-related chronic health condition had healthcare costs that were four to six times higher than pa-tients without such a diagnosis. For example, average annual healthcare costs for patients who had not had a stroke were $1,500, compared to $10,000 for those who had. Stroke was the most expensive diet-related chronic disease, followed by coronary heart disease, diabetes, and high blood pressure.
The Future of the U.S. Food System: What Can Policymakers Learn from Our Five Cities?
Federal policies have created a food system that subsidizes the production of highly processed and empty-calorie foods while putting healthy foods out of reach for too many. These
FIGURE 2. Average Annual per Capita Public Medical Expenditures by Diet-related Chronic Disease Prevalence
Has Chronic Disease
Doesn’t have Chronic Disease
$12,000
$9,000
$6,000
$3,000
$0
Ave
rage
Ann
ual p
er C
apit
a P
ublic
Med
ical
Exp
endi
ture
s
Federal data show that public medical expenditures skyrocket when patients develop diet-related chronic diseases. Strong local and federal food policies could help reduce rates of these diseases, reducing the burden on taxpayers. Note: All differences across groups are statistically significant at the p < 0.01 value.
Obesity High Blood Pressure
Diabetes Coronary Heart Disease
Stroke
policies result in increased production of certain crops, re-gardless of their nutritional value, and increased profits for large agribusiness companies. They fail to achieve outcomes that would benefit society as a whole: the production of enough healthy food that everyone can afford, protection of the environment, and promotion of economic opportunity for farmers, food system workers, and local communities. And those with lower incomes are least able to overcome the ob-stacles set in their way—many of which are illustrated in the previous case studies.
One prominent obstacle is the influence of farm policy on fruit and vegetable production. Federal farm policy restricts fruit and vegetable production through planting restrictions and a crop insurance program that does not assist local farm-ers (Balagtas et al. 2014; O’Hara 2012). Such policies work at cross-purposes with public interest and public health objec-tives, as the average consumption of fruits and vegetables in the United States is approximately half of recommended lev-els, with even lower intake levels among low-income popula-tions (Lin and Rogers 2013).
Still, as our case studies show, communities across the country are finding ways to combat our broken food system

16 union of concerned scientists
In April 2015, UCS convened a diverse group of 10 community food advocates from the five cities profiled in this report plus Washington, D.C. The group’s objectives were to discuss how community-based food and farming initiatives and local poli-cies affect communities of color and low-income communities and to identify common goals, barriers, and opportunities to advance equitable, healthy, and sustainable food systems at the local, state, and national level. In May, the Good Food Advo-cates group reconvened via conference call to explore further the connections between federal policies and community- based food system work.
The group comprised the following advocates:• Andre Barbour, farmer, Barbour Farms (Canmer,
Kentucky)
• Carole Colter, executive director, Grow Memphis (Memphis, Tennessee)
• Ann DeLaVergne, founder and director, Our Community Food Projects (Stillwater, Minnesota)
• JuJu Harris, culinary educator and SNAP outreach coordi-nator, Arcadia Center for Sustainable Food and Agriculture (Alexandria, Virginia)
• Michelle Horovitz, co-founder, Appetite for Change (Minneapolis, Minnesota)
• Karyn Moskowitz, executive director, New Roots (Louis-ville, Kentucky)
• DeVon Nolen, project manager, Minneapolis West Broadway Farmers Market (Minneapolis, Minnesota)
• Esperanza Pallana, director, Oakland Food Policy Council (Oakland, California)
• Sabrina Wu, project director, Health for Oakland’s People and Environment Collaborative (Oakland, California)
• Clayton Williams, farm manager, Strength to Love II (Balti-more, Maryland)
The Good Food Advocates work to make good food—food that is healthy, affordable, and sustainably produced under fair work conditions—available in their communities. Food equity is a concept used by activists and advocates to describe work that seeks to create a level playing field in the food system. The Good Food Advocates noted that a truly equitable food system had to be grounded in food justice, which was described as
BOX 5.
Community Advocates Define Food Equity and “Good Food”
reconnecting people to their food source and ensuring that power is in the hands of the community. Current efforts that focus simply on issues of healthy food access fall short in addressing the systematic faults of the food system.
The group defined food equity this way:An equitable food system assures that all communities
have power over their food, to serve their economy, health, and environment.• Farmers, growers, and farmworkers are an important part
of our communities.• Self-determination is an essential piece of an equitable food
system.• Nutritious and healthy, culturally appropriate food is crit-
ical.• Equitable food systems are built on principles of safety and
trust: the ability to trust farmers and producers with the source and quality of food.
The group also identified the following barriers to equitable food systems:• Political barriers: local regulations, policies, access to polit-
ical spaces, etc.• Historical racial trauma and ongoing structural racism:
social structures and policies that remain intact and limit people of color (especially farmers and entrepreneurs) from accessing material, political, educational, and financial resources
• Financial barriers: limited access to grants and sustainable economic models
And the Good Food Advocates shared the following strategies for successfully advancing food equity:• Build strong political alliances to move policy, both at the
local and national level• Effectively engage local communities to ensure a program’s
sustainability and success• Develop cooperative economic models that fill the gaps
created by traditional funding methods. Economic models that are more inclusive and focused on community needs and ownership can provide greater opportunities for growth within the community.
A more detailed summary of the Good Food Advocates’ discussions can be found at www.ucsusa.org/fixingfood.
17Fixing Food
Federal policymakers should provide thesupport and resourcesnecessary for theseprograms to flourishnationwide.
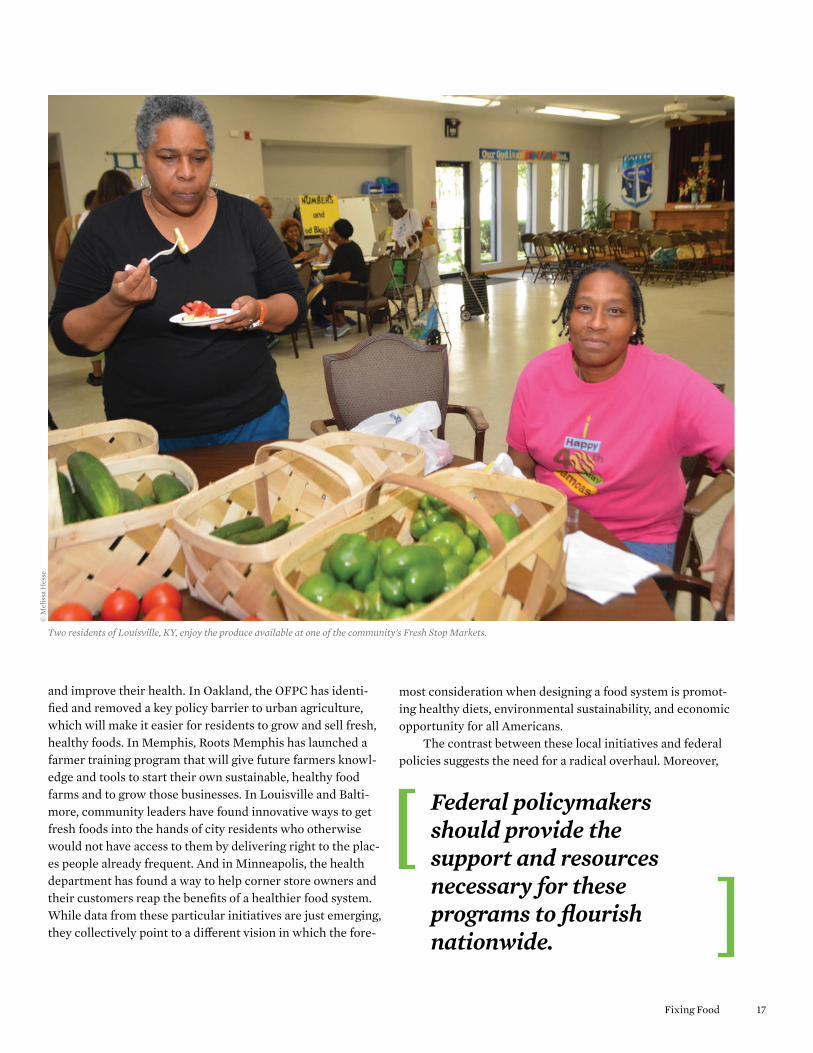
Two residents of Louisville, KY, enjoy the produce available at one of the community’s Fresh Stop Markets.
© M
elis
sa H
esse
and improve their health. In Oakland, the OFPC has identi-fied and removed a key policy barrier to urban agriculture, which will make it easier for residents to grow and sell fresh, healthy foods. In Memphis, Roots Memphis has launched a farmer training program that will give future farmers knowl-edge and tools to start their own sustainable, healthy food farms and to grow those businesses. In Louisville and Balti-more, community leaders have found innovative ways to get fresh foods into the hands of city residents who otherwise would not have access to them by delivering right to the plac-es people already frequent. And in Minneapolis, the health department has found a way to help corner store owners and their customers reap the benefits of a healthier food system. While data from these particular initiatives are just emerging, they collectively point to a different vision in which the fore-
most consideration when designing a food system is promot-ing healthy diets, environmental sustainability, and economic opportunity for all Americans.
The contrast between these local initiatives and federal policies suggests the need for a radical overhaul. Moreover,

18 union of concerned scientists
Lindsey Haynes-Maslow, PhD, MHA, is a food systems and health analyst in the UCS Food and Environment Program. Karen Perry Stillerman, MPA, is a senior analyst and deputy director of the program. Jenn Yates, MS, is manager of campaigns and advocacy for the program.
ACKNOWLEDGMENTSThis report was made possible in part through the generous support of Claneil Foundation, Inc.; the Bernard F. and Alva B. Gimbel Foundation; the David B. Gold Foundation; the W.K. Kellogg Foundation; and UCS members.
For their reviews of the report, the authors would like to thank Laura Flamm, MPH, food access director, Baltimore City Health Department; Allison Hagey, JD, MPH, associate director, PolicyLink; Michelle Horovitz, JD, co-founder, Appetite for Change; Haile Johnston, co-founder and director, Common Market Philadelphia; Karyn Moskowitz, MBA, executive director, New Roots; DeVon No-len, project manager, Minneapolis West Broadway Farmers Market; Esperanza Pallana, MPA, director, Oakland Food Policy Council; Wes Riddle, JD, executive director, Roots Memphis; and Devona Bell Sherwood, senior program pfficer, Wal-lace Center at Winrock International. The time they spent reviewing the report was considerable, and their comments and suggestions greatly improved it. At UCS, the authors thank Julia Jordan, Amelia Moore, and Ricardo Salvador for their help in developing and refining this report.
Organizational affiliations are listed for identification purposes only. The opinions expressed herein do not necessary reflect those of the organizations that funded the work or the individuals who reviewed it. The Union of Concerned Scientists bears sole responsibility for the report’s contents.
ENDNOTES1 The creation of a food policy council was recommended in a report issued by
Oakland’s Office of Sustainability in 2005–2006. The city of Oakland provided start-up funding for the council in 2007. The council’s first meeting occurred in 2009 (OFPC 2015).
2 A CSA is a partnership between local farms and a community of supporters (members). Members purchase a CSA share in return for regular deliveries of food from a local farm.
3 The projection of 112 graduates by 2027 is based on the assumption that the program will have 2 new farmers-in-training in 2014, 5 more in 2015, 5 more in 2016, and then 10 per year from 2017 to 2026. More farmers were projected in 2017 because Roots Memphis intends to double its farm size that year (Riddle 2015).
4 This is based on the assumption that there would be no additional loss of farms and that each Farm Academy graduate continues farming in Memphis. We assume that farmers would earn the same revenue as other local food farmers. Projected future earnings were adjusted for inflation at a 1.5-percent annual rate (Gloy et al. 2011).
5 It costs approximately 50¢ for one edible cup equivalent of fruits or vegetables (Stewart et al. 2011).
6 MEPS collects data from individuals who see a medical provider (such as a doctor, clinic, or hospital) in a given year. Individuals who do not visit a medical provider may have poorer health and fewer financial means than those who attend.
REFERENCESAgency for Healthcare Research and Quality (AHRQ). 2015. Medical
expenditure panel survey. Rockville, MD: U.S. Department of Health and Human Services. Online at www.ahrq.gov/research/data/meps/index.html, accessed August 8, 2015.
Alameda County Public Health Department (ACPHD). 2014. Alameda County health data profile, 2014: Community health status assessment for public health accreditation. Oakland, CA. Online at www.acphd.org/media/353060/acphd_cha.pdf, accessed August 17, 2015.
Balagtas, J.V., B. Krissoff, L. Lei, and B.J. Rickard. 2014. How has U.S. farm policy influenced fruit and vegetable production? Applied Economic Perspectives and Policy 36(2):265–286.
An Oakland, CA, community member works in a neighborhood garden on vacant city-owned land, thanks to the efforts of the Oakland Food Policy Council’s Right to Grow campaign.
© L
ori E
anes
the barriers communities encounter are often the direct or indirect results of deliberate policy choices. Local leaders are innovating and finding creative ways to overcome these barriers, but they should not have to work so hard to undo the damage caused by the current food system and the policies that underpin it. Federal policymakers should learn from these efforts and provide the support and resources necessary for them to flourish nationwide.
But communities need more from our federal policy makers. We need a national food policy that promotes healthy food, environmental sustainability, and economic opportunity, with clearly articulated goals to guide the food policies of the relevant federal agencies. And the next administration can play a leadership role in making this happen. By officially ac-knowledging the problem and setting forth a few simple prin-ciples on which most Americans agree, the next president could create momentum for reform. By making food and farm-ing a matter of national public concern and putting the coordi-nated effort of the executive branch behind it, the president can begin to transform the food system for all Americans. For more information, visit www.ucsusa.org/plateoftheunion.

19Fixing Food
Baltimore City Health Department (BCHD). 2015. Baltimarket virtual supermarket. Baltimore, MD.
Baltimore City Health Department (BCHD). 2013. Healthy Baltimore 2015: Interim status report. Baltimore, MD. Online at http://health.baltimorecity.gov/files/hb2015interimupdateoct2015optimized pdf-0, accessed August 18, 2015.
Baltimore City Health Department (BCHD). 2012. High blood pres-sure prevalence. Baltimore, MD. Online at http://baltimorecity.md.networkofcare.org/ph/indicator_detail.aspx?id=high_blood, accessed August 18, 2015.
Baltimore City Health Department (BCHD). 2009. Baltimore City community health survey: Summary results report. Baltimore, MD. Online at http://health.baltimorecity.gov/files/community- health-survey-results-2009pdf, accessed August 18, 2015.
Basu, S., P. Yoffe, N. Hills, and R.H. Lustig. 2013. The relationship of sugar to population-level diabetes prevalence: An econometric analysis of repeated cross-sectional data. PLoS ONE 8(2): e57873.
Center for a Livable Future (CLF). 2015. Food policy resources. Baltimore, MD: Johns Hopkins Bloomberg School of Public Health. Online at www.jhsph.edu/research/centers-and-institutes/johns-hopkins-center-for-a-livable-future/projects/FPN/resource/online/index.html#page-5, accessed May 25, 2015.
Centers for Disease Control and Prevention (CDC). 2013a. Community profile: Minneapolis, Minnesota. Atlanta, GA. Online at www.cdc.gov/nccdphp/dch/programs/Communities PuttingPreventiontoWork/communities/profiles/obesity-mn_minneapolis.htm, accessed August 18, 2015.
Centers for Disease Control and Prevention (CDC). 2013b. The obesity epidemic and Baltimore students. Atlanta, GA. Online at www.cdc.gov/healthyyouth/yrbs/pdf/obesity/baltimore_obesity_combo.pdf, accessed August 18, 2015.
Centers for Disease Control and Prevention (CDC). 2009. Chronic diseases: The power to prevent, the call to control: At a glance. Atlanta, GA.
Children’s Hospitals and Clinics of Minnesota (CHCM). 2012. Children’s check-ups: Reports on issues critical to the health of Minnesota children. Minneapolis, MN. Online at www.childrens mn.org/web/voice4child/203356.pdf, accessed August 18, 2015.
City Slicker Farms. 2013. 2013 annual report. Oakland, CA. Online at www.cityslickerfarms.org/sites/default/files/cityslickerfarms _2013_annual_rpt_final_compressed.pdf, accessed May 22, 2015.
Colasanti, K., C. Litjens, and M. Hamm. 2010. Growing food in the city: The production potential of Detroit’s vacant land. Lansing, MI: The C.S. Mott Group for Sustainable Food Systems at Michigan State University.
Cory, S., A. Ussery-Hall, S. Griffin-Blake, A. Easton, J. Vigeant, L. Balluz, et al. 2010. Prevalence of selected risk behaviors and chronic diseases and conditions—Steps communities, United States, 2006–2007. Morbidity and Mortality Weekly Report 59(SS08):1–37.
Flamm, L. 2015. Personal communication. Gloy, B.A., C. Hurt, M.D. Boehlje, and C. Dobbins. 2011. Farmland
values: Current and future prospects. West Lafayette, IN: Purdue University, Department of Agricultural Economics.
Kentucky Cabinet for Health and Family Services (KCHFS). 2013. Kentucky diabetes report. Frankfort, KY. Online at http://chfs.ky.gov/nr/rdonlyres/03f86f3b-93e2-4bea-89c0-25dd9c1fb1fc/0/ reporttothelrcfinal1172013tothesecretary.pdf, accessed August 28, 2015.
Lin, B. 2005. Diet quality usually varies by income status. Report No. 3. Washington, DC: U.S. Department of Agriculture, Economic Research Service.
Lin, B-H., and C. Rogers. 2013. New ERS data product links food avail-ability and food intake data. Washington, DC: U.S. Department of Agriculture. Online at www.ers.usda.gov/amber-waves/2013- february/new-ers-data-product-links-food-availability-and-food-intake-data.aspx#.VAhgNmN3cil, accessed December 13, 2014.
Louisville Metro Public Health and Wellness (LMPHW). 2014. Healthy Louisville 2020: Creating a healthier city. Louisville, KY. Online at https://louisvilleky.gov/file/hl2020reportfinalweb 091714pdf, accessed August 18, 2015.
Low, S.A., and S. Vogel. 2011. Direct and intermediated marketing of local foods in the United States. ERR-128. Washington, DC: U.S. Department of Agriculture, Economic Research Service.
McClintock, R. 2011. Cultivation, capital, and contamination: Urban agriculture in Oakland, California. Electronic Thesis and Dissertations. Berkeley, CA: University of California, Berkeley.
McCormack, L.A., M.N. Laska, N.I. Larson, and M. Story. 2010. Review of nutritional implications of farmers’ markets and community gardens: A call for evaluation and research efforts. Journal of the American Dietetic Association 110:399–408.
Minneapolis Health Department (MHD). 2012. Minneapolis Healthy Corner Store Program. Minneapolis, MN: Minneapolis Department of Health and Family Support.
Minnesota Compass. 2015. Individuals below the poverty level by race: Twin Cities 7-county region, 1999–2013. Minneapolis, MN. Online at www.mncompass.org/disparities/race#7-9532-g, accessed July 9, 2015.
Moore, L.V., and F.E. Thompson. 2015. Adults meeting fruit and vegetable intake recommendations—United States, 2013. Morbidity and Mortality Weekly Report 64(26):709–713.
Morland, K., S. Wins, and A.D. Roux. 2002. The contextual effect of the local food environment on residents’ diets: The arthroscle-rosis risk in communities study. American Journal of Public Health 92(11):1761–1767.
National League of Cities (NLC). 2015. Let’s move! Cities, towns and counties. Washington, DC. Online at www.healthy communitieshealthyfuture.org/see-progress/lmctc-sites-map/, accessed March 1, 2015.
New Roots, Inc. 2015. Louisville, KY. Online at www.newroots produce.org/, accessed May 11, 2015.
Oakland Food Policy Council (OFPC). 2015. Who we are: The people of the Oakland Food Policy Council. Oakland, CA. Online at http://oaklandfood.org/who-we-are/, accessed August 17, 2015.
O’Hara, J.K. 2012. Ensuring the harvest: Crop insurance and credit for a healthy farm and food future. Cambridge, MA: Union of Concerned Scientists.
Partnership for a Healthier Hennepin (PFH). 2010. Indicator: Adults with hypertension. Minneapolis, MN. Online at www.hennepin.us/~/media/hennepinus/your-government/research-data/a healthdata/adult-hypertension-20120327.pdf ?la=en, accessed August 15, 2015.
ReferenceUSA. 2015. Online at www.referenceusa.com/Static/AboutUs, accessed April 21, 2015.
Regional Medical Center (RMC). 2013. Regional Medical Center community health needs assessment. Memphis, TN. Online at www.region alonehealth.org/wp-content/uploads/2014/02/CHNA-2013.pdf, accessed August 18, 2015.

web: www.ucsusa.org printed on recycled paper using vegetable-based inks © JANUARY 2016 union of concerned scientists
NATIONAL HEADQUARTERS Two Brattle SquareCambridge, MA 02138-3780Phone: (617) 547-5552Fax: (617) 864-9405
WASHINGTON, DC, OFFICE1825 K St. NW, Suite 800Washington, DC 20006-1232Phone: (202) 223-6133Fax: (202) 223-6162
WEST COAST OFFICE500 12th St., Suite 340Oakland, CA 94607-4087Phone: (510) 843-1872Fax: (510) 843-3785
MIDWEST OFFICEOne N. LaSalle St., Suite 1904Chicago, IL 60602-4064Phone: (312) 578-1750Fax: (312) 578-1751
The Union of Concerned Scientists puts rigorous, independent science to work to solve our planet’s most pressing problems. Joining with citizens across the country, we combine technical analysis and effective advocacy to create innovative, practical solutions for a healthy, safe, and sustainable future.
find this document online: www.ucsusa.org/fixingfood
Restaurant Opportunities Centers United (ROC). 2012. Blacks in the restaurant industry brief. New York, NY. Online at http://rocunited.org/wp-content/uploads/2013/04/reports_blacks-in-the-industry_brief.pdf, accessed July 13, 2015.
Riddle, W. 2015. Personal communication. Rogus, S., and C. Dimitri. 2014. Agriculture in urban and peri-urban
areas in the United States: Highlights from the census of agriculture. Renewable Agriculture and Food Systems 30(1):64–78.
Roots Memphis. 2015. About us. Memphis, TN. Online at www. Rootsmemphis.org, accessed June 13, 2015.
Seligman, H.K., and D. Schillinger. 2010. Hunger and socioeconomic disparities in chronic disease. New England Journal of Medicine 363(1):6–9.
Stewart, H., J. Hyman, J.C. Buzby, E. Frazão, and A. Carlson. 2011. How much do fruits and vegetables cost? EIB-71. Washington, DC: U.S. Department of Agriculture, Economic Research Service.
The Reinvestment Fund (TRF). 2014. ShopRite of Howard Park. Baltimore, MD. Online at www.trfund.com/liberty- heights-shoprite-baltimore-md/, accessed May 5, 2015.
Unger, S., and H. Wooten. 2006. A food systems assessment for Oakland, CA: Towards a sustainable food plan. Oakland, CA: Oakland Mayor’s Office of Sustainability; Berkeley, CA: University of California, Berkeley, Department of City and Regional Planning.
United Health Foundation. 2015. America’s health rankings. Online at www.americashealthrankings.org/, accessed July 9, 2015.
U.S. Census Bureau (USCB). 2015. American FactFinder. Washington, DC. Online at http://factfinder.census.gov/faces/nav/jsf/pages/index.xhtml, accessed May 5, 2015.
U.S. Department of Agriculture (USDA). 2012. State agricultural over-view: Tennessee. Washington, DC. Online at www.nass.usda.gov/Quick_Stats/Ag_Overview/stateOverview.php?state= TENNESSEE, accessed July 9, 2015.
U.S. Department of Agriculture (USDA). 2007. Census of agriculture—County data. Washington, DC: U.S. Department of Agriculture, National Agricultural Statistics Service.
University of Minnesota. 2015. Reference map: North Minneapolis neighborhoods and ZIP codes. Minneapolis, MN. Online at http://uroc.umn.edu/programs/archive/fipse/sites/fipse-uroc.umn.edu/files/N_MPLS_ZIP_codes.pdf, accessed June 19, 2015.
Whiteney, E., and S. Rolfes. 2012. Understanding nutrition, thirteenth edition. Belmont, CA: Wadsworth Publishing.