ucrl-jc-122826 preprint - digital library/67531/metadc671084/...of its reliability allocation, then...
TRANSCRIPT

UCRL-JC-122826 Preprint
t t SYSTEMS RELIABILITY ANALYSIS FOR THE
NATIONAL IGNITION FACILITY
K.C. Majumdar, C.E. Annese, A.T. MacIntyre, A. Sicherman r-; E 1 b!' E -- Jut 8 1
This paper was prepared for submittal to the QSTI International Topical Meeting on
Probabilistic Safety Assessment
Park City, Utah September 29 - October 3,1996
June 12,1996
r
This is a preprint of a paper intended for publication in a journal or pmeedir Since changes may be ma& before publication, this preprint is made available with the understanding that it will not be cited or reproduced without the permission of the author.
DISTRIBUTION OF THIS DOCUMENT !S UNLIMITED

ThiJ docunent was p as an account of work s p c n d by an agency of the United States Government. Neither=& states hvenmrent nor the university of califomir, nor any of their employees, makes any warranty, express or implied, or assumes any legal kbiby or responsibility for the accuracy. completeness, a usefulness of any infomation, appanuus, product, or process disclosed. or reprrsentr that its use would not infringe privately owned nghts. Reference herein to any specific commerci.l product, process. or service by trade name, trademark. manufacturer, or otherwise, does not necessarily amstitnte or imply hs endorsement. recommendation. or favoring by the United States Govennnent of the University of Califomia. The views and opinions of authors expressed herein do not necessuily state or reflect those of the United States Government a the University of California, and shall not be used for advertising ar product endorsement pqmses.
*
' 1

DISCLAIMER
Portions of this document may be illegible in electronic image products. Images are produced from the best available original document.

SYSTEMS RELIABILITY ANALYSIS FOR THE NATIONAL IGNITION FACILITY*
ABSTRACT
K. C. Majumdar, C. E. Annese, A. T. MacIntyre, A. Sicherman Lawrence Livermore National Laboratory
P. 0. Box 808 Livermore, CA 94551-0808
A Reliability, Availability and Maintainability (RAM) analysis was initiated for the National Ignition Facility (NIF). The NIF is an inertial confinement fusion research facility designed to achieve controlled thennonuclear reaction; the preferred site for the NIF is the Lamnce Livennore National Laboratory (LLNL). The NIF RAM analysis has three purposes: (1) to allocate top level reliability and availability goals for the systems, (2) to develop an operability model for optimum maintainability, and (3) to determine the achievability of the allocated goals of the RAM parameters for the NIF systems and the facility operation as a whole. An allocation model assigns the reliability and availability goals for front line and support systems by a topdown approach; reliability analysis uses a bottom-up appmach to determine the system reliability and availability from component level to system level. This bottom-up approach has two functions. The first function is to venfy whether tk assigned goals of reliability and availability can be met, and the second is to gain engineering insights into the weaknesses and vulnerabilities that may compromise the attainability of the goals.
This paper describes the Ilature of the reliability analysis by looking at its application to one NIF laser system, the preampWir module (PAM) system. The PAM is analyzed by developing a reliability block diagram as a prelude to suantifying PAM reliability and availability. Such quantitication requires component level data on mem-tim-between-f&ures (MTBF) and mean- time-to-restore (MlTR). Because of the uniqueness of the
components, lack of applicable data is a serious issue. While we make attempts to address th is data issue, the major thrust of this paper is to enumelate the positive aspects of the qualitative reliability analysis by f%hue modes and effects analysis ( M A ) as a design analysis tool and to identifv the limitations of obtaining defensible quantitative reliability estimates.
fkility with state-of-the-art technology of the
I. INTRODUCTION
Inertial confinement fusion (ICF) re-h has a long history at LLNL and at other leading national and international research institutions. Associated with this evolution of technology, collaborative efforts from the University of Rochester in their Omega program, from the French program in Phebus and Megajoule (LMJ), and from other institutions culminated in the concepktal design of the NIF in 1994 [ 11. A proposed international research center comprising the world’s most powerful laser, the NIF plans to achieve ignition of fusion fuel and energy gain for the fist time in a laboratory. As a Department of Energy Defense Program facility, NIF will be a key component in the d e m e n t ’ s sciencebsed Stockpile Stewardship Program to ensure the safely and reliability of the nation’s enduring stockpile of nuclear weapons [2]. NIF passed through the advanced conceptual design review in February 1996 and has completed Mid- Title I design review in May 1996.
The NIF will utilize high-energy laser beams that will be designed and constructed from state-of-the-art technology based on quantum optic and quantum electronic devices. Operation of the facility will utilize a highly reliable pulsed power system and an integrated computerized control system. The neodymium glass laser system has 192 beams.
Viability of a capital intensive technology depends on its reliable operation. This reliability is achieved by applying established systems analytical tecbniques throughout the life of the facility. Reliability is a focal point from the conceptual design phase, all the way up to operation In the conceptual design phase, reliability goals are established for the facility and for the systems. In the Title I (preliminary) design and final design phwe, systems reliabilities estimates are finalized using systems analytical techniques such as failure mode and effects analysis (FMEA) and reliability block diagram analysis (RBDA). The details of the analyses are dependent on the availability of component fail= or reliability data and on

the system design information. This analytical process is iterative in order to take into account the evolutionary
One of the first steps in the RAM analysis [3] is to allocate preliminary reliabilities and availabilities for the NIF and for NIF systems. The allocation is based on overall facility reli+ility and availability goals set by NIF management, and on expected reliabilities of individual systems, from expert knowledge. The allocation is an iterative process, which evolves as the reliability analyses progress, and as system design evolves.
This paper discusses the methods of reliability analysis of the NIF laser systems in gemmil (Sec. 11). We also discuss the reliability analysis as applied to the PAM (Sec. II1.A). Sections 1II.B and 1II.C descrii the use of
and reliability block diagram analysis, respectively. Section IV discusses the issues on the collection and interpmation of data from a number of sources; it also describes how the issue of sparse data may be addressed. We give conclusions in Section V.
11. METHODOLOGY
nature of the designphases.
the analytical tools of failure modes and ef€m analysis
Reliability is the probability that a device or system performs its intended function without failure for a designated period of time, t under intended opexating conditions. We evaluate a system's reliability by using the analytical techniques of failure modes and effects analysis, 141, fault tree analysis (FTA) [5 ] , or reliability block diagram Analysis (RBDA) [6,.7], to detennine how closely the systems meet their allocations. For NIF, FMEA is used to identify failure modes and effects of components on the system and RBDA is used to guanbfy the reliability estimate. If a pamcular system falls short of its reliability allocation, then the designer can use these same analytical tools to identify components or p-s in the system that can be improved or modified. Matching the systems reliability with the reliability allocation from management is an iterative process, taking into account the evolutionary of the design phases and the improved knowledge about each system's component reliability.
The reliability of a system is calculated from the reliability components by developing a system reliability model. Depending on the funaional configuration of the subsystems and their associated components, they can be modeled as equivaient series, parallel circuit, or series- parallel combinatios or as a network circuit. Once this equivalent circuit has been constructed, a network reduction method is applied to solve for the overall system reliability. For components with constant faihm mte, A the reliability of the component is given by:
R = e x p ( - k t ) ,
wkre t is the period the component is in operation. For a reliability-wise series system, the system reliability, Rss, is given as:
Rss = RI x Rz x R3 . ... x Rn, n
:-I = l3 R,
For a parallel system: n
1 - 1 & = 1 - (1 - R.),
where RPS is the parallel system reliability, and R is the
Laser and associated optical component failure and repair data from Ute existing ICF laser facility, Nova, and from the NIF single beamline prototype, Beamlet, both at Lawrence Livermore National Laboratory m used for the reliability analysis, when applicable. We also used data from other similar facilities like the Omega laser at the University of Rochester and the French inertial confinement fusion facility. Industry and government agency data may not be as relevant for the environments typical for ICF. Data for nonoptical components also need to be obtained from appropriate sources.
individual component reliability.
In. PREAMPLIFIER MODULE (PAM) RELIABILITY ANALYSIS
A. PAM System Description
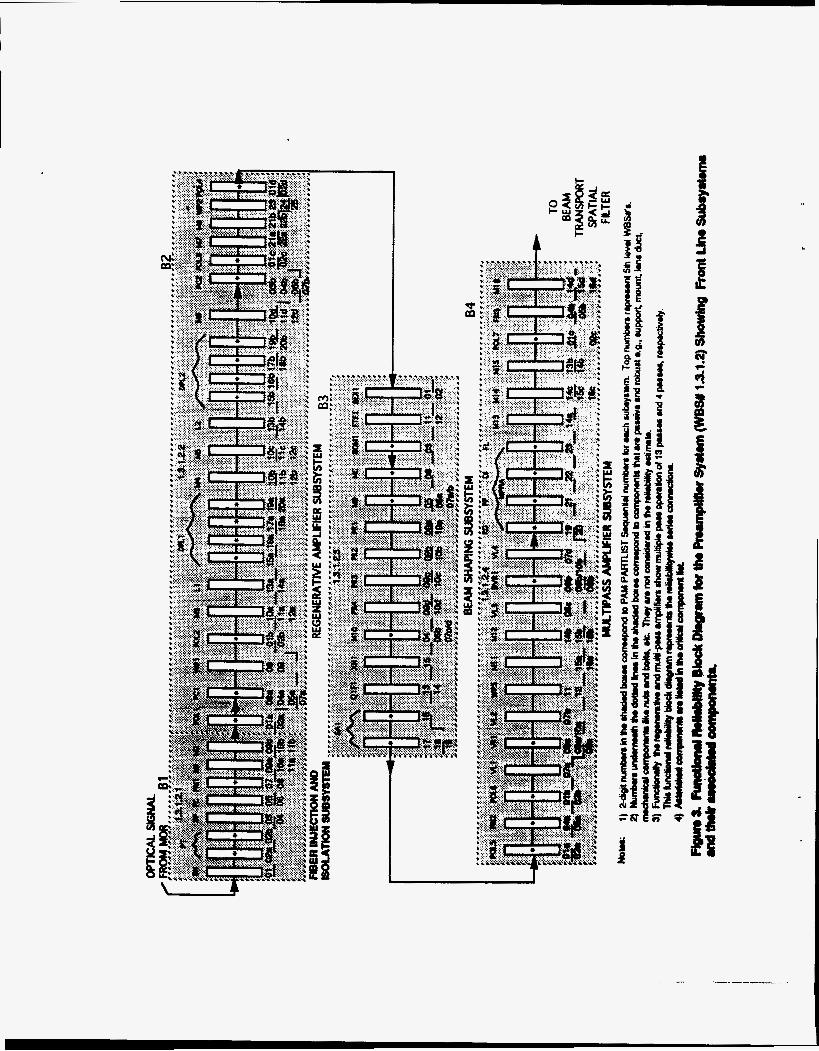
A preamplifier module (PAM) is part of the laser optical pulse generation (OPG) system. A PAM consists of four subsystems: (1) fiber injection and isolation, (2) regenerative amplifier, (3) beam shaper, and (4) the multipass amplifier. An additional subsystem was proposed during the advanced conceptual design revKw of mid-February, which will allow spectral smoothing by dispersion. This subsystem is not yet modeled in this reliability analysis. Figure 1 shows the simplified schematic of the PAM with major optical components. A nanojoule optical signal from the master oscillator mom (MOR) goes into each PAM, gets amplified at the regenemtive amplifier, is shaped to a specific spatial shape at the beam shaper, and is then fu&r amplified at the multipass amplifier to a level of a few joules. This signal then goes through the main laser chain, the transport mirror system, the optical conversion system, the final optics, and finally arrives at the target chamber with m energy level of about 17 kJ per beam. TIER m 192 beams, which together are capable of delivering mon than 3.2 MJ to the target. Figure 2 shows the energy and fluence map of the beams.
B. Failure Mode and Effects Analysis (FMEA) for PAM

Qualitative and inductive reliability analysis using FMEA is a long-standing engineering technique to gain insight into the vulnerabilities and weaknesses of a system. This technique, using a variation of the sbndard =E-Std-352 form for FMEA, is used in the PAM reliability analysis, [SI. The dabbase that has been developed for this analysis used the FileMaker Pro software. Out of agproximately 100 components in the PAM, about 80 of them a~ judged to be more failure- prone than the robust and passive supports and mounts. Thus it is these 80 faihm-pmne components that ~ I C considered in the analysis.
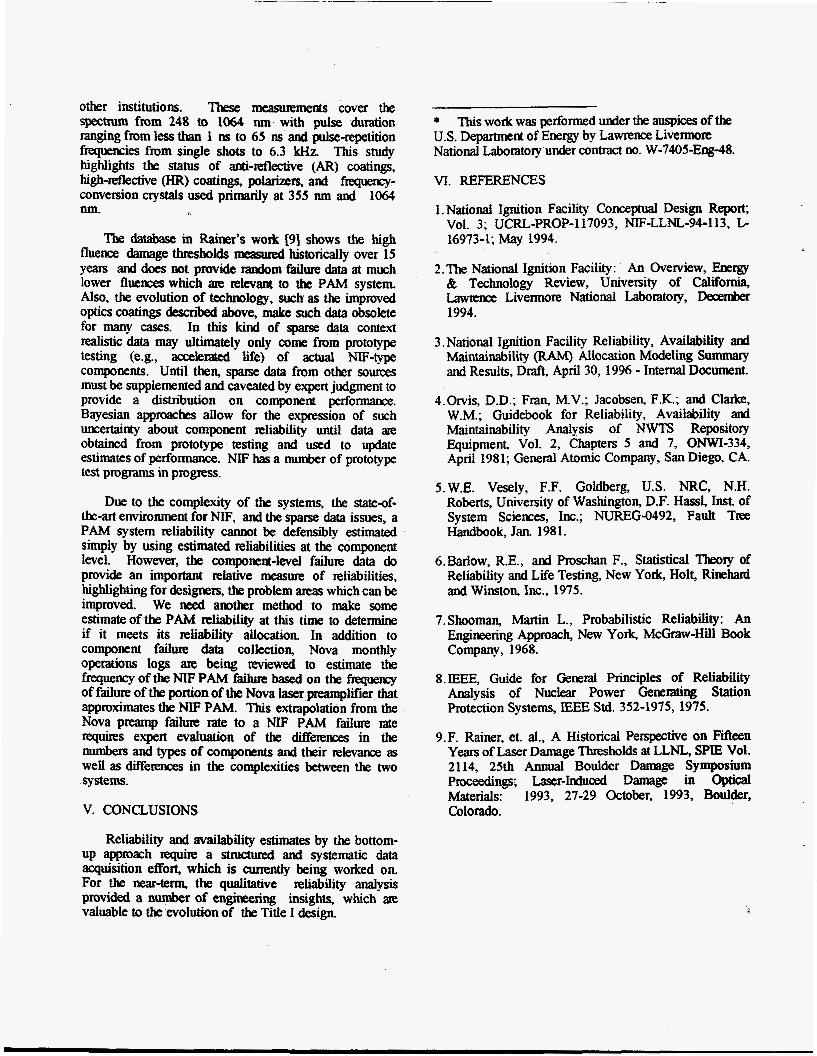
”his analysis identified a few components listed in Table 1 as critical components because of the impact of their faihwes on system performance. This process of selecting a smaller number of components was achieved by systematically examining components using M A templates. These templates assist PAM engineers and designers in identifying the components contniuting most to reliability concerns. These qualitative results provide engineering insights for design miew and design modification. Most of the components used are not commonly produced in the industry, therefore, a large number of failure data are not readily available. It is difficult to get the required information on failure modes and ef€‘ for the analysis. Quantitative reliability evaluation is similarly difficult since the applicable quantitative parameters such as mean-time-to-tailure and mean-time-to-restore atle almost nonexistent This issue of sparse data is raised in Section IV.
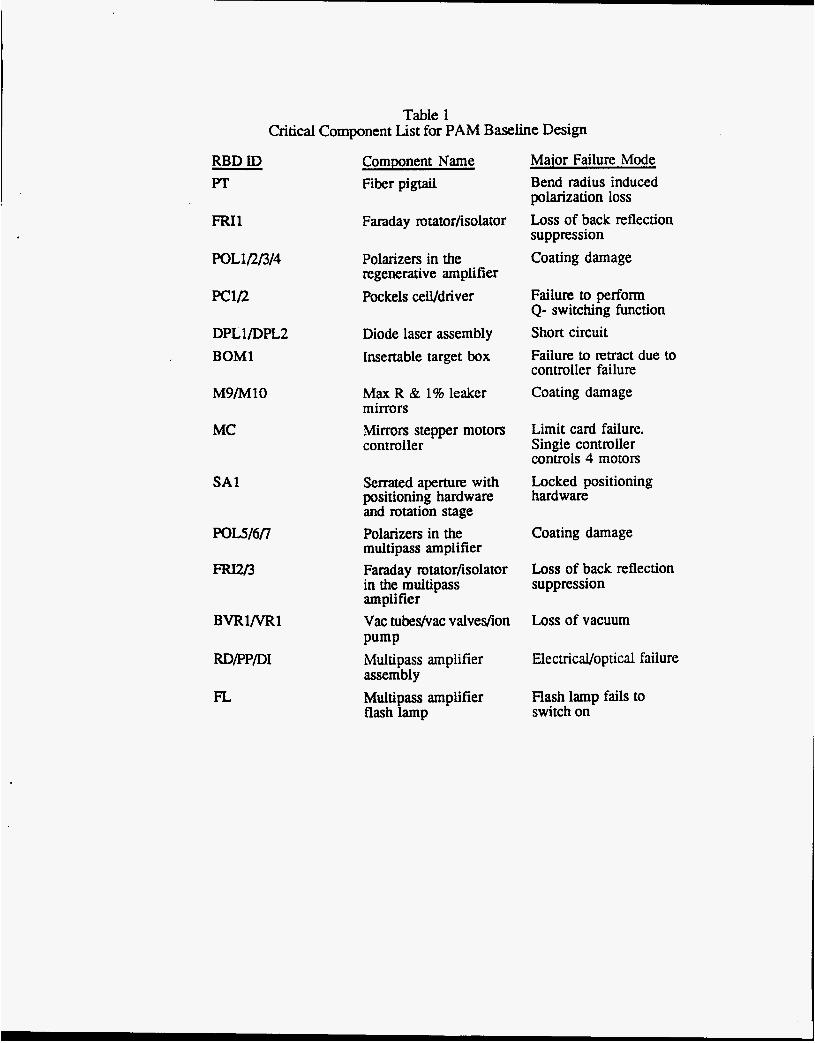
C. Reliability Block Diagram for the PAM
A functional reliability block diagram for the PAM is shown in Figure 3; footnoted items belong to the critical component list (see Table 1).
IV. DATA
A. Data Collection Effort and Status
PAM has three types of components: optical, electrical and mechanical. Failure me data is Ilequired for the FMEA for the optical components like the poiarizers, pockels cells, diode lasen, wave plate, lenses, telescopes, faraday isolators, fiber optic couplers, pigtails, and splitters. The f a i k mte data are also required for ekmicd components such as the pulsed power supply, flash lamps, and motor controllers, and for the mechanical components like the ion pumps, vacuum valves, positionen, and stepper motors.
Industry data applicability to the NIF components is qwstionabk because the NIF operating mnge of energy, power, flue=, wavelength, temporal and spatial wave shape, coating mated type, environmental conditions, and system coflguration a~ so unique. M o r e , our
initial effort on data collection was directed to the existing ICF facilities such as Nova at LLNL., Phebus ami LMJ in France, the 60 beam Omega laser facility at the University of Rochester, and the NIF single beamline prototype, Beamlet at LLNL. These facilities have some usage cdte information of some of the above types of components, and those have been obtained However, applicability of those usage mes for PAM system components cannot be easily validated because of the differexes in the abovementioned key parameters between NIF and the existing facilities. In olcler to investigate their applicability, energy and fluence maps for these facilities are being developed to compare them with NIF parameters at equivalent locations. We have, therefore, conducted multiple intemiewdmeetings with the Nova opations staff, shot director and designers of other ICF facilities mentioned above. These meetings and discussion sessions shed some light on failwe modes, mechanisms and effects of various component categories. Some of them are as follows:
Optical Components: The most frequently changed components a~ the
polarizers due to coating damage. The polarizer coatings have tight specifications and require a high extinction ratio at certain angles. A new type of coating is in use on Nova for the last four years which is hafnium-bad. This new coating produced no wearout failures in the Nova preamp (equivalent) since they were installed. Coating damage occurs from specific, nomutine (hot) shots, from controller failures that either put beam ‘‘ekewhd ablating material onto poiarizers or that cause a timing malfunction of the Faraday isolators causing a high back reflection from downstream, - and fmm operator error.
Fikr optics are extremely reliable. However, w h PAM components are modularly replaced, cemmic connector damage at the fiber optic bulkhead distributor can result due to operator error.
0
0
Electro-optical:
line insulation failure. 0
0
The pockels cell failures occur mostly due to charge
The diode lasers’ major failure mode is short circuit
Electrical and mechanical:
fail more frequently than other paxts.
the mdtipass amplifier.
0
0
0
Limit cards of motor controllers for stepper motors
Flashlamp is the most failure prone component in
Ion pumps fail less frequently than the cry0 pumps.
A parallel effort has been made to find what kind of data are available in journals for laser damage thresholds. In this effort, work by Rainer, et. al. of LLNL 191 has been studied to gain insight into the expe-ntal databases for laser damage, This study wed iifteen year long, 15,000 measurement-strong laser induced damage threshold tests at UNL and at more than 100
other institutions. These measwements cover the spectrum from 248 to 1064 nm with pulse duration ranging from less than 1 ns to 65 ns and pulse-repetition fquexies from single shots to 6.3 kHz This study highlights the status of anti-reflective (AR) coatings, high-reflective (HR) coatings, polarizets, and frequency- conversion crystals used primarily at 355 nm and 1064 nm.
The databse in Rainer's work [9] shows the high fluence damage threshokls measufed historically over 15 years and does not provide random failure data at much lower fluences which are relevant to the PAM system. Also, the evolution of technology, such as the impmed optics coatings descrii above, make such data obsolete for many cases. In this kind of sparse data context realistic data may ultimately only come from prototype testing (e.g., accelerated life) of actual NIF-type components. Until then, spam data from other sou~ces must be supplemented and caveated by expert judgment to provide a distribution on component performance. Bayesian approaches allow for the expression of such uncertainty about component Feliability until data are obtained from prototype testing and used to update estimates of performance. NIF has a number of prototype test programs in progress.
Due to the complexity of the systems, the state-of- the-art environment for NIF, and the sparse data issues, a PAM system reliability cannot be defensibly estimated simply by using estimated reliabilities at the component level. However, the component-level fail- data do provide an important relative measure of reliabilities, highlighting for designers, tk problem areas which can be improved. We need anotkr method to make some estimate of the PAM reliability at this time to &tennine if it meets its reliability allocation. In addition to component failwe data collection, Nova monthly operations logs are being reviewed to estimate the frequency of the NIF PAM failure based on the frequency of faihm of the portion of the Nova laser preamplifier that approximates the NIF PAM. This extrapolation from the Nova preamp fail- rate to a NIF PAM failure rate requks expert evaluation of the differences in the numbers and types of components and their relevance as well as difTeIiences in the complexities between the two systems.
V. CONCLUSIONS
Reliability and availability estimates by the bottom- up approach require a structured and systematic data acquisition effort, which is currently being worked on. For the near-term, the qualitative reliability analysis provided a number of engi~ring insights. which ate valuable to the evolution of the Title I design.
* This work was performed under the auspices of the U.S. Department of Energy by Lawrence Livermore National Laboratory under contract no. W-7405-Eng-48.
VI. REFERENCES
1.Nationai Ignition Facility Conceptual Design Report; Vol. 3; UCRL-PROP-117093, NIF-LLNL-94-113, G 16973-1; May 1994.
2.m National Ignition Facility: An Ovewkw, Energy & Technology Review, University of California, Lawrence Livennore National Laboratory, December 1994.
3.National Ignition Facility Reliability, Availability and Maintainability (RAM) Allocation Modeling Summary and Results, Draft, April 30,1996 - Internal Document.
4.01vis, D.D.; Fran, M.V.; Jacobsen, F.K.; and Clarke, W.M.; Guidebook for Reliability, Availability and Maintainability Analysis of NWTS Repository Equipment, Vol. 2, Chapters 5 and 7, OM-334, April 1981; General Atomic Company, San Diego, CA.
5.W.E. Vesely, F.F. Goldberg, U.S. NRC, N.H. Roberts, University of Washington, D.F. Hassl, Inst. of System Sciences, Inc.; NUREG-0492, Fault T m Handbook, Jan. 1981.
6.Bdow, R E , and Proschan F., Statistical Theory of Reliability and Life Testing, New York, Holt, Rinehard and Winston, Inc., 1975.
7.Shooman, Martin L., Probabilistic Reliability: An Engineering Approach, New York, McGraw-Hill Book Company, 1968.
8.IEEE, Guide for General Principles of Reliability Analysis of Nuclear Power Generating Station Protection Systems, IEEE Std. 352-1975,1975.
9.F. Rainer, et. al., A Historical Perspective on Fifteen Years of Laser Damage Thresholds at LLNL, SPIE Vol. 2114, 25th Annual Boulder Damage Symposium Proceedin@, Laser-Induced Damage in Optical Materials: 1993, 27-29 October, 1993, Boulder, Colorado.
RBD ID Pr
FRIl
Table 1 Critical Component List for PAM Baseline Design
POL1/2/3/4
DPLlDPL2 BOMl
M9/M10
MC
SA1
POL5/6/7
BVRl/VRl
FL
Component Name Fiber pi@
Faraday rotatorfisolator
Polarizers in the regenerative amplifier Pockels cell/driver
Diode laser assembly Insertable target box
Max R & 1% leaker mirrors Mirrors stepper motors controller
Serrated aperture with positioning hardware and rotation stage Polarizers in the multipass amplifier Faraday rotatorfisolator in the multipass amplifier Vac tubedvac valvedion Pump Multipass amplifier assembly Multipass amplifier flash lamp
Major Failure Mode Bend radius induced polarization loss Loss of back reflection suppression Coating damage
Failure to perform Q- switching function Short circuit Failure to retract due to controller failure Coating damage
Limit card failure. Single controller controls 4 motors Locked positioning hardware
Coating damage
Loss of back reflection suppression
Loss of vacuum
ElectricaVoptical failure
Flash lamp fails to switch on

f
I I I I I I I I I I 1 I I I I I I I 1 I I I t I
I I I g - I
I I I I I I I I I I I I I I I I I I I I I I I I I 8 I I I I I I 8 I I I I I I I I 1 I
I I I I I I I f j 11 ‘B : E8 I

NIF FLUENCE MAP FROM MOR TO TARGET
From MOR b * 13 PASS 4 21x + 4 PASS each - 2PASS * - 17w
pulse width
-
Beam size
(142 w/cm*
1 nJ
t Beam size 22.5 x 23.7mm (1.5 m c m * )
1 -?
17kJ PerBeam IR-UV - A
Beam size 22.5 x 23.7 nw? 17 (2.3 Ycmq
(Typical Ignition Target Pulse Shape)
20 ns pulse width
Target
17 W x 192 = 3.264 MI (Total Max)
192 From -:J-i Beams
Notes: 1. For ignition 1.8 MJ at 500 7W is required (per ETR - p.4, fig. 3). (2.285 MJ = 70%)
2. All energy values are from COR, dated May 1994.
Figure 2
f