ucla’s statewide evaluation of proposition 36
DESCRIPTION
UCLA’s Statewide Evaluation of Proposition 36. Darren Urada, Ph.D. UCLA Integrated Substance Abuse Programs Association for Criminal Justice Research (California) October 16, 2008. Topics. What is Prop 36? Show rates Completion rates Arrests Cost Recommendations for Reducing No-Shows - PowerPoint PPT PresentationTRANSCRIPT
UCLA’s Statewide UCLA’s Statewide Evaluation of Evaluation of
Proposition 36Proposition 36Darren Urada, Ph.D.Darren Urada, Ph.D.
UCLA Integrated Substance Abuse ProgramsUCLA Integrated Substance Abuse ProgramsAssociation for Criminal Justice Research (California) Association for Criminal Justice Research (California)
October 16, 2008October 16, 2008
TopicsTopics What is Prop 36?What is Prop 36? Show ratesShow rates Completion ratesCompletion rates ArrestsArrests CostCost Recommendations for Reducing No-ShowsRecommendations for Reducing No-Shows EmploymentEmployment Narcotic Replacement TherapyNarcotic Replacement Therapy Incentives & SanctionsIncentives & Sanctions Process ImprovementProcess Improvement
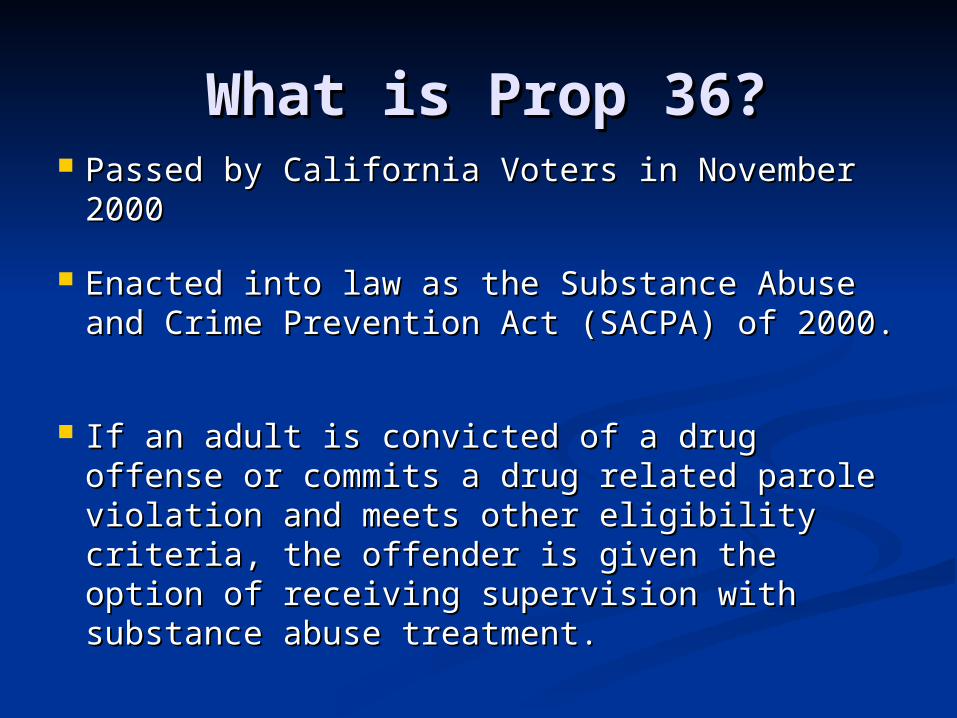
What is Prop 36?What is Prop 36? Passed by California Voters in November Passed by California Voters in November
20002000
Enacted into law as the Substance Abuse Enacted into law as the Substance Abuse and Crime Prevention Act (SACPA) of 2000. and Crime Prevention Act (SACPA) of 2000.
If an adult is convicted of a drug offense or If an adult is convicted of a drug offense or commits a drug related parole violation and commits a drug related parole violation and meets other eligibility criteria, the offender meets other eligibility criteria, the offender is given the option of receiving supervision is given the option of receiving supervision with substance abuse treatment.with substance abuse treatment.
Prop 36 Treatment Client Prop 36 Treatment Client CharacteristicsCharacteristics
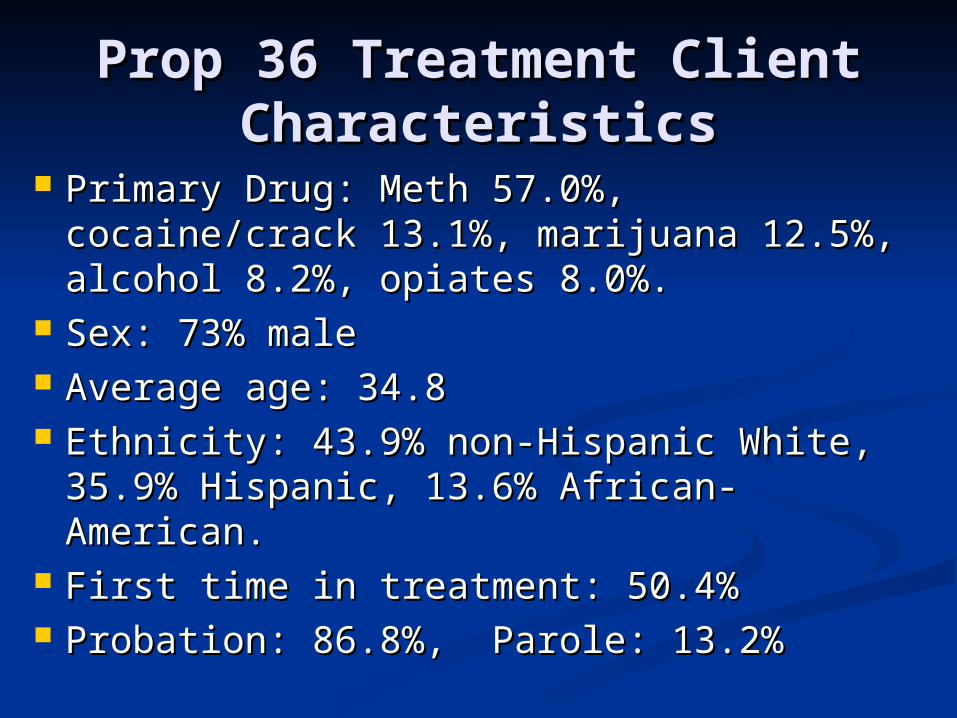
Primary Drug: Meth 57.0%, Primary Drug: Meth 57.0%, cocaine/crack 13.1%, marijuana 12.5%, cocaine/crack 13.1%, marijuana 12.5%, alcohol 8.2%, opiates 8.0%.alcohol 8.2%, opiates 8.0%.
Sex: 73% maleSex: 73% male Average age: 34.8Average age: 34.8 Ethnicity: 43.9% non-Hispanic White, Ethnicity: 43.9% non-Hispanic White,
35.9% Hispanic, 13.6% African-American.35.9% Hispanic, 13.6% African-American. First time in treatment: 50.4%First time in treatment: 50.4% Probation: 86.8%, Parole: 13.2%Probation: 86.8%, Parole: 13.2%
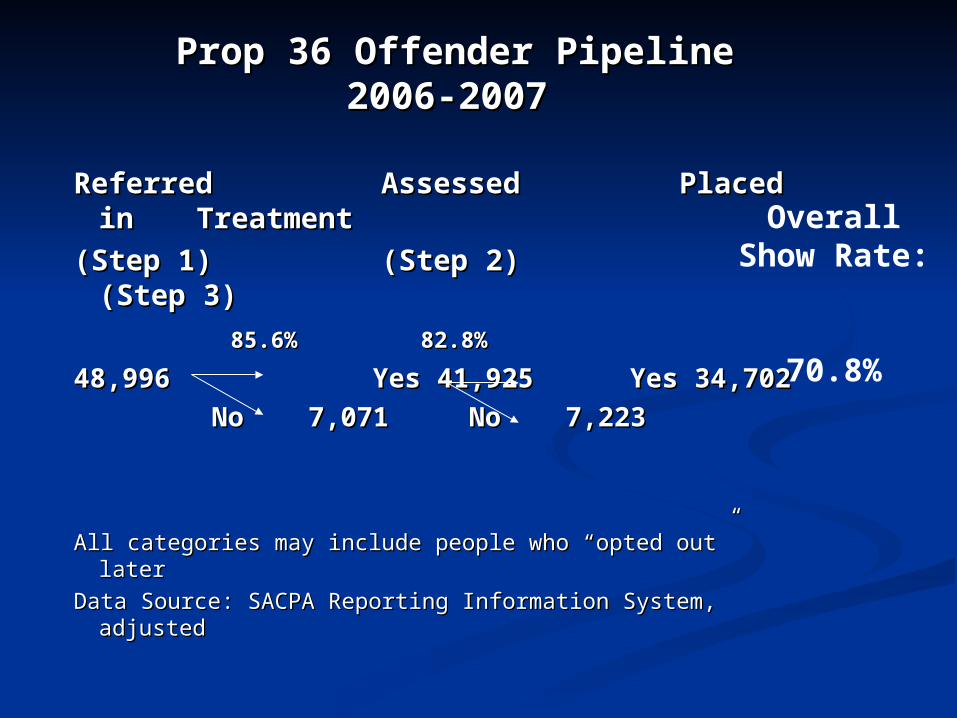
Prop 36 Offender PipelineProp 36 Offender Pipeline2006-20072006-2007
ReferredReferred Assessed Assessed Placed in Placed in Treatment Treatment
(Step 1)(Step 1) (Step 2) (Step 2) (Step (Step 3)3)
85.6%85.6% 82.8%82.8%
48,996 48,996 Yes 41,925 Yes 41,925 Yes 34,702 Yes 34,702
No 7,071 No 7,071 No 7,223 No 7,223
All categories may include people who “opted out” laterAll categories may include people who “opted out” later
Data Data Source: SACPA Reporting Information System, Source: SACPA Reporting Information System, adjustedadjusted
Overall Show Rate:
70.8%
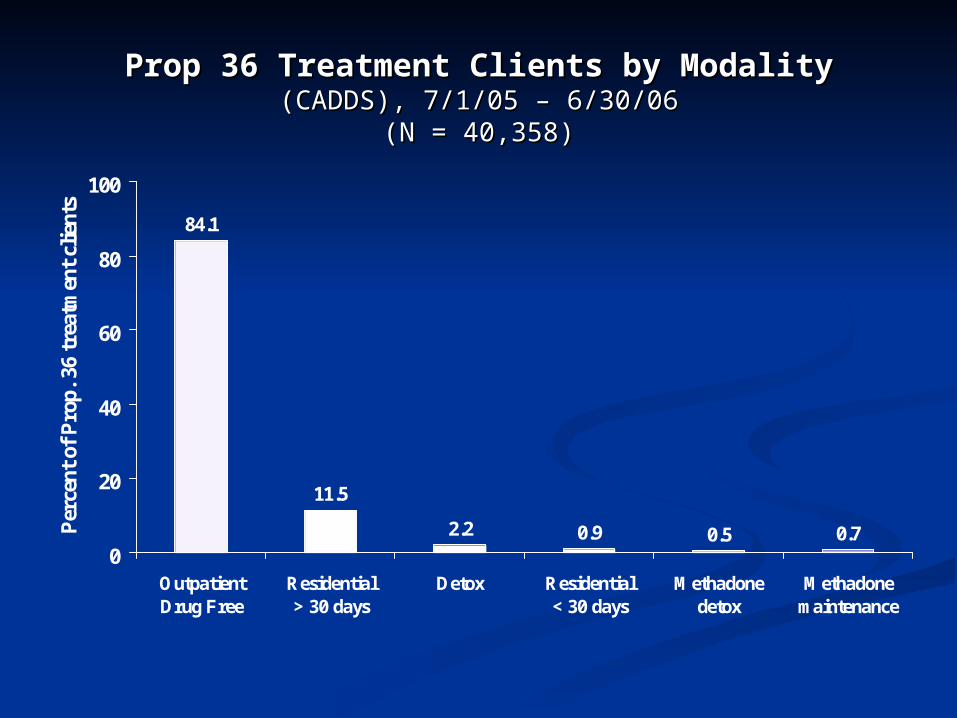
84.1
11.5
2.2 0.9 0.5 0.70
20
40
60
80
100
OutpatientDrug Free
Residential> 30 days
Detox Residential< 30 days
Methadonedetox
Methadonemaintenance
Per
cent
of
Pro
p. 3
6 tr
eatm
ent
clie
nts
Prop 36 Treatment Clients by ModalityProp 36 Treatment Clients by Modality(CADDS), 7/1/05 – 6/30/06(CADDS), 7/1/05 – 6/30/06
(N = 40,358)(N = 40,358)
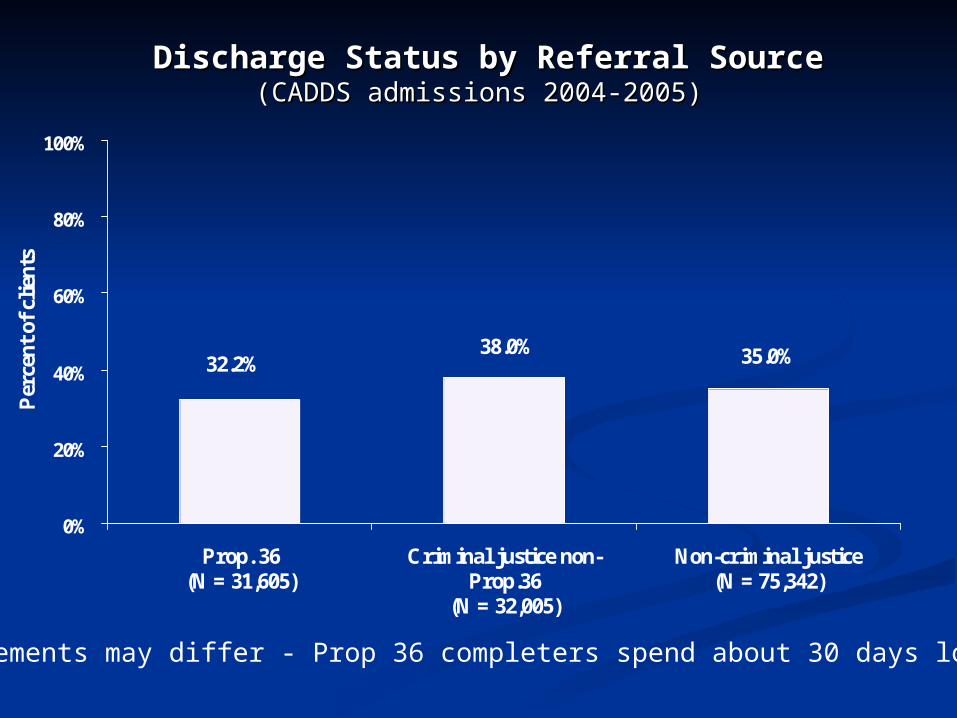
35.0%38.0%32.2%
0%
20%
40%
60%
80%
100%
Prop. 36(N = 31,605)
Criminal justice non-Prop.36
(N = 32,005)
Non-criminal justice(N = 75,342)
Per
cent
of
clie
nts
Discharge Status by Referral SourceDischarge Status by Referral Source(CADDS admissions 2004-2005)(CADDS admissions 2004-2005)
Note: Requirements may differ - Prop 36 completers spend about 30 days longer in tx.
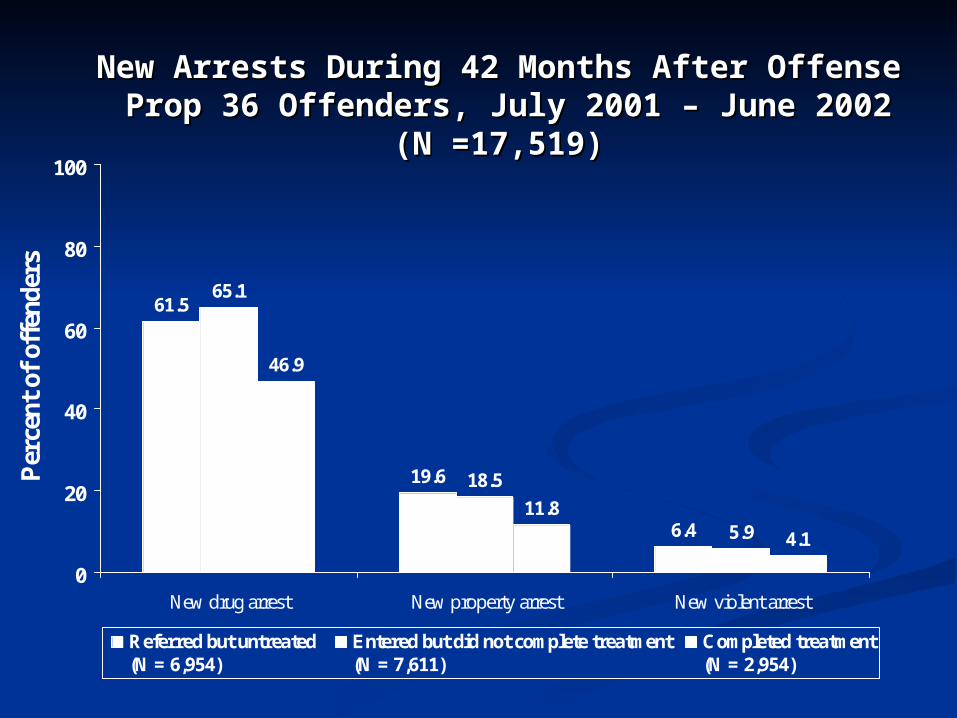
61.5
19.6
6.4
65.1
18.5
5.9
46.9
11.8
4.1
0
20
40
60
80
100
New drug arrest New property arrest New violent arrest
Per
cent
of
offe
nder
s
Referred but untreated (N = 6,954)
Entered but did not complete treatment(N = 7,611)
Completed treatment(N = 2,954)
New Arrests During 42 Months After OffenseNew Arrests During 42 Months After Offense Prop 36 Offenders, July 2001 – June 2002 Prop 36 Offenders, July 2001 – June 2002
(N =17,519)(N =17,519)
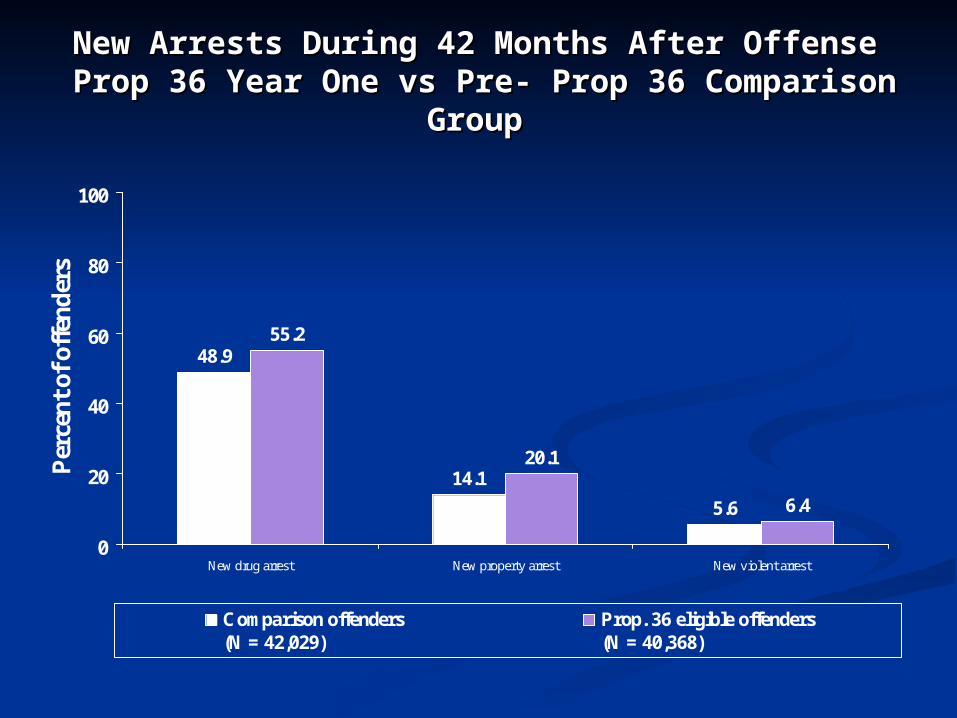
48.9
14.1
5.6
55.2
20.1
6.4
0
20
40
60
80
100
New drug arrest New property arrest New violent arrest
Per
cen
t of
off
end
ers
Comparison offenders(N = 42,029)
Prop. 36 eligible offenders(N = 40,368)
New Arrests During 42 Months After OffenseNew Arrests During 42 Months After Offense Prop 36 Year One vs Pre- Prop 36 Comparison Prop 36 Year One vs Pre- Prop 36 Comparison
GroupGroup
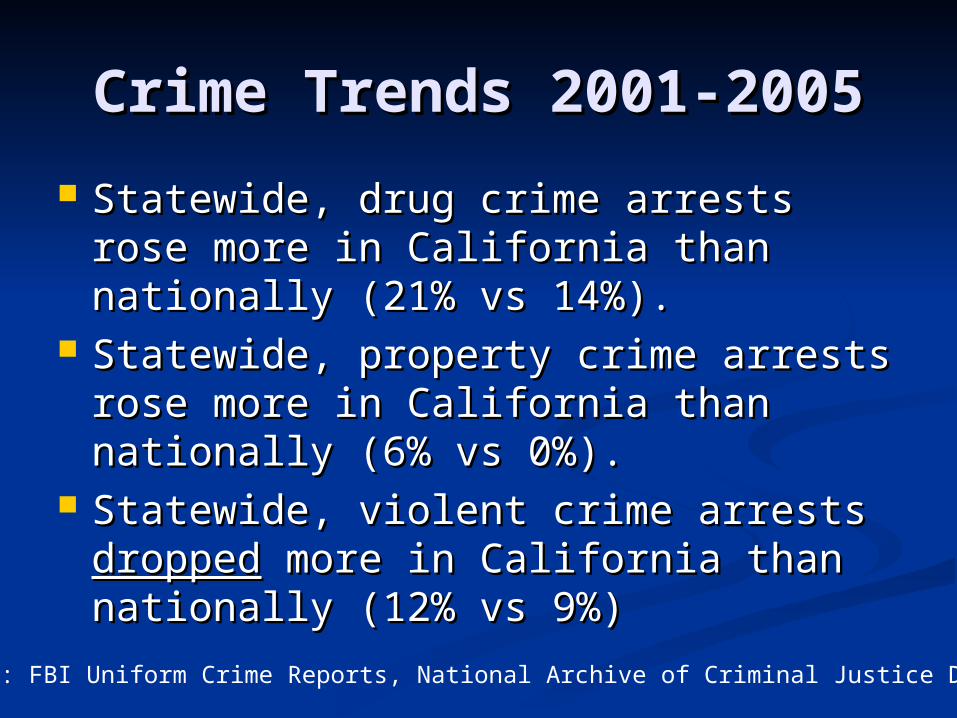
Crime Trends 2001-2005Crime Trends 2001-2005
Source: FBI Uniform Crime Reports, National Archive of Criminal Justice Data
Statewide, drug crime arrests rose Statewide, drug crime arrests rose more in California than nationally more in California than nationally (21% vs 14%).(21% vs 14%).
Statewide, property crime arrests Statewide, property crime arrests rose more in California than rose more in California than nationally (6% vs 0%).nationally (6% vs 0%).
Statewide, violent crime arrests Statewide, violent crime arrests droppeddropped more in California than more in California than nationally (12% vs 9%)nationally (12% vs 9%)
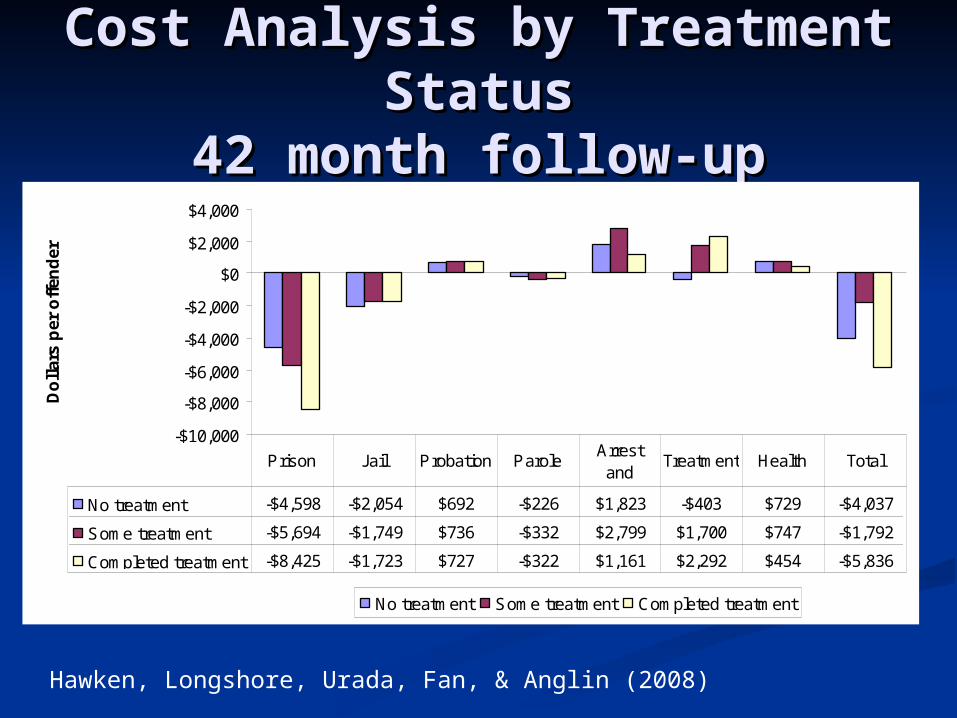
Cost Analysis by Treatment Cost Analysis by Treatment StatusStatus
42 month follow-up42 month follow-up
-$10,000
-$8,000
-$6,000
-$4,000
-$2,000
$0
$2,000
$4,000
Do
llar
s p
er o
ffen
der
No treatment Some treatment Completed treatment
No treatment -$4,598 -$2,054 $692 -$226 $1,823 -$403 $729 -$4,037
Some treatment -$5,694 -$1,749 $736 -$332 $2,799 $1,700 $747 -$1,792
Completed treatment -$8,425 -$1,723 $727 -$322 $1,161 $2,292 $454 -$5,836
Prison Jail Probation ParoleArrest and
Treatment Health Total
Hawken, Longshore, Urada, Fan, & Anglin (2008)
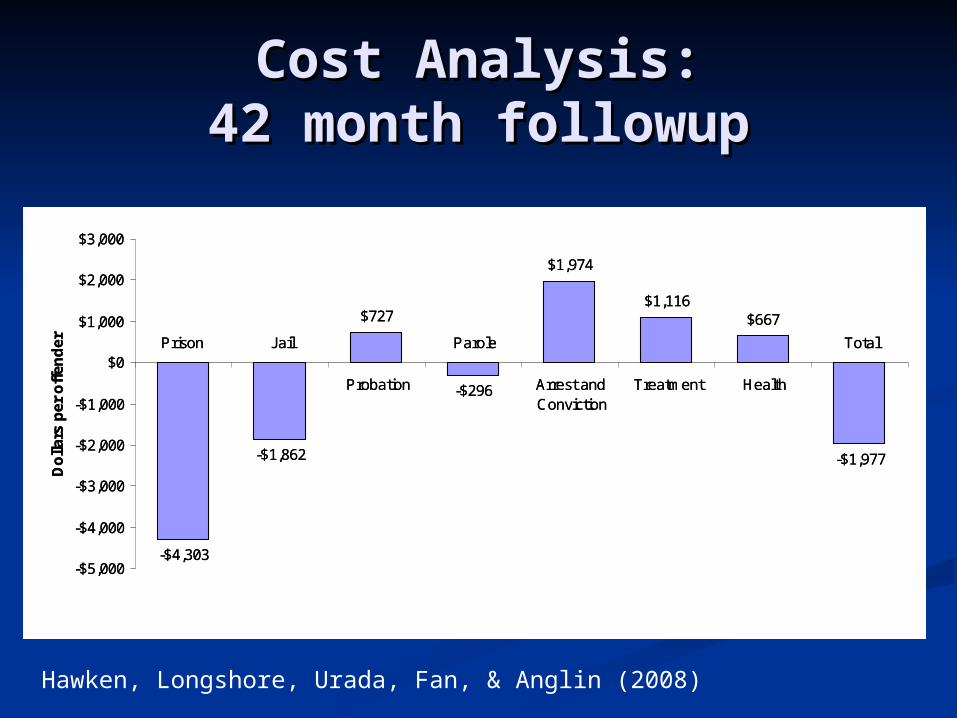
Cost Analysis:Cost Analysis:42 month followup42 month followup
-$4,303
-$1,862
$727
-$296
$1,974
$1,116$667
-$1,977
-$5,000
-$4,000
-$3,000
-$2,000
-$1,000
$0
$1,000
$2,000
$3,000
Prison Jail
Probation
Parole
Arrest andConviction
Treatment Health
Total
Do
lla
rs p
er
off
en
de
r
-$4,303
-$1,862
$727
-$296
$1,974
$1,116$667
-$1,977
-$5,000
-$4,000
-$3,000
-$2,000
-$1,000
$0
$1,000
$2,000
$3,000
Prison Jail
Probation
Parole
Arrest andConviction
Treatment Health
Total
Do
lla
rs p
er
off
en
de
r
Hawken, Longshore, Urada, Fan, & Anglin (2008)

RecommendationsRecommendations
Suggestions we hear most oftenSuggestions we hear most often
FundingFunding FundingFunding
FundingFunding
FundingFunding
FundingFunding
FundingFunding !!
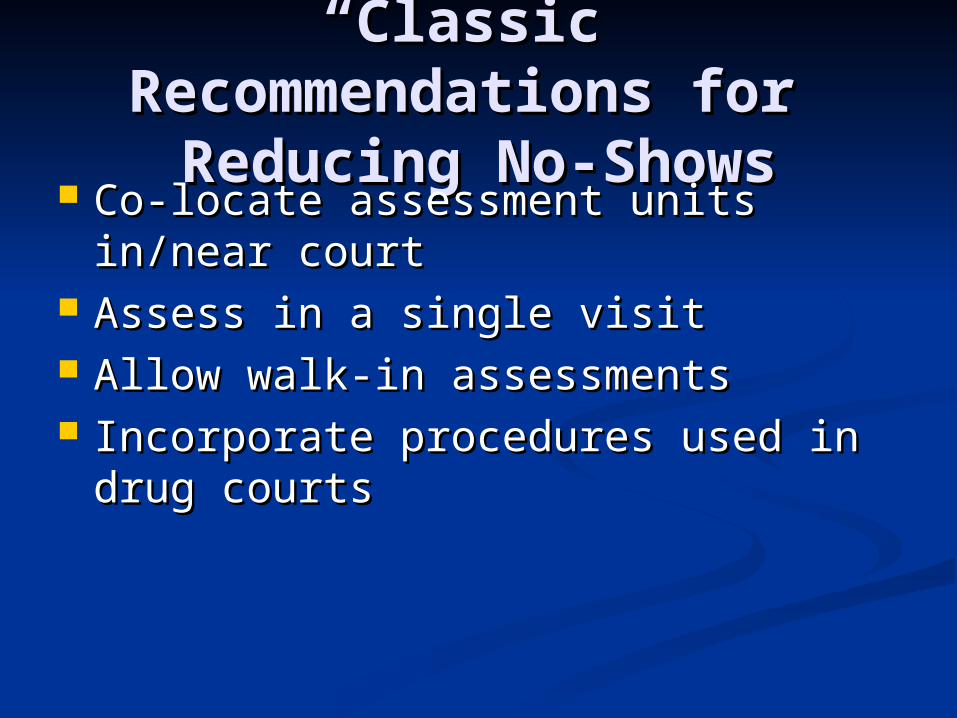
““Classic” Classic” Recommendations for Recommendations for
Reducing No-ShowsReducing No-Shows Co-locate assessment units in/near Co-locate assessment units in/near
courtcourt Assess in a single visitAssess in a single visit Allow walk-in assessmentsAllow walk-in assessments Incorporate procedures used in drug Incorporate procedures used in drug
courtscourts

Employment: Focus Group Employment: Focus Group IdeasIdeas
Lower cost suggestions:Lower cost suggestions:
On-site “one-stop shopping” employment services, On-site “one-stop shopping” employment services, professional job counselorprofessional job counselor
““Felon-friendly” job listsFelon-friendly” job lists
Vocational education (regularly, weekly, Vocational education (regularly, weekly, evenings)evenings)
Tap into networks of alumni who can Tap into networks of alumni who can provide job search assistance, contactsprovide job search assistance, contacts
GED graduation ceremoniesGED graduation ceremonies
Funding stabilityFunding stability
Higher Cost Suggestions:Higher Cost Suggestions:
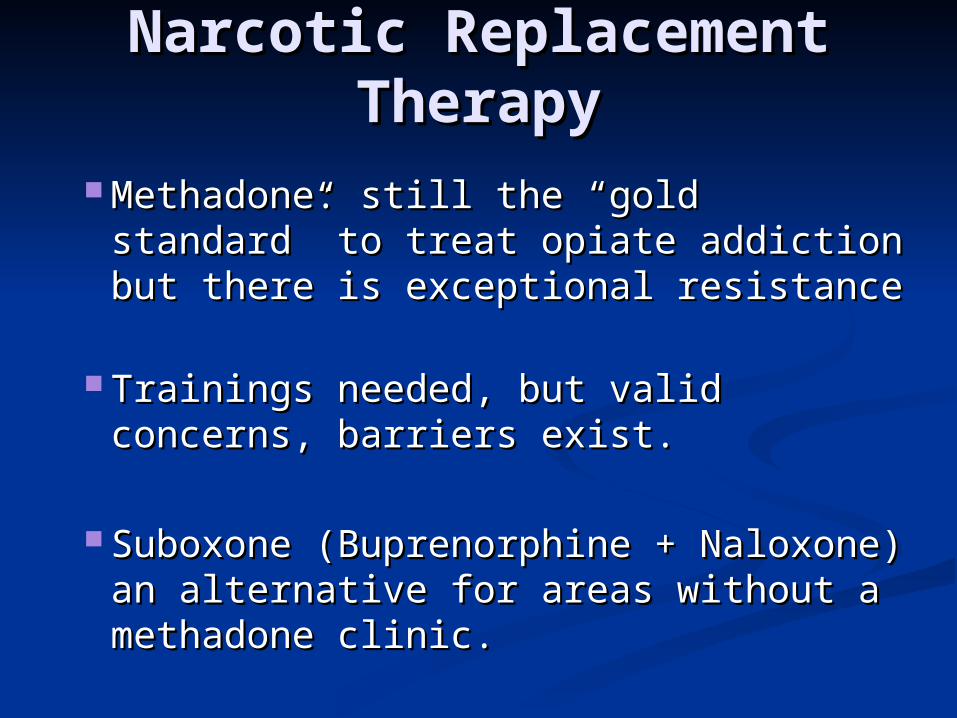
Narcotic Replacement Narcotic Replacement TherapyTherapy
Methadone: still the “gold standard” Methadone: still the “gold standard” to treat opiate addiction but there is to treat opiate addiction but there is exceptional resistanceexceptional resistance
Trainings needed, but valid concerns, Trainings needed, but valid concerns, barriers exist.barriers exist.
Suboxone (Buprenorphine + Suboxone (Buprenorphine + Naloxone) an alternative for areas Naloxone) an alternative for areas without a methadone clinic.without a methadone clinic.
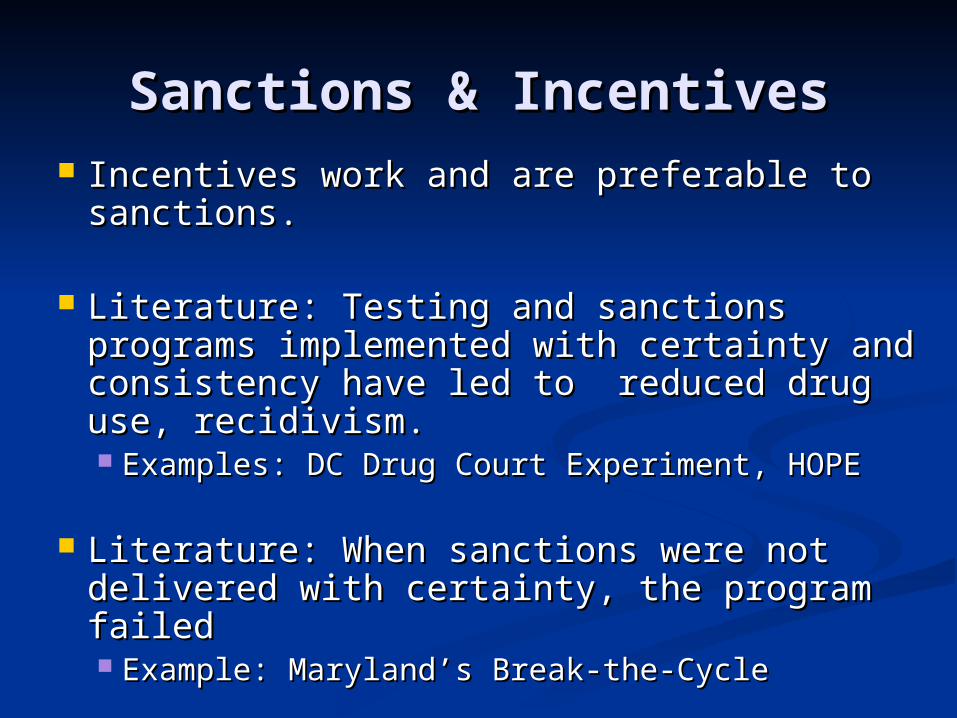
Sanctions & IncentivesSanctions & Incentives Incentives work and are preferable to Incentives work and are preferable to
sanctions.sanctions.
Literature: Testing and sanctions programs Literature: Testing and sanctions programs implemented with certainty and implemented with certainty and consistency have led to reduced drug use, consistency have led to reduced drug use, recidivism.recidivism. Examples: DC Drug Court Experiment, HOPEExamples: DC Drug Court Experiment, HOPE
Literature: When sanctions were not Literature: When sanctions were not delivered with certainty, the program faileddelivered with certainty, the program failed Example: Maryland’s Break-the-CycleExample: Maryland’s Break-the-Cycle
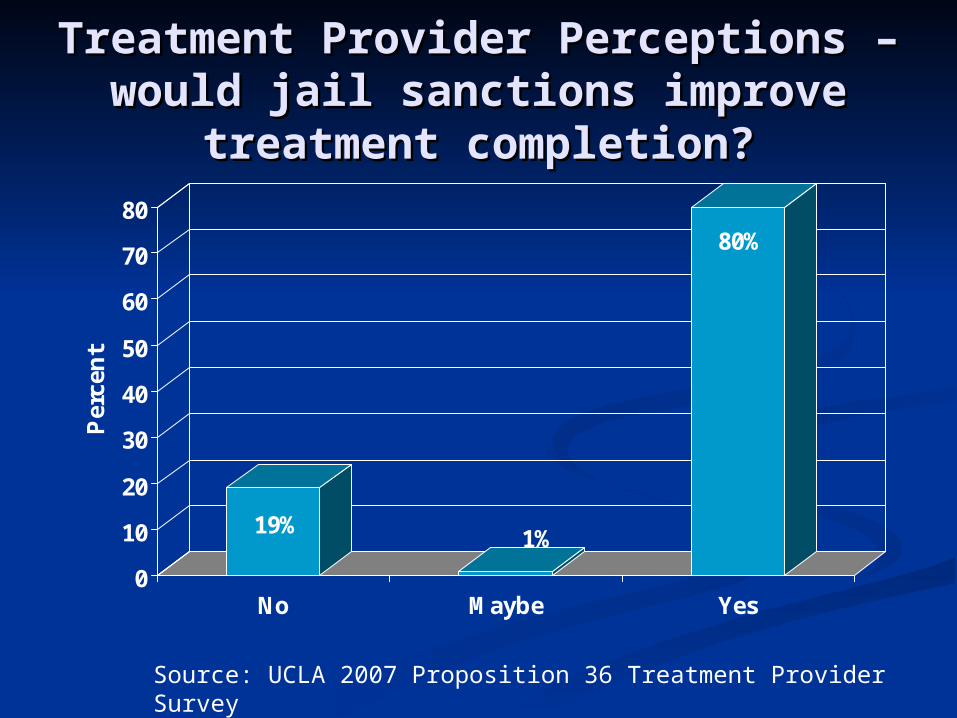
Treatment Provider Perceptions – Treatment Provider Perceptions – would jail sanctions improve would jail sanctions improve
treatment completion?treatment completion?
19%1%
80%
0
10
20
30
40
50
60
70
80
Per
cen
t
No Maybe Yes
Source: UCLA 2007 Proposition 36 Treatment Provider Survey
Process Improvement:Process Improvement:Network for the Network for the Improvement of Improvement of
Addiction Treatment Addiction Treatment (NIATx)(NIATx)
Designed to help treatment providers Designed to help treatment providers improve their own programsimprove their own programs
Goals: Goals: Increase admissions Increase admissions Reduce waiting timesReduce waiting times Reduce no-showsReduce no-shows Increase client continuation in treatment Increase client continuation in treatment
Conduct a “walk-through” to understand Conduct a “walk-through” to understand the processes that facilitate or inhibit the processes that facilitate or inhibit treatment goals from a client’s perspective.treatment goals from a client’s perspective.
Identify a measurable goal.Identify a measurable goal. Establish a Change Team to select and test Establish a Change Team to select and test
changes to address the problem. changes to address the problem. Collect data before, during, after a change Collect data before, during, after a change
to see whether the change resulted in to see whether the change resulted in improvement. improvement.
Make adjustments to improve continuously Make adjustments to improve continuously and sustain changes.and sustain changes.
Key StepsKey Steps
2005-2006 LA County Pilot 2005-2006 LA County Pilot Project Change ExampleProject Change Example
Southern California Alcohol & Drug Southern California Alcohol & Drug Programs, Inc.Programs, Inc.
Normally assessor would call program and Normally assessor would call program and whoever answered phone scheduled intake. whoever answered phone scheduled intake. Change: When assessment center called, a Prop. Change: When assessment center called, a Prop. 36 counselor would talk with the potential client 36 counselor would talk with the potential client on the phone.on the phone.• Counselor introduced selfCounselor introduced self• Told client about the programTold client about the program• Asked if client had any specific needs that Asked if client had any specific needs that
should be addressed during treatmentshould be addressed during treatment• Motivational interviewing-type strategies used Motivational interviewing-type strategies used
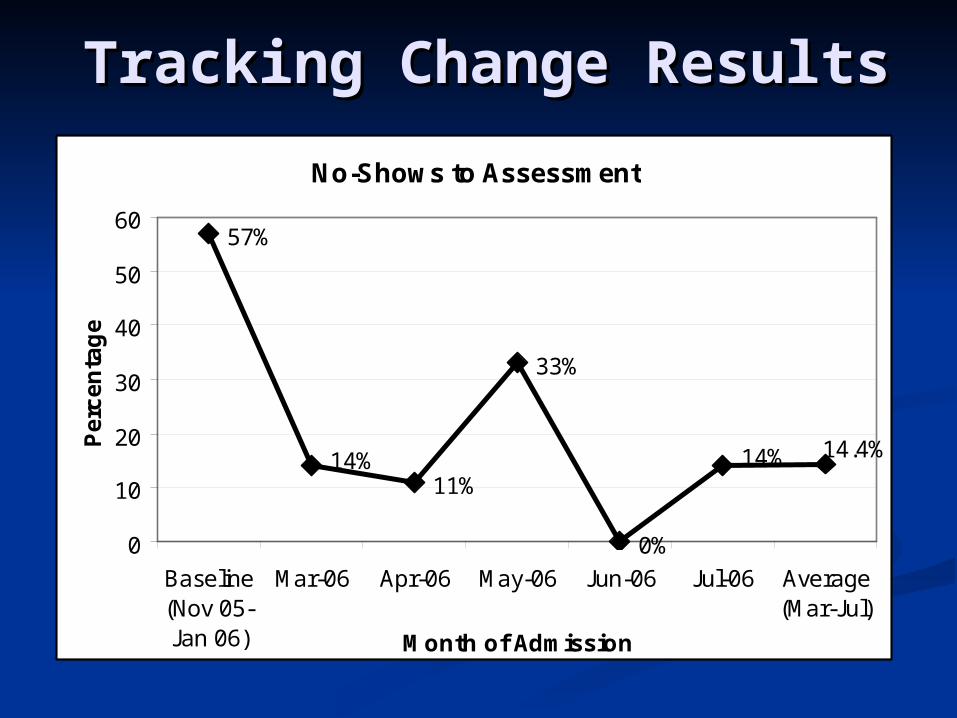
No-Shows to Assessment
14.4%14%
0%
33%
11%14%
57%
0
10
20
30
40
50
60
Baseline(Nov 05-Jan 06)
Mar-06 Apr-06 May-06 Jun-06 Jul-06 Average(Mar-Jul)
Month of Admission
Pe
rce
nta
ge
Tracking Change ResultsTracking Change Results
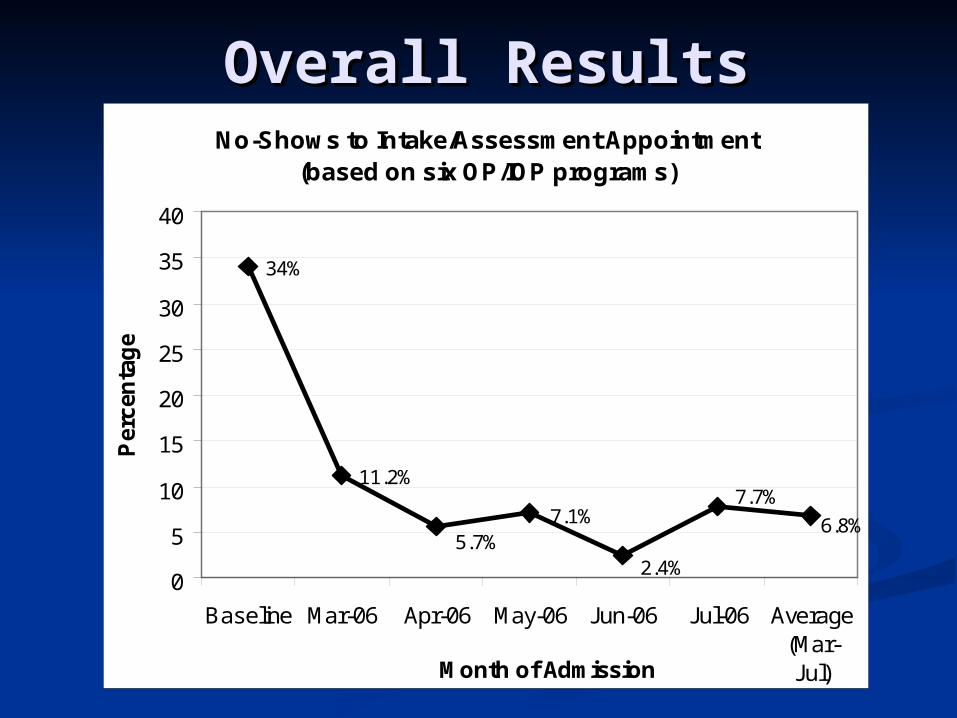
No-Shows to Intake/Assessment Appointment (based on six OP/IOP programs)
6.8%
7.7%
2.4%
7.1%5.7%
11.2%
34%
0
5
10
15
20
25
30
35
40
Baseline Mar-06 Apr-06 May-06 Jun-06 Jul-06 Average(Mar-Jul)Month of Admission
Per
cen
tag
e
Overall ResultsOverall Results
For more infoFor more info
UCLA Prop 36 Reports:UCLA Prop 36 Reports:http://www.uclaisap.org/Prop36/html/rehttp://www.uclaisap.org/Prop36/html/reports.htmlports.html
NIATx: NIATx: http://www.NIATx.nethttp://www.NIATx.net
Comments / QuestionsComments / [email protected]@ucla.edu