uc davis instrumented tree at southern sierra czo
TRANSCRIPT

UC Davis Instrumented Tree at Southern Sierra CZO:Preliminary Data
Instrumented White Fir (Abies concolor) at Kings River Experimental Watershed. Monitoring network consists of soil sensors (~150 moisture, temperature and matric potential), tree sensors (sap flow, water content), environmental conditions (solar radiation, snow depth), and a remote camera.

MPS-1, 30cm
Vertical pit, 4 MPS-1 and 4 EC5-TE probes, 15cm, 30cm, 60cm, 90cm
1½” conduit will carry wires from two transects
UCM pits
Transect radius = 5m
80cm
CR
1000
N
CR1000
Three logger boxes house 2 CR1000, 4 mulitplexers and a 2 RF 450 radios for communication with tower
1
2
34
5
6
7
8
910
11
12
VP1 VP2
VP3
VP4
VP5
VP6

Volumetric Water Content at Four Vertical Pits (VP) at UCD Tree

Soil Water Potential at Four Vertical Pits (VP) at UCD Tree

1. Temperature profiles are very similar along the vertical profile with the diurnal signal only being translated to the 15cm sensor
2. As air temperature decreases the profile flips and the shallow sensors are preferentially cooled by the air
3. When persistent snow cover arrives, the diurnal signal is lost in the 15cm sensor
4. During periods of rapid infiltration throughout the profile either due to rain or snow melt, the temperature signals all come together at the same temperature
Representative Temperature profile
1
23
4

• Water contents are uniformly low in the latter part of the summer at the site• Soil potential show little water available to the tree. Tree roots do seem to
be removing some water from the 60 and 90cm horizons• Wetting events associated with precipitation at the site and vary with depth
and magnitude of events• Wetting events that finally reach the deepest part of the profile in late
January represent melting snow infiltration and rain on snow events• Wetting events correspond between different sensors collocated in the pits
(MPS-1)
Volumetric water content as measured in VP1 using Decagon 5TE sensors. Soil Potential measured with Decagon MPS-1

• Water content stored in the top 20cm for four vertical pits, also shown is the average storage of the four pits and cumulative precipitation
• VP-6 has different sensors (EC-TM) than the other pits which may account for some of the larger variations
• VP-6 is also at the base of three trees leaving the possibility that stem flow could contribute to concentration of flow to these sensors
• In general sensor response is similar with all shallow sensors responding to the same precipitation events
• For the initial dry period (43days), the ET in the top 20cm is estimated to be 0.05mm per day using the average water storage of the four profiles rates are very low due to low water contents the difficulty in removing the final amount of water

• Using the average of the entire profile, the change in water storage over the initial 43 day dry period is 0.2mm/day indicating very low rates of transpiration from lower in the profile due to severe stress
• The first precipitation fell on the site on 10/4 in an amount of 3.3cm as measured at the NDAP site 2km away. Approximately half of that amount accumulated in the profile, the remainder re-evaporated before reaching the sensor at 15cm
• The next precip event of 3.7cm on 11/1 increased storage in the upper profile by 2.7cm, perhaps reflecting lower temperatures, shorter days and less ET
• The following large storm in mid-December falls mostly as snow and the water entering the profile is delayed until melting begins in early January

• Storage in all six vertical pits from 20-100cm (15cm sensor removed)• Storage in the lower 80% of the profile across all six pits is very similar,
especially during the rain events. The highest water contents are the mid canopy west and under canopy east
• There is more heterogeneity in the water storage during the snowmelt signal due to variability in snow cover and melt out times
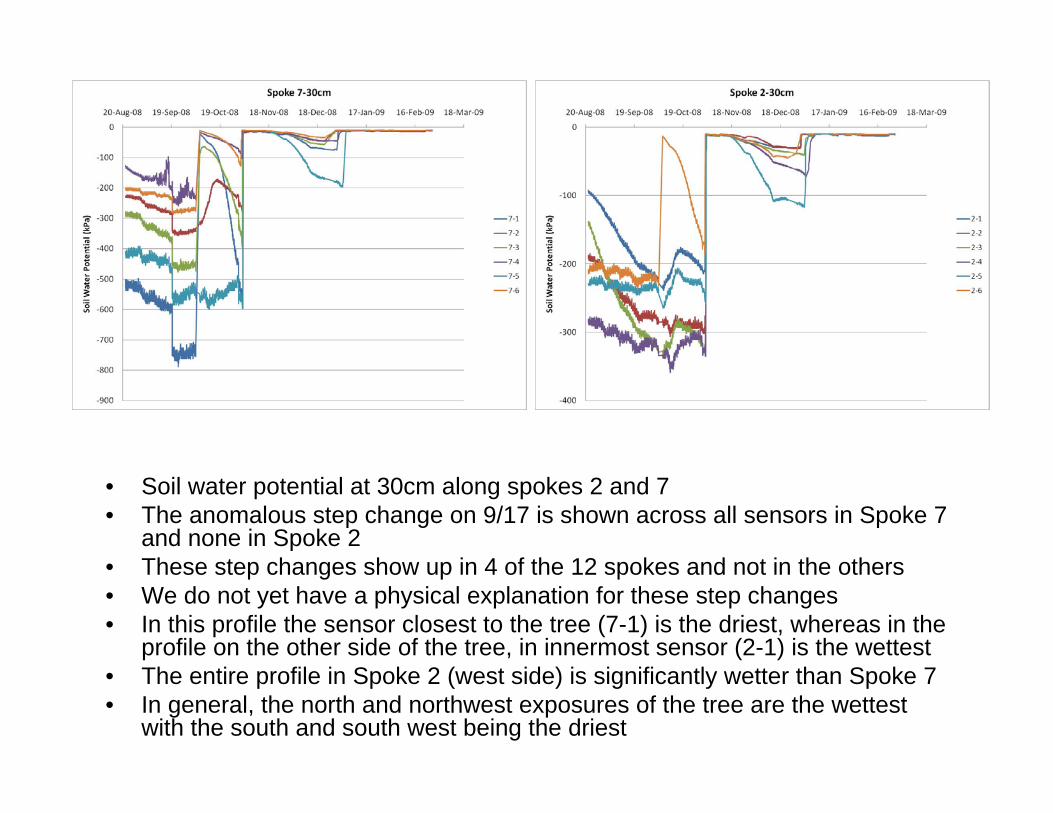
• Soil water potential at 30cm along spokes 2 and 7• The anomalous step change on 9/17 is shown across all sensors in Spoke 7
and none in Spoke 2• These step changes show up in 4 of the 12 spokes and not in the others• We do not yet have a physical explanation for these step changes• In this profile the sensor closest to the tree (7-1) is the driest, whereas in the
profile on the other side of the tree, in innermost sensor (2-1) is the wettest• The entire profile in Spoke 2 (west side) is significantly wetter than Spoke 7• In general, the north and northwest exposures of the tree are the wettest
with the south and south west being the driest

• Retention relationships for three sensors at 15cm from initial period up to initial wetting of sensors
• Note VP-1 and VP3 are Echo 5TE sensors while VP6 is an Echo TM this may account for some of the differences in the dry end
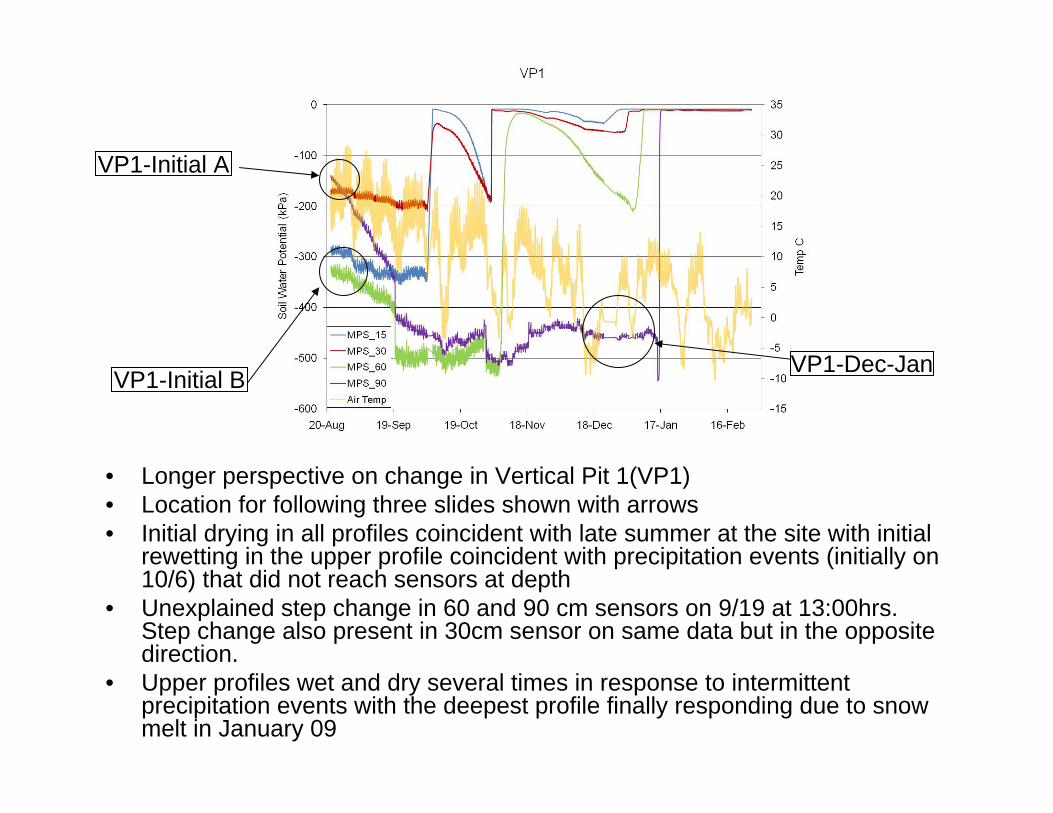
• Longer perspective on change in Vertical Pit 1(VP1)• Location for following three slides shown with arrows• Initial drying in all profiles coincident with late summer at the site with initial
rewetting in the upper profile coincident with precipitation events (initially on 10/6) that did not reach sensors at depth
• Unexplained step change in 60 and 90 cm sensors on 9/19 at 13:00hrs. Step change also present in 30cm sensor on same data but in the opposite direction.
• Upper profiles wet and dry several times in response to intermittent precipitation events with the deepest profile finally responding due to snow melt in January 09
VP1-Initial A
VP1-Initial BVP1-Dec-Jan
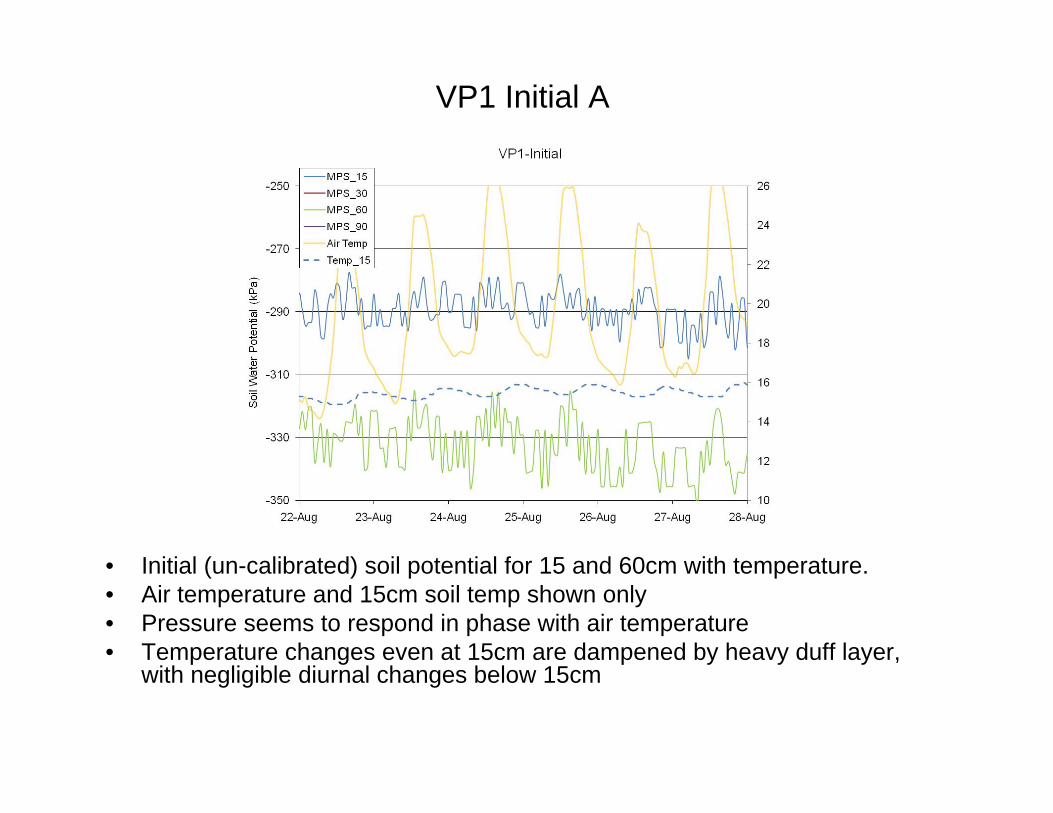
• Initial (un-calibrated) soil potential for 15 and 60cm with temperature.• Air temperature and 15cm soil temp shown only• Pressure seems to respond in phase with air temperature• Temperature changes even at 15cm are dampened by heavy duff layer,
with negligible diurnal changes below 15cm
VP1 Initial A

• Initial (un-calibrated) soil potential for initial period at 30 and 90cm, drying at 90cm is likely due to draining in the profile of water added during installation.
• Pressure seems to respond in phase with air temperature• Soil Temperature not show as diurnal changes are negligible below 15cm
VP1 Initial B

• Sensor at 90cm is shown responding in phase with air temperature.• Soil temperature at 90cm also show to be decoupled from diurnal changes
in the soil potential and air temperature
VP1 Dec-Jan

• TDR period (msec) shown in red and air temperature shown in blue• The period (proxy for water content in the stem) seems to respond,
with a lag, to air temperature• Because there is some missing data it is unclear if the large dip in
TDR period is due solely to a temperature effect or if there is an erroneous reading due to a battery voltage problem
TDR period on South face of UCD Tree

• All sensors showing diurnal changes• Low values centered around Julian day 315 and 333 are not associated with
battery voltage, temperature or precipitation events • Magnitude of flux is smallest on the SW face, the opposite of what was
expected• Flux is largest on the SE face, potentially signally activity with morning sun
exposure
Sap Flux Data from UCD Tree (un-calibrated)