u1: ggtatctcccctgccaggtaagtat u2:...
TRANSCRIPT
Morpholinos:
Control: CCTCTTACCTCAGTTACAATTTATA
U1: GGTATCTCCCCTGCCAGGTAAGTAT
U2: TGATAAGAACAGATACTACACTTGA
U4: TACGATACTGCCACTGCGCAAAGCT
siRNAs:
Control Life technologies silencer negative control #1
Cdk12 Life technologies silencer select s28622
CPSF73 Life technologies silencer select s28533
CstF77 Life technologies silencer select s3687
Primers:
Stable lines:
PromR cttaagtttaaacgctagagtc
βpAF gatattatgaagggccttgag
NS1f atggatccaaacactgtgtca
NS1r tcaaacttctgacctaattgtt
NS1mF tttaaatcgtccgatgaggaccccaa
NS1mR cggtataataacacagtttcgagtc
NR3C1 RACE:
dtTAG cttcttcgtaacctgtacgaa(t)16
NR3C1 PCPA F gttgctcattaacagatatct
TAG cttcttcgtaacctgtacgaa
NR3C1 ChIP
Prom F gggcaatgggagactttctt
Prom R cgcagccgagataaacaact
5’F tgtgttctctaaagattcatgtgc
5’R gttggccaatgggatactga
3’AF tgatggccaaaattgttaagc
3’AR aattcacccctaccaacacg
3’BF ggaaggtgtgtggcaagttt
3’BR ctttgcttggaaccttcagc
RTF tgggcactcttgtcttgttg
RTR ttcaagcttatggccgaaat
TermExF cctacgcagtgaaatgtcaga
TermExR tttggcattgctgtaaatgg
pAF ccatttacagcaatgccaaa
pAR tattagcaggcgaacattgc
MYC Analysis
-2000 F gctggaaacttgttttaagg
-2000 R tactggcagcagagatcat
Myc+Prom F ggagggatcgcgctgagta
Myc+ Prom R tctgcctctcgctggaattac
Ex1F gctgcttagacgctggattt
In1R gtgtcaatagcgcaggaat
Myc ex2F gcaccaagacccctttaactc
Myc ex2R cctcctcgtcgcagtagaaa
Myc e2F tcggattctctgctctcctc
Myc I2r ctgccaatgaaaatgggaaa
Myc e3F gagaggttcgggactgtgg
Myc e3R cctcctcgtcgcagtagaaa
UCPA F ggcaaatatatcattgagccaaa
UCPA R cccagacccatttcaacaga
Myc Flank1F ggaattctgcccagttgatg
Myc Flank1R tctgcgtggctacagataagtt
Myc Flank2F tggctgcttgtgagtacagg
Myc Flank2R aactggcttcttcccaggag
Myc Flank2AF ggcgctcttaaacagctcag
Myc Flank2AR ccaagctccacatccctaaa Supplementary Table 1

NTS
NTSf ggctaatcctctatgggagtctgtc
NTSr ccaggtgctcaaggtcaacatc
TAF7
TAFF ttgttttgctaggtgttcatc
TAFR acgtcatcacaaagcagcaa
Histone H1E
5’F ttcaacatgtccgagactgc
5’R aggcggcaacagctttagta
3’F cgaaggccaaagcagttaaa
3’R tgaaaagagcctttgggttg
UCF caacacaacccaaaggctct
UCR gctccggagacacacaaaat
F1F ggcagtgagggacttgagag
F1R aatccatccaaatgccacat
pA processing analysis
UCPA F ggcaaatatatcattgagccaaa
UCPA R cccagacccatttcaacaga
Myc Flank2F tggctgcttgtgagtacagg
Myc Flank2R aactggcttcttcccaggag
GAPDH UCPAF ccgcaccttgtcatgtacc
GAPDH UCPAR aaatggttctcgaagcaagc
GAPDH F2F agcccctaaggtcttcaagc
GAPDH F2R ttcccctaaggacgatgatg
β-globin ChIP
Ex1F ggcaggttggtatcaaggtt
Ex1R ggtagaccaccagcagccta
Ex2F ctgctggtggtctacccttg
Ex2R agcttgtcacagtgcagctc
3’AF tatgaagggccttgagcatc
3’AR tttgcagcctcaccttcttt
3’BF gctctatggcttctgaggcggaa
3’BR ggcgaacgtggcgagaaaggaa
GAPDH and ACTB ChIP
ActmidF tctgaacagactccccatcc
ActmidR ggggtgttgaaggtctcaaa
ActF1F ccttgagtgggggtgtagtg
ActF1R cccctaccccaacttgactt
ActF2F tgggccacttaatcattcaac
ActF2R cctcacttccagactgacagc
GAPDHIN2F gggacgctttctttcctttc
GAPDHIN2R gctgcccattcatttcctt
GAPDHF1F ctctcctcgctccagtccta
GAPDHF1R aggctgagctccactaacca
GAPDHF2F agcccctaaggtcttcaagc
GAPDHF2R ttcccctaaggacgatgatg
U6 snRNA
U6F acatatactaaaattggaacgatac
U6R ggaacgcttcacgaatttgcgt
gRNA plasmid generation
gMYCF caacgtaggagttttagagctagaaatagcaag
gMYCR cggtcacaccggtgtttcgtcctttccacaag
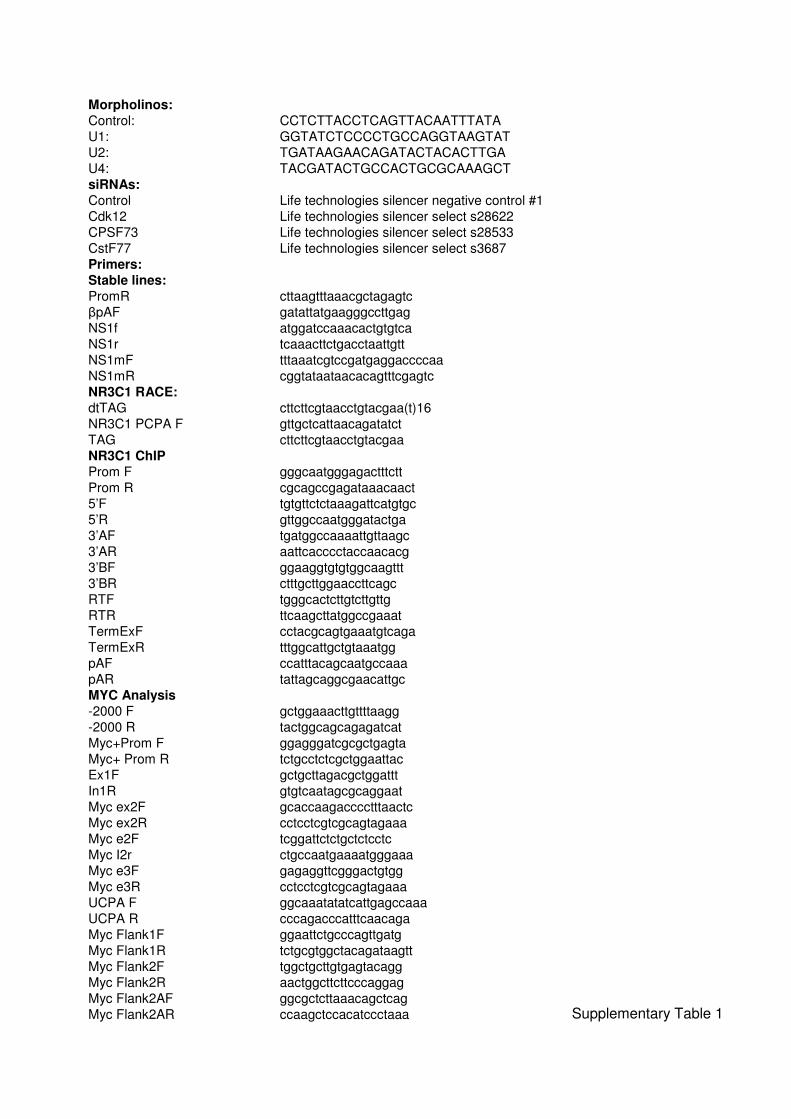
Supplementary Table 1

0
0.2
0.4
0.6
0.8
1
1.2
Prom Ex2 Ex3 F1 F2
N20
IgG
0
0.5
1
1.5
2
2.5
Prom Ex2 Ex3 F1 F2
Ser7pIgG
0
0.05
0.1
0.15
0.2
0.25
0.3
Prom Ex2 Ex3 F1 F2
Ser5pIgG
0
0.1
0.2
0.3
0.4
0.5
0.6
0.7
0.8
Prom Ex2 Ex3 F1 F2
0
0.2
0.4
0.6
0.8
1
1.2
1.4
Prom Ex2 Ex3 F1 F2
CPSF30IgG
CstF77IgG
0
1
2
3
4
5
6
7
Prom Ex2 Ex3 F1 F2
Ser7pIgG
0
0.05
0.1
0.15
0.2
0.25
0.3
0.35
Prom Ex2 Ex3 F1 F2
N20
IgG
0
0.05
0.1
0.15
0.2
0.25
0.3
Prom Ex2 Ex3 F1 F2
Ser5pIgG
A
B
C
D
E
F
Supplementary Figure 1:ChIP experiments across the MYC gene showing % input for IgG as well as Pol II (A), Ser2p (B), Ser7p (C), Ser5p (D), CPSF30 (E) and CstF77 (F). For each antibody, a representative experiment is shown
for two separate batches of antibody.
% Input
0
0.05
0.1
0.15
0.2
0.25
0.3
0.35
0.4
Prom Ex2 Ex3 F1 F2
Ser2pIgG
% Input
% Input
% Input
% Input
% Input
% Input
0
0.1
0.2
0.3
0.4
0.5
0.6
0.7
0.8
Prom Ex2 Ex3 F1 F2
Ser2pIgG
% Input
% Input
% Input
0
0.5
1
1.5
2
2.5
Prom Ex2 Ex3 F1 F2
CstF77IgG
% Input
0
0.05
0.1
0.15
0.2
0.25
0.3
Prom Ex2 Ex3 F1 F2
CPSF30IgG
% Input
Davidson_Supplementary Fig1
pA
Prom Ex2 Ex3 F1 F2
Re
lative %
Input
Re
lative %
Input
CstF77 Ser2p
A
B C
Davidson_Supplementary Fig2
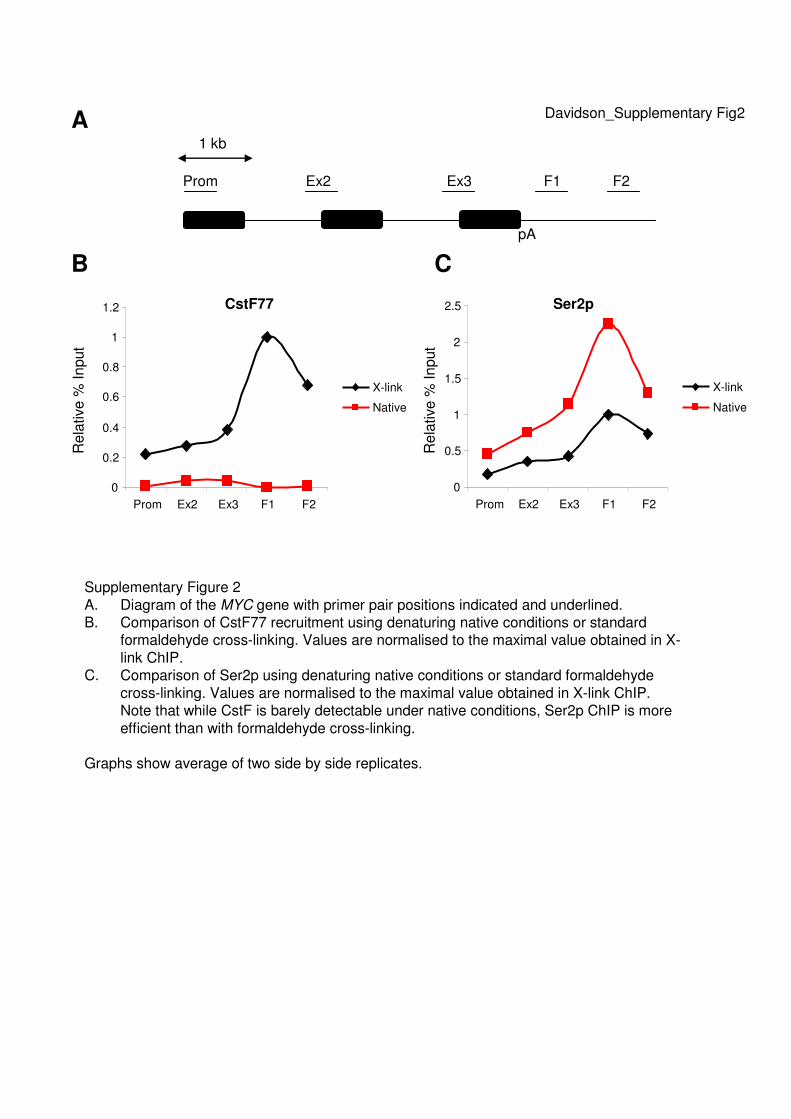
Supplementary Figure 2
A. Diagram of the MYC gene with primer pair positions indicated and underlined.B. Comparison of CstF77 recruitment using denaturing native conditions or standard
formaldehyde cross-linking. Values are normalised to the maximal value obtained in X-
link ChIP.C. Comparison of Ser2p using denaturing native conditions or standard formaldehyde
cross-linking. Values are normalised to the maximal value obtained in X-link ChIP. Note that while CstF is barely detectable under native conditions, Ser2p ChIP is more
efficient than with formaldehyde cross-linking.
Graphs show average of two side by side replicates.
1 kb
0
0.2
0.4
0.6
0.8
1
1.2
Prom Ex2 Ex3 F1 F2
X-link
Native
0
0.5
1
1.5
2
2.5
Prom Ex2 Ex3 F1 F2
X-link
Native

0
0.2
0.4
0.6
0.8
1
1.2
Prom Ex2 Ex3 F1 F2
siCont
siCdk12
Re
lative %
Input
CPSF30
siRNA C Cdk12
Cdk12
*
A B
Supplementary Figure 3A. Western blot of Cdk12 protein in cells treated with control or Cdk12 siRNA. Top panel
shows Cdk12 and lower panel shows a protein bound non-specifically by the antibody that
acts as a loading control.B. ChIP of CPSF30 recruitment to the MYC gene in control or Cdk12 depleted cells. Values
normalised to the maximum signal in control cells.
Davidson_Supplementary Fig3

Myc In1-Ex2 Myc In1-Ex2
0
0.2
0.4
0.6
0.8
1
0 10 20 40
C AMO
U4 AMO
Re
lative R
NA
le
ve
l
Time (mins)
0
0.2
0.4
0.6
0.8
1
0 10 20 40
siCont
siCdk12
Re
lative R
NA
le
ve
l
Time (mins)
A
C
E
B
D
F
Supplementary Figure 4A. Steady-state analysis of total polyadenylated Myc transcripts in control and Cdk12 depleted cells.
Data are normalised to U6 snRNA levels.B. Actinomycin D time course of polyadenylated Myc RNA decay in control or Cdk12 depleted cells.
Data are normalised to the amount recovered at time zero. Note that these transcripts are more stable
when Cdk12 is depleted implying a greater effect on their levels at steady-state than seen in A.C. Actinomycin D time course of non-pA cleaved Myc RNA in control and exosome (Rrp6 and Dis3)
depleted cells. Levels were normalised to the amount recovered at time zero.D. Comparison of the level of two confirmed exosome substrates (Myc and 40-33 PROMPT) in control
and Rrp6/Dis3 depleted cells to validate that exosome depletion in C is functional. Graph shows fold
change compared to control cells, which were given a value of 1.E. Actinomycin D time course of Myc intron 1 splicing in control and Cdk12 depleted cells. Levels were
quantitated and, in each case, data are normalised to the amount recovered at time zero.F. As with E but in cells treated with a control or U4 snRNA directed AMO. The signal is depleted in
control AMO treated but not in U4 AMO treated cells confirming that its loss is due to splicing. Graph shows average of two biological repeats.
Davidson_Supplementary Fig4
Re
lative R
NA
le
ve
l
Time (mins)
0
0.2
0.4
0.6
0.8
1
siCont siCdk12
Ex3 (dT)
0
0.2
0.4
0.6
0.8
1
0 10 20 40 60
siCont
siCdk12
0
0.2
0.4
0.6
0.8
1
siCont
siR6/D3
0 10 20 40
Re
lative R
NA
le
ve
l
Time (mins)
0
1
2
3
4
5
6
7
8
Myc PROMPT 40-33 PROMPT
Fold
chang
e/s
iCont
**
Ex3 (dT reverse transcription) Ex3 (dT reverse transcription)R
ela
tive R
NA
le
ve
l
A
B C
D
0
1
2
3
4
5
5' pA RT Term Ex UCPA
C AMO
U1 AMO
0
2
4
6
8
10
12
5' pA Term Ex
C AMO
U1 AMO
NR3C1
PCPA pA
Fold
Chang
e
Fold
Chang
e
0
0.2
0.4
0.6
0.8
1
1.2
RT Term Ex
C AMO
U1 AMO
Fold
Chang
e
Pol II ChIP
5’pA RT Term Ex
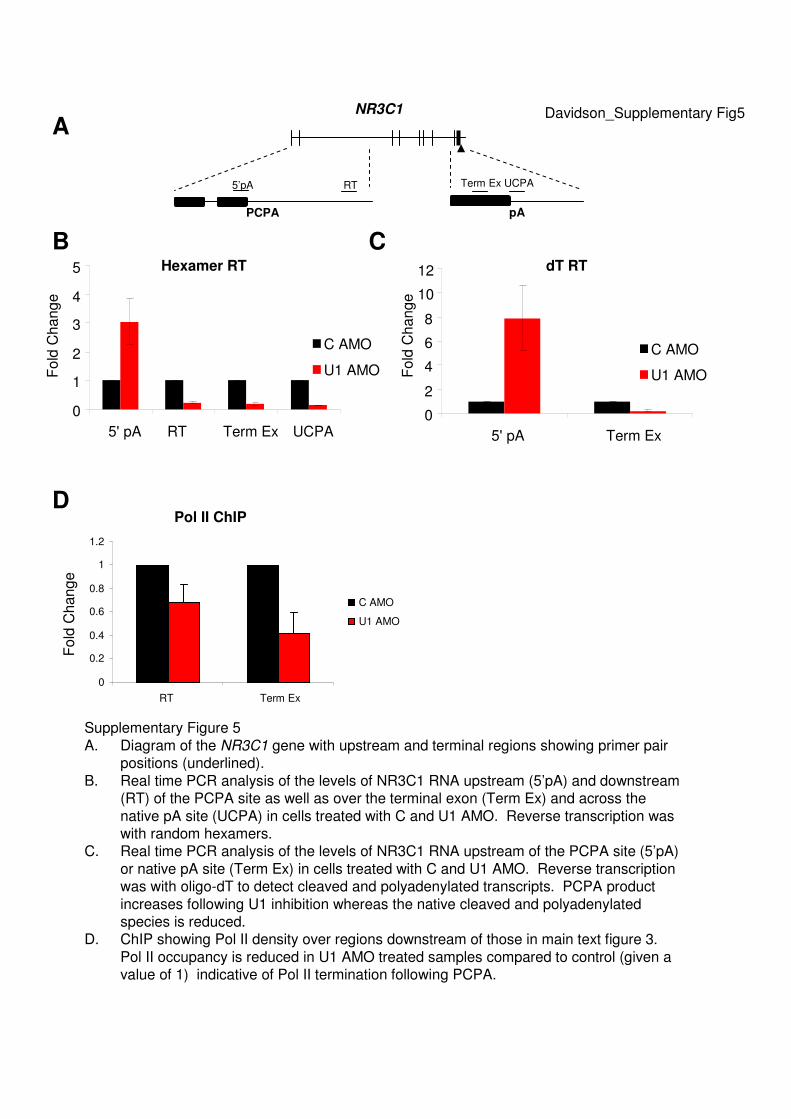
Supplementary Figure 5
A. Diagram of the NR3C1 gene with upstream and terminal regions showing primer pair positions (underlined).
B. Real time PCR analysis of the levels of NR3C1 RNA upstream (5’pA) and downstream (RT) of the PCPA site as well as over the terminal exon (Term Ex) and across the
native pA site (UCPA) in cells treated with C and U1 AMO. Reverse transcription was with random hexamers.
C. Real time PCR analysis of the levels of NR3C1 RNA upstream of the PCPA site (5’pA)
or native pA site (Term Ex) in cells treated with C and U1 AMO. Reverse transcription was with oligo-dT to detect cleaved and polyadenylated transcripts. PCPA product
increases following U1 inhibition whereas the native cleaved and polyadenylated species is reduced.
D. ChIP showing Pol II density over regions downstream of those in main text figure 3.
Pol II occupancy is reduced in U1 AMO treated samples compared to control (given a value of 1) indicative of Pol II termination following PCPA.
Hexamer RT dT RT
Davidson_Supplementary Fig5
UCPA

0
0.2
0.4
0.6
0.8
1
1.2
1.4
1.6
C
U1
U2
0
1
2
3
4
5
6
7
C
U1
U2
Re
lative %
Input
PCPA
Prom 5’ 3’A 3’B
1 kb
Pol II Ser2p
A
B
Supplementary Figure 6
A. Diagram of the 5’ portion of NR3C1, with the position of ChIP primers indicated and underlined. The PCPA site is indicated.B. ChIP analysis of Pol II or Ser2p across the 5’ portion of NR3C1 in cells treated with control,
U1 or U2 AMOs. Note that only the U1 AMO, which specifically induces PCPA, results in Ser2p accumulation. There is no effect of the U2 AMO, which inhibits splicing but does not cause
PCPA.
Davidson_Supplementary Fig6
Prom 5' 3'A 3‘B Prom 5' 3'A 3‘B

A B
C D
0
1
2
3
4
5
6
GAPDH
IN2
GAPDH
F1
GAPDH
F2
ACTB
IN1
ACTB F1 ACTB F2
siCont
siCPSF73
Re
lative S
er2
p/P
ol II
Supplementary Figure 7A. Steady state analysis of polyadenylated exon 3 containing Myc RNA in control cells or cells
depleted of CPSF73. Quantitation shows fold change in CPSF73 depleted cells as compared to control cells (given a value of 1after normalising to U6 snRNA).
B. Act D time course analysis of polyadenylated exon 3 containing Myc RNA in control cells or
cells depleted of CPSF73. Quantitation for each condition is shown relative to time zero (given a value of 1). Graph shows an average of two biological repeats. Note that these
transcripts are more stable when CPSF73 is depleted implying a greater effect on their levels at steady-state in A.
C. ChIP analysis of Ser2p and Pol II over GAPDH and ACTB genes in control and CPSF73
depleted cells. Graph shows relative Ser2p signal normalised to Pol II. When compared to primers upstream of each pA signal (GAPDH IN2 and ACTB IN1) there is a higher level of
Ser2p in flank (F1 and F2 in both cases) regions beyond the pA signal. However, the Ser2p level is diminished upon depletion of CPSF73.
D. Western blot displaying levels of Cdk12 protein in cells treated with control or CPSF73 siRNA. * is a non-specifically bound protein acting as a loading control.
Davidson_Supplementary Fig7
Re
lative R
NA
le
ve
l
Time (mins)
Ex3 (dT reverse transcription)
0
0.2
0.4
0.6
0.8
1
siCont siCPSF73
Re
lative R
NA
le
ve
l
siRNA: C CPSF73
Cdk12
*
0
0.2
0.4
0.6
0.8
1
1.2
0 10 20 40 60
siCont
siCPSF73
Ex3 (dT reverse transcription)

Re
lative S
er2
p s
ignal/P
ol II s
ignal
Supplementary Figure 8A. ChIP analysis across the Histone H1E gene using the N20 antibody. % input for N20 and IgG
controls are shown for two individual repeats.
B. ChIP analysis across the Histone H1E gene using the Ser2p antibody. % input for Ser2p and IgG controls are shown for two individual repeats.
C. Comparison of Ser2p phosphorylation density over the Histone H1E gene (UC amplicon) in comparison to the MYC Flank 1 region. Quantitation is expressed as the relative Ser2p signal
over that obtained for N20 (ratio given a value of 1 for MYC F1). It is clear that Ser2p levels are generally much lower over Histone H1E than beyond the MYC pA site.
Davidson_Supplementary Fig8
0
0.1
0.2
0.3
0.4
0.5
0.6
0.7
0.8
0.9
1
MYC F1 H1E UC
Ser2p/Pol II
0
0.02
0.04
0.06
0.08
0.1
0.12
0.14
5' 3' UC F1
Ser2p
IgG
0
0.05
0.1
0.15
0.2
0.25
5' 3' UC F1
Ser2p
IgG
0
0.5
1
1.5
2
2.5
3
5' 3' UC F1
N20
IgG
0
0.2
0.4
0.6
0.8
1
1.2
1.4
5' 3' UC F1
N20
IgG
% Input
% Input
% Input
% Input
A
B
C

Re
lative R
NA
le
ve
l
Time (mins)
Supplementary Figure 9
A. Steady-state analysis of total polyadenylated Myc transcripts in control and CstF77 depleted cells. Data are normalised to U6 snRNA levels.
B. Actinomycin D time course of polyadenylated Myc mRNA decay in control or CstF77
depleted cells. Levels are normalised to the amount recovered at time zero. Graph is an average of two biological repeats. Note that these transcripts are more stable when CstF77
is depleted implying a greater effect on their levels at steady-state in A.
Davidson_Supplementary Fig9
0
0.2
0.4
0.6
0.8
1
siCont siCstF77
A B
0
0.2
0.4
0.6
0.8
1
1.2
0 10 20 40 60
siCont
siCstF77
Ex3 (dT reverse transcription) Ex3 (dT reverse transcription)
Re
lative R
NA
le
ve
l

NS1
CPSF30
Tubulin
TET: - + - +
wtNS1 mutNS1
wt/mut NS1A βpA
TETA
B
0
0.2
0.4
0.6
0.8
1
Prom Ex2 Ex3 F1 F2
Mut
WT
Supplementary Figure 10A. Western blotting analysis of NS1 (top panel), CPS30 (middle panel) and, as a control, Tubulin
(lower panel), in cell lines containing single-copy integrates of wt or mut NS1A genes.
Diagram shows both genes where expression is driven by a tetracycline-inducible promoter and CPA mediated by the human β-globin pA site. A tetracycline dependent band is
observed for both wt and mut NS1A and the expression of CPSF30 is not impaired under these conditions.
B. ChIP analysis of CPSF30 and CstF77 recruitment to the MYC gene in wt or mut NS1
expressing cells. Recruitment is reduced in wt NS1A expressing cells. Values are normalised to the maximal value obtained in mut NS1A cells.
Re
lative %
Input
CPSF30 CstF77
Davidson_Supplementary Fig10
0
0.2
0.4
0.6
0.8
1
Prom Ex2 Ex3 F1 F2
Mut
WT
Re
lative %
Input