u. s. department of transportation maritime …s3.amazonaws.com/zanran_storage/€¦ · u. s....
TRANSCRIPT

U. S. Department
of Transportation
Maritime
Administration
Port Damage Assessment Report
Long-Term Report – March 2001
Nicaragua: Assessment of Port Infrastructure
Damage Caused by Hurricane Mitch, 1998
Nicaragua: Phase II—Port Damage Assessment Long-Term Report
Acknowledgments
This study of the Port of Corinto in Nicaragua was conceived as a ONE DOT project.1 Three agencies
from the U.S. Department of Transportation, the U.S. Geological Survey, and the ports of New Orleans
and Miami formed the team network for the Phase II—Port Damage Assessment Long-Term Report. The
project demonstrated a holistic approach at looking at the entire port and intermodal system.
The Phase II Report of Corinto could not have been completed successfully without the full cooperation
of many people and organizations. The Port Damage Assessment Team wishes to thank the support of the
Secretary Norman Y. Mineta; former Secretary Rodney E. Slater; former Maritime Administrator, Clyde
Hart; the Associate Administrator for Port, Intermodal, and Environmental Activities, Margaret Blum; the
Associate Administrator for Policy and International Trade, Bruce Carlton; the Director of the Office of
Ports and Domestic Shipping, Raymond Barbaresi; Edmund T. Sommer, Jr., Acting Deputy Chief
Counsel; and Doris Bautch, Chief, Division of Ports. Many other U.S. Maritime Administration staff
provided the administrative support for this project to be completed and, although they are not named
individually, their collective effort helped to make this a successful project.
Also, the Team wishes to thank William Medigovich, Director of the Office of Emergency Transportation
and his assistant Janet Benini of the Research Special Programs Administration for coordinating this
project with the U.S. Agency for International Development.
Again the Team wishes to express its gratitude to Ambassador Oliver P. Garza at the U.S. Embassy in
Managua, Nicaragua, for providing all the administrative and logistical support the Team needed to
accomplish its mission. Timothy Stater, Economics Officer, and his staff were superb in coordinating and
setting up meeting schedules with key governmental and industry leaders and officials. His personal
interest and enthusiasm in assisting the Team were another ingredient for the success of the project.
During Phase II, one of the areas of investigation was to look at port access roads leading to the Port of
Corinto. This required cooperation and assistance from governmental agencies of the Nicaraguan
Government, in particular the Ministry of Transportation and Infrastructure. Again, thanks is expressed to
Vice Minister Ariel E. Pastora; Ing. Mario Palacios García, Director General of Planning; Ernesto
Barrantes E., Director General de Vialidad; Supervisora de Engeneria Ana Castillo A.; and Adolfo
Lacayo, Asesor de Planificacion.
At the Port of Corinto, the Team was well received and obtained full cooperation and help in evaluating
the landside port infrastructure. The generosity in providing assistance to the Team was graciously
provided by Carlos Morice, Executive President of the National Company of Ports of Nicaragua, and his
staff. Noteworthy is the complete enthusiastic cooperation provided by José S. Genet Barberena, Vice
Page 1

Nicaragua: Phase II—Port Damage Assessment Long-Term Report
General of the Nicaraguan Ports; Charles Whitaker, Port Director; Genero Espinales Cajina, Tariff
Asesor; Roberto Savarco Barco, Legal Asesor; and María Lourdes Bravo Smith, Directora de Ingeniería y
Mantenimiento.
Also, the Team appreciated the excellent cooperation of the Administrator of the City of Corinto, who
provided the Team with a guided tour of the city road system and made available information about the
city and the port access roads connected to the Port of Corinto.
Carl Sobremisana, Team Leader from the U.S. Maritime Administration, deeply appreciated the excellent
technical work performed in Phase II. The bottom line for any technical project to be a success depends
on the capabilities and professionalism of its staff members. Phase II was fortunate to have a Team with
those qualities. They included:
Landside Infrastructure Sub-Team
Kyle C. Jones, Chief Engineer, Port of New Orleans (Sub-Team Leader)
Aguedo E. (Ed) Bello, Assistant Port Engineer, Port of Miami
Port Access/Road Connector Sub-Team
Robert Gorman, Community Planner, U.S. Federal Highway Administration (Sub-Team Leader)
Luis Sandoval, Structural Engineer, U.S. Federal Highway Administration
Institutional Framework Sub-Team
Francis Mardula, Acting Chief, Division of General & International Law, U.S. Maritime Administration
(Sub-Team Leader)
Amos Ilan, Consultant (former Head of Economic Analysis for the Port Authority of New York-New
Jersey)
Richard Moore, Cartographer, U.S. Geological Survey
Waterside Infrastructure Sub-Team
Lieutenant Hector Avella, U.S. Coast Guard (Sub-Team Leader)
In addition, the team wishes to thank again Dr. Roger Figura and Alison Lipson of AECOM Consulting
Transportation Group for their professional work in providing the production of the Phase II Report. The
Page 2

Nicaragua: Phase II—Port Damage Assessment Long-Term Report
Team also wishes to thank Robert David, consultant to the Port of Miami, for his assistance in editing the
Phase II Report.
Finally, the Team wishes to express thanks to Carlos Gallegos, Secretary of the Inter-American
Committee on Ports from the Organization of American States (OAS) for his continued support
throughout the project.
Page 3
Nicaragua: Phase II—Port Damage Assessment Long-Term Report
Table of Contents
Acknowledgments ....................................................................................................................................... 1
Table of Contents ........................................................................................................................................ 4
Preface.......................................................................................................................................................... 6
Glossary of Terms and Acronyms ............................................................................................................. 7
Executive Summary .................................................................................................................................... 9
Section 1—Introduction ........................................................................................................................... 13
1.0 Background............................................................................................................... 13
1.1 Scope of Study.......................................................................................................... 14
1.2 Objective...................................................................................................................14
1.3 Methodology............................................................................................................. 14
Section 2—National Trade Forecasts and Statistics .............................................................................. 15
2.0 Background............................................................................................................... 15
2.1 Analysis .................................................................................................................... 15
2.2 Trade Outlook........................................................................................................... 21
2.3 Conclusion ................................................................................................................ 27
2.4 Recommendation ...................................................................................................... 28
Section 3—Port Capital Improvement, Port of Corinto........................................................................ 29
3.0 Introduction .............................................................................................................. 29
3.1 Background and Analysis ......................................................................................... 30
3.2 Conclusions and Recommendations ......................................................................... 36
Section 4—Port Access Roads, Port of Corinto...................................................................................... 51
4.0 Introduction .............................................................................................................. 51
4.1 Background and Analysis ......................................................................................... 51
4.2 Recommendation ...................................................................................................... 53
4.3 Conclusion ................................................................................................................ 58
4.4 Other Upland Road Connectors Projects .................................................................. 59
Section 5—Institutional Framework....................................................................................................... 60
5.0 Background............................................................................................................... 60
5.1 Analysis .................................................................................................................... 61
5.2 Recommendations..................................................................................................... 61
5.3 Conclusion ................................................................................................................ 62
Page 4
Nicaragua: Phase II—Port Damage Assessment Long-Term Report
Section 6—Training .................................................................................................................................. 63
6.0 Background and Analysis ......................................................................................... 63
6.1 Accomplishments-To-Date....................................................................................... 63
6.2 Recommendations..................................................................................................... 63
6.3 Conclusion ................................................................................................................ 66
Attachment 1—Sources and References ................................................................................................. 69
Bibliography ..................................................................................................................... 69
Attachment 2—Persons Consulted.......................................................................................................... 72
Nicaraguan Governmental Officials ................................................................................. 72
International Organizations............................................................................................... 72
U.S. Federal Agencies....................................................................................................... 73
Resource People................................................................................................................ 73
Endnotes .................................................................................................................................................... 74
Page 5
Nicaragua: Phase II—Port Damage Assessment Long-Term Report
Preface
The Phase II—Port Damage Assessment Long-Term Report resulted from a request made by the Republic
of Nicaragua through the Organization of American States Inter-American Conference for Ports in
December 1998 in Cali, Colombia.
The U.S. Maritime Administration’s Office of Ports and Domestic Shipping, Division of Ports, responded
to this request by assigning Mr. Carl J. Sobremisana to head up a study team and Francis Mardula, Acting
Chief, Division of General and International Law, to provide technical legal assistance. The team
consisted of U.S. federal agencies and the respective ports of New Orleans and Miami.
Over the past 2 years, the Team has visited the ports of Corinto and Sandino, completing the Phase I—
Port Damage Assessment Short-Term Action Report in April 2000.
The study would not have become a reality without the excellent cooperation and assistance provided by
the Government of Nicaragua.
It is the Port Damage Assessment Team’s hope that this report will help in the quick recovery and
restoration of the Nicaraguan economy from Hurricane Mitch.
Page 6
Nicaragua: Phase II—Port Damage Assessment Long-Term Report
Glossary of Terms and Acronyms
Banco Mundial World Bank
BCN (CBN) Banco Central de Nicaragua (Central Bank of Nicaragua)
BID (IDB) Banco Interamericano de Desarrollo (Inter-American Development Bank)
CBI Caribbean Basin Initiative
DC direct current
ECLAC Economic Commission for Latin America and the Caribbean
EPN Empresa Portuaria Nacional (National Port Authority, Nicaragua)
FHWA Federal Highway Administration, U.S. Department of Transportation
ft feet or foot (the basic english measurement, 0.3048 meters)
FTZ Free Trade Zone
GDP Gross Domestic Product
HIPC Heavily Indebted Poor Countries
IMF International Monetary Fund
km kilometer, a metric measure of distance, approximately five-eighths of a mile
Lo-Lo Load-on Load-off
LT long ton (2,240 pounds)
m meters or metres (the basic metric measurement, 39.3700 inches or 5.3996x10⁻⁴
nautical mile, or 6.2137x10⁻⁴ statute mile)
MARAD Maritime Administration, U.S. Department of Transportation
MLLW mean lower low water
MLW mean low water
mph miles per hour
MSL mean sea level
MT metric ton (2,205 pounds)
MTI Ministry of Transportation and Infrastructure
NBC Nuclear Biological and Chemical
nm nautical mile (approximately 1.1 miles)
NOAA National Oceanic and Atmospheric Administration, U.S. Department of Commerce
OAS Organization of American States
OET Office of Emergency Transportation, U.S. Department of Transportation
Page 7
Nicaragua: Phase II—Port Damage Assessment Long-Term Report
Ro-Ro Roll-on Roll-off
RSPA Research and Special Projects Administration, U.S. Department of Transportation
RTG Rubber Tire Gantry
TEU Twenty Equivalent Units
U.S. DOT U.S. Department of Transportation
USACOE U.S. Army Corps of Engineers
USAID Agency for International Development, United States
USCG U.S. Coast Guard, U.S. Department of Transportation
USGS U.S. Geological Survey, U.S. Department of the Interior
WB World Bank
WMD Weapons of Mass Destruction
Page 8
Nicaragua: Phase II—Port Damage Assessment Long-Term Report
Executive Summary
The U.S. Department of Transportation (U.S. DOT), Maritime Administration (MARAD), was authorized
to conduct port damage assessments in Nicaraguan and Honduran ports damaged by Hurricane Mitch.
Nicaragua and Honduras made the original request to conduct port damage assessments through the OAS
in December 1998. Resolutions adopted at the XX Meeting of the Permanent Technical Committee on
Ports of the OAS held in December 1998 in Santiago de Cali, Colombia, authorized MARAD to organize
a U.S. multi-agency team to be sent to Nicaraguan and Honduran ports to evaluate port damages. As
provided in the OAS mandate, the Government of Guatemala, in cooperation with MARAD, helped to
coordinate this effort. The focus of this assessment is to develop a near term and long term port recovery
and improvement action plan that will restore the high productivity ports to fully operational status. This
will also help stimulate economic recovery of affected Central American countries.
The multi-agency team in the Phase II—Long-Term Report conducted investigations and interviewed
appropriate port sector stakeholder groups. Team onsite visits were conducted in May and August 2000 in
Managua and at the Port of Corinto. The team targeted five specific areas that included: foreign trade
economic forecasts, port capital improvements, port access roads, institutional framework, and training.
The report completed the second phase of the assessment and recommends specific actions that can be
implemented in a 1-year to 10-year timeframe.
Phase II focused on identifying trade opportunities that exist in the world market and capital
improvements that were linked to the trade forecasts. Phase II also focused on improving port access
roads in the City of Corinto to facilitate cargo movement, recommending institutional framework changes
in the port, road, and highway planning practices. Finally, the Team ascertained the training courses that
could assist port, city, and highway engineers to maintain and rebuild the transportation infrastructure
supporting the Port of Corinto and the overall economy of Nicaragua.
Phase II assessed the following infrastructure:
� Navigational channels
� Berthing areas
� Off-loading cargo areas
� Marshalling yards
� Marine terminals and warehouses
� Port equipment
� Cargo handling equipment
� Wharf structures
� Port internal roads
� Port access roads
Page 9
Nicaragua: Phase II—Port Damage Assessment Long-Term Report
Tables ES-1 and ES-2 indicate the port capital improvement and port access recommended projects and
training courses that are available:
Table ES-1
Recommended Capital Projects (in Year 2000 U.S. Dollar Estimates)
Project Description Approx. Cost
1 Optimization Plan and Implementation $850,000
2 Master Development Plan and Business Plan $250,000
3 Master Plan Implementation Design Guidelines $75,000
4 Purchase Single Pick Telescopic Spreader 20/40 $135,000
5 Container Handling Equipment Repairs and Upgrades $1,300,000
6 Utilities Upgrade (electrical, communications, domestic water, etc.) $750,000
7 Design and Construct new Ro-Ro Berth Ramp/Dock $850,000
8 Dockside Container Crane Condition Inspection, Report, and Recommendations $45,000
9 Bulk, Break Bulk, and General Cargo Study $90,000
10 Repair, Upgrade, or Replace Conveyor System $750,000
11 Repair/Replacement Container Terminal Wharf (Northeast End) $2,500,000
12 Develop Refrigerated Container Yard $450,000
13 Construct New Port and Equipment Maintenance Facility $800,000
14 New Entrance Gate and Internal Road Re-Alignment $2,500,000
15 Upgrade Dockside Crane Drives, Systems, and Structural Enhancements $1,300,000
16 Land Acquisition and Development of Container Yard (2 Hectares) $3,500,000
17 Relocate Trestle and Liquid Bulk Terminal Pier $1,200,000
18 Feasibility Study, Dredge Wharf, Turning Basin, and Reclaim Submerged Lands $50,000
19 Dredge Berths, Turning Basin, and Reclaim Submerged Lands (3.7 Hectares) $6,500,000
20 Wharf No. 5 Container Yard Development (2.5 Hectares) $5,200,000
21 Purchase Yard Equipment (EPN or Private Sector) $3,000,000
22 Design and Construct Dockside Crane Wharf No. 5 (50 x 240 Meters, 1.2 Hectares) $8,200,000
23 Purchase 2 Panamax Dockside Cranes 50/80 LTs (at $5,500,000 each) $11,000,000
24 Reclaim, Bulkhead, and Develop Wharf No. 1 Yard $6,500,000
25 Port of Corinto Access Road $1,200,000
26 General Roadway Safety Upgrades $75,000
27 Paso Caballo Bridge Replacement $5,800,000
28 Rehabilitation of NIC-12, Road Improvements $230,000
29 Implement Training Program $350,000
Total $65,450,000
Page 10

Nicaragua: Phase II—Port Damage Assessment Long-Term Report
Table ES-2
Recommended Sources of Training
Organization
Topic US
CG
PN
O
PM
MD
FR
FH
WA
PIH
NO
AA
MA
RA
D
TR
AIN
MA
R
OA
S
ILO
Port and Terminal Security X X X
Security of Port Operations X X X
Personnel Staffing X
Empty/Loaded Containers X
Counterfeit Seals/Locking System
X
Control of Visitor Access X
Security Awareness X
Security Surveys X
Inter-Governmental/Port Industry Coordination
X
Seaport Physical Security X
Security Personnel Staffing X
Access Control X
Patrol Procedures X
Seaport Terrorism Awareness X
Safety Procedures X X
Seismic Design and Retrofit of Highways and Bridges
X
Hot-Mix Asphalt Construction X
Pavement Management Systems X
Geo-Technical Foundation Engineering: Module 8—Deep Foundations
X
Scouring Adjacent to Bridges X
Identify Sources of Pollution X X X
Spill Containment X X X
Removal of Hazardous Spill X X X
Abatement Equipment X X X
Spill Response Contingency Planning
X X
Emergency Response to NBC Terrorism (WMD)
X
X X
X
Page 11

Nicaragua: Phase II—Port Damage Assessment Long-Term Report
Organization
Topic US
CG
PN
O
PM
MD
FR
FH
WA
PIH
NO
AA
MA
RA
D
TR
AIN
MA
R
OA
S
ILO
How to Develop a GIS Mapping Database
X
How to Operate GIS Mapping X
Integrating GIS Databases X
GIS Natural Disaster/Port Planning Applications
X
Port Management and Supervisory Development
X X
Port Planning and Development X X
Container Terminal Management and Operations
X
Environmental Mitigation X
Information Technology Cargo Facilitation
X
Freight Forwarding and Multi-Modal Operations
X
Port Maintenance X
Port Labor Training X
Pilot Training X
Port Finance X
Handling Hazardous Cargo X X X
X
X X
Legend: USCG = U.S. Department of Transportation, U.S. Coast Guard
PNO = Port of New Orleans
MDFR = Miami-Dade Fire Rescue HAZMAT Response Unit, Miami-Dade County, Florida, U.S.
PM = Port of Miami
FHWA PIH = Federal Highway Administration, Pan American Institute of Highways
NOAA= U.S. Department of Commerce, National Oceanic and Atmospheric Administration
MARAD = U.S. Department of Transportation, Maritime Administration
TRAINMAR = United Nations Trade and Development Maritime Training Program
OAS = Organization of American States, Inter-American Committee on Ports
ILO = International Labor Organization
Page 12
Nicaragua: Phase II—Port Damage Assessment Long-Term Report
Section 1—Introduction
1.0 Background
The Port Damage Assessment Project was conceived with a comprehensive view of the entire
transportation system that connected international shipping of cargo to and from global markets. This
system is composed of harbor and channel systems, port facilities that were adjacent to port access roads,
and upland connector road and bridge infrastructure systems linked to manufacturing and agricultural
farm areas.
The Phase I—Short-Term Action Report that was completed on April 30, 2000, focused on immediate
actions that could be implemented by the National Port Agency (i.e., Empresa Portuaria Nacional [EPN])
within a 6-month to 1-year period. The report centered on topical areas that dealt with waterside
infrastructure specifically relating to navigation aids and water level gauges, a dredging survey, and the
establishment of an environmental response system. In addition, land-side infrastructure was investigated
and physical port security and safety recommendations were identified for EPN to implement. Also,
specific recommendations were identified for capital project improvements for roads and bridges in the
upland areas.
In Phase II, the Port Damage Assessment Team embarked on project evaluation of port facilities, road,
and bridge infrastructure improvements at the Port of Corinto, Nicaragua, as a result of damages from
Hurricane Mitch. The Team has addressed specific areas of concern that dealt with the demand side of
port development, i.e., targeting the future needs of the ports and determining what demand for services
are needed by the global market for Nicaraguan export and import products. Specific physical
impediments to trade and development that were not covered in the Phase I—Short-Term Action Report
were investigated at each port.
In Phase II, the Team developed foreign trade forecasts at the macro and micro levels for the country of
Honduras. Trade and cargo data were collected from various sources including: EPN, the Central Bank of
Nicaragua, the World Bank, the Inter-American Development Bank, and other private and public sources.
To complement to foreign trade forecasts, the Team investigated current port business plans and the
results of the forecasts to determine capital improvement needs and requirements. The Team also
gathered port access information from the respective ports to determine if the road, highway, and bridge
infrastructure could sustain future impacts of increased truck traffic, particularly through major urban port
access roads. The Ministry of Transportation and Infrastructure (MTI), EPN, and the City of Corinto will
be the recipients of the findings to implement future road, highway, and bridge construction projects.
Finally, the Team addressed the need for institutional framework changes and supplementary professional
training for port managers and road and highway engineers.
Page 13
Nicaragua: Phase II—Port Damage Assessment Long-Term Report
1.1 Scope of Study
The Port of Corinto was the only port evaluated because of its strategic importance to Nicaragua as well
as to Central America. The Port provides direct access to Central and South America, North America, and
the Pacific Rim countries. Also, the Port of Corinto handles the majority of international cargo for the
entire country and sustained the greatest amount of damage from Hurricane Mitch. To this end, the study
team focused in Phase II on improving key transportation infrastructure components of Port of Corinto
intermodal or multi-modal system.
1.2 Objective
As the result of the damages incurred by Hurricane Mitch, the primary objective of the Phase II Report
was to determine what opportunities exist to restore and reconstruct the major international port of
Nicaragua.
1.3 Methodology
In order to accomplish the objective of restoring the Port of Corinto to optimum operational condition, the
Team took a targeted view of what infrastructure requirements could increase the throughput of the port.
The Sub-Teams investigated the following areas:
� International Trade Forecasts and Institutional Considerations
� Capital Port Improvements at the Port of Corinto
� Port Access Roads in the City of Corinto
� Institutional Framework Concerns
� Training Requirements to Implement Phase I and II Recommendations
The key factor of the methodology is based on the concept that the international trade forecasts are the
driving mechanisms which determine the ultimate throughput cargo considerations for both the capital
improvements at the Port of Corinto and the access road and upland connector improvements to the port.
The Team made two visits to Nicaragua in May and August 2000. During these visits, critical information
was provided to the Sub-Teams. Meetings were held with port stakeholders, financial institutions, and
governmental officials to gather the necessary data and information needed to understand the conditions
at and adjacent to the Port of Corinto. The data and information served as the basis for the final
recommendations and conclusions.
Page 14
Nicaragua: Phase II—Port Damage Assessment Long-Term Report
Section 2—National Trade Forecasts and Statistics
2.0 Background
This section of the analysis looks at the foreign trade sector of the Nicaraguan economy, describing the
historical record in recent years and assessing the long term outlook for trade expansion. In the wake of
Hurricane Mitch, this analysis focuses on changes in the economic prospects for Nicaragua and their
effect on the country’s international trade in goods. In the next section of the report, these forecasts will
serve as the basis for assessing the long term needs for port capacity and facilities. A long range forecast
of demand for port traffic is an essential component of port planning and must be integrated on a regular
basis with the port’s overall port development planning process.
The analysis begins with a broad overview of economic conditions in Nicaragua, assessing trends in
Gross Domestic Product (GDP) and developments in key sectors. The analysis then provides an overview
of the country’s trade situation, looking at the performance of both the export and the import sectors. In
addition, the analysis identifies Nicaragua’s major trading partners and major traded commodities.
Completing the historical background section is an analysis of port trade statistics, showing the trend in
ocean-borne trade tonnage moving through major Nicaraguan ports.
The analysis continues with the outlook for trade and the economy utilizing existing forecasts and
producing an updated trade tonnage forecast based on the latest available data. The analysis includes a
post-Hurricane Mitch assessment of growth for the overall economy as well as international trade.
Finally, although the focus of this report is on port traffic, attention is also paid to cross-border trade by
land.
The information in this section was obtained from a number of knowledgeable sources including the
Central Bank, the national port organization, international development agencies, U.S. DOT, the State
Department, consultants’ reports, and various publications. The views of economists and trade experts
have also been incorporated from interviews conducted in the course of this study, including in-country
meetings.
2.1 Analysis
2.1.1 Economic Conditions
The Nicaraguan economy is small in size and ranks among the poorer nations of the Western Hemisphere.
Nicaragua has a population of 4.8 million and its GDP stood at $2.126 billion in 1998. Per-capita GDP
was $450 in 1998, with about half the population living in poverty. Nicaragua emerged in 1989 from a
Page 15
Nicaragua: Phase II—Port Damage Assessment Long-Term Report
10-year civil war with its economy in sharp decline and exports at one-half the pre-war level. In the
1990s, Nicaragua shifted from a state-controlled economy to a market economy, introducing major
reforms in both its domestic and international policies. However, with a low income per capita and huge
external debt, the country has found the road to economic development a difficult one.
Nicaragua relies heavily on agriculture and the earnings derived from exports of commodities such as
coffee, sugar, beef, and shrimp. Development efforts have aimed to expand the industrial sector and
encourage capital investment in the productive capacity of the country, but resources for these objectives
have been limited. Starting in the mid-1990s, the Nicaraguan economy began to gain strength as a result
of economic reforms and support from international development agencies, with a resulting level of GDP
growth of 5-6% prior to the devastation caused by Hurricane Mitch.
Hurricane Mitch was not only tragic in human terms, but it also dealt a severe blow to the Nicaraguan
economy when it hit in October 1998. The damage from the storm hurt the economy in several ways.
First, it destroyed productive capacity by washing out crops and plantations. Second, it severely damaged
the infrastructure. And third, it created dislocations in various sectors that could not resume normal
operations for a period of time. Estimated storm damage totaled over $1.3 billion, according to the United
Nations Economic Commission for Latin America and the Caribbean (ECLAC). Mitigating some of these
negative effects has been the response of the international community, which has provided both
humanitarian and financial support, enabling Nicaragua to move rapidly to reconstruction and recovery.
Nicaragua clearly registered a major economic setback in the months following the storm, slowing down
the economic surge experienced since the mid-1990s as the GDP growth rate for 1998 declined to 4%.
International trade suffered as port and road capacity was reduced for a period of time due to
infrastructure damage, while a portion of the export crops were destroyed. On the import side, the
country’s needs for construction materials and capital goods for the reconstruction efforts contributed to a
rise in imports in these categories. Despite the storm’s impact, Nicaragua was quickly able to recapture
the GDP growth rate it had achieved prior to the storm with 1999 real GDP estimated by Banco Central at
over 6%, and projected at 5.5% for 2000.
Employment in the country is concentrated in agriculture, which accounts for about 40% of the labor
force. About one-third of the labor force is engaged in services, while industry employs about 10%.
Services, however, account for 40% of GDP and industry 20%.
Nicaragua’s population, economic activities, and main ports are concentrated in the western part of the
country facing the Pacific, with most of the eastern side, including most of the Caribbean coast, remaining
undeveloped.
In a significant development, Nicaragua stands to gain from the recently signed legislation in the U.S. to
enhance trade benefits under the Caribbean Basin Initiative (CBI). Known as the Trade and Development
Page 16
Nicaragua: Phase II—Port Damage Assessment Long-Term Report
Act of 2000, this legislation provides for duty-free (from an average of 18%) entry into the U.S. of
apparel made from U.S. yarn and fabric, as well as knit apparel made in the Caribbean Basin from
regional fabric made with U.S. yarn (subject to caps). In addition, it allows for certain steps in the
production previously done in the U.S. to be done in Nicaraguan Maquiladoras factories. Although the
Maquiladoras sector is currently small, Banco Central de Nicaragua has indicated a good potential for its
accelerated growth in the coming years. This can further boost the industrial sector and exports to the U.S.
During the 1990s, Nicaragua also expanded its tourism sector and is looking to attract foreign investment
to further expand this high potential sector. This will have implications for demand for cruise facilities
and other infrastructure needs.
2.1.2 Central American Context
The Nicaraguan economy should also be viewed in the broader context of its geographic location and
special economic ties with its Central American community of nations. This is important because
neighboring countries are part of the Central America Common Market, which provides preferential
treatment to goods shipped among member countries. In addition, the cross-border roads and ports
provide each country more options in optimizing their shipping costs for traded goods. For example, with
Nicaragua’s main ports located on the Pacific coast, Honduras’ Caribbean Port of Cortes serves as a
gateway for many Nicaraguan shipments bound to or from the Atlantic shipping lanes. Panamanian ports
also serve as hub ports for smaller feeder ports in Central America. However, political conflicts,
particularly between Honduras and Nicaragua, have impeded the development of smooth trade relations
along the Central American corridor.
2.1.3 Nicaragua Trade Overview
Following a period of little or no growth in the early 1990s, Nicaragua’s exports, measured in U.S.
dollars, rose sharply in 1994 and continued on a fast pace through 1997. Export value more than doubled
between 1993 and 1997, from $267 million to $709 million. Exports declined in 1998 to $579 million due
to the storm. Imports, in contrast, have grown steadily throughout the decade, from $547 million in 1989
to $1,384 in 1998. (Note: Change in the value of trade includes changes in both commodity prices and
quantity shipped.)
Preliminary data for 1999 show that exports were still lagging at $544 million, mainly due to declines in
world prices of key commodities such as coffee, bananas, and sugar. Imports, on the other hand,
rebounded to $1,639 million, reflecting in part strong inbound shipments related to the storm recovery
efforts. It should be noted that official trade statistics in dollars exclude the actual value of Free Trade
Page 17

Nicaragua: Phase II—Port Damage Assessment Long-Term Report
Zone (FTZ) imports of raw materials and exports of finished goods, mainly textiles and apparel. In 1999,
FTZ exports added an additional $182 million to exports. Tonnage data include all cargo.
Table 1
Nicaragua Exports and Imports in Millions of Year 2000 U.S. Dollars (FOB*)
1989 1990 1991 1992 1993 1994 1995 1996 1997 1998
Export 319 332 268 223 267 364 530 674 709 579
Import 547 570 688 771 659 784 897 1050 1371 1384
Source: Inter-America Development Bank (IDB)
* FOB=Free on Board
2.1.4 Key Commodities
Coffee, the country’s leading agricultural commodity export, has grown rapidly in the 1990s. The value of
Coffee exports reached $173 million in 1998 as compared with $71 million in 1990. Manufactured goods
exports rose sharply, from $50 million in 1990 to $125 million in 1998, although they remained below
their 1997 level of $279 million. Shrimp exports also rose sharply from $9 million in 1990 to $49 million
in 1998. In contrast, two other leading commodity exports, Sugar and Meat, registered a decline in total
value. Between 1990 and 1998, Sugar exports declined from $39 million to $33 million and Meat exports
dropped from $57 million to $38 million.
Imports have increased across all major commodity groups. From 1990 to 1998, imports of consumer
non-durable goods rose from $129 million to $357 million, consumer durable goods from $30 million to
$78 million, industrial materials from $104 million to $317 million, construction material from $20
million to $80 million, capital goods for industry from $79 million to $258 million, and transportation
equipment from $106 million to $165 million. Preliminary figures for 1999 show that all major groups
registered growth compared to 1998. However, growth was particularly strong in consumer and capital
goods—25% and 32%, respectively.
2.1.5 Key Markets
Nicaragua’s trading partners are highly concentrated in the Western Hemisphere with 67%, of all
Nicaragua’s exports destined to markets in the Americas, and as much as 82% of its imports coming from
the Americas. The U.S. is Nicaragua’s largest trading partner, accounting for about 37% of its total export
value in 1998. Europe accounted for 30% of exports and Central America 22%. Major country markets
are Germany with 12%; El Salvador 10%; Spain, Belgium, Honduras, and Costa Rica with 4% each;
Guatemala 3%; and France and Holland with 2%. Asia was the market for only 1% of Nicaragua’s
exports.
Page 18
Nicaragua: Phase II—Port Damage Assessment Long-Term Report
On the import side, the U.S. is Nicaragua’s largest supplier, with a 31% share. Central America supplied
29% in 1998, Europe 7%, and Asia 6%. Among individual countries, Costa Rica is the second largest
supplier with 11%; Guatemala, 8%; Panama, 7%; Japan, 6%; Mexico, Honduras, and El Salvador, 5%
each; and Columbia and Venezuela, 3% each. (These market statistics do not include the emerging
Maquiladora trade.)
2.1.6 Trade Trends in Tons
After several years of declining volumes in the early 1990s, port traffic began to accelerate in 1994.
Export tonnage rose from 168,000 tons in 1993 to 329,000 tons in 1997 and declined to 282,000 tons in
1998, mainly due to Hurricane Mitch. Preliminary data for 1999 show exports at an even lower level,
204,000 tons. Imports rose from 1.2 million tons in 1993 to 2.0 million tons in 1998, and to 2.1 million
tons in 1999. (See Table 2.)
Table 2
Nicaragua Ports Total Exports and Imports 1990-1999 in Thousands of Metric Tons
1990 1991 1992 1993 1994 1995 1996 1997 1998 1999
Export 406 408 299 168 177 232 264 329 282 204
Import 1190 1030 1102 1073 1196 1372 1285 1273 1732 1938
Total 1596 1438 1401 1241 1373 1604 1549 1602 2014 2142
Source: Banco Central de Nicaragua (BCN), 1999, and National Port Authority (EPN)
Nicaragua’s trade moves primarily through two Pacific Coast ports. Corinto handled a total of 814,000
tons in 1998, up from 758,000 in 1997. Aided by reconstruction shipments of materials, 1999 volume
reached a total of 914,000 tons. A total of 7,033 TEUs moved through the port in 1998 and 8,184 in 1999.
This is a substantial increase from 1996 (the low point for the decade), when TEU volume was 2,814.
Puerto Sandino, with the major petroleum terminal, handled 1.1 million tons in 1998 and 1.2 million tons
in 1999, mostly in petroleum imports. The port has handled no export shipments since 1996. Four other
Nicaraguan ports handle only 3% of the nation’s trade. (See Table 3.)
In 1998, the Port of Corinto handled 40% of Nicaragua’s water-borne trade. The main growth import
commodities at the Port of Corinto between 1989 and 1998, reflecting the national trend, were petroleum
products, wheat, and other grains. Growth in general merchandise was erratic, declining from 262,000
tons in 1989 to 89,000 tons in 1996 and rising to 130,000 tons in 1998. Similarly, fertilizer imports
declined from 78,000 tons in 1989 to 24,000 tons in 1992 and back up to 66,000 tons in 1998. Sugar was
the only major growth commodity on the export side, more than doubling in volume over the 10-year
period. In contrast, bananas and coffee registered declines in volume. (See Table 4.)
Page 19
Nicaragua: Phase II—Port Damage Assessment Long-Term Report
Table 3
Nicaragua Exports and Imports by Major Ports 1989-1999 in Thousands of Metric Tons
1989 1990 1991 1992 1993 1994 1995 1996 1997 1998 1999
Corinto Export 304 356 361 287 160 151 206 241 295 228 192
Corinto Import 444 448 302 279 272 353 358 376 463 586 722
Puerto Sandino Export
65 30 21 0 0 12 4 0 0 0 0
Puerto Sandino Import
675 664 645 707 726 747 871 821 860 1091 1167
Source: Empresa Portuaria Nacional (EPN)
Table 4
Key Import and Export Growth Commodities at Port of Corinto 1989-1998
in Thousands of Metric Tons
Commodity 1989 1998
Imports:
Crude Petroleum and Deriv. 52 726
Wheat 36 112
Other Grains 13 79
Exports:
Sugar 67 154
Source: Empresa Portuaria Nacional (EPN)
At the Port of Sandino, imports are dominated by petroleum products, which increased from 570,000 tons
in 1989 to 902,000 tons in 1998, and down to 862,000 tons in 1999. Clinker, a product used in cement,
registered growth beginning in 1994, rising from 27,000 tons to 91,000 tons in 1998. Traffic related to
reconstruction boosted Clinker imports to 201,000 tons in 1999. Similarly, fertilizer imports at Sandino
fluctuated during the 1990s from 0 to 30,000 tons, but jumped to 53,000 tons in 1999.
Notably, substantial volumes of cargo move internationally across Nicaragua’s borders by land, to be
handled primarily through Honduras’ Caribbean Port of Cortes. That port provides good water-borne
service to Nicaragua’s major trading partners, including the East Coast and Gulf U.S., and Europe. Costa
Rica also provides an outlet to the Atlantic. Only minor competition from air cargo exists at present,
although traffic is growing rapidly. Total international air cargo volume, primarily high value-per-ton
commodities, grew from 11,400 tons in 1990 to 59,900 tons in 1998, according to the Banco Central de
Nicaragua.
Page 20

Nicaragua: Phase II—Port Damage Assessment Long-Term Report
2.2 Trade Outlook
2.2.1 Methodology
The outlook section of the report utilizes existing forecasts of international trade for Nicaragua that were
available for this study from official sources as well as other studies. They include GDP and trade
forecasts in dollars as well as trade forecasts by weight. The forecast by weight is reassessed and adjusted
to reflect the latest available trade data. The forecasts are long term, running as far as 2020. It is important
to keep in mind that the trade forecast in dollar terms reflects assumptions about changes in both volume
and price and, therefore, is sensitive to changes in both factors.
2.2.2 Economic Forecast
The World Bank projects relatively strong economic growth for Nicaragua over the long term. Real GDP
is projected to grow at 6-6.5% from 2000 to 2004, at 5.5% through 2011, and at 5% through 2020. These
are the same rates projected by the Banco Central de Nicaragua. GDP in current U.S. dollars is projected
by BCN to rise from $2.4 billion in 2000 to $3.6 million in 2005, $5.2 billion in 2010, and $10.5 billion in
2020. Population is expected to grow at 2.5%.
The Central Bank sees economic expansion driven by an increased investments industry and tourism.
Maquiladoras are expected to grow in importance as a result of CBI enhancement, especially in the area
of textiles and apparel. In addition, further economic and political reforms are expected to provide a more
stable environment for investment, as the international financial community continues to work closely
with the Nicaraguan Government to implement these reforms. BCN does not project any specific major
new industries to be launched in the foreseeable future, although it sees the traditional agricultural sector
and its exports becoming a somewhat smaller, if still important, share of a growing economy. While
petroleum is seen as continuing to be a major import commodity by volume, steady growth is expected in
the share of industrial and capital goods imports. BCN does not see any significant shifts in the
international market mix for exports and imports.
2.2.3 Trade Forecast in Dollars
The World Bank prepares a dollar trade forecast for Nicaragua in collaboration with the International
Monetary Fund (IMF) and Inter-American Development Bank (IDB) as part of the Heavily Indebted Poor
Countries (HIPC) initiative. In its August 1999 forecast, the World Bank sees international trade growing
rapidly following the recovery from the negative effects of Hurricane Mitch, which appear to be relatively
short term. BCN export and import projections through 2020 are very similar.
Page 21
Nicaragua: Phase II—Port Damage Assessment Long-Term Report
Export growth is seen as recovering in 2000 to its 1998 level. In the longer term, exports are expected to
be strong, with total value rising to $988 million in 2005 in current dollars, to $1,487 million in 2010, and
$2,772 million in 2018. Among the traditional export products, Coffee is seen as the main growth
commodity, rising from $156 million in 2000 to $230 million in 2005, $341 million in 2010, and
$734 million in 2020. Other traditional commodities projected to grow substantially over the 2000-2020
period are: Sugar, $36 million to $198 million; Meat, $44 million to $147 million; Shrimp, $48 million to
$169 million; Lobster, $40 million to $120 million; Bananas, $17 million to $65 million; and Sesame, $6
million to $43 million. Other farm products are projected to grow rapidly from $90 million to $600
million, and manufactured products are projected to rise from $111 million to $385 million, according to
the World Bank total and BCN detail.
On the import side, shipments are expected to moderate from the artificially high traffic in 1999, driven
by strong demand for materials and capital goods involved in the hurricane reconstruction effort. Total
imports in 2000 are expected to remain at about the 1999 level of $1.7 billion, and are projected to grow
to $2.0 billion in 2005, $2.9 billion in 2010, and $4.8 billion in 2018. Every major category of imports is
expected to grow over the long term. Expressed in cost, insurance, and freight (CIF) prices, imports of
Consumer Goods are projected to rise from $591 million in 2000 to $1,812 million in 2020; Intermediate
Goods (for farming, industry, and construction) from $588 million to $1,648 million; Capital Goods, from
$507 million to $1,277 million; and Petroleum Products, from $165 million to $374 million.
Both the World Bank and the Central Bank of Nicaragua see real trade growth exceeding real GDP
growth. A separate forecast by Standard & Poor’s DRI (2Q99) sees an average real GDP growth rate in
Nicaragua of about 5% over the next several years as well as in the longer term to 2015. In the broader
context, DRI also projects total world trade and Latin American trade to grow steadily through 2010 and
beyond, indicating a strong trading environment for Nicaragua. In a separate analysis by the WEFA
Group (1Q2000), world exports are projected to grow at a real annual rate ranging from 5.6% to 6.3%
from 2000 to 2008. Over the same period they see imports rising at a rate of 5.6% to 6.6%.
2.2.4 Port Trade Forecast for Nicaragua
This analysis demonstrated the basic strength of the Nicaraguan economy to continue to grow and
generate capacity for exports and demand for imports. The positive long term outlook in the
macroeconomic sense also translates into strong demand for transportation services to handle the
expanding freight tonnage expected to move through Nicaragua’s international gateways. In addition,
Nicaragua’s road transportation system will likely continue to be called upon to meet the demand for
international cargo moving to and from its ports, as well as cargo transiting through its land borders,
particularly on roads leading to the Honduran border on route to and from the Port of Cortes.
Page 22

Nicaragua: Phase II—Port Damage Assessment Long-Term Report
Two key analyses and long term forecasts of Nicaragua’s international trade serve as the main basis for
the current analysis: (1) “Evaluacion Technica-Economica y Financia para la Concesion del Puerto
Corinto en Nicaragua,” a 1998 study by ICF Kaiser, which includes trade tonnage forecast for Corinto to
2015, and (2) “Infrastructura Portuaria para el Comercio Exterior de CentroAmerica,” a 1995 study by the
Economic Commission for Latin America and the Caribbean (ECLAC), containing a forecast of
Nicaragua’s total trade tonnage through 2010. These two studies provide the High and Low trade forecast
growth rates beyond the year 2000.
Tables 5, 6, and 7 summarize the two studies’ forecasts:
Table 5
Cargo Forecast for the Port of Corinto Nicaragua by ICF Kaiser (1998)
in Thousands of Metric Tons
Imports Exports Total
1996 actual 376 240 616
2000 480 328 808
2010 852 433 1285
2015 1112 516 1628
Note: the Port of Corinto is Nicaragua’s main port for both
exports and imports, with the exception of petroleum imports
that move in large quantities through the Port of Sandino.
Table 6
Nicaragua Total Port Cargo Forecast by ECLAC (1995)
in Thousands of Metric Tons
Imports Exports Total
1994 actual 1196 177 1373
2000 1394 549 1943
2010 1951 663 2614
Table 7
Actual Port Cargo in Nicaragua in 1998 and 1999
in Thousands of Metric Tons
Imports Exports Total
1998 1732 282 2014
1999 1938 204 2142
Source: EPN
Page 23

Nicaragua: Phase II—Port Damage Assessment Long-Term Report
A comparison of actual trade activity in 1999 (the latest full-year data now available) with the ECLAC
projected trade volume for 2000 shows that imports far exceeded the forecast while exports trailed the
forecast. On the import side, this appears to be mainly due to the unexpectedly rapid economic growth in
the late 1990s as well as short term distortions caused by Hurricane Mitch in 1999. The actual total
tonnage in 1999, at 2,142,000 metric tons, exceeded the 2000 forecast by 10%. However, imports were
over the 2000 forecast by 39% and exports were under by 63%. The actual total tonnage for 1998 was
closer to the 2000 forecast. At 2,014,000 tons, it exceeded the forecast by only 4%. In 1998, actual
imports were over-forecasted by 24% and exports were under-forecasted by 49%. In view of these
differences, the study’s long range projections to the year 2010 and beyond are adjusted in this analysis
using the updated data on actual performance.
To update the forecast for Nicaragua’s total port activity and for Corinto, the ECLAC and ICF Kaiser
projected growth rates for exports and imports from 2000 to 2010 are applied to the new baseline trade
data. In addition, the growth rates from the two studies are utilized to create a range for a Low and High
forecast, which are then applied for Corinto and for total Nicaragua trade. The new baseline for the
forecast is the year 1998, which is assumed to have similar tonnage to the year 2000 as storm-related
distortion is expected to be worked out over a 2-year period. (Exports are distorted downward due to
storm-related disruptions, while imports are temporarily high due to disaster relief shipments.)
The 10-year ECLAC (Low) projected growth rate for total trade is 34.5%. The growth rate for exports is
20% and for import tonnage 40%. The 10-year ICF Kaiser (High) projected growth rate for total trade is
59%. The exports growth rate to 2010 is 32% and for imports 77.5%. The same sets of growth rates are
utilized to project trade to 2020, based on the CBN assumption of continued steady growth in GDP and
trade beyond 2010.
Based on this methodology, Table 8 shows the revised forecast in tonnage.
Table 8
Revised Port Trade Projections for Nicaragua to 2010 and 2020
in Thousands of Metric Tons
2010 2020
Low High Low High
Exports 340 372 411 491
Imports 2424 3074 3393 5457
Total 2765 3446 3804 5948
Total tonnage in 2010 is projected at 2.8 to 3.4 million tons, and in 2020 at 3.8 to 5.9 million tons.
Page 24
Nicaragua: Phase II—Port Damage Assessment Long-Term Report
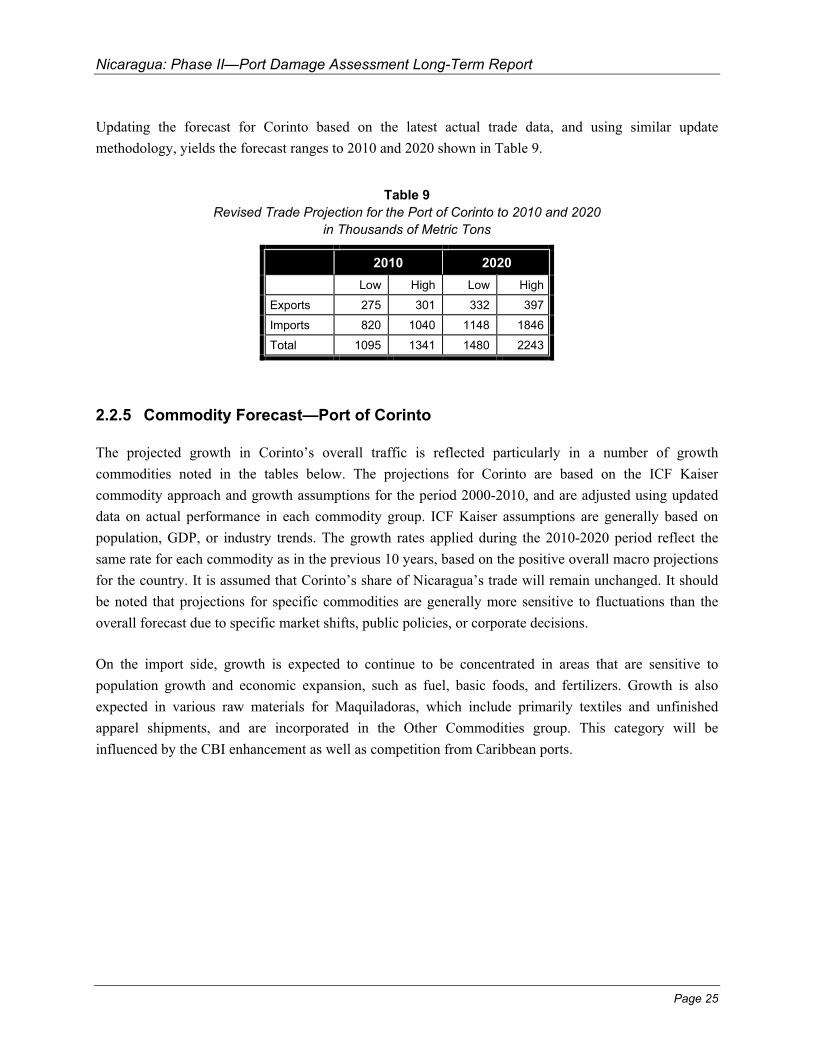
Updating the forecast for Corinto based on the latest actual trade data, and using similar update
methodology, yields the forecast ranges to 2010 and 2020 shown in Table 9.
Table 9
Revised Trade Projection for the Port of Corinto to 2010 and 2020
in Thousands of Metric Tons
2010 2020
Low High Low High
Exports 275 301 332 397
Imports 820 1040 1148 1846
Total 1095 1341 1480 2243
2.2.5 Commodity Forecast—Port of Corinto
The projected growth in Corinto’s overall traffic is reflected particularly in a number of growth
commodities noted in the tables below. The projections for Corinto are based on the ICF Kaiser
commodity approach and growth assumptions for the period 2000-2010, and are adjusted using updated
data on actual performance in each commodity group. ICF Kaiser assumptions are generally based on
population, GDP, or industry trends. The growth rates applied during the 2010-2020 period reflect the
same rate for each commodity as in the previous 10 years, based on the positive overall macro projections
for the country. It is assumed that Corinto’s share of Nicaragua’s trade will remain unchanged. It should
be noted that projections for specific commodities are generally more sensitive to fluctuations than the
overall forecast due to specific market shifts, public policies, or corporate decisions.
On the import side, growth is expected to continue to be concentrated in areas that are sensitive to
population growth and economic expansion, such as fuel, basic foods, and fertilizers. Growth is also
expected in various raw materials for Maquiladoras, which include primarily textiles and unfinished
apparel shipments, and are incorporated in the Other Commodities group. This category will be
influenced by the CBI enhancement as well as competition from Caribbean ports.
Page 25
Nicaragua: Phase II—Port Damage Assessment Long-Term Report
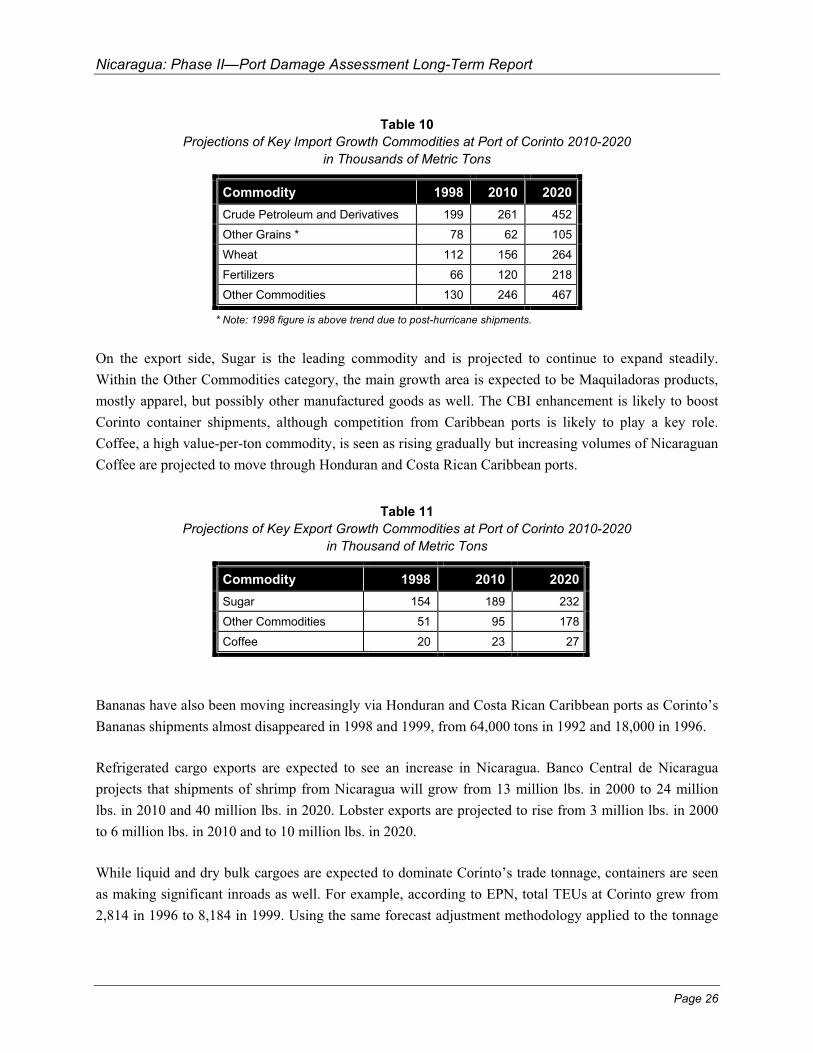
Table 10
Projections of Key Import Growth Commodities at Port of Corinto 2010-2020
in Thousands of Metric Tons
Commodity 1998 2010 2020
Crude Petroleum and Derivatives 199 261 452
Other Grains * 78 62 105
Wheat 112 156 264
Fertilizers 66 120 218
Other Commodities 130 246 467
* Note: 1998 figure is above trend due to post-hurricane shipments.
On the export side, Sugar is the leading commodity and is projected to continue to expand steadily.
Within the Other Commodities category, the main growth area is expected to be Maquiladoras products,
mostly apparel, but possibly other manufactured goods as well. The CBI enhancement is likely to boost
Corinto container shipments, although competition from Caribbean ports is likely to play a key role.
Coffee, a high value-per-ton commodity, is seen as rising gradually but increasing volumes of Nicaraguan
Coffee are projected to move through Honduran and Costa Rican Caribbean ports.
Table 11
Projections of Key Export Growth Commodities at Port of Corinto 2010-2020
in Thousand of Metric Tons
Commodity 1998 2010 2020
Sugar 154 189 232
Other Commodities 51 95 178
Coffee 20 23 27
Bananas have also been moving increasingly via Honduran and Costa Rican Caribbean ports as Corinto’s
Bananas shipments almost disappeared in 1998 and 1999, from 64,000 tons in 1992 and 18,000 in 1996.
Refrigerated cargo exports are expected to see an increase in Nicaragua. Banco Central de Nicaragua
projects that shipments of shrimp from Nicaragua will grow from 13 million lbs. in 2000 to 24 million
lbs. in 2010 and 40 million lbs. in 2020. Lobster exports are projected to rise from 3 million lbs. in 2000
to 6 million lbs. in 2010 and to 10 million lbs. in 2020.
While liquid and dry bulk cargoes are expected to dominate Corinto’s trade tonnage, containers are seen
as making significant inroads as well. For example, according to EPN, total TEUs at Corinto grew from
2,814 in 1996 to 8,184 in 1999. Using the same forecast adjustment methodology applied to the tonnage
Page 26
Nicaragua: Phase II—Port Damage Assessment Long-Term Report
forecast above to TEUs, the projected number of TEUs would range from 11,007 to 13,012 in 2010 and
from 14,805 to 20,690 in 2020.
The Corinto forecast is constrained by the assumption that it will continue to face competition from
Caribbean ports in Honduras and Costa Rica for cargo moving to and from its trading partners in the
Caribbean and Atlantic regions.
Based on in-country interviews, it is also assumed that Sandino will remain primarily an import port for
petroleum products, with continued growth in tonnage of such products.
2.3 Conclusion
Analysis of the economic and trade data clearly shows that the damage caused by Hurricane Mitch in
October 1998 was a major setback for the Nicaraguan economy. However, the country, with the aid of the
international community, has shown a resilience that has enabled it to bounce back sooner than expected.
The export sector is in the process of recovery from hurricane related losses but imports have continued to
grow, in part reflecting the recovery supply effort. As shown above, the outlook for trade appears to be
positive and trade volumes are projected to return to the growth track envisioned prior to the storm. Both
exports and imports tonnage as well as container activity are seen as rising significantly through the year
2020.
Although a range of forecasts is presented, it should be noted there are additional risks to this long range
forecast on both the High and the Low side. On the one hand, the outlook would be even stronger if the
Nicaraguan economy could sustain high growth rates through additional economic reforms and
substantially increased investments in the productive capacity of the nation’s industrial and transportation
infrastructure, including the targeting of specific manufacturing areas such as low-cost producers. If, for
example, the trade growth rates achieved just prior to Hurricane Mitch can be sustained over the long
haul, then the tonnage forecast presented here may be considered conservative. In contrast, trade growth
may be slower than projected if economic development efforts are impeded, if cyclical slowdowns are
severe, or if high energy costs prevail for a long period of time. Ports also face growing competition from
air transportation, which is likely to capture the highest unit-value cargoes. While this may result in a
significant increase in the total value of the cargo captured by the air mode, tonnage diversions to air are
likely to be relatively small.
According to BCN and EPN, the traditional trade product mix and international market mix are not
expected to change significantly over the next several years. There are, however, several areas of
opportunity for Nicaragua over the long term. First, the CBI enhancement will very likely promote
growth in Maquiladora trade and can contribute strongly to increasing trade with the U.S. This will tend
Page 27
Nicaragua: Phase II—Port Damage Assessment Long-Term Report
to increase the share of manufactured goods in the trade mix, including both consumer and industrial
products, as well as promote the utilization of containers. The Port of Corinto can benefit from increased
efforts to promote trade with the Pacific Rim nations, including the U.S. West Coast; the promotion of
manufacturing plant development in the immediate hinterland of the port; and the development of
stronger feeder service to Panama’s Pacific hub with its diverse global links, which will also provide a
more reliable alternative to the land route during the rainy season. At the same time, there appear to be
opportunities to increase container shipments of coffee to Europe via Corinto. Finally, growth in such
products as shrimp and other foodstuffs is likely to increase demand for refrigerated cargo facilities.
Despite these opportunities, Nicaragua is likely to continue to rely on Honduran and Panamanian ports on
the Caribbean coast, and particularly the Port of Cortes, for much of its Caribbean/Atlantic cargo. The
quality of the roads connecting Cortes with Nicaragua and the efficiency of the border crossing will be
major determinants in the cost competitiveness of such traffic and the degree to which Corinto can
participate in such trade.
2.4 Recommendation
2.4.1 It is critically important that an on-going foreign trade forecast be updated by EPN to ensure
efficient port planning and operations. Therefore, it is recommended that EPN designate a staff
person, preferably an economist, to periodically update foreign trade forecasts. The main reason
for this recommendation is that world trade markets are in constant flux and change and need to
be analyzed periodically.
2.4.2 EPN should consider utilizing a port economic impact analysis kit in the future in order to
properly demonstrate the overall benefits and impacts of port development on the economy of
Nicaragua and the port region as a whole. The analysis will show how the port contributes to
employment, taxes, revenues, and business in the country and in local communities. MARAD has
developed, over the last 25 years, three port economic impact kits that were designed to facilitate
the preparation of economic impact reports for the national, regional, and local communities in
the U.S.. The local community port economic impact kit would be the appropriate tool for the
ports of Nicaragua. The methodology developed in the local port kit is generic and transferable to
Nicaraguan ports but economic data to Nicaragua should be entered in order to obtain the proper
results.
Page 28

Nicaragua: Phase II—Port Damage Assessment Long-Term Report
Section 3—Port Capital Improvement, Port of Corinto
3.0 Introduction
This part of the report is predicated upon the National Trade Forecast and Statistics (see Section 4) and
linked to the Port Access analysis (see Section 4). In general, the Port of Corinto is expected to continue
its trade growth and, therefore, must take the necessary steps to prepare.
The Sub-Team’s visit provided the opportunity to gather information, observe the port operations, and
inspect the port landside infrastructure. All the onsite inspection information gathered, which was
previously documented in Phase I, was analyzed and processed by the Sub-Team. Based on the results of
these analyses, the Landside and Waterside Sub-Teams were able to put forth their recommendations on
capital developments, upgrades and repairs, and the needed operational enhancements.
3.0.1 Existing Conditions
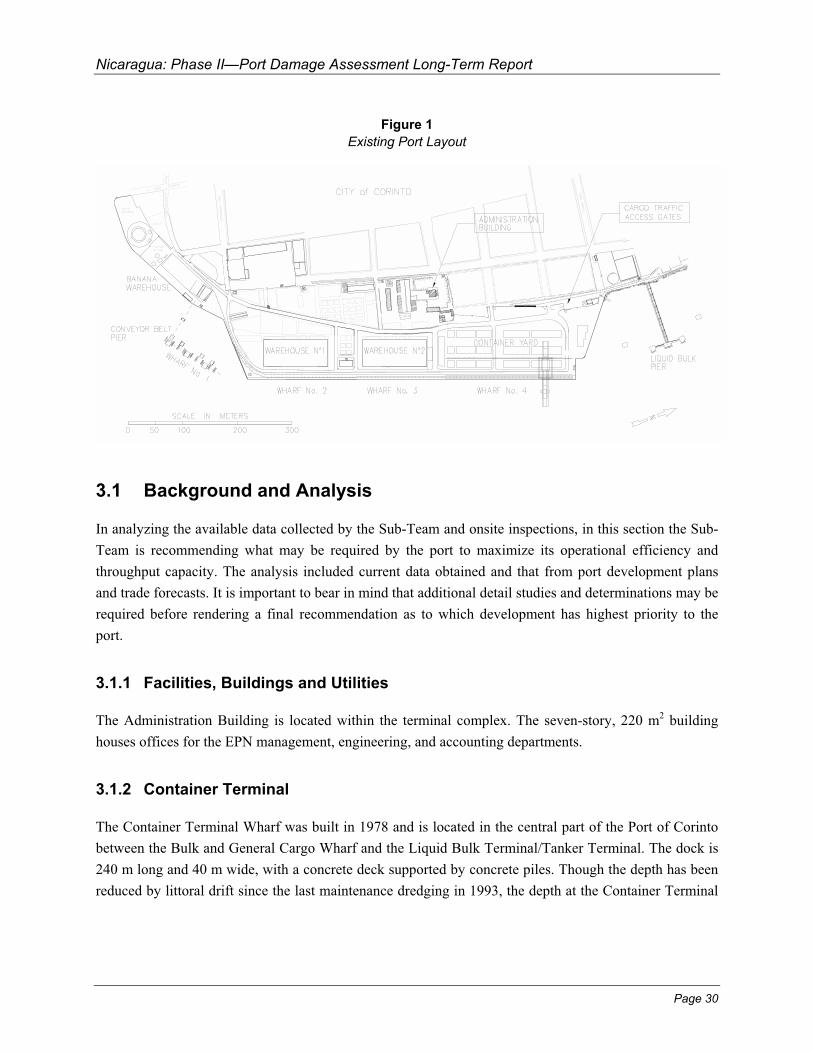
Port location: Latitude: 12°28' 25" N; Longitude: 87°12' 25" W.
The Port of Corinto is considered the main port of Nicaragua. Located on the Pacific Coast of Nicaragua,
Corinto is on the bay side of the island of Aserradores and protected by the El Cardón Island and the
Peninsula de Castañones. The port is in the Department of Chinandega, in the mouth of El Realejo and
160 km WNW of the capital of Managua. The port is accessed from the open sea by a two-part channel.
The outer channel is 6 km long and the inner channel is 3 km long.
The warm Equatorial Counter Current runs off the West Coast of Central America. The Port of Corinto is
on the route of liner traffic between the Panama Canal, the U.S. West Coast, Asia, and to the West Coast
of South America. The Aserradores Islands, El Cardón, and the Peninsula of Castañones protect the port
from the open ocean.
Page 29
Nicaragua: Phase II—Port Damage Assessment Long-Term Report
Page 30
Figure 1
Existing Port Layout
3.1 Background and Analysis
In analyzing the available data collected by the Sub-Team and onsite inspections, in this section the Sub-
Team is recommending what may be required by the port to maximize its operational efficiency and
throughput capacity. The analysis included current data obtained and that from port development plans
and trade forecasts. It is important to bear in mind that additional detail studies and determinations may be
required before rendering a final recommendation as to which development has highest priority to the
port.
3.1.1 Facilities, Buildings and Utilities
The Administration Building is located within the terminal complex. The seven-story, 220 m2 building
houses offices for the EPN management, engineering, and accounting departments.
3.1.2 Container Terminal
The Container Terminal Wharf was built in 1978 and is located in the central part of the Port of Corinto
between the Bulk and General Cargo Wharf and the Liquid Bulk Terminal/Tanker Terminal. The dock is
240 m long and 40 m wide, with a concrete deck supported by concrete piles. Though the depth has been
reduced by littoral drift since the last maintenance dredging in 1993, the depth at the Container Terminal

Nicaragua: Phase II—Port Damage Assessment Long-Term Report
Wharf is 10.5 m to 12 m. The terminal has a 40/45 metric ton capacity dockside container crane with a
gauge track of 35 m and a container storage area of 23,000 m2.
Determining a port’s container throughput capacity can be a very complex exercise that evaluates each of
the steps that a container goes through as it passes through the port. However, it is not within the Sub-
Team’s scope of work to carry out such a complex and lengthy exercise to determine throughput capacity.
The Sub-Team has employed the more practical density storage method to analyze and calculate
throughput. The practical density for each piece of container handling equipment has been listed in Table
12 so the reader can compare the storage capacity and the possible increases that can be accomplished by
the use of another storage method.
Using the practical storage method includes an 80% geometry factor as well as a practical maximum
occupancy rating. Based on this storage method, with Top Loaders stacking three containers high, a
container yard can store 297 TEUs per hectare (120 TEUs per acre). Using this method, the terminal has a
static storage capacity of 682 TEUs. It is important to note that practical storage capacity is a relative term
and actual density depends on numerous factors that are unique to the physical constraints as well as the
operational techniques that are employed by the terminal.
Table 12
Container Handling Equipment
Storage Method Practical TEUs per Hectare Containers
Chassis/Trailers 135 85 %
Top Loaders/Reach Stackers 297 3 High
Straddle Carriers 494 2 High
RTGs 667 3.5 High
Empty Stacker 901 4 High
Based on a storage capacity of 297 TEUs per hectare, a 2.3 hectare terminal, and an average container
dwell time of 10 days, the terminal has a throughput capacity of 24,933 TEUs per year. This is assuming
the terminal is working 365 days a year with no major equipment breakdown or interruption of operation.
It is important to recognize that the storage density and dwell time of a container is directly related to the
port’s throughput capacity. For example, if the terminal increases the storage density and shortens the
dwell time, the results will be an increase in throughput capacity. Other ports in Asia and Europe have
addressed the issue of storage capacity effectively by increasing density to accommodate the growth and
remain competitive. Table 13 lists of some of these major ports’ throughput lift capacity for comparison.
Page 31

Nicaragua: Phase II—Port Damage Assessment Long-Term Report
Table 13
Major Ports Throughputs Lifts per Hectare per Year
Singapore 25,485
Rotterdam, Delta Terminal 9,524
Long Beach 5,577
Miami 5,179
New York/New Jersey 3,705
Corinto 2,590
Based on data from Containerization International and
Fairplay 1998. Corinto data is based on 1999 data collected
from EPN.
In 1998, the Port of Corinto handled 7,033 TEUs as a result of 5,233 moves and in 1999 the port handled
8,184 TEUs in 5,959 moves. Although the terminal currently stacks containers between the dockside
crane rails, this is a practice that is discouraged because of possible operational conflicts between the
dockside crane and the top loaders that are simultaneously operating. If the recommended practice is
implemented, the Container Terminal will occupy approximately 17,067 m2 that would have a container
static storage capacity of 505 TEUs. Using the dwell time of 10 days and the same work assumptions, the
current terminal would have a throughput capacity of 18,420 TEUs per year.
With the existing throughput capacity, the port finds itself in unfavorable conditions if it is to attract new
container cargo. For instance, simply adding two ship-calls a month with 450 TEUs moves each would
result in an increase of 10,800 TEUs, for a total of 18,984 TEUs per year. This would exceed the current
capacity of 18,428 TEUs, thus making the port unattractive to any new large containerized business.
Regarding Ro-Ro operations, the Port of Corinto currently has no wharf built to support this cargo
handling method.
3.1.3 Bulk and General Cargo Terminal
The Bulk and General Cargo Wharf was built in 1960 and is located in the central part of the port between
the Container Terminal Wharf and the Banana Conveyor Terminal. The berthing area, in which there are
two berths, is 370 m long by 22.5 m wide. The deck is made of reinforced concrete and is supported by
concrete piles. Due to littoral drift, the depth has been reduced since the last maintenance dredging in
1993 to between 10.5 m and 12 m. The Bulk and General Cargo Wharf handles general cargo and solid
bulk commodities. Imports include grain and fertilizer, and raw sugar is exported from the Port of
Corinto. The storage facilities at the Bulk and General Cargo Wharf are composed of two warehouses of
5,927 m2 each. Additional covered storage is available, as is an open storage area of 48,000 m2.
Page 32

Nicaragua: Phase II—Port Damage Assessment Long-Term Report
The port currently has the resources of a privately owned refrigeration facility within the port complex
that handles the refrigerated products. Additionally, the port has facilities for refrigerated containers that
require an electrical outlet to power its cooling unit. The electrical outlets are located within the Container
Terminal at the south end of the yard.
A smaller operation for the fishing fleets uses the Port of Corinto for moorage, repairs, and fish handling
facilities. Their facilities are small, having little or no impact on port operations.
3.1.4 Banana Loading (Conveyor) Terminal
The Banana Loading Terminal was built in 1971 and is located in the south end of the port. There is
100 m of dockage provided consisting of four concrete platforms supported by concrete piles (Duque de
Alba). A four-belt conveyor system with a loading capacity of 18,000 boxes per hour can be used for
loading bananas, meats, and other boxed export products. The banana storage warehouse of 2,375 m
immediately adjacent to the conveyors was under repair during the Team’s visit. The 6 m to 8 m depths
that were inadequate in places due to littoral drift have been recently dredged. Prior to the dredging, the
Banana Loading Terminal had not been operational since 1985 due to the inadequate water depth in front
of the berth.
3.1.5 Liquid Bulk Terminal/Tanker Terminal
The Liquid Bulk Terminal/Tanker Terminal was built in 1978 and then upgraded in 1996. Its location in
the northern part of the port has a depth of 13.35 m and is capable of handling 25,000 DWT tankers. The
dockage consists of a 105 m long concrete platform (14 m x 9 m), two breasting dolphins (11 m x 10 m),
and two mooring dolphins (10 m x 8 m). The terminal is able to handle many kinds of liquid cargo,
including gasoline, diesel, lubricants, liquid petroleum gas, asphalt, vegetable oils, chemicals for import,
and molasses for export. The pipes for the loading and unloading of liquid products are property of the
users of this terminal. A 115 m long by 5 m wide concrete trestle supports the access walkway that
connects the terminal to shore. The trestle also supports the pipelines that carry the products to the storage
tank farm on land. That trestle is deteriorating and needs to be repaired.
3.1.6 Raw Sugar Loading
As a whole, Nicaragua can export more than 124,000 metric tons of raw sugar in bulk. Raw sugar from
five of the country’s largest mills is trucked to the Port of Corinto. The loading process is time consuming
and lacks efficiency, requiring that the bags that carry the sugar on the trucks from the mills be loaded
onto the ships and then ripped open and emptied into the cargo hauls. All of this is done manually and
loading a 25,000 DWT vessel takes approximately 10 days.
Page 33
2
Nicaragua: Phase II—Port Damage Assessment Long-Term Report
3.1.7 Cargo Handling Equipment
The Port of Corinto has the only container gantry on the West Coast of Central America. In use are also
two mobile cranes, three hoppers, and four clamshells. The Port operates 2 front loaders, 8
hustlers/tractors, and 14 trailers. The port currently has a 350 metric ton capacity barge, two tugboats, and
a pilot boat. The port is in the process of adding another tugboat to its fleet as well as cargo handling
equipment. Located approximately 100 m outside of the port complex is a truck weighing scale with a 50
metric ton capacity. The port additionally has numerous freight elevators, forklifts, and a conveyor system
for loading boxed goods.
The port’s Container Terminal has a Liebher rail mounted dockside crane with a 40 metric ton capacity
under the spreader, a 45 metric ton capacity under the cargo beam, and a 30.5 meter (100 foot) outreach.
The crane averages approximately 20 moves per hour when it is working properly. Currently, the industry
requires that dockside cranes work at a minimum rate of 30-40 moves per hour. It is obvious that the more
efficient a container handling operation is, the more cost effective it will be.
At 20 moves an hour, working 12 hours a day and 300 days a year, the crane has a capacity of 72,000
moves a year. Using the 1999 Port of Corinto container throughput data, the port has a ratio of 1.37 for
container moves versus TEUs. This results in the crane having a capacity of 98,640 TEUs a year. This
crane throughput capacity is more than required for the current terminal capacity. However, a major
problem exists since only one dockside crane is available. Like any equipment, the crane must have its
preventive maintenance program effectively implemented. This requires the removal of the crane from
operation in order to service it. In this case another crane must be available. Whether it is another rail
mounted dockside crane, mobile harbor crane, or a stick crane, it must be available to provide service that
is required by the port’s container shipping industry.
Page 34
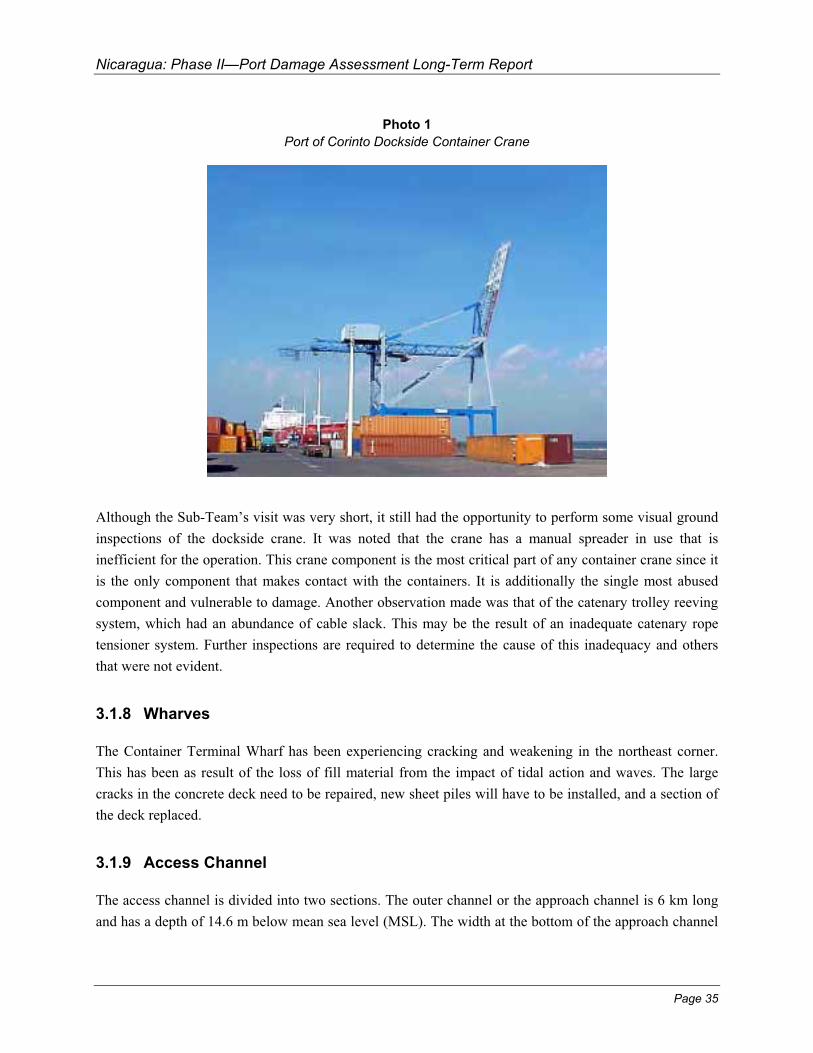
Nicaragua: Phase II—Port Damage Assessment Long-Term Report
Photo 1
Port of Corinto Dockside Container Crane
Although the Sub-Team’s visit was very short, it still had the opportunity to perform some visual ground
inspections of the dockside crane. It was noted that the crane has a manual spreader in use that is
inefficient for the operation. This crane component is the most critical part of any container crane since it
is the only component that makes contact with the containers. It is additionally the single most abused
component and vulnerable to damage. Another observation made was that of the catenary trolley reeving
system, which had an abundance of cable slack. This may be the result of an inadequate catenary rope
tensioner system. Further inspections are required to determine the cause of this inadequacy and others
that were not evident.
3.1.8 Wharves
The Container Terminal Wharf has been experiencing cracking and weakening in the northeast corner.
This has been as result of the loss of fill material from the impact of tidal action and waves. The large
cracks in the concrete deck need to be repaired, new sheet piles will have to be installed, and a section of
the deck replaced.
3.1.9 Access Channel
The access channel is divided into two sections. The outer channel or the approach channel is 6 km long
and has a depth of 14.6 m below mean sea level (MSL). The width at the bottom of the approach channel
Page 35
Nicaragua: Phase II—Port Damage Assessment Long-Term Report
is 150 m. The second section of the access channel is the inner channel. The inner channel is 3 km long
and has a depth of 13.35 m below MSL. The width at the bottom of the inner channel is 90 m. The access
channels were affected by littoral drift and the depth was somewhat reduced over the past several years,
but continued to be well marked and navigable. However, recent maintenance dredging has resolved the
reduced draft issues and restored the channels to their designed depths.
3.1.10 Turning Basin
The Port of Corinto has two turning basins located in front of the Container Terminal and in front of the
Liquid Bulk Terminal. The turning basin in front of the Container Terminal is 13.35 m deep and
105,000 m2. The turning basin in front of the Liquid Bulk Terminal is also 13.35 m deep and is 37,200 m
in area. The turning basins, as well as the wharf areas, were also affected by littoral drift since the last
maintenance dredging in 1993. However, like the main channels, they have been dredged and restored to
design depth.
3.1.11 Cargo Operations
The main issue that was noted with regard to operations is of cargo handling equipment availability. The
port operators and users use the EPN equipment as required to handle different cargo. The primary issue
noted with availability was the frequency of equipment breakdown and the long lead-time of repairs. The
second issue noted was lack of sufficient quantities of equipment to handle the cargo even if all the
equipment was properly working. From the data obtained and the site visit, it appears that the frequency
of breakdowns is due to equipment that has reached the end of its effective working life.
This equipment breakdown removes the cargo handling equipment from service, resulting in delays. Due
to the equipment’s age, some or all of this equipment may be due for replacement. Once the equipment
has reached this level of inefficiency, there is no other solution except replacement.
3.1.12 Navigational
Navigational access was analyzed and addressed in the Short-Term Action Report, April 2000 Waterside
Infrastructure Navigational Aids Section.
3.2 Conclusions and Recommendations
In analyzing the available data collected by the Landside Sub-Team and onsite inspections, in this section
the Sub-Team is recommending what may be required by the port to maximize its operational efficiency
and throughput capacity. The analysis included current data obtained and that from port development
Page 36
2

Nicaragua: Phase II—Port Damage Assessment Long-Term Report
plans and trade forecasts. It is important to bear in mind that additional detail studies and determinations
may be required before rendering a final recommendation as to which development has highest priority
for the port.
3.2.1 Facilities Buildings and Utilities
Like any other port that has been in operation for over 30 years, the utilities and infrastructure are in a
state of degradation and are outdated. This is primarily due to the fact that the building codes of 30 years
ago did not have the higher standards of construction and life safety currently required. In addition, new
technologies have developed; the implementation of these technologies and the training of personnel can
increase the efficiency of the operation.
The recommended Utilities Upgrade (Project No. 6) project cost in Table 19 is an estimate since the Sub-
Teams’ work plan did not provide for detail information to be analyzed for each utility and the new
technologies that the Port is currently using or may use. It is possible that additional funds are required;
however, this can only be determined by a more in-depth analysis of the utilities and technologies in
question.
Throughput Capacities
A terminal’s throughput capacity is mostly dependent on its efficiency, which depends on the operator. In
this case, EPN manages and operates the port’s different terminals. Although in numerous ports
throughout the world, the terminals are operated by the private sector, the ports must still encourage and
assist in maximizing the terminal’s efficiencies if new clients are expected to be part of the operation.
Table 14
Trade Projections By Type of Handling For The Port of Corinto (in Thousands of Metric Tons)
Cargo 2005 2010
General Cargo Low 180,737 169,724
High 600,664 616,638
Liquid Cargo Low
High
Dry Cargo Low 177,043 170,114
High 681,550 787,195
Low 196,494 289,886Unit Cargo (Containers)
High 615,350 856,387
Page 37
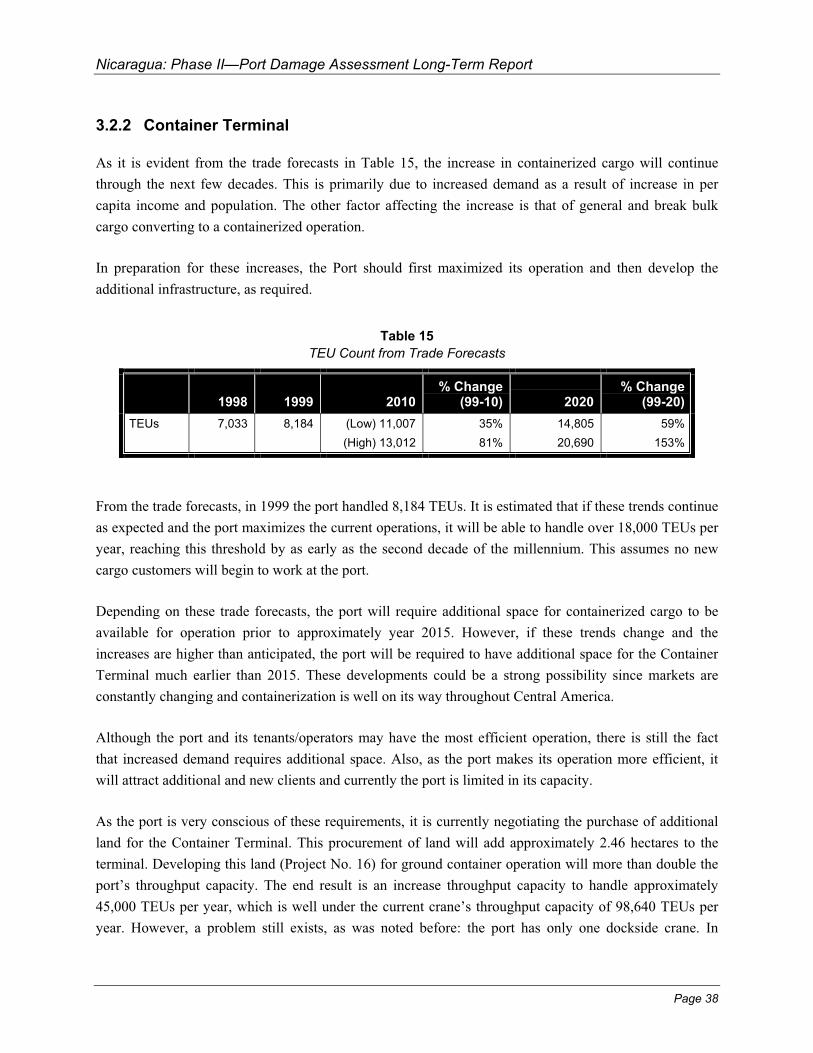
Nicaragua: Phase II—Port Damage Assessment Long-Term Report
3.2.2 Container Terminal
As it is evident from the trade forecasts in Table 15, the increase in containerized cargo will continue
through the next few decades. This is primarily due to increased demand as a result of increase in per
capita income and population. The other factor affecting the increase is that of general and break bulk
cargo converting to a containerized operation.
In preparation for these increases, the Port should first maximized its operation and then develop the
additional infrastructure, as required.
Table 15
TEU Count from Trade Forecasts
1998 1999 2010 % Change
(99-10) 2020 % Change
(99-20)
TEUs 7,033 8,184 (Low) 11,007
(High) 13,012
35%
81%
14,805
20,690
59%
153%
From the trade forecasts, in 1999 the port handled 8,184 TEUs. It is estimated that if these trends continue
as expected and the port maximizes the current operations, it will be able to handle over 18,000 TEUs per
year, reaching this threshold by as early as the second decade of the millennium. This assumes no new
cargo customers will begin to work at the port.
Depending on these trade forecasts, the port will require additional space for containerized cargo to be
available for operation prior to approximately year 2015. However, if these trends change and the
increases are higher than anticipated, the port will be required to have additional space for the Container
Terminal much earlier than 2015. These developments could be a strong possibility since markets are
constantly changing and containerization is well on its way throughout Central America.
Although the port and its tenants/operators may have the most efficient operation, there is still the fact
that increased demand requires additional space. Also, as the port makes its operation more efficient, it
will attract additional and new clients and currently the port is limited in its capacity.
As the port is very conscious of these requirements, it is currently negotiating the purchase of additional
land for the Container Terminal. This procurement of land will add approximately 2.46 hectares to the
terminal. Developing this land (Project No. 16) for ground container operation will more than double the
port’s throughput capacity. The end result is an increase throughput capacity to handle approximately
45,000 TEUs per year, which is well under the current crane’s throughput capacity of 98,640 TEUs per
year. However, a problem still exists, as was noted before: the port has only one dockside crane. In
Page 38

Nicaragua: Phase II—Port Damage Assessment Long-Term Report
addition to this new container yard development, additional container handling equipment (Project No.
21) must be available prior to the yard’s integration into the operation.
In converting to an efficient operation, it is certain that new clients will be attracted and also that more
containerized cargo will be handled instead of general and break bulk cargo. Additionally, if the
Nicaraguan trade forecasts and industry trends change and the increase in cargo throughput is higher than
anticipated, it will require the port to develop the infrastructure sooner than planned to handle the ever-
growing need of the shipping industry. For these reasons, the port’s proposed Wharf No. 5 (Project No.
19, 20, 22) should be carefully planned and developed for operation by the second decade of this
millennium since containerized cargo forecasts indicate that it can reach to over 20,690 TEUs without any
new clients.
Along with the Wharf No. 5 development, dockside cranes (Project No. 23) must be purchased to include
the yard equipment (Project No. 21) that could be the responsibility of the private sector. In addition, the
berth and channels may require dredging (Project No. 19) to accommodate the expect vessels. As the port
prepares for the development of Wharf No. 5, a feasibility study should be initiated to analyze the market,
vessels to call on the port, and operational requirements. If dredging (Project No. 19) is required, this
material can be of use to fill the shoreline areas behind the new bulkhead as part of land reclamation
efforts. Additionally, this study could determine if additional dredged material could be more cost
effective than trucking fill material from an offsite quarry to fill the new Wharf No. 5 container yard.
It is worth noting that if the top loader operation is replaced with straddle carriers or RTGs, the
throughput capacity will be greatly increased. In addition, land requirement and use will be reduced,
making immediate space for additional and new shipping services.
With the industry’s increased use of refrigerated containers, the port should consider investing in
designing and constructing (Project No. 12) a separate refrigerated container yard, although it currently
has one. The industry currently uses several different systems. Most of these systems use electrical outlet
clusters varying in quantities from four to a dozen that are located approximately one meter above
ground. The other less frequent method places the outlets below ground protected by a grate cover. This
method is less preferred since accessibility is usually a problem. Another problem that can occur is that if
the pit is not properly drained, water can accumulate in it and can cause serious electrical problems. There
are also two different types of yard arrangement: chassis and grounded containers. It is recommended that
the grounded container yard with above ground outlets be given consideration.
Page 39
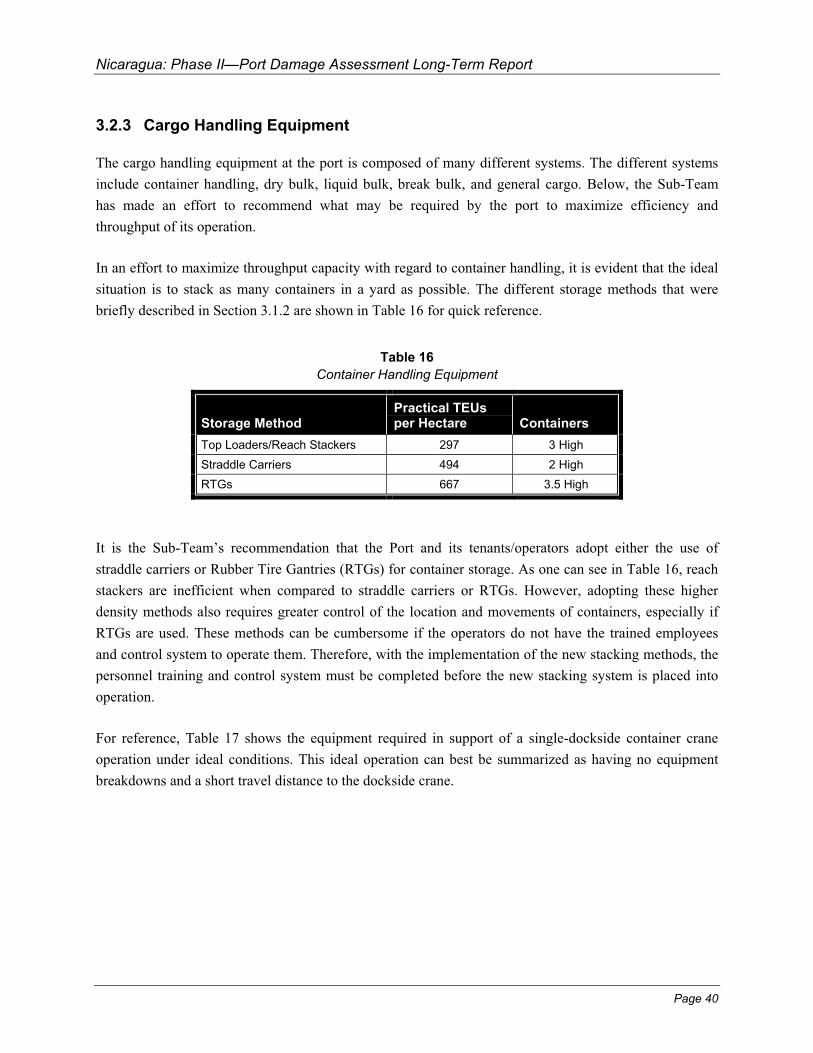
Nicaragua: Phase II—Port Damage Assessment Long-Term Report
3.2.3 Cargo Handling Equipment
The cargo handling equipment at the port is composed of many different systems. The different systems
include container handling, dry bulk, liquid bulk, break bulk, and general cargo. Below, the Sub-Team
has made an effort to recommend what may be required by the port to maximize efficiency and
throughput of its operation.
In an effort to maximize throughput capacity with regard to container handling, it is evident that the ideal
situation is to stack as many containers in a yard as possible. The different storage methods that were
briefly described in Section 3.1.2 are shown in Table 16 for quick reference.
Table 16
Container Handling Equipment
Storage Method Practical TEUs per Hectare Containers
Top Loaders/Reach Stackers 297 3 High
Straddle Carriers 494 2 High
RTGs 667 3.5 High
It is the Sub-Team’s recommendation that the Port and its tenants/operators adopt either the use of
straddle carriers or Rubber Tire Gantries (RTGs) for container storage. As one can see in Table 16, reach
stackers are inefficient when compared to straddle carriers or RTGs. However, adopting these higher
density methods also requires greater control of the location and movements of containers, especially if
RTGs are used. These methods can be cumbersome if the operators do not have the trained employees
and control system to operate them. Therefore, with the implementation of the new stacking methods, the
personnel training and control system must be completed before the new stacking system is placed into
operation.
For reference, Table 17 shows the equipment required in support of a single-dockside container crane
operation under ideal conditions. This ideal operation can best be summarized as having no equipment
breakdowns and a short travel distance to the dockside crane.
Page 40
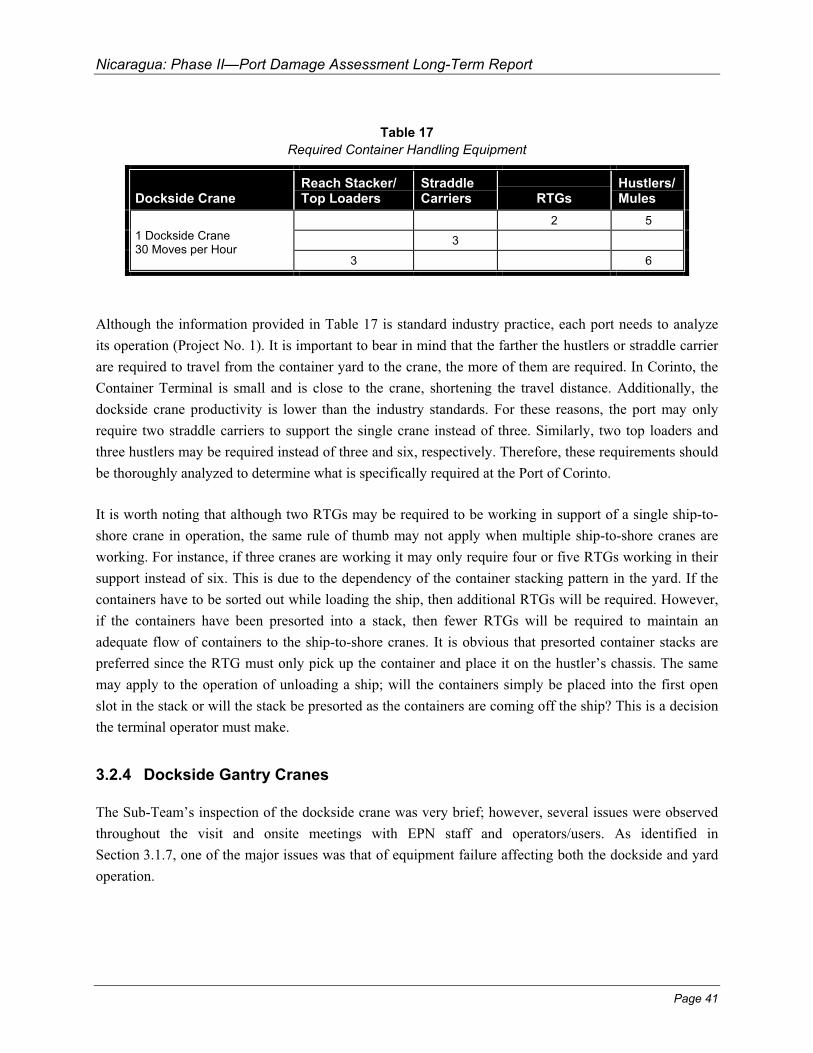
Nicaragua: Phase II—Port Damage Assessment Long-Term Report
Table 17
Required Container Handling Equipment
Dockside Crane Reach Stacker/ Top Loaders
Straddle Carriers RTGs
Hustlers/ Mules
2
31 Dockside Crane 30 Moves per Hour
3
5
6
Although the information provided in Table 17 is standard industry practice, each port needs to analyze
its operation (Project No. 1). It is important to bear in mind that the farther the hustlers or straddle carrier
are required to travel from the container yard to the crane, the more of them are required. In Corinto, the
Container Terminal is small and is close to the crane, shortening the travel distance. Additionally, the
dockside crane productivity is lower than the industry standards. For these reasons, the port may only
require two straddle carriers to support the single crane instead of three. Similarly, two top loaders and
three hustlers may be required instead of three and six, respectively. Therefore, these requirements should
be thoroughly analyzed to determine what is specifically required at the Port of Corinto.
It is worth noting that although two RTGs may be required to be working in support of a single ship-to-
shore crane in operation, the same rule of thumb may not apply when multiple ship-to-shore cranes are
working. For instance, if three cranes are working it may only require four or five RTGs working in their
support instead of six. This is due to the dependency of the container stacking pattern in the yard. If the
containers have to be sorted out while loading the ship, then additional RTGs will be required. However,
if the containers have been presorted into a stack, then fewer RTGs will be required to maintain an
adequate flow of containers to the ship-to-shore cranes. It is obvious that presorted container stacks are
preferred since the RTG must only pick up the container and place it on the hustler’s chassis. The same
may apply to the operation of unloading a ship; will the containers simply be placed into the first open
slot in the stack or will the stack be presorted as the containers are coming off the ship? This is a decision
the terminal operator must make.
3.2.4 Dockside Gantry Cranes
The Sub-Team’s inspection of the dockside crane was very brief; however, several issues were observed
throughout the visit and onsite meetings with EPN staff and operators/users. As identified in
Section 3.1.7, one of the major issues was that of equipment failure affecting both the dockside and yard
operation.
Page 41
Nicaragua: Phase II—Port Damage Assessment Long-Term Report
For these reasons it is recommended that the port operator establish a preventive maintenance schedule as
recommended by the equipment manufacturer. This program, developed through the Optimization Plan
(Project No. 1), should be established and followed with no deviation.
In addition to a new preventive maintenance program, most of the container handling equipment requires
upgrades and extensive repairs. For instance, the dockside crane has an outdated and inefficient drive
system that requires complete upgrading, which the Sub-Team would recommend. Additionally, the
hoisting systems as well as the structure may require upgrades. Other components, such as the existing
dockside crane’s spreader, should be replaced with a new 40 MT 20/40 telescopic spreader (Project No.
4). All of these upgrades of the dockside crane drives, hoist systems, and structural enhancements (Project
No. 15) should be implemented as soon as possible. It is additionally recommended that a thorough crane
inspection (Project No. 8) be performed to determine the total extent of the upgrades and repairs prior to
any single upgrade or enhancement.
Although the existing dockside crane has the capacity to handle 98,640 TEUs per year, a second crane
must be available as a backup. The additional crane could be another rail mounted dockside crane (Project
No. 23), mobile harbor crane, or stick crane. The second crane must be available to provide service to the
port’s container shipping industry in case the existing cranes break down and during periods of preventive
maintenance.
As to the long term plan for development of an additional dockside crane wharf, it is recommended that
two dockside cranes (Project No. 23) be purchased. These could be either rail mounted or mobile harbor
cranes. It is recommended that these new cranes should be able to work a vessel that stacks 13 containers
across its deck. The crane should be rated to lift 61 LT under a twin lift telescopic spreader, 40 LT single
lift under spreader, and 85 LT under the cargo beam. In purchasing new cranes or drives, the port should
consider the advantage of AC drives over DC drives for some or all of the crane systems. It is additionally
recommended that the crane be oversized in both outreach and capacity at the time of purchase rather than
after it has been delivered. The cost for oversizing during procurement is minimal compared to that of
oversizing after delivery. This is due to the need to remove the crane from service and possibly remove it
from the wharf to perform all the work, not to mention the operational impact that the removal may have
on the port.
3.2.5 Conveyor Systems
The four-belt conveyor system located at the Terminal has a loading capacity of 18,000 boxes per hour. It
can be used to load bananas, meats, and other boxed export products; however, it is not widely used due
to the restriction in draft at the berth.
Page 42

Nicaragua: Phase II—Port Damage Assessment Long-Term Report
Although the Sub-Team did not inspect the conveyor system, the Sub-Team anticipates that it will require
upgrades and repairs to be reintegrated into an efficient operation. It is also recommended that the system
be re-analyzed and inspected for possible upgrades with regards to more efficient control systems. For
these reasons, it is recommended that a study (Project No. 9) be performed of this operation and its
systems. The study may recommend that the current conveyor system should be upgraded or simply
demolished and a new bulk handling operation constructed.
3.2.6 Bulk and Break Bulk Operations
One of the greater advances in cargo handling has been in the area of dry bulk handling. The operation
has gone from a labor-intensive operation to an automated one. The industry standard no longer uses dock
workers to unload the numerous sacks of grain cargo from trucks onto stacks to later be loaded onto ships
in cargo nets. Currently, the industry uses pneumatic suckers and mechanical conveyors to move the bulk
cargo from trucks to the ships or from the warehouse or silos to the ship.
As the existing conditions at the Port of Corinto require that sacks be open at the port for loading onto the
ship, an immediate study and analysis (Project No. 9) of the operation is warranted. Based on the
improved productivity and cost effectiveness, the Sub-Team recommends that the port consider changing
the process. The port and the commercial raw sugar transporters need to consider the use of an operation
that uses bulk granulated sugar trailers for transportation and the automated handling equipment at the
facilities required to support this operation. Although this will require capital investments, it will result in
efficiency and cost savings in the operation that will lead to a quick recovery of the funds invested.
Photo 2
Bulk Granulated Raw Sugar Trailer
Page 43
Nicaragua: Phase II—Port Damage Assessment Long-Term Report
3.2.7 Transit Sheds/Warehouses
Even though the port has numerous warehouses, it needs to evaluate the operation for which they are
used. Ports that have transition from break-bulk cargo and general cargo to containerized cargo find
themselves with warehouses that are no longer in used, such as in the Port of Miami and New Orleans.
Their usefulness in the current industry requirements has been overcome with the introduction of the
container. Most of the ports are demolishing these warehousing operations and redeveloping the areas
into container yards. In some cases, the warehouses are partially converted into cruise ship passenger
terminals.
The port should examine the function of the warehouse in its current and future operation to be able to
make a decision to demolish or convert the warehouse for another operation. For these reasons, the Sub-
Team recommends the evaluation of the warehouse operation in a detail study of bulk and break bulk
cargo, and its impact on the port operation. The warehouse or the area can be developed for bulk storage
and its material handling equipment, such as conveyer systems, loading/unloading bulk granulated raw
sugar trailer facilities, and vessel bulk cargo loaders/unloaders. Silo bulk storage areas can additionally be
developed in conjunction with the private sugar industry to improve the efficiency of ship loading.
Developing these on-port storage facilities frees the operation from dependence on the dry bulk delivery
operation to the port. That is, if trucks are delayed from arriving at the port to deliver their cargo to the
ship, the loading of the ship will not be delayed. By having the goods stored at the port, the ship can be
immediately loaded and underway without any delays.
3.2.8 Cargo Operations
In its review and analysis of the available data, the Sub-Team has concluded that the port’s operations
aspects are heavily affecting its efficiency. These inefficiencies are the lack of proper equipment to handle
the cargo, constant equipment breakdown, and delays in access through the city. All of these issues
increase the cost of all areas of cargo handling, from the ship to the consumer. Eventually, the end result
is a higher cost of goods on the consumers’ store shelves. Thus, fewer consumers can afford to purchase
these goods. Raising to the cost even higher is the fact that fewer quantities will be purchased by the
stores because of lower consumer demand.
3.2.9 Wharves
The port’s wharves are of an open-deck type constructed of reinforced concrete deck supported by
concrete piles. This type of structure requires very little maintenance over the years. However, as the
concrete structure ages, cracks can develop and the steel reinforcing bars can become exposed due to
spalling. If these damages develop under the deck, it becomes very difficult to properly repair them.
Page 44

Nicaragua: Phase II—Port Damage Assessment Long-Term Report
Additionally, there is always the danger of overload conditions on the deck that can result in damage to
the deck. If the deck requires replacement, the replacement cost can be equal to or greater than the
original cost of constructing a new wharf.
For these reasons, we recommend that the port consider the use of steel sheet seawalls with tiebacks and a
concrete caps system. Of these systems, there are several different configurations can be considered:
single sheet wall; king piles with sheet wall; and a combination of round piles with intermittent sheet
piles, which are the more commonly used. In Figure 2, a drawing section is provided of the more
commonly used bulkhead structure design.
Since the port currently does not have the infrastructure to specifically handle Ro-Ro operations, it is
recommend that it analyze this market in its Cargo Studies (Project No. 9) and Master Plan (Project No.
2) to develop the required dock space. Although Ro-Ro operations are being reduced by most of the
carriers, there still exists a strong market that benefits from this method of operations since no cranes are
required to load or unload a vessel. Therefore, the port should consider the possibility of developing a Ro-
Ro ramp (Project No. 7) for this cargo handling method.
Figure 2
Round Pile and Sheet Wall Type Bulkhead
Page 45

Nicaragua: Phase II—Port Damage Assessment Long-Term Report
It is also recommended that if any of the wharves are to be reconstructed, consideration should be given
to the bulkhead system. Furthermore, the concrete deck and beams can be demolished in place and used
as sub-surface fill behind a newly installed bulkhead system. This method of replacement can be one of
the systems considered for the repair of the northeast end of the Container Terminal Wharf.
The crane stops in use at the dockside crane wharf are inadequate for the operation. Due to this, it is
recommended that a friction truck system be used instead of a fixed structure to stop the crane. The
friction system is designed to slow down the crane and eventually stop it, not to stop a crane instantly,
which would require a very large structure.
At the Liquid Bulk Wharf, the concrete trestle that supports the access walkways and pipelines connects
the pier to the storage terminals on land. The trestle is deteriorating and needs to be repaired within the
next few years. However, the Sub-Team recommends that the concrete trestle not be repaired; instead, the
concrete trestle (Project No. 17) may be relocated to the north to make space for the future Container
Terminal expansion. Relocating the trestle and piers would require that the work be performed only once.
The port would save the current cost of repairs; these savings could be used for a new and better designed
concrete trestle that can address the current and future needs of the Liquid Bulk Terminal.
3.2.10 Navigational Channels, Turning Basin and Berths
As it was noted in Section 3.1.4, the Banana Terminal Berth has been recently dredged to its design
specifications for current vessel requirements. If this terminal’s functionality within the port has been
determined (Project No. 9) to be an asset, and a cargo has been identified to be handled, then the port
should consider dredging this berth as soon as possible. Even if a cargo has not been specifically
identified, once the terminal is available, it can be used to attract new import and export shipping
companies.
With any new dredging project, the material to be dredged should be thoroughly analyzed for its
suitability in land reclamation. If the material is found suitable, it can be temporarily stockpiled along the
shoreline next to the existing Container Terminal, in front of the Monte Rosa Molasses tank site. Prior to
the placement of this material, it would be advisable to install the bulkhead for the new Wharf No. 5
being planned as the future expansion to the Container Terminal. Another area that can be used to dispose
of and stockpile the dredged material is behind the Banana pier, between it and the shoreline. The
development of both areas is further discussed in Section 3.2.12.
Page 46

Nicaragua: Phase II—Port Damage Assessment Long-Term Report
3.2.11 Shorelines
The world’s shorelines are its most exposed natural features and the front line to any seaborne storm.
They either protect the land or are eroded by the heavy pounding of waves produced by tropical storms
and hurricanes. For these reasons, the shorelines around any community or industrial installation must be
well built up and maintained to survive the onslaught of a storm.
The shoreline’s characteristics will dictate the type of built-up protection required. For example, a beach
is more difficult to protect than a rocky ocean front cliff, which requires no built-up protection. The beach
may have manmade rock jetties or breakwaters constructed that reduce the wave action that erodes the
sand and additionally constrain the shifting sands. On a shoreline composed of neither a beach nor a rock-
ledge front, a riprap or seawall must be constructed to protect the shore. If no ship berthing requirements
are imposed, the riprap is the most economical solution that should be considered. Typically, a filter
fabric material is laid out along the shoreline, from below MLW level to the top of the bank. On top of the
fabric, several layers of boulders are laid to secure the fabric in place and protect the shoreline from the
impact of waves and heavy floating objects.
3.2.12 Additional Considerations for Port Developments
As the Port of Corinto enters the new millennium, its future can be secured as one of the principal ports of
the Central America Pacific coast network. Although the original port was laid in a strip of land bordering
the city, it has valuable submerged lands that can be developed into a modern port. With the acquisition of
additional lands and the construction of a new Gantry Wharf, this future can further be secured.
The port can reclaim the submerged lands that are adjacent to the Container Terminal in front of the
Monte Rosa Molasses tank site (Project No. 18, 19). This area can be developed into additional container
yards or as required by future operations. It is estimated that this area can yield approximately 3.7
hectares. It is therefore recommended that this development be given serious consideration in the next
master plan.
Another area in which the port can be reclaimed (Project No. 24) from the sea is that of the shallows
between the Banana Pier Wharf No. 1 and the shoreline in front of the Buoy Maintenance Facility. It is
possible to fill this area and convert it into support operations and handling of other cargo products. It will
also be possible to relocate port facility support operations to this reclaimed area, thus freeing internal
areas within the existing port for other uses.
The port currently requires additional material resources and funds for its capital developments. In
addition, the port, in order to keep abreast of new technology and management techniques, should seek
Page 47
Nicaragua: Phase II—Port Damage Assessment Long-Term Report
specialized training to manage these resources and allow it the port to be competitive in the region and the
world marketplace.
For the above noted reasons, it is recommended that the EPN develop an employee training section. This
section would require several employees to coordinate, schedule, and train personnel as required. This
section’s manager should be an individual who has many years in the profession, preferably within the
maritime or transportation industry. Additional recommendation are explained in Section 6, Training.
It is worth noting that one of the practices used to secure the revenues to develop additional
infrastructures is to enter into long term agreements with the port users. For example, a port can enter into
a 10-year Container Terminal agreement with a stevedoring/shipping line, thus securing revenues for
capital developments. These revenues would come from the fees collected from dockage, wharfage, crane
use, gate fees, lease lands, and possibly utilities and facility maintenance services.
Although these recommendations have been thoroughly analyzed, they only provide a preliminary phase
for the Master Development Program. The port is encouraged to initiate additional surveys and studies
similar to those recently completed, such as the Evaluation of Container Operations and Technical-
Economic and Financial Evaluation for Concession. Both reports address capital developments in a
concise manner that can be used as a guideline for the completion of the Master Development and
Business Plan (Project No. 2). Although they recommend certain developments, their perspective has
been detailed and produced for a different purpose. Therefore, to better identify the port’s weaknesses and
needs as a whole, the port should initiate detailed analysis and studies to produce a document that will
serve as the basis for the port’s development. Such studies and plans are: Optimization Plan, Master Plan,
Business Plan, Bulk, Brake Bulk and General Cargo, Crane Condition, and Feasibility Study for Land
Reclamation (Project No. 18). Issues such as trade barriers, port modernization, and operational efficiency
need to be part of the noted reports.
The Sub-Team strongly encourages the port to implement the operational enhancements prior to the
capital developments. These enhancements should start with training (Project No. 29) of all levels of the
labor force and management to optimize the overall operation of the port. (The training recommendations
are further discussed in Section 6.2.) Along with the training, it is recommended that the port implement
the Optimization Plan (Project No. 1), which will analyze the necessary changes to maximize its
operation. Through these enhancements, the port can better realistically measure and determine which
capital developments are most required. Implementing these developments alone will not transform the
port into an efficient and profitable industry. This requires the understanding and efficiency of all levels
of the labor force, its management, and the operation. In Table 18, the recommended capital projects are
identified and a cost estimate is provided. In Figure 5, a layout of the port is provided identifying the
location of each individual project with the exception of the access road improvements.
Page 48

Nicaragua: Phase II—Port Damage Assessment Long-Term Report
In conclusion, it can be stipulated that with the current growth estimates reflected in this report, the port
can prepare itself to accommodate the requirements of the industry. However, this growth rate is
dependent solely on the current port users. If the port is to attract new business to use its facilities, it must
insure the new businesses that it will be able to fulfill their operational needs. These needs may require
the port to invest in capital development prior to bringing in the new business or in conjunction as part of
a user agreement.2 The latter is obviously preferred, since the funds for operation and investment in
capital development will be secured and available through the new user’s revenues. (See Table 18.)
Page 49

Nicaragua: Phase II—Port Damage Assessment Long-Term Report
Page 50
Figure 3
Capital Projects Location
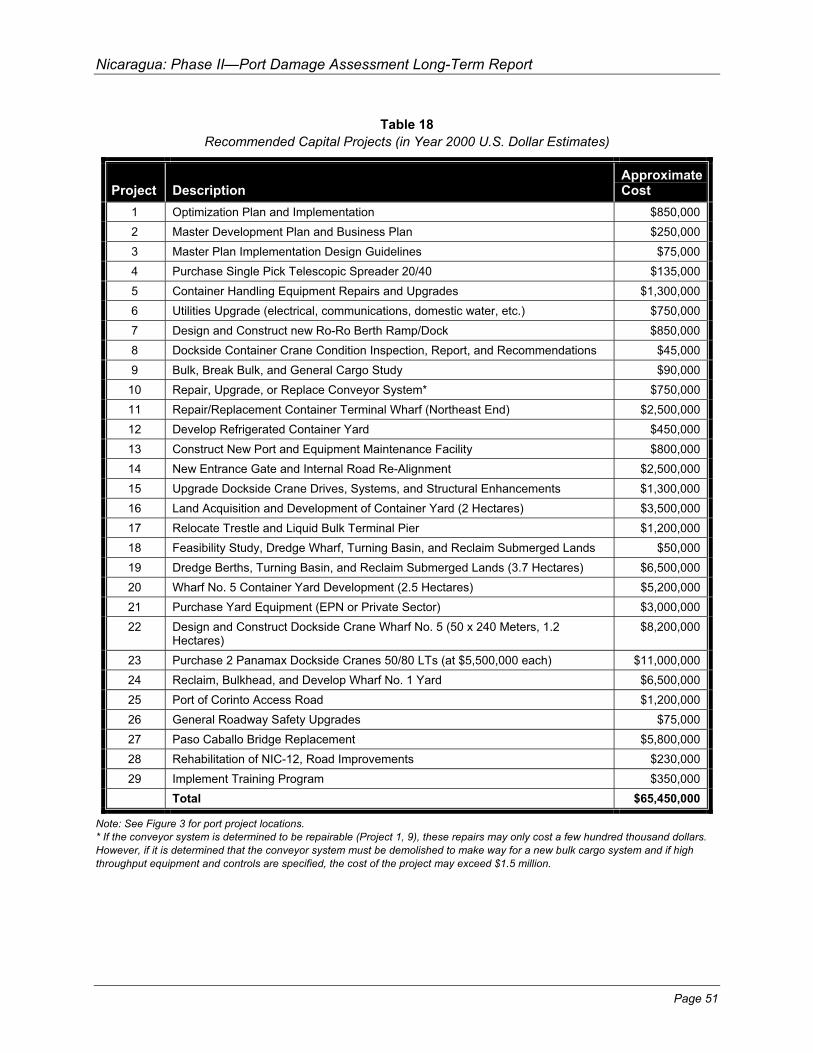
Nicaragua: Phase II—Port Damage Assessment Long-Term Report
Table 18
Recommended Capital Projects (in Year 2000 U.S. Dollar Estimates)
Project Description Approximate Cost
1 Optimization Plan and Implementation $850,000
2 Master Development Plan and Business Plan $250,000
3 Master Plan Implementation Design Guidelines $75,000
4 Purchase Single Pick Telescopic Spreader 20/40 $135,000
5 Container Handling Equipment Repairs and Upgrades $1,300,000
6 Utilities Upgrade (electrical, communications, domestic water, etc.) $750,000
7 Design and Construct new Ro-Ro Berth Ramp/Dock $850,000
8 Dockside Container Crane Condition Inspection, Report, and Recommendations $45,000
9 Bulk, Break Bulk, and General Cargo Study $90,000
10 Repair, Upgrade, or Replace Conveyor System* $750,000
11 Repair/Replacement Container Terminal Wharf (Northeast End) $2,500,000
12 Develop Refrigerated Container Yard $450,000
13 Construct New Port and Equipment Maintenance Facility $800,000
14 New Entrance Gate and Internal Road Re-Alignment $2,500,000
15 Upgrade Dockside Crane Drives, Systems, and Structural Enhancements $1,300,000
16 Land Acquisition and Development of Container Yard (2 Hectares) $3,500,000
17 Relocate Trestle and Liquid Bulk Terminal Pier $1,200,000
18 Feasibility Study, Dredge Wharf, Turning Basin, and Reclaim Submerged Lands $50,000
19 Dredge Berths, Turning Basin, and Reclaim Submerged Lands (3.7 Hectares) $6,500,000
20 Wharf No. 5 Container Yard Development (2.5 Hectares) $5,200,000
21 Purchase Yard Equipment (EPN or Private Sector) $3,000,000
22 Design and Construct Dockside Crane Wharf No. 5 (50 x 240 Meters, 1.2 Hectares)
$8,200,000
23 Purchase 2 Panamax Dockside Cranes 50/80 LTs (at $5,500,000 each) $11,000,000
24 Reclaim, Bulkhead, and Develop Wharf No. 1 Yard $6,500,000
25 Port of Corinto Access Road $1,200,000
26 General Roadway Safety Upgrades $75,000
27 Paso Caballo Bridge Replacement $5,800,000
28 Rehabilitation of NIC-12, Road Improvements $230,000
29 Implement Training Program $350,000
Total $65,450,000
Note: See Figure 3 for port project locations.
* If the conveyor system is determined to be repairable (Project 1, 9), these repairs may only cost a few hundred thousand dollars.
However, if it is determined that the conveyor system must be demolished to make way for a new bulk cargo system and if high
throughput equipment and controls are specified, the cost of the project may exceed $1.5 million.
Page 51
Nicaragua: Phase II—Port Damage Assessment Long-Term Report
Section 4—Port Access Roads, Port of Corinto
4.0 Introduction
This part of the report is predicated upon the road access requirements due to cargo throughput (see
Section 3) and linked to the port access analysis presented in the Short-Term Action Report. The section
provides a background and analysis of the existing conditions, and recommendations and conclusions for
the Port Road Access.
All the onsite inspection information gathered, which was previously documented in Phase I, was
analyzed and processed by the Sub-Team. Based on the results of these analyses, the Landside and Road
Access Sub-Teams were able to put forth their recommendations on capital developments, upgrades, and
repairs.
4.1 Background and Analysis
Initially, the Road Team concentrated on the damage to the main roads and bridges leading to the Port of
Corinto, Nicaragua. Since the Port of Corinto is the principal international Nicaraguan port, the Team
decided to evaluate the immediate port access roads. The Sub-Team returned to the area in August 2000
and conducted an in-depth evaluation of the deficiencies on the principal access roads leading to the port.
As has been found through the years, port access is the single most important component of the port
operation since it can directly limit the port’s throughput capacity. This component is even more critical
to the Port of Corinto since historically Corinto is not a trans-shipment port. Its operation depends on the
cargo that it exports and imports to Central America and the hemisphere.
In terms of the overall land transportation network, the Port of Corinto has direct road access. The rail
access has been mostly abandoned. Regarding the road network, the disadvantage the port faces is that all
the access routes must traverse the City of Corinto. This causes intense congestion, slowing down truck
traffic and adding to delivery time and fuel cost.
It is obvious that the preferred method of port access is a direct link to the national road network. This
access method eliminates any stops at intersections or the need for pedestrians crossings that delay the
delivery of goods. In segregating the port traffic, it further eliminates the danger of traffic accidents with
local traffic, including private vehicles, and injuries to pedestrians.
Page 52

Nicaragua: Phase II—Port Damage Assessment Long-Term Report
4.1.1 Access Roads and Highway
The paved highway system in Nicaragua connects the Port of Corinto to the majority of the country’s
population and agricultural centers, including Managua, León, Granada, and La Paz. The port access road
connects to the Pan American Highway at the town of Chinandega, approximately 20 kilometers from the
port. The Pan American Highway connects Nicaragua to the neighboring countries of El Salvador and
Costa Rica and beyond. From the Port of Corinto to the Honduran border to the north is a distance of
approximately 60 kilometers. The Port of Corinto is also connected by 576 kilometers of highway to
Puerto Cortés on the Atlantic Coast of Honduras.
The road from the Pan American highway to the port traverses through open country until it reaches the
Paso Caballos straits next to Corinto Beach. At this point, the road crosses via the bridge and into the
peninsula that incorporates the City of Corinto and the port. From this point on the road traverses
numerous neighborhoods and commercial areas. Along this route the city traffic and pedestrians intermix
with the truck traffic accessing the port. As is evident, this intermixing creates numerous safety issues in
addition to the environmental issues of unpaved roads. These issues will be addressed later in this section
of the report.
4.1.2 Port Entrance/Gates
The port’s gate access is directly adjacent to the city streets of Corinto. These gates have little or no
stacking capacity available for truck processing traffic. When there is a need, the trucks and trailers stack
in the city streets, congesting the commercial and private traffic flows. Compounding the inefficiency is
the fact that all port cargo has to travel through the city access the main roads to the cargo’s destination
and the same applies for the cargo being transported into the port.
The port has eight separate entrance and exit gates throughout its perimeter with Corinto. Gates No. 5 and
7 are primarily used for the cargo traffic. Gate No. 4 is used as the port’s main administrative entrance for
the employees and other port personnel. The other gates are used less frequently and in some cases they
have already been closed permanently. This is of great importance to security since the fewer the number
of gates used, the more efficiently the port access can be secured. Additionally, at Gate No. 4 is the
entrance to the National Port Authority (Empresa Portuaria Nacional) administration building and parking
area.
4.1.3 Rail
The Port of Corinto is connected directly by rail to the municipality of Chinandega. The railroad then
connects to León, where it branches into the central part of the country and the towns of El Sauce and Rio
Grande or southeast to the capital of Managua and on to Masaya, Granada, Jinotepe, and Diviamba. The
Page 53

Nicaragua: Phase II—Port Damage Assessment Long-Term Report
León-to-Corinto section has been out of service since 1982, when floods damaged the tracks. The
government has plans to contract a new standard gauge line from Corinto through Managua to San Juan
del Norte on the Caribbean, but lack of funding has delayed construction. However, since Hurricane
Mitch, the rail transportation of goods has been discontinued due to the hurricane’s impact on the
infrastructure.
4.2 Recommendation
As was described in Sections 4.1 and 4.2, it is for these reasons that the Sub-Team recommends a
realignment of the entrance road (Project No. 14 [see Table 18]) to access the national highway system
more directly (see Port Capital Improvements, Section 3). The following is the analysis and detailed
recommendations by the Sub-Team concerning port access, city roads, port access gates, and a general
recommendation on safety.
4.2.1 Access Roads and Highways
A field visit was conducted to review and discuss three alternatives for re-routing the truck traffic that
serves the Port of Corinto. As was noted, the existing access road to the port is by using the city’s main
roads that traverse through numerous residential and commercial areas.
In discussions, the City and Port of Corinto representatives proposed two different alternatives. These
alternatives recommend that truck traffic be relocated from the main city road to either of two different
local streets (see Photo 3), which are about 200 meters apart. Both alternatives will be connected to a new
road to be built on an existing abandoned railroad track right-of-way (see Photo 4). The team considers
these two alternatives to be a short-term solution to improve current conditions and allow for the
permanent solution to be implemented.
Page 54
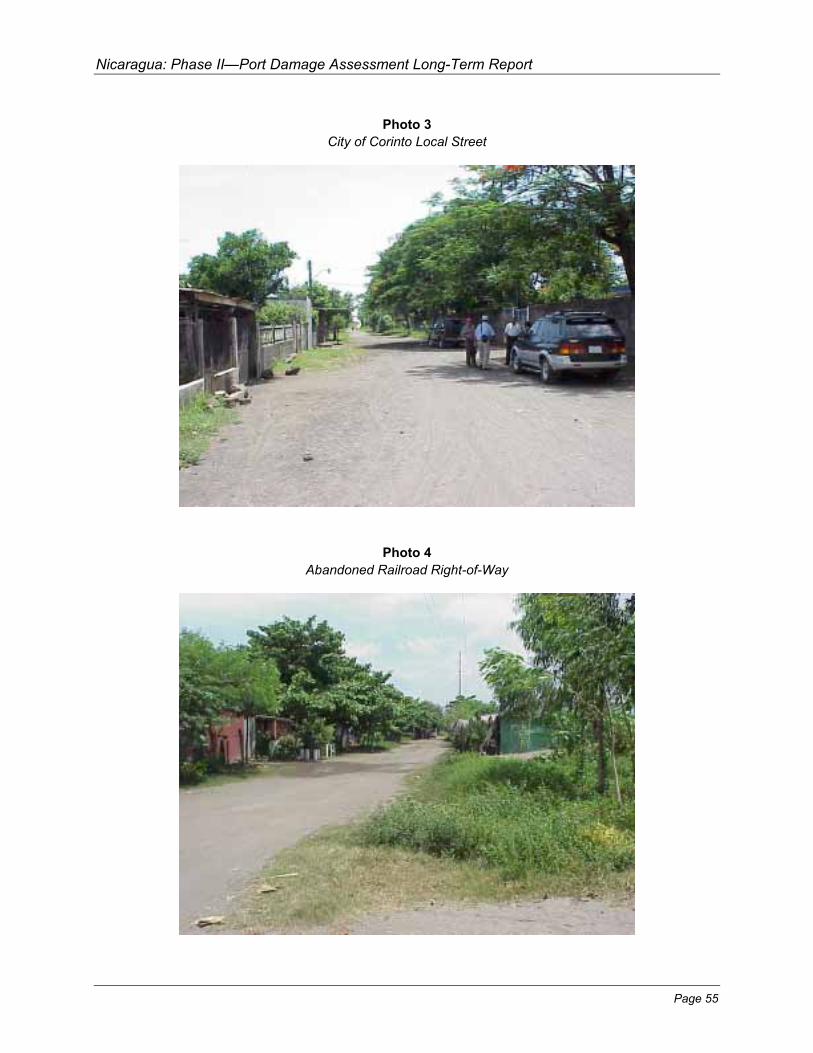
Nicaragua: Phase II—Port Damage Assessment Long-Term Report
Photo 3
City of Corinto Local Street
Photo 4
Abandoned Railroad Right-of-Way
Page 55
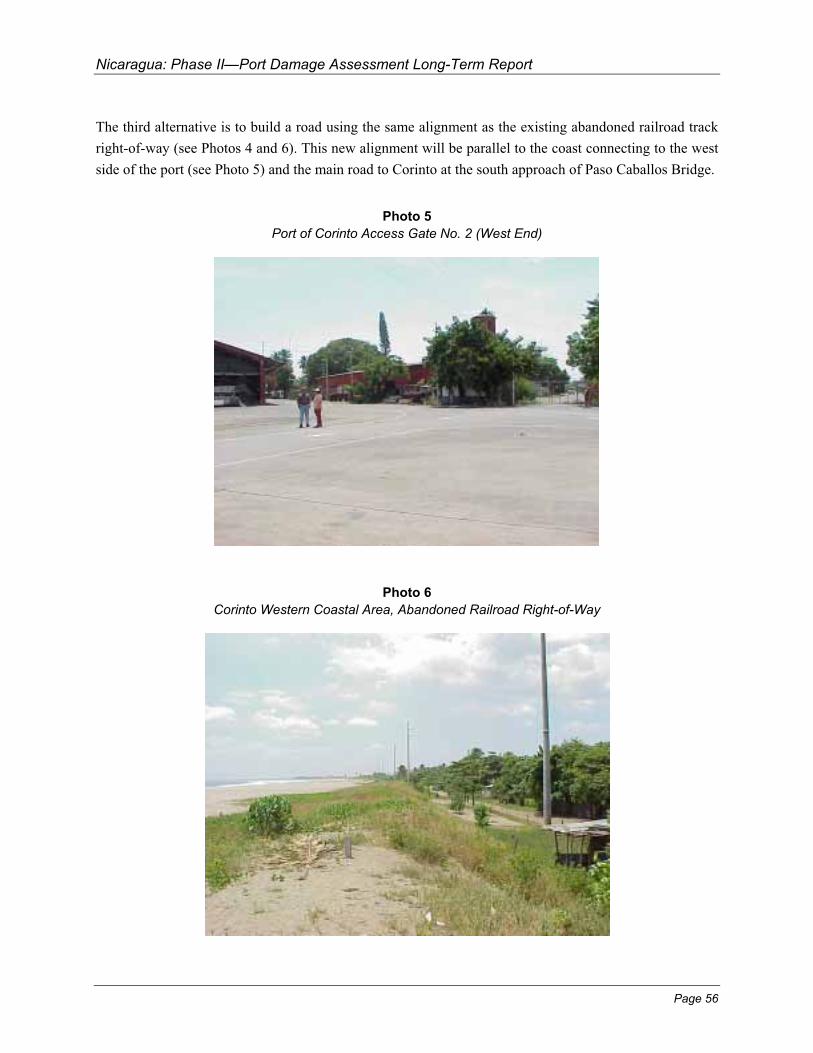
Nicaragua: Phase II—Port Damage Assessment Long-Term Report
The third alternative is to build a road using the same alignment as the existing abandoned railroad track
right-of-way (see Photos 4 and 6). This new alignment will be parallel to the coast connecting to the west
side of the port (see Photo 5) and the main road to Corinto at the south approach of Paso Caballos Bridge.
Photo 5
Port of Corinto Access Gate No. 2 (West End)
Photo 6
Corinto Western Coastal Area, Abandoned Railroad Right-of-Way
Page 56
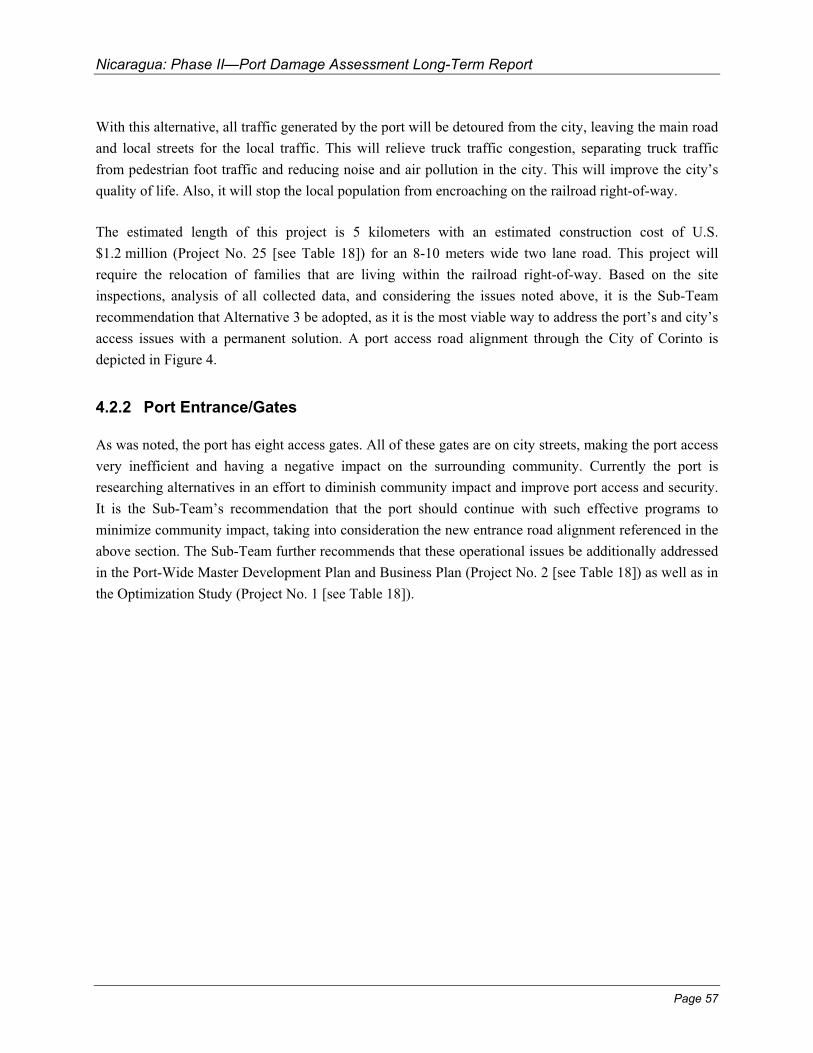
Nicaragua: Phase II—Port Damage Assessment Long-Term Report
With this alternative, all traffic generated by the port will be detoured from the city, leaving the main road
and local streets for the local traffic. This will relieve truck traffic congestion, separating truck traffic
from pedestrian foot traffic and reducing noise and air pollution in the city. This will improve the city’s
quality of life. Also, it will stop the local population from encroaching on the railroad right-of-way.
The estimated length of this project is 5 kilometers with an estimated construction cost of U.S.
$1.2 million (Project No. 25 [see Table 18]) for an 8-10 meters wide two lane road. This project will
require the relocation of families that are living within the railroad right-of-way. Based on the site
inspections, analysis of all collected data, and considering the issues noted above, it is the Sub-Team
recommendation that Alternative 3 be adopted, as it is the most viable way to address the port’s and city’s
access issues with a permanent solution. A port access road alignment through the City of Corinto is
depicted in Figure 4.
4.2.2 Port Entrance/Gates
As was noted, the port has eight access gates. All of these gates are on city streets, making the port access
very inefficient and having a negative impact on the surrounding community. Currently the port is
researching alternatives in an effort to diminish community impact and improve port access and security.
It is the Sub-Team’s recommendation that the port should continue with such effective programs to
minimize community impact, taking into consideration the new entrance road alignment referenced in the
above section. The Sub-Team further recommends that these operational issues be additionally addressed
in the Port-Wide Master Development Plan and Business Plan (Project No. 2 [see Table 18]) as well as in
the Optimization Study (Project No. 1 [see Table 18]).
Page 57

Nicaragua: Phase II—Port Damage Assessment Long-Term Report
Figure 4
Port Access Road Alignments
Page 58
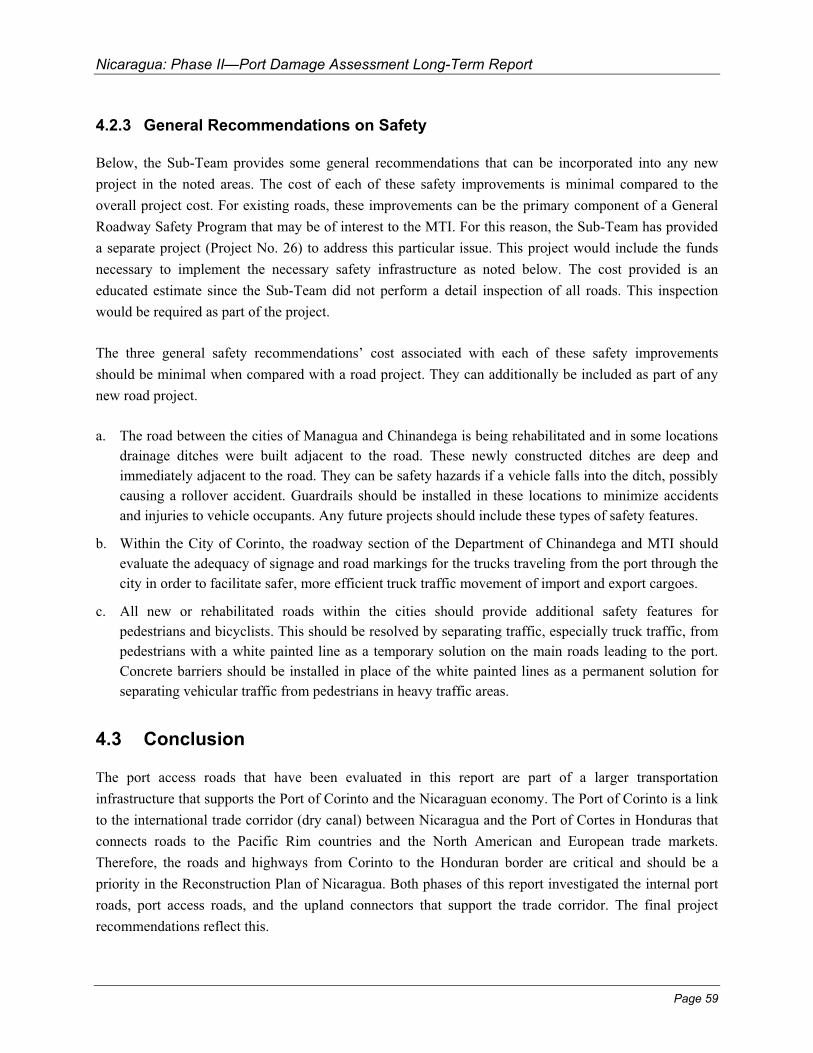
Nicaragua: Phase II—Port Damage Assessment Long-Term Report
4.2.3 General Recommendations on Safety
Below, the Sub-Team provides some general recommendations that can be incorporated into any new
project in the noted areas. The cost of each of these safety improvements is minimal compared to the
overall project cost. For existing roads, these improvements can be the primary component of a General
Roadway Safety Program that may be of interest to the MTI. For this reason, the Sub-Team has provided
a separate project (Project No. 26) to address this particular issue. This project would include the funds
necessary to implement the necessary safety infrastructure as noted below. The cost provided is an
educated estimate since the Sub-Team did not perform a detail inspection of all roads. This inspection
would be required as part of the project.
The three general safety recommendations’ cost associated with each of these safety improvements
should be minimal when compared with a road project. They can additionally be included as part of any
new road project.
a. The road between the cities of Managua and Chinandega is being rehabilitated and in some locations
drainage ditches were built adjacent to the road. These newly constructed ditches are deep and
immediately adjacent to the road. They can be safety hazards if a vehicle falls into the ditch, possibly
causing a rollover accident. Guardrails should be installed in these locations to minimize accidents
and injuries to vehicle occupants. Any future projects should include these types of safety features.
b. Within the City of Corinto, the roadway section of the Department of Chinandega and MTI should
evaluate the adequacy of signage and road markings for the trucks traveling from the port through the
city in order to facilitate safer, more efficient truck traffic movement of import and export cargoes.
c. All new or rehabilitated roads within the cities should provide additional safety features for
pedestrians and bicyclists. This should be resolved by separating traffic, especially truck traffic, from
pedestrians with a white painted line as a temporary solution on the main roads leading to the port.
Concrete barriers should be installed in place of the white painted lines as a permanent solution for
separating vehicular traffic from pedestrians in heavy traffic areas.
4.3 Conclusion
The port access roads that have been evaluated in this report are part of a larger transportation
infrastructure that supports the Port of Corinto and the Nicaraguan economy. The Port of Corinto is a link
to the international trade corridor (dry canal) between Nicaragua and the Port of Cortes in Honduras that
connects roads to the Pacific Rim countries and the North American and European trade markets.
Therefore, the roads and highways from Corinto to the Honduran border are critical and should be a
priority in the Reconstruction Plan of Nicaragua. Both phases of this report investigated the internal port
roads, port access roads, and the upland connectors that support the trade corridor. The final project
recommendations reflect this.
Page 59
Nicaragua: Phase II—Port Damage Assessment Long-Term Report
4.4 Other Upland Road Connectors Projects
Upland connector roads also play an integral role in establishing a seamless transportation system that
allows import cargo to efficiently move from the port through the city and to the interior, and also allows
export cargo to move from the interior to the port. In recognizing the impact of the transportation
infrastructure on the establishment of this seamless system, MTI has outlined several issues and planned
the projects that the Sub-Team supports.
1. From Paso Caballos bridge to Chinandega the road is 16 km long. The road currently does not show
any deterioration; however, the asphalt pavement shows some distress and eventually will require an
overlay. This should be programmed after the construction of the new bridge at Paso Caballos and the
completion of the new detour road.
2. Replacement of the existing Paso Caballos Bridge (Project No. 27).
3. MTI has a consultant developing plans for the rehabilitation of NIC-12 (Project No. 28). During the
August 2000 visit, the Sub-Team noticed that the section of this road between Santa Rita and Emp.
Izapa is in very poor condition. During the Team’s January 2000 visit, it had been noticed that this
section of the road was rapidly deteriorating.
Page 60
Nicaragua: Phase II—Port Damage Assessment Long-Term Report
Section 5—Institutional Framework
5.0 Background
To put the concept of an institutional framework for the Port of Corinto into context, decisions about
capital road improvement, port reform strategy, industry structure, and regulatory frameworks are closely
linked, and all of these institutional issues must be addressed concurrently, not consecutively.
For example, when shifting to a port structure that emphasizes market principles, there is still a need for a
port regulatory system to protect customers and the general public interest.3 This will require that the
public sector develop new skills, institutional capabilities, and practices. These include conducting
strategic planning as a means to set overarching goals to complement and take advantage of the market;
preparing a project plan (sometimes called a master plan or a facilities and operations plan) to set forth
specific facility and operational needs and associated costs; devising a business plan that sets forth the
specific means by which the goals in the project plan and the strategic plan will be achieved;
implementing a system whereby unfair or non-competitive practices are regulated;4 designing and
negotiating contracts with private providers of port services; monitoring performance and enforcing
compliance with general standards; and creating processes for wider participation for interested groups,
including port users, in developing and implementing transport policies and programs.
As to this report, the foreign trade forecasts are one of the major elements of a strategic plan to determine
the world market opportunities.5 Such a plan should also define the port’s mission, goals, and objectives.
One may ask why a strategic plan is needed. The following explanation is the most compelling argument
we have found.
Port planning has several levels: the top is strategic planning. This provides a broad guideline of goals
and objectives that will serve to shape future development of the port. Strategic planning is concerned
with how a port wishes to relate to its environment how its resources will be employed. The next level is
business planning, which transforms guidelines into specifics, and links ideas and concepts to generalized
timetables and “ballpark” estimates of the amount and type of resources that will be required to
implement a program or project. Project planning is the next level. It is here that physical plans are drawn
and specific timetables and resource allocations are determined. The lowest level of planning is
budgeting, which actually allocates resources for various projects and functions. Although budgeting is
the lowest form of port planning, it is probably the most important, since an activity or project can exist
only if it is actually funded.
If a port limits its planning efforts to project planning and budgeting, the port is also limiting itself to
being reactive. If a port enlarges its planning spectrum to include strategic and business planning, it
Page 61
Nicaragua: Phase II—Port Damage Assessment Long-Term Report
allows itself to be proactive. Can a port be successful if it operates in a reactive mode? The answer is a
qualified yes. The qualification is that such a port takes greater risks and is more dependent on others for
its success. If a port is totally reactive, it usually does what other ports are doing or what someone (often a
commissioner or the executive director) wants it to do, without much concern about whether it is the best
option or even if there are any other options. The days when a port was able to build a facility as a “trial
and error” speculation are long gone. With high capital costs, project timetables measured in months and
even years, high “up-front” costs of permitting and mitigation, and a constantly changing economic
environment, successfully operating in a reactive mode is extremely difficult. To operate in a proactive
mode means that the port can manage risk and make more informed decisions. To manage risks, a port
must have information about itself, its customers, and its community, and a firm understanding of what its
mission is or what business it is in. This can be accomplished through strategic planning. In effect,
through a strategic planning effort, a port can be in a position to take on projects that are both valid and
profitable.
5.1 Analysis
In terms of our recommendations, the foreign trade forecasts of this report are a principal basis for the
development of a strategic plan. Also, the capital improvement recommendations of this report should
serve as bases for determining the project plan and the related facility and operations requirements.
In order to successfully implement the strategic and project/master plans, a business plan is needed that
transforms that information into specific timetables and concepts needed to determine the amount and
types of resources needed to implement a desired multi-year program or project. For example, business
plans identify specific projects that the port will undertake, establish preliminary costs and schedules, and
outline how the overall program will be accomplished.6
Because the port planning process exists in the context of national and municipal transport policies,
several basic questions must also be addressed:
� What is the institutional and governance framework for transportation, both within the municipal
government and between the municipality and federal government?
� What is the decision-making process for transportation?
� Is fragmentation of responsibilities and authority a concern (i.e., what are the jurisdictional
responsibilities of agencies involved in highways and their responsibilities)?7
Page 62

Nicaragua: Phase II—Port Damage Assessment Long-Term Report
5.2 Recommendations
In light of the above, our specific institutional framework recommendation comes in three parts:
5.2.1 The transport system functions in a larger environment within the municipality department and
federal government. Port stakeholders must address only the internal institutional issues within
the port, city, or region, but also at the larger “authorizing environment” that reflects the political
structure and role of all the various layers of government in dictating the goals and outcomes of
the transportation structure. In all circumstances, communication and coordination are essential.
One way to institutionalize such communication and coordination is through the budgetary
process. The other way is through the use of the strategic plan, project plan, and business plan.
Our suggestion is to use both means.
5.2.2 The existing transportation coordinating committee of the City of Corinto needs to improve port
and intermodal access of maritime cargo through the municipality’s local city streets. For this to
happen, the City of Corinto needs better coordination and communication with both the Port of
Corinto and MTI. One means to do this is to have a type of on-going transportation planning
organization that includes representatives from all the stakeholders from the port (port
management, shippers, shipping lines, terminal operators, etc.), from the city (merchants,
consumers, elected representatives, etc.), and from MTI. This can be accomplished through a
memorandum of understanding that sets forth the concept that all transportation planning that
relates to the port be integrated and coordinated, with participation of all affected parties the
foundation for such efforts. The city’s legislative body should take a lead role. In essence, such
transportation planning should be an integral part of the strategic, project, and business plans.
5.2.3 Because adequate financing is essential to ultimate success, and because of the national economic
significance of the port, all such planning efforts should be addressed and reflected in
municipal/national transportation budgets, as well as in the National Reconstruction Plan for
Nicaragua.
5.3 Conclusion
A strategic plan, business plan, and project plan are the best means for the Port of Corinto to successfully
attract international trade and cargo to Nicaragua. This tripartite approach should become part of a
marketing strategy by EPN at the Port of Corinto, as well as other ports operating within the country at
large.
Page 63
Nicaragua: Phase II—Port Damage Assessment Long-Term Report
Section 6—Training
6.0 Background and Analysis
In the course of conducting the Port Damage Assessment Report Phases I and II, it became apparent that
there was a real need for a variety of training courses for professional personnel at the respective ports
visited and with professional staff assigned to MTI and the cities of Corinto and Sandino. The basic
justification for the training is to ensure that the recommendations of both Phase I and Phase II can be
implemented, to provide the countries of Honduras and Nicaragua with the capability of responding to
future natural disasters, and maintain a professional capability to support an intermodal transportation
system linked to international trade markets.
6.1 Accomplishments-To-Date
6.1.1 The Pan American Institute of Highways of the U.S. Federal Highway Administration has
established a regional training center with the Ministry of Transportation and Infrastructure. The
regional center will provide highway training courses for engineers from the ports, municipalities,
departments, and MTI.
6.1.2 The Government of Nicaragua will receive onsite training and equipment that includes a basic
Geographic Information System (GIS) developed by the Port Damage Assessment Team. This
GIS system will provide Nicaragua with an emergency response mapping and database
information system capability to respond to natural disasters in the future.
6.2 Recommendations
In this section, the Team provides training recommendations in two categories: the development of an
EPN training program (Project No. 29) and the recommended training courses and the agency that can
provide them.
As has been noted in previous sections, in order to enhance port efficiency and its operations, it is
recommended that EPN develop a training section. This section would require several employees to
schedule, coordinate, and train personnel as required. The section would be managed by a director who
should be an individual highly experienced in the profession and preferably within the maritime or
transportation sector.
Page 64

Nicaragua: Phase II—Port Damage Assessment Long-Term Report
Although this section’s primary task would be to develop the training curriculums and provide the
instructional courses, the section should additionally be responsible for coordinating all specialized
courses that would require the employees to travel within and outside the country.
In the following paragraphs, the Team provides the recommended training courses and the providing
agency. In addition to providing the noted courses, some of these agencies can provide courses tailored as
required to the need of the client. For example, MDFR (Miami-Dade Fire Rescue) HAZMAT can modify
the courses in this field as required by port operations.
The following training courses recommended are listed according to topical areas that relate directly back
to the recommendations of the Phase I and Phase II Reports:
Port Physical Security Courses for Port Authorities and Terminal Operators:
1. Port and Terminal Security
2. Security of Port Operations
3. Personnel Staffing
4. Empty/Loaded Containers
5. Counterfeit Seals/Locking Systems
6. Container Documentation
7. Control of Visitor Access
8. Security Awareness/Security Surveys
9. Coordination Between Port Authorities, Terminals, Shipping Lines, and Customs Authorities
10. Port Security Plan and Vulnerability Assessments
11. Access Control
12. Patrol Procedures
13. Seaport Terrorism Awareness
Contact Agencies: U.S. Coast Guard Reserve Training Center in Yorktown, Virginia, and the Port of
Miami in Miami, Florida
Highway Courses for Engineers:
1. Seismic Design and Retrofit of Highway Bridges
2. Hot-Mix Asphalt Construction
Page 65
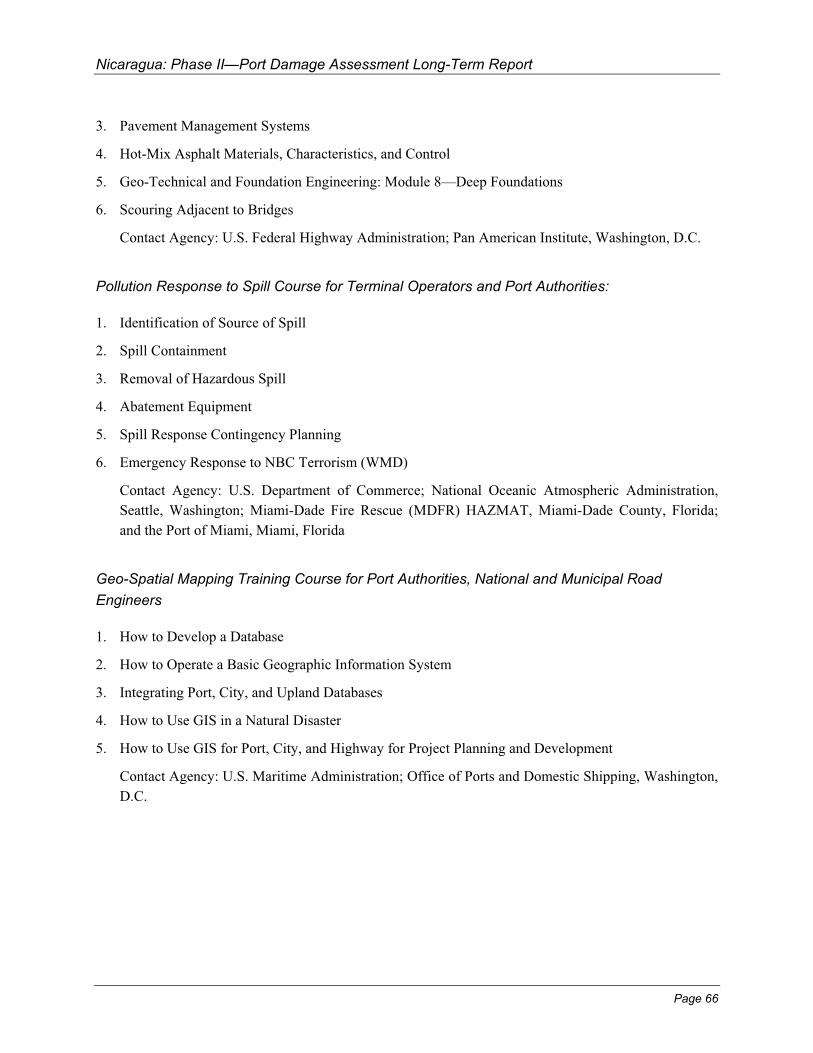
Nicaragua: Phase II—Port Damage Assessment Long-Term Report
3. Pavement Management Systems
4. Hot-Mix Asphalt Materials, Characteristics, and Control
5. Geo-Technical and Foundation Engineering: Module 8—Deep Foundations
6. Scouring Adjacent to Bridges
Contact Agency: U.S. Federal Highway Administration; Pan American Institute, Washington, D.C.
Pollution Response to Spill Course for Terminal Operators and Port Authorities:
1. Identification of Source of Spill
2. Spill Containment
3. Removal of Hazardous Spill
4. Abatement Equipment
5. Spill Response Contingency Planning
6. Emergency Response to NBC Terrorism (WMD)
Contact Agency: U.S. Department of Commerce; National Oceanic Atmospheric Administration,
Seattle, Washington; Miami-Dade Fire Rescue (MDFR) HAZMAT, Miami-Dade County, Florida;
and the Port of Miami, Miami, Florida
Geo-Spatial Mapping Training Course for Port Authorities, National and Municipal Road
Engineers
1. How to Develop a Database
2. How to Operate a Basic Geographic Information System
3. Integrating Port, City, and Upland Databases
4. How to Use GIS in a Natural Disaster
5. How to Use GIS for Port, City, and Highway for Project Planning and Development
Contact Agency: U.S. Maritime Administration; Office of Ports and Domestic Shipping, Washington,
D.C.
Page 66
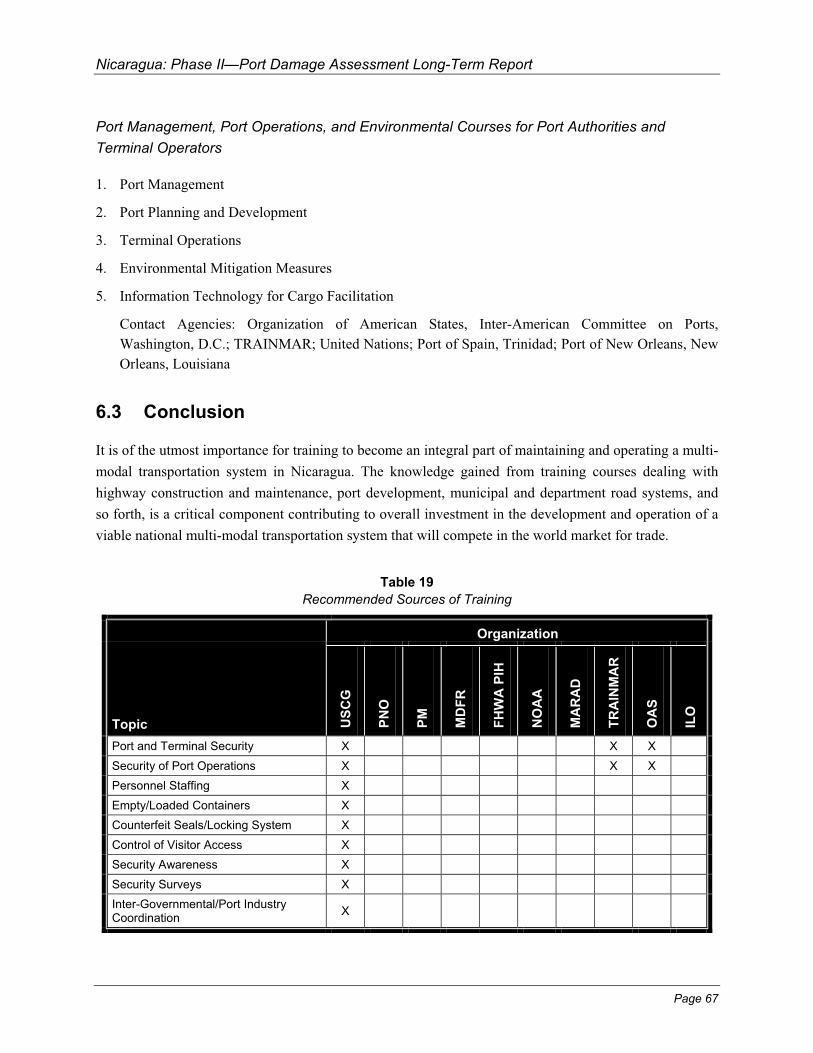
Nicaragua: Phase II—Port Damage Assessment Long-Term Report
Port Management, Port Operations, and Environmental Courses for Port Authorities and
Terminal Operators
1. Port Management
2. Port Planning and Development
3. Terminal Operations
4. Environmental Mitigation Measures
5. Information Technology for Cargo Facilitation
Contact Agencies: Organization of American States, Inter-American Committee on Ports,
Washington, D.C.; TRAINMAR; United Nations; Port of Spain, Trinidad; Port of New Orleans, New
Orleans, Louisiana
6.3 Conclusion
It is of the utmost importance for training to become an integral part of maintaining and operating a multi-
modal transportation system in Nicaragua. The knowledge gained from training courses dealing with
highway construction and maintenance, port development, municipal and department road systems, and
so forth, is a critical component contributing to overall investment in the development and operation of a
viable national multi-modal transportation system that will compete in the world market for trade.
Table 19
Recommended Sources of Training
Organization
Topic US
CG
PN
O
PM
MD
FR
FH
WA
PIH
NO
AA
MA
RA
D
TR
AIN
MA
R
OA
S
ILO
Port and Terminal Security X X X
Security of Port Operations X X X
Personnel Staffing X
Empty/Loaded Containers X
Counterfeit Seals/Locking System X
Control of Visitor Access X
Security Awareness X
Security Surveys X
Inter-Governmental/Port Industry Coordination
X
Page 67
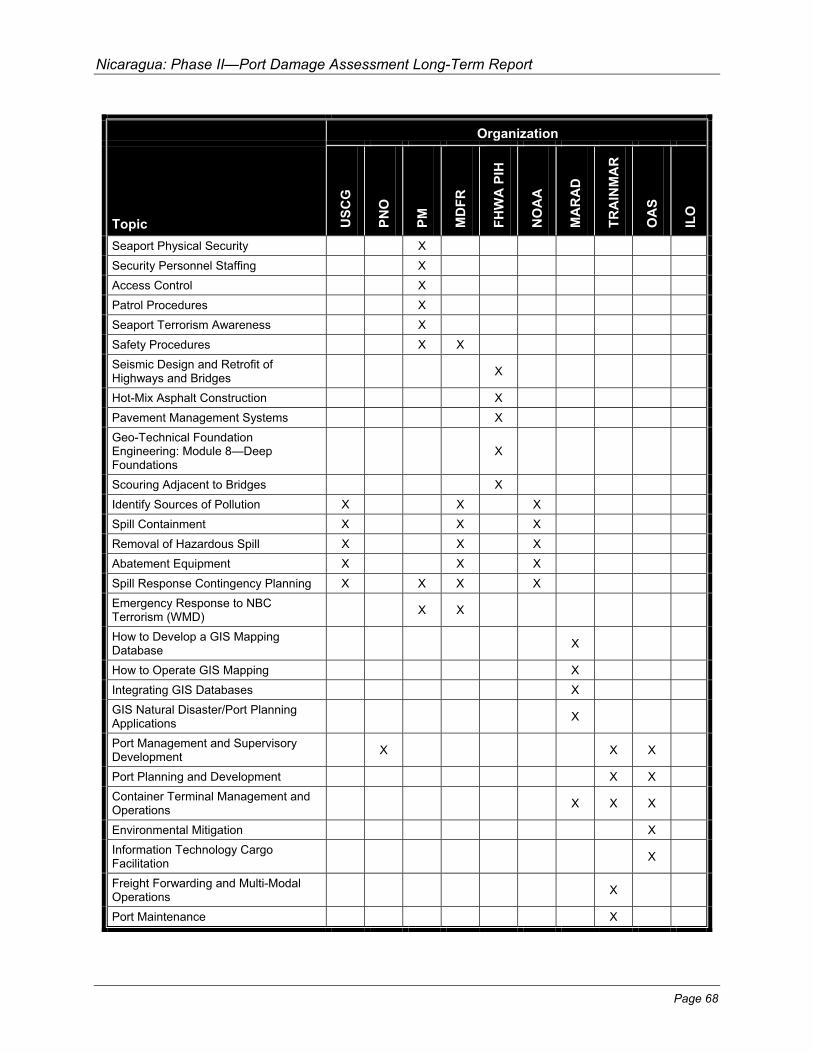
Nicaragua: Phase II—Port Damage Assessment Long-Term Report
Organization
Topic US
CG
PN
O
PM
MD
FR
FH
WA
PIH
NO
AA
MA
RA
D
TR
AIN
MA
R
OA
S
ILO
Seaport Physical Security X
Security Personnel Staffing X
Access Control X
Patrol Procedures X
Seaport Terrorism Awareness X
Safety Procedures X X
Seismic Design and Retrofit of Highways and Bridges
X
Hot-Mix Asphalt Construction X
Pavement Management Systems X
Geo-Technical Foundation Engineering: Module 8—Deep Foundations
X
Scouring Adjacent to Bridges X
Identify Sources of Pollution X X X
Spill Containment X X X
Removal of Hazardous Spill X X X
Abatement Equipment X X X
Spill Response Contingency Planning X X X X
Emergency Response to NBC Terrorism (WMD)
X
How to Develop a GIS Mapping Database
X
How to Operate GIS Mapping X
Integrating GIS Databases X
GIS Natural Disaster/Port Planning Applications
X
Port Management and Supervisory Development
X X
Port Planning and Development X X
Container Terminal Management and Operations
X
Environmental Mitigation X
Information Technology Cargo Facilitation
X
Freight Forwarding and Multi-Modal Operations
X
Port Maintenance X
X
X
X X
Page 68

Nicaragua: Phase II—Port Damage Assessment Long-Term Report
Organization
Topic US
CG
PN
O
PM
MD
FR
FH
WA
PIH
NO
AA
MA
RA
D
TR
AIN
MA
R
OA
S
ILO
Port Labor Training X
Pilot Training X
Port Finance X
Handling Hazardous Cargo X X X
Legend: USCG = U.S. Department of Transportation, U.S. Coast Guard
PNO = Port of New Orleans
PM = Port of Miami
MDFR = Miami-Dade Fire Rescue HAZMAT Response Unit, Miami-Dade County, Florida, U.S.
FHWA PIH = Federal Highway Administration, Pan American Institute of Highways
NOAA= U.S. Department of Commerce, National Oceanic and Atmospheric Administration
MARAD = U.S. Department of Transportation, Maritime Administration
TRAINMAR = United Nations Trade and Development Maritime Training Program
OAS = Organization of American States, Inter-American Committee on Ports
ILO = International Labor Organization
Page 69
Nicaragua: Phase II—Port Damage Assessment Long-Term Report
Attachment 1—Sources and References
Bibliography
Tim Coone (Consultant for the Nicaraguan Ministry of Development, Industry, and Trade), “An
Evaluation of Container Operations Through the Port of Corinto, Nicaragua, from a Perspective of Feeder
Ship Services” (Financed by the Inter-American Development Bank), January 1999
Tim Coone (Consultant for the Nicaraguan Ministry of Development, Industry, and Trade), “An
Evaluation of Shipping Services, Port Facilities, and Import/Export Options for Nicaraguan Cargo
Following Hurricane Mitch” (Financed by the Inter-American Development Bank), December 1998
United Nations Economic Commission for Latin America and the Caribbean (ECLAC), Nicaraguas:
Assessment of the Damage Caused by Hurricane Mitch, 1998, LC/MEX/L.367, April 14, 1999
U.S. Department of Transportation, Assessment of Haitian Seaports, Phase 2—Port Infrastructure and
Operations, Joint Public/Private Sector Port Assessment Team, December 1997
International Training Handbook, 9th Edition, U.S. Coast Guard, International Affairs, 2000
Model Course on the Prevention and Control of Illicit Drug Trafficking on Board Ships, International
Maritime Organization, 1999
Transportation Training Resources Catalog, U.S. Federal Highway Administration, National Highway
Institute, 2000
Transportation in the Americas (Its Role in International Trade, Economic Integration, and Sustainable
Development), Lyndon B. Johnson School of Public Affairs, the University of Texas at Austin, Policy
Research Project Report, Number 135, 2000
Strategic Planning: A Guide for the Port Industry, American Association of Port Authorities, 1988
Thomas J. Dowd, Considering Strategic Planning for Your Port?, Port Management Series, University of
Washington/Washington Sea Grant, undated
Thomas J. Dowd, Current Port Authority Challenges, University of Washington/Washington Sea Grant,
undated
Paul E. Kent and Anatoly Hochstein, Port Reform and Privatization in Conditions of Limited
Competition: the Experience in Columbia, Coast Rica, and Nicaragua, 1998
Page 70
Nicaragua: Phase II—Port Damage Assessment Long-Term Report
Henry Peyrebrune, Institutional and Governance Issues for Large Cities in Transportation, Center for
Transportation Policy and Management, New York University, undated
Port Damage Assessment—Short-Term Action Report, April 2000—Honduras: Assessment of Port
Infrastructure Damage Caused by Hurricane Mitch, 1998, U.S. DOT, Maritime Administration,
Washington, D.C., 2000
World Bank Port Reform Toolkit, Draft Port Regulation Module (Nathan Associates, Inc., March 14, 2000
International Training Handbook, 9th Edition, U.S. Coast Guard, International Affairs, 2000
Model Course on the Prevention and Control of Illicit Drug Trafficking on Board Ships, International
Maritime Organization, 1999
Transportation Training Resources Catalog, U.S. Federal Highway Administration, National Highway
Institute, 2000
Business Plan, I-95 Corridor Coalition, June 1996
Letter of support for conducting multi-agency port damage assessment, Inter-American Development
Bank, March 30, 1999
Letter of support for conducting multi-agency port damage assessment, World Bank, March 30, 1999
Report on U.S. Agencies’ Hurricane Mitch Assistance to Central America, U.S. Department of
Transportation, Maritime Administration, Office of Ports and Domestic Shipping, Ports Division,
February 8, 1998
Emergency Program to Support the Ports of Honduras and Nicaragua, Resolution COM/PUERTOS/
RES. (XX-98), XX Meeting of the Permanent Technical Committee on Ports, Organization of American
States, December 1998
Study Plan Proposal of Near-Term and Long-Term Port Recovery and Improvement in Central America
The Impacts of Changes in Ship Design on Transportation Infrastructure and Operations, U.S. DOT,
Office of Intermodalism, Washington, D.C., February 1998
Port Structure Costs, A Report by the Task Committee on Port Structure Costs, Committee on Ports and
Harbors, ASCE Waterways, Harbors and Coastal Engineering Division, ASCE, 1974
Page 71
Nicaragua: Phase II—Port Damage Assessment Long-Term Report
Attachment 2—Persons Consulted
Nicaraguan Governmental Officials
Francisco Mena Aragon, Director General de Presupuesto, Ministerio de Hacienda y Credito Publico,
Nicaragua
Carlos Morice, Executive Director, Empresa Portuaria Nacional Nicaragua
Jose S. Genet Barberena, Vice Director, Empresa Portuaria Nacional Nicaragua
Genaro Espinales Cajina, Tariff Asesor, Empresa Portuaria Nacional Nicaragua
Charles E. Whitaker, Port Director, Port of Corinto, Empresa Portuaria Nacional Nicaragua
Maria Lourdes Bravo Smith, Director of Engineering and Maintenance, Port of Corinto, National
Company of Ports of Nicaragua
Ariel E. Pastora Frenzel, Vice Minister, Ministry of Transportation and Infrastructure
Mario Palacios Garcia, Director of Planning, Ministry of Transportation and Infrastructure
Adolfo Lacayo, Coordinator of Projects, Ministry of Transportation and Infrastructure
Ana Castillo, Civil Engineer, Ministry of Transportation
International Organizations
Carlos Sepulveda, Economist, Inter-American Development Bank, Washington, D.C.
Guillermo Ruan, Economist, the World Bank, Washington, D.C.
Mario Antonio Zelaya, Program Coordinator, The World Bank in Honduras
Stephen O. Bender, Especialista Principal, Unidad de Desarrollo Sostenible y Media Ambiente,
Organizacion de los Estos Americanos
Carlos Gallegos, Secretary, Inter-American Committee on Ports, Organization of American States
Antonio James, the World Bank
Fernando Quevedo, the World Bank
Adolfo Rufatt, Inter-American Development Bank, Washington, D.C.
Carlos Trujillo, Inter-American Development Bank, Washington, D.C.
Rafael Cornejo, Inter-American Development Bank, Washington, D.C.
Edward Soto, Inter-American Development Bank, Nicaragua
Thomas Chase, American Association of Port Authorities
Jan Hoffman, Senior Economist, United Nations, Economic Commission on Latin America and the
Caribbean Region
Anne DeSouza, Director, United Nations, Trainmar Center, Regional Programs, Trinidad, W.I
Page 72
Nicaragua: Phase II—Port Damage Assessment Long-Term Report
U.S. Federal Agencies
William Medigovich, Director, OET, RSPA, U.S. Department of Transportation
Janet Benini, Deputy Director, OET, RSPA, U.S. Department of Transportation
Raymond Lynch, Environment and Disaster Mitigation Program Manager, U.S. Agency for International
Development
Timothy Stater, Economics Officer, Department of State, U.S. Embassy in Nicaragua
Isabella Ditwiler, Department of State, U.S. Embassy in Nicaragua
LCDR John Arenstam, Office of International Affairs, U.S. Coast Guard Headquarters, Washington, D.C.
Antonio Nieves Torres, Executive Director, Pan American Institute of Highways, Federal Highway
Administration, U.S. Department of Transportation
Jean Preston de Nava, Economic Advisor, U.S. Mission to the OAS, Department of State
Daniel B. Clark, Program Manager, U.S. Army Corps of Engineers, Washington, D.C.
Billie Brown, Project Manager, U.S. Army Corps of Engineers, Mobile District
Ray Lynch, U.S. Agency for International Development
Verne R. Schneider, Chief, International Water Resources Branch, U.S. Geological Survey
Maurice Moroney, Chief for Navigation, Volpe Research Center, Research Special Programs
Administration, U.S Department of Transportation
Paul Hearn, International Water Resources Branch, U.S. Geological Survey
David McKinnie, Program Manager for Central America, U.S. Department of Commerce, National
Oceanic and Atmospheric Administration
Resource People
Paul E. Kent, Group Manager, Maritime Policy, Management and Training, Louisiana State University,
National Ports and Waterways Institute
Alan Harding, Port Operations Consultants
Robert West, Senior Vice President, International Business Development, Inc.
Mark D. Abkowitz, Ph.D., Vanderbilt University Engineering Center for Transportation Operations and
Research
Edesel E. Daniel, Research Fellow, Vanderbilt University Engineering Center for Transportation
Operations and Research
Leigh Boske, Ph.D., University of Texas, Lyndon B. Johnson School of Public Affairs
Bryan Hykes, Research Assistant, University of Texas, Lyndon B. Johnson School of Public Affairs
Page 73
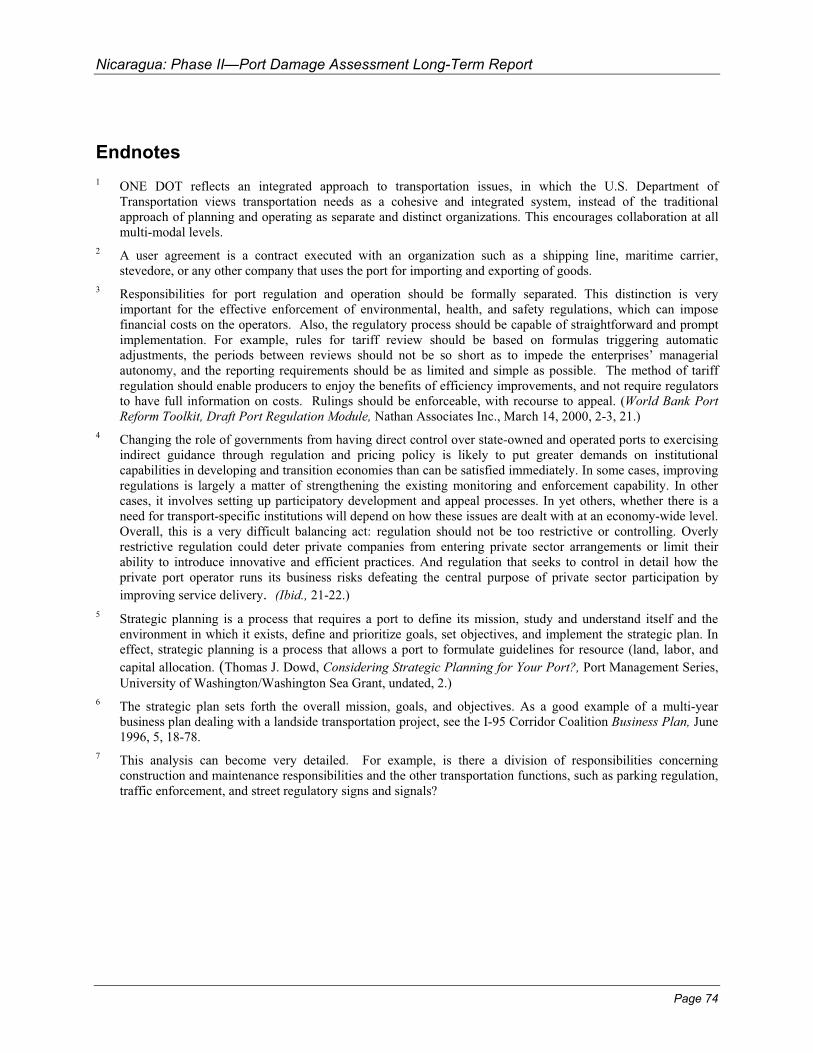
Nicaragua: Phase II—Port Damage Assessment Long-Term Report
Endnotes
1 ONE DOT reflects an integrated approach to transportation issues, in which the U.S. Department of Transportation views transportation needs as a cohesive and integrated system, instead of the traditional approach of planning and operating as separate and distinct organizations. This encourages collaboration at all multi-modal levels.
2 A user agreement is a contract executed with an organization such as a shipping line, maritime carrier, stevedore, or any other company that uses the port for importing and exporting of goods.
3 Responsibilities for port regulation and operation should be formally separated. This distinction is very important for the effective enforcement of environmental, health, and safety regulations, which can impose financial costs on the operators. Also, the regulatory process should be capable of straightforward and prompt implementation. For example, rules for tariff review should be based on formulas triggering automatic adjustments, the periods between reviews should not be so short as to impede the enterprises’ managerial autonomy, and the reporting requirements should be as limited and simple as possible. The method of tariff regulation should enable producers to enjoy the benefits of efficiency improvements, and not require regulators to have full information on costs. Rulings should be enforceable, with recourse to appeal. (World Bank Port
Reform Toolkit, Draft Port Regulation Module, Nathan Associates Inc., March 14, 2000, 2-3, 21.)
4 Changing the role of governments from having direct control over state-owned and operated ports to exercising indirect guidance through regulation and pricing policy is likely to put greater demands on institutional capabilities in developing and transition economies than can be satisfied immediately. In some cases, improving regulations is largely a matter of strengthening the existing monitoring and enforcement capability. In other cases, it involves setting up participatory development and appeal processes. In yet others, whether there is a need for transport-specific institutions will depend on how these issues are dealt with at an economy-wide level. Overall, this is a very difficult balancing act: regulation should not be too restrictive or controlling. Overly restrictive regulation could deter private companies from entering private sector arrangements or limit their ability to introduce innovative and efficient practices. And regulation that seeks to control in detail how the private port operator runs its business risks defeating the central purpose of private sector participation by
improving service delivery. (Ibid., 21-22.)
5 Strategic planning is a process that requires a port to define its mission, study and understand itself and the environment in which it exists, define and prioritize goals, set objectives, and implement the strategic plan. In effect, strategic planning is a process that allows a port to formulate guidelines for resource (land, labor, and
capital allocation. (Thomas J. Dowd, Considering Strategic Planning for Your Port?, Port Management Series,
University of Washington/Washington Sea Grant, undated, 2.)
6 The strategic plan sets forth the overall mission, goals, and objectives. As a good example of a multi-year business plan dealing with a landside transportation project, see the I-95 Corridor Coalition Business Plan, June 1996, 5, 18-78.
7 This analysis can become very detailed. For example, is there a division of responsibilities concerning construction and maintenance responsibilities and the other transportation functions, such as parking regulation, traffic enforcement, and street regulatory signs and signals?
Page 74