u) n - defense technical information center rankine ovoids starting from rest by d. a. shaffer 0 [)...
TRANSCRIPT
U") N N N -.. 0 Q. ~
0:::
~· . r ·.
0
AERODYNAMICS
0
STRUCTURAL MECHANICS
0
APPLIED MATHEMATICS
0
ACOUSTICS AND VIBRATION
·:··
::: .
::\\
·\:· :•:.·.·:·:.·::.· .. ·.:::: ~ ::::: :::-:·:-:·:;:;: :.-:: :.:::;::::··::: ~ ·. :: :·::::. ::·:·:·.::::::: .... ::::::::: :··: · .. ~ ... ·: _:_::.:::: ::: ·. ::
.. .. . . . .. .. . . ·- . ·-: ·. ··· :·.··.:c··t···f>"A· :R ·.f·.n·-:s:: I·H:F·I:}· :.s."f. · · · ·:::.·: ·. ·
FOR FEDERAL SC: IEI\ . · AND TECHN ICAL INFOP. .'·· , .' l U~
Hardc PY Mi crofiche ---l-$ -:/2, ~ C' s-D !
I Jjpptlt~ .... - -
I ~~~~~w~ ~~~·~ SURFACE WAVES GENERATED BY SUBMERGED
RANKINE OVOIDS STARTING FROM REST
by
D. A. Shaffer
0 [) (_ ~
0 rfli!l "l0 ;--\ rl
. ----· ·., ·- .·. ·• ~I
: ~ 0 CT 3 1 1966 l ULS ~LS[f[]b I
8
Uistribution of this report is unlimited .
HYDROMECHANICS LABORATORY RESEARCH AND DEVELOPMENT REPORT
September 1966 Report 2225
F-
DAVID TAYLOR MODEL BASIN WASHINGTON, D. C. 20007
SURFACE W.AVES GENERATED BY SUBMERGED
RANKINE OVOIDS STARTING FROM REST
by
D. A. Shaffer
Distribution of this report is unl imited .
September 1966 Report 2225 ONR P0-5-0065 ONR P0-6-0062

TABLE OF CONTENTS
ABSTRACT ............ ......... ...... ...... .... .. ....... ................... ... ........ .......... ... ...... .. .... ... ... .. .. ............. ...... 1
ADMINISTRATIVE INFORMATION....... ....... ..... ........ ..... ... ... .. ........ ...... ... .. .... ...... .. .. ............. .... 1
INTRODUCTION .... .... ..... ... ... . ....... .. ... .. .... ....... . .... ..... . .... ........ .. ...... ....... .. . .......... ........ .... ....... . .. .. 1
ANALYTICAL BACKGROUND ........ ...... .... ...... .... ........ . .. .............. .. .... ...... .... .. ...... .......... .... .... 3
RANKINE OVOID .... ...... .......... .................. ...... .. .. .... .......... .... .......... .... .. ... .. ............. ... ........ .... . 3
STATIONARY-PHASE WAVE HEIGHTS... .... ................ .... ........ .. ..... ..... .. .......... ... ... .. .. .... .... . 3
TEST EQUIPME NT .... ............ .. .. ............. ... .. ................ ...... ..... ....... ....... .. .......... .......... ....... .... ... 4
RANKINE OVOIDS.. .............. .... ......... . ...... ... ...... ......... .... ... ..... .... ...... ............... ........ ...... ... ... ... 6
TOWING RIG .... .... .. ...... .. .... ...... .. .. .. .... ... . .... .... . ..... .. . .. . . . .. . ... ... . . .. .. . . ... . .... . . . . .... ... .. . . . . . . ... . . ... . . .. .. .. 6
Support Tower ................ .... ..... .. ........ . ................ .. .................... .. ............ .. ... ... ..... ...... ..... .... .. 6
Guide Cables .. .......... ................ .. .... .... .... .. .. .. .. ...... .......... ...... ....... . ........ .. .. ... . ........ ... . .. ........ 6
Towline .... .. .............. .. .. .............. ... . .... ......... .... ..... .... ........................... ....... ..... .. ...... ....... ...... 8
Apparatus for Determining Position and Speed of the Mod e l. .. ........... .. ......... .... ..... ... ... 8
Drive Mec han ism ...... ...................... ..... ........... .. .. .... .... ............... . ................. ... .... ........ ... .. . .. S
WAVE HEIGHT PROBES .............. .. ... ... .............. .. .... ............ ................ .... ........ ... ....... .... .... .. 9
R~CORDING EQUIPME NT .... ...... ...... ........ ...... ............. ..... ........... .. .. ....... .... .... .. .. ......... .. ....... 9
TEST PROCEDURE AND RESULTS .... .... ........ .. .... ...... .. .... ..... ...... ...... ... .... .. ..... ... ... . ... . ... ..... .. 1 1
9.0-FOOT , 7 TO 1 RANKINE OVOID .. .. .. ....... ........ ... ....... ........... ...... .. ..... ..... .. ... ......... ... .. ... 11
4.5-FOOT, 7 TO 1 RANKINE OVOID ...... ....... ... ... ... .... ... .... .............. ... ... .......... .... ......... ...... 12
DISCUSSION OF RESULTS .... ............. .... .. ............ ....... ................. ....... ..... .. ..... ..... ... ......... .... ... 22
STATIONARY-PHASE WA VE PROFILES ......... ... ... ... .. .... ........ .... ....... ...... .... ... .. ......... ... ..... 22
FROUDE NUM BER SCALING EFFECTS .......... .. .. ...... .... ................. ........... ..... ... ....... .... ..... 24
ACKNOWLEDGME .NT S ...... .. ... ........ ....... ... ......... ..... ... .. ... ... ....... ... ... .......... ......... .............. .......... 24
REFERENCES .. .. .... ...... .. ............ .... ..... ... .. .................. .. .. .. .. .... ..................... ......... .... ........ ........ .. 27
LIST OF FIGURES
Figure 1 - Ra nkine Ovoid Dime ns ions ............. .. ..... ........... .. .. .. ......... ............ .... .................... 5
F igure 2 -Sta t ionary-Ph ase Ex press ion, B, as a F unc tion of Froude Numbe r ...... ................. .. ... .. ........ .......... .... ........ .................. ...... ........ .... .. ~
F igure 3 - Lea ning Tower (Loc·ated at Wes t End of the Bas in) .... ..... ...... ........ .. ....... .. .. 7
II

Pagt
F1gure 4 - Straight Tower (Located at Eas t End of the Basin).. .. ..... .... ............... ..... ..... .... 7
Figure 5 - Con~rol Platform ... ... .. ...... .. ... ..... .... .. .... .. .... ... .... ... .. ... ... .... ... .... .......... ....... .... ...... .... 10
Figure 6 - Tow Cable Catenary with Zero Buoyancy Rankine Ovoid ... .. .. ... ..... .... .... .. ... .. .. 13
Figure 7 - Centerline Wave Profiles of a Rankine Ovoid as a Function of Length of Run .... ... ............. .... .. .. .. .............. .... .... .. .... .. .......... ........ .. .. ...... ...... . ~
Figure 8 - Tow Cable and Model Location .......... .. .... .. ... ...... .. .. ...... .. .. .. ...... . :.. .. ........ ............. 14
Figure 9 - Location of the Wave-Measuring Probes with Res pect to the Line of Tow .................. .. ........ ...... .... .............. ............ .... .. ...... .. ...... .... .. .. .... ........ .. .. 14
Figure 10- Wave Heights of a Rankine Ovoid Towed at 10 Feet per Second.... ........ ...... .... ...... .. ........ .. .... ... ... .. .... .. .... ...... .................... .. .................. ..... ... .. 15
Figure 11 - W~:ve He ights of a Rankine Ovoid Towed at 9 Feet per Second.. ...................... .. ............ ........ ...... .. .. .... .... .. .......... ...... .. .... .. .. .... .. .... .... .. .......... 16
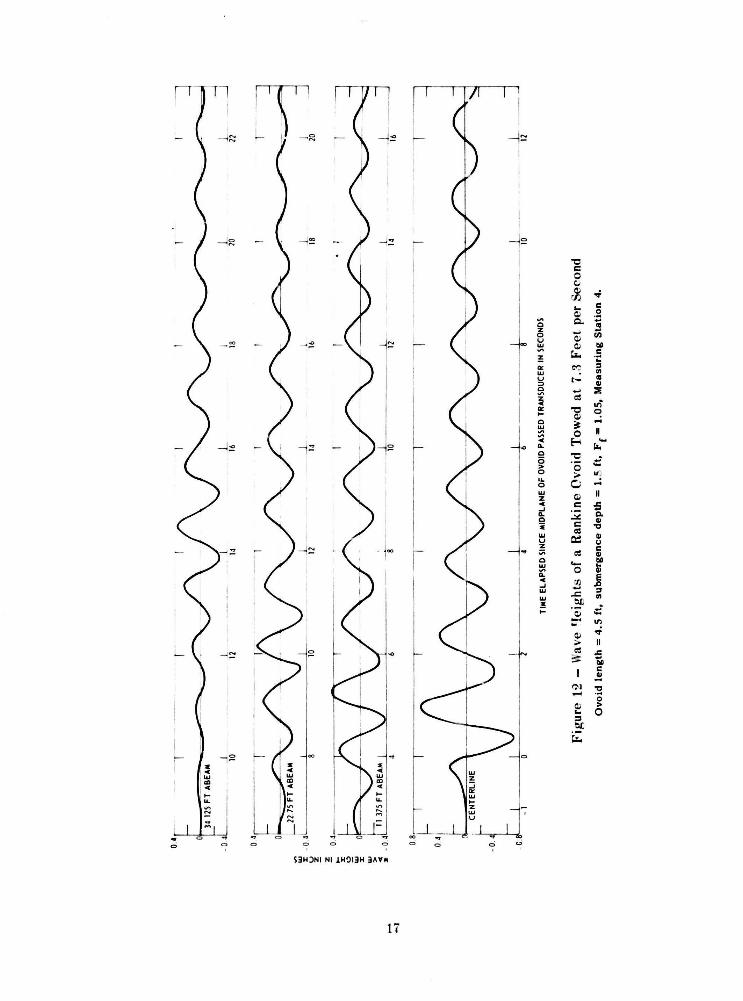
Figure 12 - Wave Heights of a Rankine Ovoid Towed at 7.3 Feet per Second... ... .... .. ........ ............ ......... .. ... ........ ........ .. .... ... ... ..... ..... .... .. .. ... .. ....... .. .... .. ...... 17
Figure 13 -Wave Heights of a Rankine Ovoid Towed at 6 Feet per Second .. .......... .. .. .......... .. ...... .. .. ...... .......... .... .. ...... .. .. .......... .. .. .. ................................ 18
Figure 14 - Wave Heights of a Rankine Ovoid Towed at 5.5 Feet per Second ................ .. .......... .. ............ ................... ... .... .... .. ...... .. .. .............................. .... 19
Figure 15- Wave He ights of a Rankine Ovoid Tow r ri at 5.0 Feet per Second...... .... .............. .. ...... .. ...... .... .. .. .... .. ............ ...... ........ .... .. .. ....... ...... .. .. ......... .... 19
Figure 16 - Centerline Wave Heights of a Rankine Ovoid Towed at 3.4 , 4.0, and 4.6 Feet per Second ...... .... ........ .... .. ........ ...... .... ... .. ...... .. ................ . 20
Figure 17 -Centerline Wave He ights a s Functions of Ovoid Velocity 21
Figure 18 - Maximum Off-Ce nterline Wave He ights a~ Functions of Ovoid Ve loc ity.... ...... ........ .................... .... .. ............ .. .......... .... ........... ...... .. ... .. ........ 21
Fig ure 19 - Growth of the Centerline Wave Profile for D:fferent Le ngths of Run Compared with Stationary-Phase F.xpression .............. ............ .. .. ..... .. .. 23
Figure 20 - Centerline Wave Profile Obtained in a Moving Coordinate System Compared with Stationary-Phase Express ion .. .... ........ .. ....... .... ..... .. ...... 25
Figure 21 - Dime ns ionless Wave He ights of Firs t Centerline Wave Crests a s Functions of Depth Froude Number - Experimental and Stationary-Phase Data .. .. .. .. ... .. ....... ........ .. .. ... ............. .......... .. ...... ...... ... .... . ... ... .... 25
Figure 22 - Froude Scaling of Centerline Wave He ights of the 4. 5-and 9-Foot Rankine Ovoid s .... .. .. .. .. ..... .. ...... .. .. ......... ....... .. .... ..... ........... .. .. . .. ... ... 26
Ill

ABSTRACT
Two Rankine ovoids were towed beneath the· s urface of a large bod y of
water at several s peeds and de pths. The s urface di sturbance was me as ured
both on and off the center! in e of tra ve I. The res ults of these tes t:; were then
compared with existing theoretical wave he ight predictions .
ADMINISTRATIVE INFORMATION
This s tudy was initiated by Bureau of Ships letter S-C utwate r, Serial 360-005988 of
15 Marc h 1960, and completed under Office of Naval Researc h Project Ord e rs P0-5-006 5
dated 16 Octobe r 1964 and P0-6-0062 dated 26 Octobe r 1965.
INTRODUCTION
An object traveling on or c lose to the free s urface of a body of water produces a di s
turbance known as the Kelvin wake. The wave patte rns produced have been studied by many
inves tigators s ince • Lord Ke lvin 1 first formulated the theory of a wave train due to a moving
pressure point on the free s urface. Theoretical developm ents for predi cting the wa\' e he ight
produced by s imple hydrod ynami c bodies, ~vhich can be re presented by s ource and doublet
di stributions , can be found in the literature . 2 - 4 Yim 5 recentl y programmed t,he steady wave
profile generated by a s ubmerged body for a high-s peed compute r. It is only recently, how
e ve r, that in s trumentation capable of making accurate water wave measurements has been
developed .
All the wave height measurements whi ch have been mad e at the Taylor Model Bas in
have bee n done with a Rankine ovoid as the s ubmerged body. Thi s body ·is generated mathe
matically by a s ingle s ource-s ink pair in a moving stream. The re fore, the wa VP pattern is
easi ly obtained mathemati cally once the wavemaking of a s ingle s ourcE: is known. 6
The difficulty in me a s uring the Kelvin wake is a fun ction of t he wave he ight generated.
The s maller the amplitud e , the more diffi cult it becomcc; to meas ure the wave train. Moreover .
one mu s t have a steady re ference from which to meas ure these wave he ights. These me a s ure
ment s are practically impossible to make in an outdoor body of water, and most indoor facili
ties are too s mall. It takes a long length of run to establis h a wave patte rn of a s ubme rged
body and a wide body of water to avoid interfe re nce from wall re flection s . The Mane uvering
a nd Seakeeping Facility (MASK) at the Model Bas in i · probabl y the onl y fac ility in the coun
try where the meas ureme nts can be made s uccess fully. Eve n there, only a s mall portion of
the wave patte rn can be obtained.
1Refe re n c es are listed on page 27.

In 1961, Ralston 6 built a towing rig for the MASK facility and made the first attempts
to measure the wave pattern generated by a submerged Rankine ovoid. He failed to obtain
reliable wave measurements because of the limitations of his measuring equipment and be
cause no systematic investigation was made of transient wave effects . The capacitance
type wave height probes used by Ralston pro~ed to be unsatisfactory because of contamina
tion and the men'.scus effect of the probe wire.
With the dev~!opment of the sonic wave height transducer at St. Anthony Falls
Hydraulic Laboratory and the modifications made by the Taylor Model Basin, ·it has become
possible to measure waves as s mall as 0.01 in. With this instrumentation, Livingston of the
Model Basin made the first successful wave height measurem<'nts under controlled conditions
by towing a 9·ft-long Rankine ovoid.* Furthermore, ·he carried out a systematic investigation
to eliminate transient effects from the wave train.
Although the MASK facility allows a 225-ft length of travel for the ovoid, there was
barely time for a steady-state wake to develop before the ovoid had to stop. Thus, in order
to construct a wave profile in a coordinate system which moved with the body, Livingston
found it necessary to make many test runs, measuring the wave profile at different points in
the basin. In this manner, he obtained a valid profile which included the Bernoulli hump
OVPr the body and about three crests in the trailing wave pattern. After about five body
lengths, the wave profiles were in an unsteady condition and did not lend themselves to cor·
relation with the 'lther test runs made. However, the wave patterns obtained were just long
enough to show reasonable agreement with a stationary phase solution over the first two or
three wave crests. Computations by Yim were not available at that time for comparing the
near-field wave pattern with theory.
Under the Office of Naval Research Project Order P0-5-0065, tht.> Model Basin was
requested to extend the work of Livingston by constructing a smaller ovoid in order to obtain
more wave crests in the steady-state pattern and to obtain measurements both off and on the
centerline. As a result, a 4.5-ft Rankine ovoid was built and the wave patterns were meas
ured along the centerline and at several athwartship distances for a number of operating con
ditions. The shorter body made it possible to double the number of wave crests in the
steady-state pattern.
This report summarizes the work done at the Model Basin in measuring the Kelvin
wake produced by Rankine ovoids. The wave height measurements constitute reliable data
for evaluating theoretical analyses of the wavemaking of sources.
*Reported informally in Hydromechanics Laboratory Test Report 039-H·Ol.
2

ANALYTICAL BACKGROUND
RANKINE OVOID
A Rankine ovoid is the body formed by the s tagnation s treamline in a uniform flow
about a s ource-sink pair oriented parallel to the flow; see Figure 1. The flow is in the neg·
ative x·direction, the source of s trength M/ 417 is located at (c, 0), and a sink of strength
-M/ 4rr is located at (- c , 0). The equation of a Rankine ovoid may be written in the form
[1]
where the coordinate system is shown in Figure 1. The ~alf breadth hand the half length e of a Rankine ovoid are obtained from the following set of equations: 7
[2]
2c [J]
A table of offs ets for a 7 to 1 Rankine ovoid is als o included in Figure 1.
STATIONARY-PHASE WAVE HEIGHTS
The steady-state wavemaking of a source moving beneath a free surface in the region
far downs tream may be approximated by a stationary-phase expr.ession. The accuracy of this
approximation is poor near the body but improves as the downstream di s tance increases.
From Equation [11] of Reference 5, the wave height (on the centerline at any distance R
from the s ource is
where g is the acceleration of gravity,
U is the velocity,
M is the source strength, and
f is the submergence depth of the source.
3
[4]

The wave length of the waves on the centerline is
[51
If the wave heights of the two singularities are added, the wavemaking of the Rankine ovoid
has the nondimens ional form
(RO -
1- = 8(2rr{/R) 112 sin (RifF/ - 3rrl4) [61
plus higher order terms in l i R.
8= SM exp (- 1:'/12) sin c !2 UF f ,., IF/"
[7)
R is now the distance to the center plane of the ovoid, and F f is the depth Froude number.
The Froude number is defined as the ratio of th~ inertia to the gravity forces; the
depth Froude number is
Fr= 1UI /ii
where U is the towing speed,
g is the acceleration of gravity, and
f is the submergence depth.
[81
If 8 is plotted as a function of depth Froude number, the conditions for maximum and
minimum wave heights can be seen in Figure 2. These minima can be calculated from Equa·
tion [7] by setting clfF f equal to nrr. For el f = 1.393, minimum wave heights occur at depth
Froude numbers of 0.66, 0.470, 0.392, etc. as shown in Figure 2. The maximum heights are
more complicated functions of the parameters.
TEST EQUIPMENT
Two Rankine ovoids were towed at several depths below the free s urface in the MASK
facility. Thi s facility is 360 ft long, 240 ft wide, and 20ft deep. The bas in is large enough
so that reflections from the walls did not interfere with the primary wake pattern. The ovoid
4

B
y Offsets of a 7 to I Rankine Ovoid
x/ f y/ f
~-------------------- L=2f --------------------~
0.0000 0.0480 0.0960 0.1440 0.1923 0.2400 0.2824 0.3360 0.3838 0.4000 0.4320 0.4700 0.4800 0.4889 0.5000
0.07144 J.07138 0.07118 0.07104 0.07094 0.07084 0.07040 0.06949 0.06735 0.06600 0.06133 0.0494~ 0.04033 0.03122 0.00000
4.00
3.Q~
2.00
1.00
-1.00
r 7 2
.___.
0 0.200
RANKINE OVOID
9 .O·fl 0 void
L = 9.0 It
c = 4.18 It
M u = 0.104 112
4.5-ft Ovoid
L = 4.5 ft
c = 2.09 It
~ = 0.026 rt2
Figure 1 -Rankine Ovoid Dimensions
/ ~-.......... ~
1.:!9 v I
I "-/
0. 400 0.600 0.800 1.00~ 1.200
DEPTH FROUDE NUMBER
"' "' ... ,
1.400 1.600
Figure 2 - Stationary-Phase Expression, 8, ·as a Function of Froude Number
5
towing mechanism was s upported by submerged towers near the e nds of the bas in. Thi s per
mitted a 225-ft run of which approximately 20ft was needed for accelerating and d('c(' lerating
the model. Wave heights were mea s ured on and off centerl ine from a carriage ~ uspl' nded from
a bridge over the basin.
RANKINE OVOIDS
Two 7 to 1 Rankine ovoids which were ballas ted and had zero buoyancy were US('d
during the tests series. The 9.0-ft long ovoid was towed at a nomina l de pth of 3.0 ft, a nd
the 4.5-ft long ovoid was towed at a nominal de pth of 1.5 ft. Figure 1 s hows the offsets from
whic h the dimensions of the two ovoid s can be obtained.
TOWING RIG
Support Tower
The towers were placed 250ft apart on the bottom of the basi n and were desig ned witl
a three-point s upport bas e to ens ure against rocking 011 ' " "" s light ly uneven floor of the faci l
ity; s ee Figures 3 and 4. The s tabili ty of th0 tower de pendeo upuu it.:; grllv ita t iona l we ight
because it was not pe rmi ssible to anc hor the towers to the :>as in floor. Eac h tower we ighed
approximate ly J OOO lb; thi s was s ufficient to counter t he overturning moment placed upon it
by the cable systl•m. As a s afety meas ure , each to wer was weighted wi th five 1500-lh
weights at its bas e to provide an add itional 7500 lb of ballast.
A cross bar, bolted to the face of each tower, s upported the guide cables a nd towline
pulleys. The crossbar could be pos it ioned up and down the tower face in 6- in. increme nts
whi c h gave a range in de pt h of s ubmergence of 0. 5 to 15 ft. The outboa rd pulleys su pporting
the g uide cables were adju s table in 2-in. incre me nts, s panwise on the crossbar, to accomo·
date mode ls up to 24 in . wide .
The crossbars of e ac h tower were cons tructed of a luminum; thi s mate ri al was c hosen
partly for its corros ion-res is tant properties and part ly to lighten the ba rs for underwater
adjus tme nt purposes. The pulley:- that ope rated underwate r were made of stainless s teel
and rotated on bronze bearings . The s tructura l s teel membe rs of t he towers we re pain ted
wi th a corros ion-res is tant paint. All of thi s equipme nt was in good condition a fter severa l
years of s ubmergence.
Guide Cables
The guide cabl es were 5/ 32-in. airc raft c abl e . Airc raft cabl e had a high te ns ile
s tre ngth and could be s tretched ti ghtly to obtain a fl r.tter ca tenary than poss ible with ordi·
nary cable . The cable could a lso withs ta nd long periods of s ubmergence in water becau:-e
it was made of a highly corros ion-res is tant ni c ke l-s teel alloy.
6
Figure 3 - Leaning Tower (Located at West End of the Basin)
...
..
Figure 4 - Straight Tower (Located at Eas t End of the Basin)
7

One end of each guide cable was anchored to a concrete wall at the end of the bas in
by a 15-ft piece of chain and a chain fall. The chain fall was used to slacken the cable
when not in use, and the 15-ft piece of chain was sufficiently long to allow for adjus tment
of the guide cable length when towing at different depths. The other end of the cable hung
over a pulley and had a steel bucket loaded with lead attached to it to keep the cable under
constant tension during tests. In the present experiments, the cable was kept under 750 to
900 lb tension and had a sag of about 3 in. over t~e span of the test region. The Rankine
ovoid was ballasted to neutral buoyancy and was attached to the guide cables by a set of
stainless steel shoes with a teflon insert for bearings.
Towline
The towline was a continuous loop of 1/8-in. aircraft cable. The model had small eye
bolts at either end for attachment to the free ends of the cable. A multiple-groove drive
wheel and idler pulley system was used to drive the towline and keep slippage minimal when
rapidly accelerating and decelerating the model. Measurements during the test indicated
that on the average, this slippage was about 3 in. for each run. After four tes t runs , the idler
pulley system had to be slackened and the towline line and model moved back to the reference
position. The idler pulley system was also designed to serve as a tens ioning device. The
tension on the towline was kept at 600 lb at all times.
Apparatus for D~termining Position and Speed of the Model
The drive wheel of the towline system was designed to turn off 3 ft of towline at each
revolution, and a mechanical counter, geared to the drive wheel by a tachometer cable, pro
vided visual monitoring of the model positions at all times. In addition, microswitches were
closed at each revolution of the drive wheel by a cam mounted on the counter shaft. One
microswitch was not s ufficient to provide the accuracy needed, so two more s witches were
added to provide a s witch closure for every foot of travPI of the ovoid. The recorded s ignals
from the microswitch and from a timer on the recorder were used to calculate the average
velocity of the model during each test run. The recorded s ignal from the micros witch also
provided a record of the di s tance traveled by the model within ± 6 in. so that the posi tion s
of the model could be synchronized with the pos ition of the wave transducers.
An additional, and more accurate, method was used to check the pos ition of the ovoid
with res pec t to the carriage. A mic ros witc h was covered with a waterproof plastic boot and
mounted on a probe attached to the carriage. At each passage of the mode l, an aluminum arm
on the model made contact with the fl e xible arm on the s witch 10 provide a s ignal to there
corder. Thi s s witch was located 10ft downs tre am from the wave probes .
8

Drive Mechanism
The drive mechanism was powered by a 5-hp, d-e electric motor with a gear reduction
assembly that provided a tow;ng speed range of 0 to 20 ft/sec. The system was controlled
by a feedback-type power supply which maintained the motor speed within 0.5 percent of the
desired setting. The motor was stopped by utilizing regenerative braking. A current limit
adjustment switch allowed the starting and stopping acceleration to be preset to any desired
value. A traveling-nut-type limit switch assembly, geared to the drive mechanism, provided
automatic stopping of the model at any preselected point in the test tun.
The drive mechanism and control console were mounted over the water on a platform
resting on the beach at the end of the basin; see Figure 5. This arrangement allowed the
operator to visually monitor the drive assembly during testing to ensure that everything was
operating smoothly. Part of the platform was enclosed in a wire mesh cage to protect the
operator in the event of cable breakage.
WAVE HEIGHT PROBES
Three types of wave height probes were used during the course of this investigation:
capacitance, resistance, and sonic. Only the sonic type was completely satisfactory. Thf>
other two probes penetrated d:e water surface and their response was affected by surface
contamination and by surface tens ion. At . :'le time of Ralston's experiments, only the
capacitance-type probe was available. 8 Both Liv.ingston and the author used sonic-type
probes which were developed at the St. Anthony Falls Hydraulics Laboratory. 9 Since these
probes had to be widely spaced to avoid electrical interference, only two could be used in
the experimental setup. In an attempt to increase the number of wave measurements which
could be made per run, additional data were obtained with two resi s tance-type wave probes
recently developed at the Model Basin. These probes proved to be difficult to balance, Wt:lre
nonlinear, and were subject to contamination. Iu the end, all the reported data were obtained
with the sonic probes.
RECORDING EQUIPMENT
Analog outputs from the three types of wave height probes were recorded with a Series
350 Sanborn Recorder. A carrier amplifier system was used with the capacitance probes and
a d-e coupling amplifier with the resi stance probes. The sonic probes had their own built-in
amplifier system.
In the tests with the 4.5-ft Rankine ovoid, the data were also recorded on DIDAS, a
multichannel digital acquisition system. 10 Th.-se res ults were r.ot useful for several reasons :
9

10

the s amplin~ rate of DIDAS conflicted with the pulse rate of the sonic transducer, a ground
loop develcped with the 300-ft trans mi ss ion line" from the carriage to the recording station,
and the si~nal-to-noise ;atio was be low tolerable limits .
TEST PROCEDURE AND RESULTS
Three separate tests were conducted with two sizes of Rankine ovoids in the MASK
facility at the Model Bas in. In the first two tests, Ralston 6 and Livingston 7 used a 9.0-ft,
7 to 1 ovoid. Rals ton meas ured the s urface disturbance both on and off the centerline of
travel. Unfortunately he failed to recognize the importance of the trans ient effect (i.e.,
length of ovoid travel) on the wave profile and therefore the data were of little use.
Livings ton, on the other hand, fores aw thi s J.~ooblem and was able to eliminate the transient
eifects of the wave profile and obtain a limited wave profile which n.oved with the body.
As a result of Livings ton's work, it was discovered that a valid steady-state wake
could be establi s hed for about one-half of the towed length of run of the body, thereby,
significantly reducing the number of test runs needed to obtain a meaningful profile. There
fore, s ince gravity wave profiles are s caled with Froude number, it was postulated that a
s imilar 4.5-ft Rankine ovoid, half the length of the original ovoid, would give a wake of
twice the number of body length~ in the same le ngth of run.
The length of all the tes t runs was limited to 225 ft. The starting acce leration and
deceleration dis tances were about 10 ft each. Therefore, the length of test run, for constant
velocity, was about 205 ft. In all but a few tests, the model was allowed to travel the full
225ft. The depth of the water in the bas in during the test was 19 ft 11 in. and was kept at
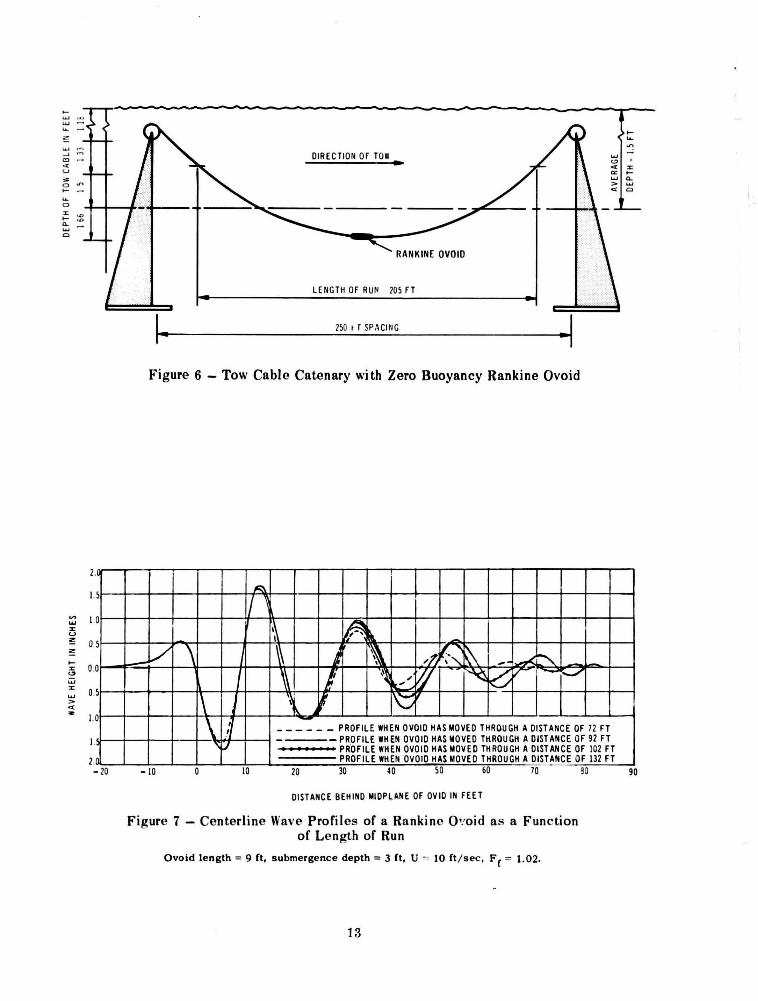
thi s depth within ± 1/8 in. During the course of the run, the depth variation of the model due
to the s ag in the tow cable was no more than ± 1.5 in. Figure 6 s hows the tow cable catenary
for the 4.5-ft ovoid.
9.0-FOOT, 7 TO 1 RANKINE OVOID
Livings ton towed a 9.0-ft Rankine ovoid at several s p--eds and at a s ubmergence depth
of 3.0 ft and measured the centerline time hi story of the s urface disturbance. Wave he ights
were meas ured with a sonic surface wave transducer, and the output of these gages was re
corded on a Series 350 Sanborn Recorder. Despite the 150· to 180-ft runs, he found that only
a limited portion of the wave train represented a s teady-state condition and that measure
ments at a si ngle point would not give a valid representation of the Ke lvin wake for this
ovoid. Therefore, it was necessary to construct a wave pattern whic_h moved with the body
by taking s ingle wave he ight meas urements from many tes t runs at fine ly S!>aced intervals
ove r the distance. A wave pattern constructed in this manner inc reased in length as the
time from the starting point was increased.
11

Figure 7 shows the growth of the centerline wave patte rn of a Rankine ovoid towc>d at
10 ft/sec at a 3-ft s ubmergence depth to the axis of the body. 7 After the body had tra \·e led
through a di s tance of 72ft, the wave pattern was full y developed for two crests onl~' · ..\s
time increas ed, the third cres t. continued to inc rease in amplitude and othe r cres ts began to
develop downstream. After a run of 132 ft, stuady-s tate conditions had de ve loped up to the
second and possibly the third cres t.
4.5-FOOT, 7 TO 1 RANKINE OVOID
A 4.5-ft Rankine ovoid was cons tructed for the ne w scrie~ of tes ts. Tes ts we re run at
several velocities with the axi of the ovoid 1.5 ft below the free s urface . Wave he ights were
meas ured with both s onic and res is tance-type wave probes . The output of these transducers
we re recorded on a Series 350 Sanborn Recorder and on DIDAS.
The wave patterns were measured at five longitudinal ~tations approximate ly 48, ti 3,
95, 133, and 187 ft from the s tarting pos ition of the mode l. Meas urements were made at two
lateral locations on each run. In one set of runs meas urements were take n direc tl y over the
path of the model and 22.75 ft to beam. In the other set of n. ns the carriage wa,; moved
laterally, and meas ure me nts were take n 11.275 and 34.125 ft to beam. Figures 8 a nd 9 s how
the meas uring s tations and the locations of the wave·mf'as uring probes with respect to the
line of tow of the model. Exte ns ive wave meas ure me nts were made at s peeds of 6.0, 7.3,
9.0, and 10.0 ft/sec. Other wave meas ureme nts were made a t towing s peeds be tween 3.2
and 5.5 ft/ sec. A total of 194 tes t runs were made. Re presentati ve data from these runs
are presented in Figures 10 through 18; original data from s ome of these run s have been re·
ported informally in Hydrom ec hani cs Laboratory Tes t Re port 105-H-01.
Figures 10 through 18 s how centerline and t hree off-centerline time-varying wave
profiles produced at differe nt towing s peeds . Thes e records were made at Mf'as uring Stat ion
4 which was between 130 and 135 ft from t he s tart of the run. The longes t s teady-s tate
wave patte rn was obtained at thi s sta t ion. It became diffi c ul t t.o meas ure off-cente rline data
be low veloc ities of 6 ft/ sec.
As the mode l approached the centerline wave probe, the prc>ssure buil t up over the
nose of the mode l and a wave cre s t formed, known as the Bernoulli hump. As the n.ode l pas·
sed, the pressure becam(' negative over the midsection and a wave tra in formed aft of the
body. The wave cres ts in the wake immediate ly be hind the mode l were us ually the highes t.
The later crests decayed monotoni cally and became uniform in period far downstream. The
he ight of the wave crests were functions of the towing veloc ity, s ubme rge nce depth, body
length , and d isplacement. Fi gure 17 s hows the variation of the wave heights of t he firs t and
fifth cente rline wave crests wi th ve loc ity produced by the 4.5- ft. Rankine ovoid at 1. 5-ft s ub
merge nce . The wave crests have maximum values at a veloc ity of 7.3 ft, 'sec whi ch COi::-e·
spond~ to a de pth Froude numher of 1.05.
12
~ ..... ...J
"' « u .. 0 ..... -... 0
"' ..... a.. ..... C)
~ .... :z: u !: ~ ..... :r
"' u:;
"' ..... > <(
'"'
I. s
I. 0
0. s
0. 0
0. s
I. 0
I.
a 2. - 20
DIRECTION OF TOW
LENGTH OF RU~ lOS FT
, .. -I Figure 6 -Tow Cable Catenary with Zero Buoyancy Rankine Ovoid
A
1/ ~ ~~ I ~ lt.
-v \ I ~ J 1\ ·/ilf.. " " ,-"' ~ - .-< ="-I \\ l \~ ~ ~ k/v -~ " ~~~.. ...
1\ I ~'l , lv
\ l ------- PROFILE WHEN OVOID HAS MOVED THROUGH A DISTANCE OF 72FT
- -PROFILE WHEN OVOID HAS MOVED THROUGH A DISTANCE OF 92FT "fJ PR.OFILE WHEN OVOID HAS MOVED THROUGH A DISTANCE OF 102 FT
PROFILE WHEN OVOID HAS MOVED THROUGH A DISTANCE OF 132FT -10 10 20 30 40 so 60 70 30
DISTANCE BEHIND MIDPI,.ANE OF OVID IN FEET
Figure 7 - Centerline Wave Profiles of a Rankine O•!oid as a Function of Length of Run
Ovoid length = 9 ft, submergence depth = 3 ft, U ~ 10 ft / sec, F f = 1.02.
13
..... ...
90

316 ., .. 34
~~I _I I I Nl .... ... .....
~-~.
~i ~I z z z iol 0 0 0
)(Z t= t= t= ~~ ~ ~ ~ ~ c .... I:~ I "' "' "' "' c"' I I
(NOT TO SCALE)
Figure 8 - Tow Cable and Model Location
All dimensions are in feet.
MANEUVERING ~BASIN
~-~
34.1 25
75 -t=t=t-x / 240
t--t--+:-~~ --{ l -J t I I
• • '-TOW CABLE TOWER
22.
11.375
CENTERLINE
I 00 DIRECTION OF TOW
1 _._ !N?T TO SCALE)
Figure 9 - Location of the Wave-Me as uring Probes with Res pect to the Line of Tow
All dimensions are in feet.
14

-w J: u "" "" ... J: !:?
w
J: w
>
..-... ]t
~
l j _
_
20
J,,,. .... -:
-~ ~~
~=-~
~ s
6 •
8 10
12
14
16
0.~
2 3
4
o~
-r-
--
-r
----
r
o~L
·~
.8
--
--·
·--
• 10
12
TIM
E EL
APS
ED S
IIIC
E M
IDPL
AN
E O
F O
VO
ID P
ASS
ED T
RAN
SDU
CER
Ill
SEC
OIIO
S
Fig
ure
10
-W
ave
Hei
ghts
of
a R
anki
ne O
void
Tow
ed a
t 10
Fee
t p
er S
econ
d
Ov
oid
len
gth
= 4
.5 f
t,
sub
mer
gen
ce d
ep
th=
1.5
ft,
Fr
= 1
.44
, M
easu
rin
g St~<
tion 4.

J ,;,,., ..
~' _
/' : -=
-::
j 10
12
.
..
••
~
"' '"' :z: u ~
J.i~ ....
;'~~~~
J 6
8 10
12
14
16
~ .... :z: "' w
:z:
w
> •
-..
~
o.<
I ~(~ ~ ~~~J
"~ ... ,,.,~. ~= r ~ , ~
.. •
Q.J
2
~
6
3 6
8 10
12
TIM
E E
LAP
SE
D S
INC
E M
IDP
LAN
E O
F O
VO
ID P
AS
SE
D T
RAN
SD
UC
ER
IN
SEC
ON
DS
Fig
ure
11 -
Wav
e H
eig
hts
of
a R
anki
ne
Ovo
id T
owed
at
9 F
eet
per
Sec
ond
Ov
oid
len
gth
= 4
. 5 f
t,
sub
mer
gen
ce d
epth
= 1
. 5 f
t,
F f
= 1
. 29
5,
Mea
suri
ng
Sta
tio
n 4
.
...... _,
~ .... :z: .., w
:z:
w
>
~--
34 1
2S F
T A
BEA
III
_ _
j 10
: -Q
.JI
. -·-
.. r·-
-~··
· I
Y'
~8-----·-
--
10
11
Tilli
E EL
APS
ED S
INC
E III
IDPL
AN
E O
F O
VO
ID P
ASS
ED T
RA
NSD
UC
ER I
N SE
CON
DS
Fig
ure
12 -
Wav
e 1!c
igh
ts o
f a
Ran
kine
Ovo
id T
owed
at
7.3
Fee
t pe
r S
econ
d
Ov
oid
len
gth
= 4
.5 r
t, su
bm
erg
ence
dep
th=
1.5
ft,
Ff"
" 1
.05
, M
easu
rin
g S
tati
on
4.
21
l 18 ~
14

"
l I
~ -
: ~ ~ ~::?
;::
;c-.
-=-~
~ )J
m F
T A
BEA
M
""""
"""
......
......
'-/V~ ~
'4;0
P
0 Jl
I J
I 11
IJ
16
18
1
02
14
~
w
:z:
u "
"~I
~
~ ~ ~ ~~.._,1
,........__......_~
·= "'"
"""
_L
~--"~
" '
0 J
!---
----
10
" .... :z: " w :z:
.... w
>
00
.. ~ 't "
'" '""
o JL
----
+--6
--+
-----
-llo
-it
u --&
-_
__
_.J
0 8,
..-
r-·
l -
I ----
---T
---
-I-
OJr "[ "":"
' 0
J
_j_
_ .os~ --
o __
_ L
__
_ L
2 J
iO
T2
TIM
E EL
APS
ED S
INC
E M
'I'\PL
AN
E O
F O
VO
ID P
ASS
ED T
RA
NSD
UC
ER I
N SE
CON
DS
Fig
ure
13 -
Wav
e H
eigh
ts o
f a
Ran
kine
Ovo
id T
owed
at
6 F
eet
per
Sec
ond
Ov
oid
len
gth
= 4
.5 f
t,
sub
mer
gen
ce d
ep
th=
1.5
ft,
Ff
= 0
.86
3,
Mea
suri
ng
Sta
tio
n 4
.
..... ~
o.2
--
---~
--
--
---
---
~--
r --
-,--
--
-I
-.
0 -
-,-
....
._ ~
-"""
--
./"'
...
./"\.
~-.J"""""
" I
=---=
="' ~
~
R
10
12
14
16
18
:!
0. 4
,-
.... %
Cl w
%
ILl
> • •
OV
OID
VEL
OC
ITY
-0
·4 -
2 4
-6
8 10
TI
ME
ELA
PSED
SIN
CE
MID
PLA
NE
OF
OV
OID
PA
SSED
TR
AN
SDU
CER
IN
SEC
ON
DS
Fig
ure
14 -
Wav
e H<
.'ig
hts
of
a R
anki
ne O
void
Tow
ed a
t 5.
5 F
eet
per
Sec
ond
Ov
oid
len
gth
= 4
.5 f
t, s
ub
mer
gen
ce d
epth
= 1
.5 f
t, F
f =
0. 7
9,
Mea
suri
ng
Sta
tio
n 4
•
~_] """
'~'" ;
:
: ~ :
:-= <== 1
:!
.
8 10
12
14
16
18
.... G
~ 0
.2r--------~-------.-----
---.------
--,---
ILI
> • •
CE
NT
ER
LIN
E
-0.2
-0
·4 0
2 4
6 8
10
TIM
E EL
APS
ED S
INC
E M
IDPL
AN
E O
F O
VO
ID P
ASS
ED T
RA
NSD
UC
ER I
N SE
CON
DS
Fig
are
15 -
Wav
e H
eig
hts
of
a R
anki
ne·
Ovo
id T
owed
at
5.0
Fee
t pe
r S
econ
d
Ov
oid
len
gth
= 4
.5 f
t, s
ub
mer
gen
ce d
epth
= 1
.5 f
t, f
'f =
0. 7
2,
Mea
suri
ng
Sta
tio
n 4
.

0.2 0 I CE
NTE
RLI
NE
OV
OID
VEL
,OCI
TY •
U
FT /S
EC
-0.2
0.2
"' 1&1 :z::
u O
r CEN
TER
LIN
E ~
~ ~ 3
-0.2
w
:z::
t.:.
1&1
0. 4
0
> ~ •
0.2 0
-0.2
O
VO
ID V
ELO
OTY
~ 4
.6 F
T /S
EC
-0.4
0
2 3
4 5
6 7
8 9
10
TIM
E EL
APS
ED S
INCE
MID
PLA
NE
OF
OV
OID
PA
SSED
TRA
NSD
UCE
R IN
SEC
ON
DS
Fig
ure
16 -
Cen
terl
ine
Wav
e H
eigh
ts o
f a
!lan
kine
Ovo
id T
owed
at
3A
, 4.
0, a
nd 4
.6 F
eet
per
Sec
ond
Ovo
id l
eng
th =
4. 5
ft,
su
bm
erg
ence
dep
th =
I. 5
ft,
Mea
suri
ng
Sta
tio
n .
;.

1-:
) .....
1.00
0.80
0.60
0.40
....
0.20
... :z
: u !:
!:
.... :z: '"" ;;;
0.10
:z
: ... ~
0.08
•
0.06
0.04
0.02
0.01
2.0
4.0
' \ ---
DEP
TH O
F S
UIII
ER
GE
NC
E =
I.S
FT
~
'
6.0
8.0
10.0
12
.0
OVO
ID V
ELO
CIT
Y I
N FE
ET
PER
SEC
OND
Fig
ure
17
-C
ente
rlin
e W
ave
Hei
ghts
as
Fun
ctio
ns
of
Ovo
id V
eloc
ity
Ov
oid
len
gth
= 4
.5 f
t, s
ub
mer
gen
ce d
ep
th=
1.5
ft,
Mea
suri
ng
Sta
tio
n 4
.
0.6
0,--.---.----,----
, ~-"6;;,
I o.
40 1
I
t:1
· '~
I ~
I I
u ~
~ .... :z
: '"" ;;; :z: ... >
c • O.I
OU
o.
o8
I I 0.
06
0.04
4.0
6.
0
11.3
15 F
T O
FF C
EN
TER
LIN
E
22.7
50 F
T 0
FF C
ENTE
RLI
NE
---
34.1
25 F
T O
FF C
EN
TER
LIN
E
8.0
10.0
12
.0
OVO
ID V
ELO
CIT
Y I
N F
EE
T PE
R S
ECO
ND
Fig
ure
18 -
Max
imum
Off
-Cen
terl
ine
Wav
e H
eigh
ts
as F
un
ctio
ns
of
Ovo
id V
eloc
ity
Ov
oid
len
gth
= 4.
5 f
t, s
ubm
erge
n_ce
dep
th =
1. 5
ft,
Mea
suri
ng
Sta
tio
n 4
.

Since the wave pattern forms a V in the wake , th<> wave crPsts off the c<>nterline
build up some di stance aft of the model. The wave heights rea(:h a maximum ,·alu£' and then
decay s lowly downstream. The wave heights of the highes t cre'-'ts at each athwart.:- hip sta·
tion are plotted in Figure 18 as a function of towing speed.
Irregularities in the wave structure in Figures 10 through 16 result from the wave
interference between the source and sink of the Rankin!:' ovoid sin~ularity rcpre:-:entation.
This interference is particularly noticeable in the off-'centerline wave profil es at the hi~h<>r
towing speeds. At the very low speeds shown in Figure 16, the centerline wave profil<> i~
very irregular immediately behind the model.
The length of the steady-state wave train increased with the distance the model
traveled from the starting point to "the meas uring station. Figure 19 s hows the growth of the
steady-state wave pattern at one towing speed as the measuring station is moved farther and
farther from the starting point. The longest s teady-state wave profile was obtained at Meas·
uring Station 4. Measuring Station 5 was 187 ft from the start of the run, and the model had
stopped before all of the wave train reached the wave transducer. The deceleration of the
model may have produced '3purious surface disturbances.
DISOJSSION OF RESULTS
Although a complete wave analys is is not available at the Model Bas in for comparing
measured wave height with theory, certain quantative observations can be made from the
measured wave heights. A limited portion of the wave train on the centerline can be com·
pared with stationary-phase theory. Since two similar ovoid models were tested, it is also
poss ible to evaluate the accuracy of Froude scaling.
STATIONARY-PHASE WAVE PR'lFILES
Stationary-phase wave profiles computed from Equation [4] for several of the center I i ne
wave conditions are compatible with the wave mea urements whi ch Li ·vingst.on obtained in a
coordinate sys tem which moved with the model. Figure 20 compares one of hi s wave profiles
obtained with the 9·ft Rankine ovoid with the stationary-phase waveform. With this large
model, there was only a short interval between the first and third wave crest where the theory
showed good agreement with the experimental res ults .
The s tationary-phase wave profile in Figure 19 is s uperimposed on the experimental
data obtainl}d with the 4.5-ft ovoid at four measuring stations over the length of the run. AI·
though these experimental data were not obtained in a moving coordinate system, it i::· ev i·
dent that a steady-s tate wave pattern was set up which increased in length as the measuring
s tation is moved away from the starting point. In the s teady-s tate portion of the wave pro·
file, the <;tationary·phase analys is s howed reasonatle agreement with experimPnt up to the
firs t wave crest.
22

0.8
0.6
0.4
0. 2
-0.2
-0.4
-0.6
-0.8
0.8
0.6
0.4
0.2
0
- 0.2
"' .... -0.4 z: v ~ -0.6 ~ ~
3 -0.8 iii 0.8 z: .... > 0.6 4 •
0.4
0.2
0
- 0.2
- 0.4
-0.6
- 0.8
0.8
0.6
0.4
0.2
0
-0.2
- 0.4
-0.6
-0.8
" I I I
EXPERIMENTAL _
~ ---- STATIONARY PHASE -: I 1\ II\ ~ ' lA r. -v I ' \1 1 '1 rl' if' ; /.... I / I
I ~ I '.. \ I
: I l J ~.J ~ ~ ~ It ' T \ I I ' ... ' I : ' v ·~ ..., . ...,
MEASURING STATION 2-63FT FROM START
I tf I
~ , ~
r. I v i\ A " - ... v I , ' ~ , I I /, /\ "' A.., I
I \~ \~ 1\ I~' 't' ~I '< : I J
I l ~ ~ \-.J _vr -"" MEASURING STATION 3-95FT FROM START
I It' .!
u
"' I ' ---I ,, IV\ " II I 1'\ , ./ I r I( I If ~ I I \ I \ I
: ' J ll \ ~ ,~, \ \ I \ If r--
I ~ ~ '1'3 -I l I MEASURING STATIC.N 4 - 133FT FROM START
I 'J
~
~ \' ....
" ' n ~J\ .'.l. ' ' " '• I : ~ v '
,, ~ I' II" "~'
p ·- 7 ' ~' I J 1 \~ ~J 1\J \J I~' '\::' I ~~ .t::i MEASU~NG STATI~ S- 187FT FROM ST~RT
~
~ 0 10 20 30 40 so 60 70 80 90 100
DISTANCE BEHIND MIDPLANE OF OVOID IN FEET
Figure 19 -Growth of the Centerline Wave Profile for Different Lengths of Run Compared with Stationary-Phase Expression
Ovoid length = 4.5 ft, submergence depth= 1. 5 rt, U = 7. 3 ft/sec, Fr = 1.05.
23
FROUDE NUMBER SCALING EFFECTS
Since Livingston's ovoid was 9 ft long and was towed at a depth of 3 ft, it was pos tu- .
lated that a 4.5-ft ovoid towed at a depth of 1.5 ft would yield similar results. Therefore, if
tests were run at the same Froude number, the body should be towed at 11/2 times the former
velocity. The ens uring wave heights would then be one-half as high. Absolute values of the
dimensionless wave heights of the first centerline wave cres ts from the two sets of data are
plotted as functions of depth Froude number in Figure 21. Superimposed on these data is a
theoretical curve obtained from the stationary-phase analysis. The s mall differences ma ' be
attributed to vis cous effects, secondary wave effects, and inadequacies of the s ource-s ink
representation of the body in proximity to a free surface.
In Figure 22, data obtained with the 4.5-ft model have been converted to conditions
for a 9·ft model usirtg Froude scaling. There are two sets of curves which compare the wave
profiles of the 4.5· and 9-ft Rankine ovoids at Froude numbers 1.4 and 1.005. As in Figure
21, there was reasonably good agreement over the s teady-state portion of the wave profile.
ACKNOWLEDGMENTS
The development of equipment and techniques reported here was the work of several
investigators over a period of five years. Richard M. Rals ton designed the towing equipment . ' and conducted the first experiments. Walter Livings ton made the second set of meas urements
with the help of Mr. John L. Power. Mr. D. A. Shaffer conducted the third set of experiments
and prepared the final report.
The author gratefully acknowledges the ass istance of Messrs . Richard Rothblum,
William Souders, and L. Bruce Moore in conducting the experimental work. He al s o wis hes
to express his thanks to Mr. Walter Livings ton for allowing him to draw freel y from hi s notes
and to Dr. Avis Borden for her critical review of thi s report.
24

;; ·~
.~ - J " ., c - l
- I
- 2
I I I EXPERIIIEN TAL l
.I ' -I I ~~\ STATIONARY PHASE-----
0 ---
I I ! ' II\ .~ -- - - f--
_, f--
\ I I \\ I ,11 r~ I ? i ~ ~
I \ / - /j - I ' I
' 1\ ;, W \i 11 I '~j ,'j 1\ ~ I
i r-.....1. \
\ I '
I
I \ r I '\ ~ 'I-" I Q L~
1 - - I I \~ , _ , ~,
I i Y l l I i I 20 ;;o .o 100
DISTANCE BEHIND -.rDPLANE Of OVID IN FEET
Figure 20 -Centerline Wave Profile Obtained in a Moving Coordinate Sys tem Compared
with Stationary-Phase Expression
Ovoid length ., 9 ft, submergence depth = 3 ft, U = 10 ft/aec, F f = 1.02.
0.06
0.04
0 02 -·J·I--c5-
;:::: 0 01 <
t<:
I- 0 008 :r ~
0 6_ n ,.., '\...
0 4.5-FT OVOID Yo ~ 0 9 O· FT OVOID
~ - STATIONARY PHAS£ j.
1 L ru ... 0 006 ::.:
'-' > < .. 0.004
0.002 ~ 0
-
f ~ 0 0.00 1
0 0.2 0 4 0 6 0 8 1.0 1.2 1.4
() [PT!I FROIJC E " IIMBF.P
Figure 21 - Dimensionless Wave Heights or First Centerline Wave Crests as Functions or Depth Froude Number - Experimental and Stationary-Phase Data
25
I

2.0 +
0
~ -1
.0 r-
~
~-
2.0
1-
%
C) w t
o %
w
>
c 1.
0 t:
)
:a
=
0
-1.
0
-2.
0
I~
I I
I I
I
~
/ U
-10
.0 F
T.:
__
_._
__
_
F,
-1.
41
~
-
1\ ll
'-u
u.9
FT
sec
-9.
0-F
T O
VO
ID
----
4.5-
FT
OV
OID
0 0.
8 1.
6 2.
4 3.
2 4.
0 4.
8 5.
6 6.
4 7.
2 8.
0
TIM
E EL
APS
ED S
INCE
MID
PLA
NE
OF
OV
OID
PA
SSED
TR
AN
SDU
CER
IN
SEC
ON
DS
Fig
ure
22 -
Fro
ude
Sca
ling
of
Cen
terl
ine
Wav
e H
eigh
ts o
f th
e 4.
5-an
d 9•
Foo
t R
anki
ne O
void
s
Th
e d
ata
for
the
4.5
-ft
ov
oid
are
scale
d t
o t
he
flo
w c
on
dit
ion
s o
f th
e 9
-ft
ov
oid
at
a su
bm
erg
ence
dep
th o
f 3
ft a
nd
the
sam
e F
rou
de
num
ber.
8.8
9.6
REFERENCES
1. Kelvin , T.W., "Mathematical and Physical Papers,., Cambridge University Press
(1910).
2. Lamb, H., "'Hydrodynamics,., Dover Publication, New York, N.Y. (1945).
3. Kachin, N.E., et al., "Theoretical Hydromechanics," lnterscience Publishers , New
York, N.Y. (1964).
4. Wehausl:n, J.V. and Laitone, E.V. , "Surface Waves ," Encyclopedia of Phys ics.
edited by S. Flugge, Vol. IX, Berlin, Gottingen, Heidelber, Springer-Verlog (1960).
5. Yim, B., "Waves Due to a Submerged Body," Hydronautics Technical Report 231·3
(May 1963).
6. Ralston, R.M., "An Experimental Investigation of the Surface Waves Behind a
Rankine Ovoid Traveling Beneath a Free Surface," M.S. Thesis, Univers ity of Maryland
(1962).
7. Milne·Thomson, L.M., "Theoretical Hydrodynamics," The Macmillan Company, N.Y.
(1950).
8. Campbell, W .S. , "An Electric Wave-Height Measuring Apparat~s," David Taylor
Model Basin Report 859 (1953).
9. Straub, L.G. and Killen, J.M., "'The Sonic-Wave Transducer," St. Anthony Falls
Hydraulic Laboratory, University of Minnesota Memorandum No. M·74 (1959).
10. Luistro, J.A., "A Multichannel Digital Data Acquisition System," David Taylor
Model Basin Report 1630 (1964).
27

UNCLASSIFIED Security Classification
DOCUMENT tC»tTROL DATA • II.D tlecurlty cl•••lflcallon c:trt..,., &ocf)' ole&•tNcf Mttrind••,.. .nnotetion ""'•' H Mtered ..,..,. flte oNra/ 1 report •• cle• •ilied)
I . O~IGINATIN G ACTIVI'!'Y (Co-tete euthot) Ze. RI!POfiiT S£CURI TY CLASSIFICATION
David Taylor Model Basin Unclassified Was hington, D.C. 20007 Zb ~ROUP
3 REPOitT TITLE
SURFACE WAVES GENERATED BY SUBMERGED RANKINE OVOIDS STARTING FROM REST
4 - OESCitiPTIVE NO'!'ES (Type ot tepott .,., lnclu•l.,. utee)
Final $ . AUTHOII(S) (Le•t n-•· tltet n-•· Initial)
Shaffer, D.A.
1 . ltE .. OitT DATE ?e. TOTAL NO. 0~ PAGES 17b. NO . 0~ RE~S
September 1966 33 10
Ia. CONTIIIACT Ofll GfiiANT NO . . .. ORI~INATOR'S REPORT NUMBER($)
Initiated Bureau of Ships b . "RO~ECT NO . 2225
c ONR·P0·5·00fl 5 tb. :.T.H:.:C,~JPONT NO(S) (Any other number• that may be •••lined
d . ONR·P0-6·0062 tO. AVAIL A.ILITY / LIMITATION NOTICES
Distribution of this report is unlimited.
II . SUPPL EIIIENTAitY NOTES 12. SPONSOitiNG MILITAitY ACTIVITY
Office of Naval Research Was hington, D.C.
13. ABSTRACT
Two Rankine ovoids were towed beneath the surface of a large body of water at several speeds and depths. The surface disturbance was measured
both on and off the centerline of travel. The results of these tests were then
compared with existing theoretical wave height predictions .
.. p.
DO fOitM t JAN •• 1473 UNCLASSI.:....:FI:..::E~D ___ _
Security Classification

•••
UNCLASSIFIED Security Classification
Rankine Ovoids
Kelvin Wake
Surface Waves
Wave Transducers
KEY WORDS LINK A LINK B LINK C
ROLE WT ROLE WT ROLE WT
INSTRUCTIONS
\, ORIGINAnNG ACTIVITY: Enter the name and address of the contractor, subcontractor, grantee, Department of Defense activity or other organization (corporate ..,thor) issuing the report.
2a. REPORT SECURTY CLASSIFICATION: Enter the overall security classification of the report. Indicate whether "Restricted Data" is included. Marking is to be in accordance with appropriate security regulations.
2b. GROUP: Automatic downgrading 1s specified in DoD Di· rective 5200.10 and Armed Forces Industrial Manual. Enter the group number. Also, when applicable, show that optional markings have been used for Group 3 and Group 4 .. s author· ized.
3. REPORT TITLE: Enter the complete report title in all capital letters. Titles in all cases should be unclassified. If a meaningful title cannot be selected without classification, show title classification in all capitals in parenthesis immediately following the title.
4. DESCRIPTIVE NOTES: If appropriate, enter the type of report, e.g., interim, progress, summary, annual, or final. Give the inclusive dates when a specific reporting period is covered.
5. AUTHOR(S): Enter the name(s) of a uthor(s) as shown on or in the report. Ente~ last name, first name, middle initial. If military, show rank an.:f branch of service. The name of the principal ;tUthor ;,. an ahsolute minimum requirement.
6. REPORT DATE: Enter the date of the report as day, month, year; or month, year. If more than one date appears on the report, use date of publication.
1a. TOTAL NUMBER OF PAGES: The total page count should follow normal pagination procedures, i.e., enter the number of pages containing information.
7b. NUMIJER OF REFERENCES: Enter the total n" mber of references cited in the report.
8a. CONTRACT OR GRANT NUMBER: If appropriate, enter the applicable number of the contract or grant under which 1 he report was written.
8b, 8c, & &d. PROJECT NUMBER: Enter the appropriate military department identification, such as project number, subproject number, system numbers, task number, etc.
9a. ORIGINATOR'S REPORT NUMBER(S): Enter the offi· cial report number by which the document will be identified and controlled by the originating activity. This number must be unique to this report.
9b. OTIIER REPORT NUMBER(S): If the report has been a s s igned any other report numbers ( e1the r b)· the originator '"by the sponsor), also t'nter this number(s).
10. AVAILADILITV/ I,..IMITATION NOTICES: Enter any limitations on further dissemination of the report, other than tl:ose
imposed by security classification, using standard statements such as:
( 1)
(2)
(3)
"Qualified requesters may obtain copies of this report from DOC:."
"Foreign announcement and dissemlnation·of this report by DOC is not authorized."
"U. S. Government agencies may obtain copies of this report directly from DOC. Other qualified DOC users shall request through
( 4) "U. S. military agencies may obtain copies of this report directly from DOC. Other qualified users shall request through
(5) "All distribution of this report is controlled. Qual· ified DOC users shall request through
If the report has been furnished to the Office of Technical Services, Department of Commerce, for sale to the public, indi· cate this fact and enter the price, if known. ·
lL SUPPLEMENTARY NOTES: Use for additional explanatory notes.
12. SPONSORING MILITARY ACTIVITY: Enter the name of the departmental project office or laboratory sponsoring (payi·ng lor) the research and development. Include address.
13. ABSTRACT: Enter an abstract giving a brief and factual summary of the document indicative of the report, even though it may also appear elsewhere in the body of the technical re· port. If additional space is required, a continuation sheet sh•ll be a It ached.
It is highly desirable that the abstract of classified reports be unclassified. Each paragraph of the abstract shall end with an indication of the military security classification of the in · formation in the paragraph, represented as (TS) . (S) . (C). or (U) .
There is no limitation on the length of the abstract. However, the suggested length is from I 50 t? 225 words.
14. KEY WORDS: Key words are technically meaningful terms or short phrases that characterize a report and may be used as index ent-ries for cataloging the report . Key words must be selected so that no security classification is required. Identifiers, such 11s equipment model des ignation, trade name, military projec t c ode name, geographic location . may be used as key words but will be followed by an indication of l echnical conte xl. The assi~tnment of links, rtlles . and weigh ts is optional.
UNCLASSIFIED Security Classification