types of diagram adaptation - monash university
TRANSCRIPT
Types of diagram adaptation
Cameron McCormack, Kim Marriott, and Bernd Meyer
Monash University, Clayton School of Information TechnologyClayton Victoria 3800 Australia
{clm,marriott,berndm}@csse.monash.edu.au
Abstract. Interactive media and the web require a new kind of diagram,one that can adapt its presentation to suit the viewing context by takinginto account the viewing device and the needs of the viewer. As a firststep we have tried to identify and understand the kind of adaptation thatsuch diagrams could usefully exhibit. We examined nearly 200 diagramsfrom a wide variety of application areas and detailed how each typeof diagram could be sensibly adapted to different viewing environments.Based on this we have identified the different kinds of adaptation that areappropriate for the diagrams in our corpus. Although the classification ofadaptations is likely not complete it is the first attempt that we know ofto provide a comprehensive list of adaptation techniques and we believe itwill provide a good foundation for future research into adaptive diagrams.
1 Introduction
We believe that interactive media and the web require a new kind of diagram, onethat can adapt its presentation to suit the viewing context by taking into accountthe viewing device and the needs of the viewer. There is considerable interest inintelligent, adaptive documents, that is documents whose appearance adapts tothe viewing context and which support user interaction.[6] The desire to separateform from content, in part to allow adaptive layout, has been a major concernunderlying the design of web document standards such as HTML, CSS and XSL.Grid-based templates have also been shown to be a promising document layoutsystem.[5] But the focus has been almost exclusively on textual documents withvirtually no exploration of what it means for diagrams to adapt their appearanceto their context or how to support this.1
However, it is also important for diagrams to adapt and the importance ofdoing so is set to rise for at least three reasons. First, it is increasingly commonfor document content to be generated dynamically, for instance from a database.Second, the range of devices used to view web pages has increased enormously,1 Older raster-based image formats such as JPEG and GIF do not even re-scale sat-
isfactorily. The new resolution independent graphics web format Scalable VectorGraphics (SVG)[3] is a considerable improvement. It supports zooming and uniformrescaling of diagrams, specification of text attributes through style sheets, and al-lows alternate versions of document elements for different media and languages. Butsupport for more sophisticated adaptation is not provided.

and a diagram needs to look good when viewed using a notebook computer, PDA,or a wall-mounted video display. Third, material on the web is increasingly beingused as the primary source for production quality printing. The requirements forprint-media based layout are much more stringent than for on-line viewing.
We have identified seven main reasons for modifying or adapting the presen-tation of a diagram:
space The dimensions of the presentation space may be different from those ofthe original diagram, requiring the layout to be modified to use the availablespace more efficiently. This could be accomplished by collapsing whitespace,scaling the diagram, omitting elements of the diagram, or changing its ori-entation, among others.
medium A diagram should adapt to the presentation medium or viewing de-vice. A diagram printed on a monochrome laser printer, for example, cannotutilise colour. A diagram viewed on a computer or PDA, however, can usecolour and can also handle animation and interaction with the user.
user requirements The diagram may need to be modified in order to make itscontent more accessible to particular users. If the reader of the diagram can-not read the text because it is too small, the font size can be increased andthe remainder of the diagram layout adapted accordingly. Diagrams depen-dent on colours may have to adapt by restyling content to accommodate acolour-blind reader. A completely blind user will need to have the documentadapted to a non-visual form or perhaps to a tactile version. Adapting tolanguage is another example of responding to user requirements, as this willrequire different text strings to be used and consequential layout changes.
context The placement of a diagram on a printed or web page can affect the pre-sentation. Common information between diagrams may be omitted if severaldiagrams are being viewed together. The context could also include informa-tion from other dimensions, such as the list of previously viewed diagramsor the query used to generate a diagram’s data.
cultural conventions Cultural conventions can influence how to present a di-agram. For example, a diagram that implies an ordering of elements byposition relies on the reading order the reader is accustomed to for the lan-guage that is being used. An ordering of elements in a diagram for speakerof English will be left to right, top to bottom, whereas an Arabic speakermay infer the ordering to be from right to left, top to bottom.
dynamic content Some adaptation may be required if the data in the diagramis dynamically generated and so may be unknown at design time, for examplein an organisation chart that is dynamically generated from an employeedatabase.
In addition to the reasons for adapting the presentation of a diagram, weneed to consider the role of user interaction when the diagram is targetted toan interactive medium such as the web. Interaction with an adaptive diagramfalls into two categories: control and experimentation. Control is where the usercan influence the adaptations that affect the diagram. This allows the user, for

example, to zoom around the diagram, expand and collapse group contents orincrease the font size. Experimentation is used to help the user understand theinformation behind the diagram by playing around with it. This might be in aninformation preserving fashion, such as highlighting relations (e.g. highlightingthe corresponding entry in the legend when moving the mouse over a data pointin a chart), or it might be information mutating, such as changing the inputs toa diagram that demonstrates a process or computation.
We wish to provide a generic computational basis for this new kind of dia-gram. A necessary first step is to identify and understand the kind of adaptationthat diagrams could usefully exhibit. To do so, we examined nearly 200 diagramsfrom a wide variety of application areas and detailed how each type of diagramcould be sensibly adapted to different viewing environments. Based on this wehave categorised the different adaptation types possible. This is the primarycontribution of the current paper. Although our categorisation is probably notcomplete it is the first attempt that we know of to provide a comprehensive listof adaptation techniques and we believe it will provide a good foundation forfuture research into adaptive diagrams.
There is relatively little previous research into adaptive diagrams. In [9] wepresented constraint-solving extensions to the Scalable Vector Graphics (SVG)web standard, motivating the extension by the need to adapt diagram layout.
2 Types of adaptation
Adapting a diagram involves changing the syntactic elements to achieve the ob-jectives of the adaptation while ensuring that the information in the diagramthat must remain the same does so. While there are many ways to representthe same information in a diagram, not all will be appropriate as candidates foradaptation. Previous work has been done on identifying compatible representa-tions for information[4, 10], but performing automatic adaptation of a diagram isdifficult, as it would rely not only on the possible appropriate representations ofthe information, but also must take into account design issues such as aestheticsand ease of understanding, which will differ between diagram types.
Adaptation must also be understandable and predictable by the author sothat diagrams can be authored with a clear idea of how they will respond indifferent viewing environments. In order to determine what transformation anadaptation will perform on the diagram, we will look at the different syntacticelements and their semantics that we found in our collection of diagrams. Thetypes of adaptations can then be framed in terms of these elements.
All diagrams comprise a few basic elements: shapes, images, lines and text.The information in a diagram comes from the ways these elements are used.First, the diagram elements can represent things themselves. Shapes and imagescan be symbolic, and represent some object in a non-literal fashion, or they canbe visually similar to the thing they are representing.
But the majority of information in a diagram comes from the spatial re-lationships of the diagram elements, such as position. Precise positioning can

indicate the distance between the physical objects the elements represent. Posi-tioning can also be non-quantitative; placing one element to the left of anothercan imply an ordering. Containment can indicate a relationship such as hier-archy, composition or grouping. The proximity of two elements often indicatessome sort of correspondence between them, for example placing text labels nearanother element would indicate that it is that element that is being labelled,and connecting two elements with an arrow creates some form of subordinationrelationship, such as ordering or hierarchy. Alignment, spacing, layering and sizeare other spatial relationships that may represent information in a diagram.
The styling of the visual elements can indicate some sort of property orrelationship. Often, elements are styled similarly to denote a correspondencebetween them, as used in a bar chart legend. Shades of colours can be used torepresent numerical data.
Finally, with dynamic media, diagrams can include animation. Animation isused to indicate change and movement. It can be discrete, showing a sequenceof states, or continuous, showing flowing movement.
Adaptation can be viewed as a semantics preserving (at least of the relevantsemantics) transformation of a diagram. As we have seen there are many suchtransformation since there is a wide choice in how information can be conveyed ina diagram. However not all transformations are useful or practical, for exampleperforming a complete re-layout of a diagram in response to a minor change offont size is probably only going to annoy the diagram author. In order to identifythose kind of transformations which are useful for adaptation and which can beusefully applied to real-world diagrams we have collected nearly 200 diagramsfrom a variety of current academic journals, newspapers, text books and fromthe web for analysis. Although there were many more than 200 diagrams inthe sources that we studied, we collected only those that used a method ofinformation representation that we did not already have. The diagrams wereorganised into broad types (such as trees, flow diagrams, maps and processes) andwe attempted to perform what we considered reasonable adaptations on a few ofeach type of diagram. A reasonable adaptation, in this instance, is a modificationto the diagram that achieves at least one of the adaptation objectives listed inthe introduction while ensuring that it conveys the same information as theoriginal (or degrades or discards information only where appropriate).
The following are the seven kinds of adaptation that we have identified fromour collection of diagrams:
layout Layout involves repositioning and resizing diagram elements. This isusually done in response to the available space for rendering a diagram. Thesimplest form of layout adaptation is to compress or expand the elementsin a diagram to change the amount of whitespace used. Such repositioningretains the spatial relationships of the elements in the diagram. This may notalways be required, however, and in diagrams where the relative positionsof elements does not encode any information, the elements could be movedanywhere in the diagram. Reorientation is a constrained form of repositioning

where, for diagrams that are layed out linearly in general, it may be possibleto change the orientation from horizontal to vertical, or vice versa.
If size is not encoding any information, diagram elements may be scaledto take up more or less space. This scaling could be constrained to preservethe aspect ratio or not, depending on the purpose of the elements in thediagram. Rotation of elements is also sometimes possible and can be used toconserve space in one dimension, as with text labels on a chart axis.
Finally, more extreme layout, for example by using general graph layoutalgorithms, may be appropriate for some diagram types.
focus Focussing is used to draw attention to more important parts of a diagram,and to reduce (or hide completely) peripheral information. Focussing takestwo forms: zooming and importance reduction. Zooming results in displayingonly a part of the overall diagram. The focus of the zoom could be a graphnode, a group (or several groups), an axis range, a detail level or just asimple area. Zooming would often be instigated as a result of interaction. Asopposed to zooming, which hides parts of the diagram outside of the focusof the zoom, importance reduction will keep the same view of the wholediagram but cause peripheral elements to be less pronounced. This couldbe done by scaling down the peripheral elements, as if viewing the diagramthrough a fish-eye lens, or restyling or repositioning them to have less visualimpact.
detail A diagram can be adapted by changing the amount of detail shown.Whereas focussing will show only a certain part of a diagram, changingdetail will still show the entire diagram but coarsen the information beingshown. Levels of detail are often used in mapping applications, where verydetailed cartographic information may be available. When viewing a mapof an entire country, it is not useful to display all roads. Displaying onlyhighways would be a reasonable level of detail to display, however. Usinghigher levels of detail will cause progressively more elements in a diagramto be shown. Diagrams can be adapted to the level of detail required basedon, for example, the space available for displaying the diagram, or the user’spreference.
Contents of groups and subordinate elements in hierarchies may be shownor hidden just as with levels of detail, depending upon user interaction oravailable space. This can be used to explore a diagram without cluttering itwith all detail at one time.
In diagrams that show numerical data it is sometimes not completelynecessary to show all datapoints to retain the intention of the diagram, thusanother form of detail adaptation is to remove some of the datapoints. Itmay be that the diagram is showing a trend with a line chart. If there isinsufficient space to display all of the datapoints, it might be possible toelide some of them. Labels on a chart axis and contour lines on a map areother examples where values can be omitted.
Similarly, diagrams that have repeated items in them often use somesyntax, such as an ellipsis, to show that some of the items have been omitted.

The number of items that have been omitted could change with adaptation,depending on the amount of space available.
form The representation that is used to encode certain information in the dia-gram can be changed as a result of adaptation. Changing form could changethe spatial relationships used to encode a given relation; for example, chang-ing a hierarchy from using position and connector lines to using containment.Charts are another example of a diagram type that could easily have its formchanged–stacked bar charts that add up to 100% can be changed into piecharts, or vice versa. A more extreme form could be to change a diagram toa completely textual description of the information therein.
factoring and indirection Factoring information in a diagram is the processof moving common information from multiple parts of the diagram into oneplace, and using some sort of correspondence to relate that information backto its original location. The obvious example of factoring is a legend. Ratherthan have labels next to all the elements of a diagram, the elements can becoloured and these colours associated with the labels in a legend. This way,duplicate text strings are eliminated, freeing up space in the diagram. Intro-ducing indirection in to a diagram is a similar process, but does not eliminateduplicated information. By adding a new correspondence, diagram elementscan be moved from one part of a diagram to another while still keepingtheir original spatial relationship required to evoke a particular semantic re-lationship. An example of this is moving text labels into a key, away from theelements that they label, and replacing them with numbers that are an indexinto the key. The proximity of the new numeric labels to the labelled ele-ments keeps the correspondence relationship, even though the actual labelshave been moved away.
text content The text content of a diagram can be adapted according to lan-guage or space needs. Alternate, equivalent text that is shorter than theoriginal text can be used to conserve space. Text content can also be changedto adapt to the reader’s language preference.
animation Animation can be introduced or removed from a diagram to adaptto the abilities of the medium on which the diagram is being rendered. Ifa diagram is conveying change, for example, this could be achieved by vi-sualising the changes as an animation if the medium supported this. Fora printed paper version of the diagram, however, the change could be rep-resented by rendering snapshots of the system at various points while thechange is occurring.
3 Example adapted diagrams
To illustrate the different reasons for adaptation and the adaptation types them-selves, we present six representative diagrams from our collection and give adaptedversions of these diagrams, explaining the first example’s adaptations in detail.
3.1 Cell division
This first example, shown in Figure 1(a), depicts the four steps involved in theprocess of cell division. Arrows are used to indicate progression between thesteps. Text is used for both describing what happens at each step and also tolabel the parts of the cell in the first step. For the first adaptation, let us assumethat the diagram is to be presented in a space that will not fit this verticalorientation, but that there is enough space to present the steps horizontally.The diagram could thus be adapted to the available space to look like Figure1(c).
There are some aspects of the original diagram that are important to keepin the adapted diagram, mostly for reasons of aesthetics and clarity. First, thelengths of the arrows are all equal and the space taken up by all four steps areequal. In the adapted version, these properties are kept, but because the arrowsnow run horizontally, in the same direction as the text, the arrows must be longenough to accommodate the widest label. To ensure that the labels describingthe parts of the cell in the first step do not unnecessarily cause that step to takeup more space, the layout of the labels is slightly different from those in theoriginal diagram, where they are vertically left aligned.
The second adaptation of this diagram, Figure 1(b), demonstrates adaptingto even less available rendering space and also the ability of a medium (in thiscase, a computer-based browser) to provide user interaction. size. The smallerrendering space is insufficient to show all four steps at once. Since this adaptationis targetting a computer-based browser, we can use zooming controlled by userinteraction to allow a reader to navigate through the steps of the cell divisionprocess, thereby reducing the amount of diagram needing to be displayed at theone time. The figure shows views of the rendering zoomed to each step. Sincenagivation between the steps requires some form of on-screen control, each viewhas hyperlinks at the bottom of the diagram to move to the next and previousstep, as appropriate. The steps of the cell division could also be shown withanimation.
Figure 1(d) shows an adaptation to a more complex user requirement: thatthe diagram is to be rendered as a uniform height tactile diagram for a blinduser. There are a number of transformations to the diagram that need to bemade for it to be suitable as a tactile diagram. One obvious transformationis that colours must be removed, and either replaced with texture or just bya non-textured raised area.2 In our cell division example the only informationencoded with colour is the identification of the plasma membrane and cell wall.Since these parts are labelled in the first step and remain in the same relativeposition in subsequent steps, the colour can be removed. Note though that sincethe lines that represent the plasma membrane and cell wall have no separation,if these two parts are to be mapped on to the one “colour” they will need somegap so that the reader can distinguish them. A second transformation requiredis that the English words must be rendered in Braille. It is not sufficient to use2 In the figure, black represents raised area in the tactile diagram while white repre-
sents unraised area.
the same text content with a Braille font, however, since each character doesnot map to a single Braille character, and Braille text often uses a system ofabbreviations to aid comprehension.3 It is closer to a translation of the diagraminto a different language, from the point of view of adaptation, than a simplechange in font. Another point is that complex icons are not as easily discernedin a tactile diagram, thus we have replaced the chromosome icon with a shorttextual identifier ( q q qq q qqq q qq q q qq , “chro.”) that is also specified in the “Bacterialchromosome” label.
3.2 Bar chart
The second example, in Figure 2(a), is a typical grouped bar chart. The firstadaptation, shown in Figure 2(b), illustrates how a bar chart could adapt toan increase in desired font size. The original diagram has quite a long title,and in the adapted version an abbreviated title is used–this is an example ofusing alternate text content to conserve space. Also, the number of vertical axisgrid lines has been reduced due to the space that the axis labels now take up.Whitespace between the bar groups has also been compressed a little. Finally,the horizontal axis labels have been rotated to reduce the amount of horizontalspace needed.
The second adaptation, Figure 2(c), shows how the bar chart could be pre-sented on a PDA screen. The bars in a group have been made to overlap toconserve space, and importance reduction is used to allow the currently focussedbar group to be wider than those that are not focussed. The legend has alsobeen removed, the functionality replaced by interaction that shows the data se-ries name (and also the data point value) when tapping the stylus on a bar. Thisexample also shows adaptation to a different language.
3.3 Decision tree
Figure 3(a) shows the third example diagram, a decision tree. The tree has anumber of branches which can be followed to diagnose a medical condition. Aform of detail reduction (collapsing a subtree) is shown in the first adapted ver-sion of the diagram in Figure 3(b), as a result of user interaction. The secondadapted version, in Figure 3(c), shows a more comprehensive form of user in-teraction. Here, the diagram has been adapted to the ability of the medium, aPDA, to allow the reader to navigate through the decision tree. This is a methodof focus control. Clicking on a node at each level will cause the diagram to bezoomed to that node, showing the new child nodes as options in the centre ofthe display.
3 Note that the figure does not use Grade 2 Braille, the standard system of contrac-tions, due to the authors’ unfamiliarity with the system.

Fig. 1. Cell division diagram: (a) original diagram[2], (b) interactive step-by-step ver-sion, (c) horizontal version, (d) tactile version.

Fig. 2. Bar chart: (a) original diagram[1], (b) adapting to a large font size user require-ment, (c) adapting to a different language, small screen size and adding interaction.

Fig. 3. Decision tree: (a) original diagram[7], (b) collapsed group, (c) interactive ex-ploration.
3.4 Pie chart
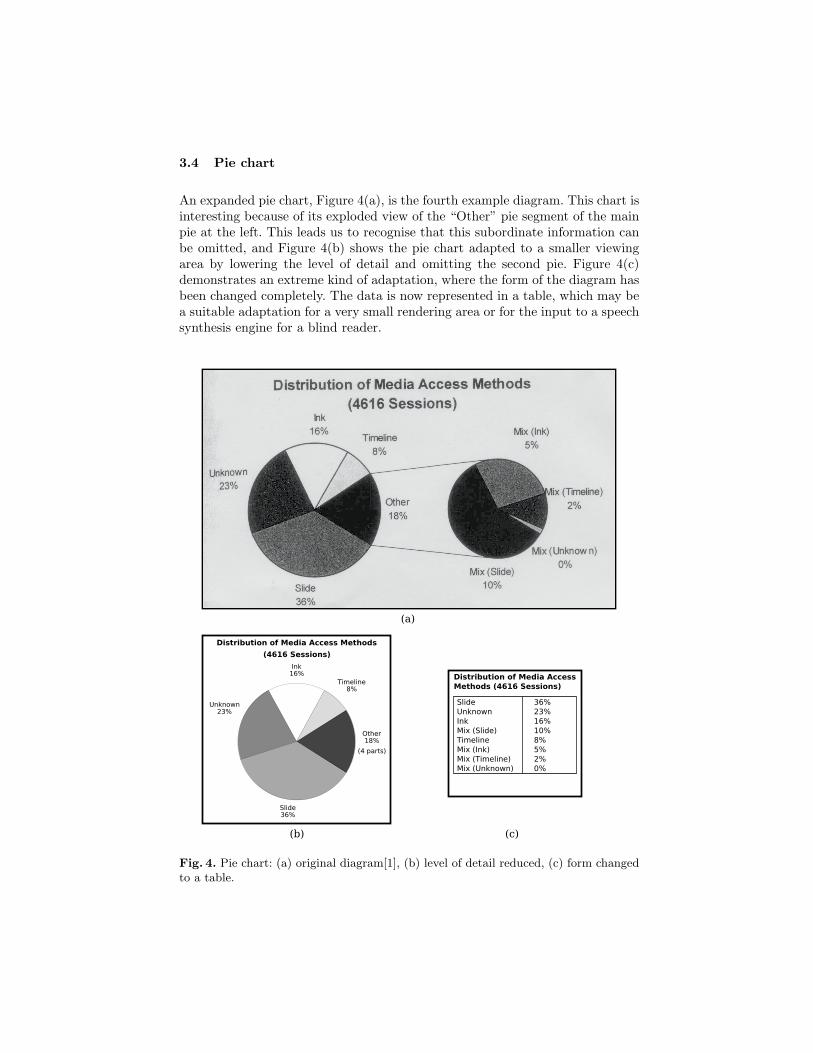
An expanded pie chart, Figure 4(a), is the fourth example diagram. This chart isinteresting because of its exploded view of the “Other” pie segment of the mainpie at the left. This leads us to recognise that this subordinate information canbe omitted, and Figure 4(b) shows the pie chart adapted to a smaller viewingarea by lowering the level of detail and omitting the second pie. Figure 4(c)demonstrates an extreme kind of adaptation, where the form of the diagram hasbeen changed completely. The data is now represented in a table, which may bea suitable adaptation for a very small rendering area or for the input to a speechsynthesis engine for a blind reader.
Fig. 4. Pie chart: (a) original diagram[1], (b) level of detail reduced, (c) form changedto a table.

3.5 Exploded part diagram
The fifth example diagram, an exploded part diagram, is given in Figure 5. Thiskind of diagram is common for illustrating how mechanical parts fit together.Possible adaptations for this diagram include removing the part labels to con-serve space, displaying them only with user interaction, or allowing the user toshift the parts along the axis so that they can experiment to understand betterhow the parts fit together.
Fig. 5. Exploded part view diagram.[8]
3.6 Image processing feature recognition diagram
The final example demonstrates adaptation by removing repeated items from adiagram. Figure 6(a) shows an illustration of an image processing framework.This diagram has five image frames, but for the purpose of the diagram it doesnot matter how many frames are actually present, as long as there are a few.Figure 6(b) shows an adapted version of the diagram where this repetition hasbeen reduced to save space.

Fig. 6. Diagram illustrating image recognition feature detection: (a) original dia-gram[11], (b) with repetition reduced.
4 Conclusion
We have examined nearly 200 diagrams from a wide variety of application areasand detailed how each type of diagram could be sensibly adapted to differentviewing environments. Based on this we have developed a collection of differentkinds of adaptation which range from slight modification to the syntax andlayout, such as changing the size of the text and appropriately relaying out therest of the diagram, to performing complete change in representation from avisual form to an audio description.
For diagrams to provide the sort of adaptivity that we have identified werequire web standards that allow the specification of such adaptive behavior.In principle this is possible using scripting but it would be better to have highlevel support in languages such as SVG. However the main unsolved problem ishow to specify the desired adaptive behaviour. We do not believe specificationof the adaptive behavior can be completely hidden from the author. This maybe possible for very restricted kinds of diagrams such as bar-charts and limitedkinds of adaptation, but in general we need to develop new authoring toolsand metaphors to enable the easy construction of adaptive diagrams. Documentauthors need to be confident that they control and can predict how the diagramwill adapt to different contexts.

The kinds of adaptations identified above provide considerable guidance indeveloping these, allowing us to create, for instance, a set of tools that generatea new version of a diagram adapted to narrow viewports or for tactile viewing.But this will not happen invisibly, as the author will need to control applicationof the tools and will be able to fine-tune the generated diagram. Work on anauthoring tool for adaptive diagrams is currently underway.
References
1. Jason A. Brotherton and Gregory D. Abowd. Lessons learned from eClass: Assess-ing automated capture and access in the classroom. ACM Trans. Comput.-Hum.Interact., 11(2):121–155, 2004.
2. Neil A. Campbell. Biology, page 205. Benjamin/Cummings, California, fourthedition, 1996.
3. Jon Ferraiolo, Jun Fujisawa, and Dean Jackson. Scalable Vector Graphics (SVG)1.1 specification. http://www.w3.org/TR/SVG11/, January 2003.
4. Corin A. Gurr. On the isomorphism, or lack of it, of representations. In KimMarriott and Bernd Meyer, editors, Visual language theory, pages 288–301, NewYork. Springer Verlag.
5. Charles Jacobs, Wilmot Li, Evan Schrier, David Bargeron, and David Salesin.Adaptive grid-based document layout. In ACM transactions on graphics (TOG),volume 22, July 2003.
6. Charles Jacobs, Wilmot Li, Evan Schrier, David Bargeron, and David Salesin.Adaptive document layout. Commun. ACM, 47(8):60–66, 2004.
7. Peter W. Marks and Lawrence R. Zukerberg. Case 30-2004 – a 37-year-old womanwith paresthesias of the arms and legs. N. Engl. J. Med., 351(13):1333–1341, 2004.
8. Kit Masters. Instructions to install 8500SK (Sealkit).http://kit-masters.com/instruction kysor8500sk.html, March 2004.
9. Cameron McCormack, Kim Marriott, and Bernd Meyer.Adaptive layout using one-way constraints in SVG.http://www.svgopen.org/2004/papers/ConstraintSVG/, September 2004.
10. Atsushi Shimoima. Derviative meaning in graphical representations. In IEEEsymposium on visual languages, pages 212–219, Tokyo, Japan, 1999.
11. Robert Sim and Gregory Dudek. Learning generative models of scene features.International Journal of Computer Vision, 60(1):45–61, October 2004.