txdot combined aggregate grading: technology ... · 1 txdot combined aggregate grading: technology,...
TRANSCRIPT
1
TxDOT COMBINED AGGREGATE GRADING:
TECHNOLOGY, APPPLICATIONS, AND RESULTS FOR PAVING AND
STRUCTURES
James M. Shilstone, Sr. P.E. M ASCE Concrete Engineer
ABSTRACT: TxDOT has made provisions for a major change in the way concrete paving mixtures are developed and controlled during construction. The new process is based upon use of combined aggregate grading (CAG) rather than the traditional coarse and fine sizes. Based upon recent work by other agencies, it will reduce costs, extend service life of highways, and facilitate new construction. The importance of CAG is not new. It was the basis for development of the relationship between water-cement ratio and strength by Professor Duff Abrams in 1918. 1938 research by the Texas Highway Department led to savings of $1.0 million a year in new highway construction. The modern concept was developed by the author in 1975 based upon research for construction in Riyadh, Saudi Arabia. The technology has been expanded and is included in consensus standards, US Air Force standards, some state agencies, and hundreds of ready mix and precast concrete producers. The technology will be described along with the means whereby future Texas highways and structures will provide 50 year or more service for the public.
THE SITUATION: Texas highways and bridges are deteriorating prematurely. The Texas ASCE’s 2004 report card for the state’s infrastructure was D+. Something must be done but what? Albert Einstein wrote: "Change is a product of intelligent effort. A problem cannot be solved using the methods that created it." The question that must be asked is: What created the problem? There are three parts to the answer. Then, how can the problem be resolved? That is the subject of this paper.
First, The AASHTO pavement design formula considers only one concrete characteristic - strength. Few highways fail prematurely due to low initial strength. The answer was written in the 1927 second edition of the Portland Cement Association’s (PCA) “Design and Control of Concrete Mixtures”(DCCM-27). The title of the second section was “WATER-CEMENT RATIO STRENGTH LAW.” Following is a key statement: "For given materials and conditions of manipulation, the strength of concrete is determined solely by the ratio of the volume of
mixing water to the volume of cement so long as the mixture is plastic and workable." The water-cement ratio was originally based upon volumetric units. Unfortunately, due to an administrative error in about 1965, the relationship was changed to mass units without correction of the decimal units.
The next section describes the effects of water-cement ratio on other concrete qualities which included the statement "The resistance of concrete to the severe conditions of weathering and to the action of sulphate waters is determined largely by the degree of impermeability.
Impermeable concrete requires non-porous aggregate thoroughly incorporated in the cement
paste that is itself impermeable. Impermeable paste requires in turn a low water-cement ratio;
the thorough incorporation of aggregates necessitates a plastic, puddeable mix. The proper
control of the mixing water is the vital force in the production of durable concrete." One should
2
not be concerned about using a low water-cement ratio mix as the cements of that era were coarsely ground and gained strength slowly.
Some researchers have reported very low water-cement ratios reduced permeability - the key to durability. However, those mixtures produced much higher strengths than those required for concrete paving. Since contractors are judged based on strength and cement content, there is no incentive for them to use the best materials that minimize the need for water and reduction in cement. Specifying a maximum water-cement ratio has the same effect. NIST reported the specifier assumes responsibility for the quality of the concrete once the contractor has left the project.
While defining and measuring permeability in the field has been a nagging problem for many years, and/or innovative research program is under development here in Texas. There are two laboratory methods for evaluating cores - chloride permeability [6] and ASTM C-642 [7]. When the research is completed; mix water-cement ratio, air entrainment requirements, and permeability will be projected from the aggregate stockpiles and adjustments to the mix proportions.
Second, the Department of Defense and NASA were concerned about concrete durability and funded research by the National Institute of Standards and Technology (NIST) to research the problem. The American Concrete Institute (ACI) [8] published a summary of the report in 1988 under the title “Concrete Durability – A Multi-Billion Dollar Opportunity”. NIST listed a series of problems that are endemic to the concrete industry -- especially the paving industry. In addition to specifying strength, engineers and agencies often add requirements for a minimum of cement factor and/or maximum water to cementitious materials ratio. That combination provides not one but three specifications for the same product – a concrete mixture.
TxDOT requires a maximum water to cement ratio of 0.45. The volumetric water-cement ratio vs strength in DCCM-27 projected 0.48 as appropriate for 5,000 psi. In mass units that would be 0.37. The current issue of DCCM lists non air entrained mixes with a w/c of 0.48 for 5,000 psi and 0.38 for air entrained concrete. The cement industry changed the C3A and C2A that affected early strength gain in the early 1970s. During recent research with well graded combined aggregate paving concrete, a mix with a w/c of 0.54 and no air produced a compressive strength of 6,200 psi and 895 psi flexural strength. Another mix with 5.0% air entrainment and a water-cement ratio of 0.45 developed a strength of 6,900 psi and a flexural strength within 2 psi of the first mix.
Third, There is limited understanding of concrete technology by most engineers. The national ASCE leaders are concerned and found that a four-year academic program is not adequate to produce the engineers to meet the needs of the 21st century. ASCE Policy Statement 465: “Academic Prerequisites for Licensure & Professional Practice” outlines the prerequisites required for entry into tomorrow’s practice of civil engineering at the professional level. That is explained by the statement, “Future civil engineers will face an increasingly complex world requiring more professional breadth and specialization." The problem originated in the early 1960s when design requirements became more complex after the end of World War II. New buildings and highways were more complex and demanding more attention to design detail. To meet the academic time need, materials courses were dropped from the curriculum at engineering universities and replaced with design. The only material that escaped that cut was the soil and
3
foundation design technology. Based on the design complexities, geotechnical engineering came into being. Study of concrete was eliminated except as a material in a design formula.
THE SOLUTION: The 2004 TxDOT Manual requires that mix proportions be selected in accordance with ACI 211 “Proportioning Concrete Mixtures.” That procedure is based upon a relationship between the dry-rodded unit weight of the coarse aggregate and the fineness modulus of the fine aggregate. It was developed in 1938 under the sub-title “For Concrete Placed without the use of Vibrators” – hardly appropriate for slip-formed paving. It has been one of the contributors to TxDOT concrete construction. The ACI 211 Committee has approved an appendix that will include the provisions for use of the concepts herein-after discussed in this report.
During the early 1990s, information filtered throughout the concrete paving industry that Iowa DOT (IDOT) was placing a “new” type of concrete paving mix. Their change was motivated following major concrete paving problems. Cracks developed over the vibrator trails shortly after construction completion. At first it was alleged the problem was improper vibrator operation. It was later found that the problem was concrete mix related. A representative of Ash Grove Cement Company supported me in the recommendation that the mix proportions should be based upon grading of the combined aggregates. The Iowa ACPA chapter purchased a copy of our mix analysis software and gave it to IDOT.
IDOT evaluated many mixes and found the software identified every condition – good or bad. Working jointly with the concrete paving contractors, the results have been outstanding and provided a win-win situation for both agency and contractor. Finishing cost was reduced because the paving machine produced the surface needed without handwork. Cement content was reduced so the cost of construction was reduced. Iowa DOT became the leader for concrete pavement construction. IDOT now use variations in combined aggregate grading as a basis for incentive pay. That system makes it possible for contractors to obtain more distant aggregates to assure the best pay – and the best durability for the taxpayers.
53 new pavements, constructed in the period 2000 – 2004, were plotted in Zone II on the CFC. One of those mixes is included in a figure that follows showing the three charts. Special advantages of dealing with the grading of the combined aggregate have been found. Gradation, not strength, guarantees workability and adjustments to provide mix continuity can be made in real time. Adjustments in mix proportions, as materials vary, minimizes the need for testing. With the focus on gradation, IDOT found that concrete:
• Improved workability,
• Increased strength with less cement,
• Decreased permeability,
• Helped admixture effectiveness, and
• Assured mix consistency.
After establishing their knowledge, several senior IDOT executives retired and joined Iowa State University where they formed the National Center for Concrete Paving Research. The Center is being heavily funded by FHWA and the American Concrete Paving Association (ACPA). TxDOT investigated the process and became a member of the 16-state pooled fund study of concrete pavements.

4
After studying the program and developing a plan, TxDOT issued Special Provision 421 – 007
Hydraulic Cement Concrete (Appendix 1 - attached) that made important changes to the TxDOT 2004 Manual. It makes provisions for mix design development based upon the grading of the combined aggregate rather than the traditional coarse and fine aggregate. Key paragraphs in that document are:
“4. Optimized Aggregate Gradation. Provide coarse and fine aggregate meeting the
requirements of Sections 421.2.E.1 and 421.2.E. 2. unless otherwise stated. * * *
Coarse and fine aggregate gradation charts shown in Sections 421.2.E.1 and 421.2.E. 2 will not
apply for aggregates used for optimized concrete mix designs. * * *
Submit sieve analysis reports showing the cumulative combined percent passing, the cumulative
combined percent retained, and the combined percent retained on, including all standard sieves
starting with the nominal maximum aggregate size to the No. 200. Use the following charts,
developed in accordance with Tex-470-A "Optimized Aggregate Gradation for Hydraulic suit
Cement Concrete Mix Designs," to determine the optimal combined angry at gradation:
• Coarseness Factor Tried,
• Percent Retained Chart, and
• 0.45 Power Chart”
"During concrete production, monitor the aggregate gradation by plotting the results of each
sieve analysis on the coarseness factor chart, percent retained chart, and 0.45 power chart in
accordance with Tex-470-A, ‘Optimized Aggregate Gradation for Hydraulic Cement Concrete
Mix Design.’ Perform the first sieve analysis before each production day. Adjust aggregate
proportions, if necessary, to keep the coarseness factor chart and workability plodded within the
workability box on the coarseness factor chart produced described in Tex-470-A, ‘Optimized
Aggregate Gradation for Hydraulic Cement Concrete Mix Design.’ Adjustments to the
aggregate proportions that also require adjustments to water or cementitious material content
will require development of new mix proportions and results from trial batches."
The second document is Section #. Tex-470-A, Optimized Aggregate Gradation for
Portland Cement Concrete Mix Designs (Appendix 2 – attached). That method outlines the procedure for analyzing combined aggregate gradations for optimized concrete mix designs for Class P concrete. The apparatus required for sampling aggregates and performing sieve analysis shall be as stated in Tex- 400-A, “Sampling Stone, Gravel, and Mineral Aggregates,” and Tex-401-A, “Sieve Analysis of Fine and Coarse Aggregate.”
It requires that the Contractor shall submit sieve analysis reports showing the cumulative combined percent passing, the cumulative combined percent retained, and the combined percent retained as shown in the table below. The sieve analysis reports shall include all standard sieves starting with the nominal maximum aggregate size of the proposed aggregate to the No. 200 sieve. A spreadsheet is provided to aid in the calculations and reporting Those two documents open a new direction for concrete paving in the state because the underlying technology of 80 to 100 year old pavements can be correlated with the new concept. Michigan DOT researched the question when they found old concrete was better than the new. They engaged a firm to research the state records and report the effect of changes in their documents. The final report indicated that the best pavements were cast before 1965. From 1965 to 1980, quality dropped 50%. For
5
several years they have been using the Shilstone technology. The result has been an increase in strength, decrease in cement content, and decrease in permeability.
It is important to note that these documents remove requirements for aggregate grading to meet TxDOT standard sizes. From our knowledge of many parts of Texas, we have found that the locally available aggregates vary widely. Aggregates found near Austin are entirely different from those available in Tyler and all of east Texas. We have found that the best practice is for engineers to inventory the resources available for each site. It doesn’t matter that an aggregate is sold as asphalt aggregate. If it fits in the desired combined aggregate grading, use it. This essentially what was done 70 to 80 years ago and resulted in very long life pavements.
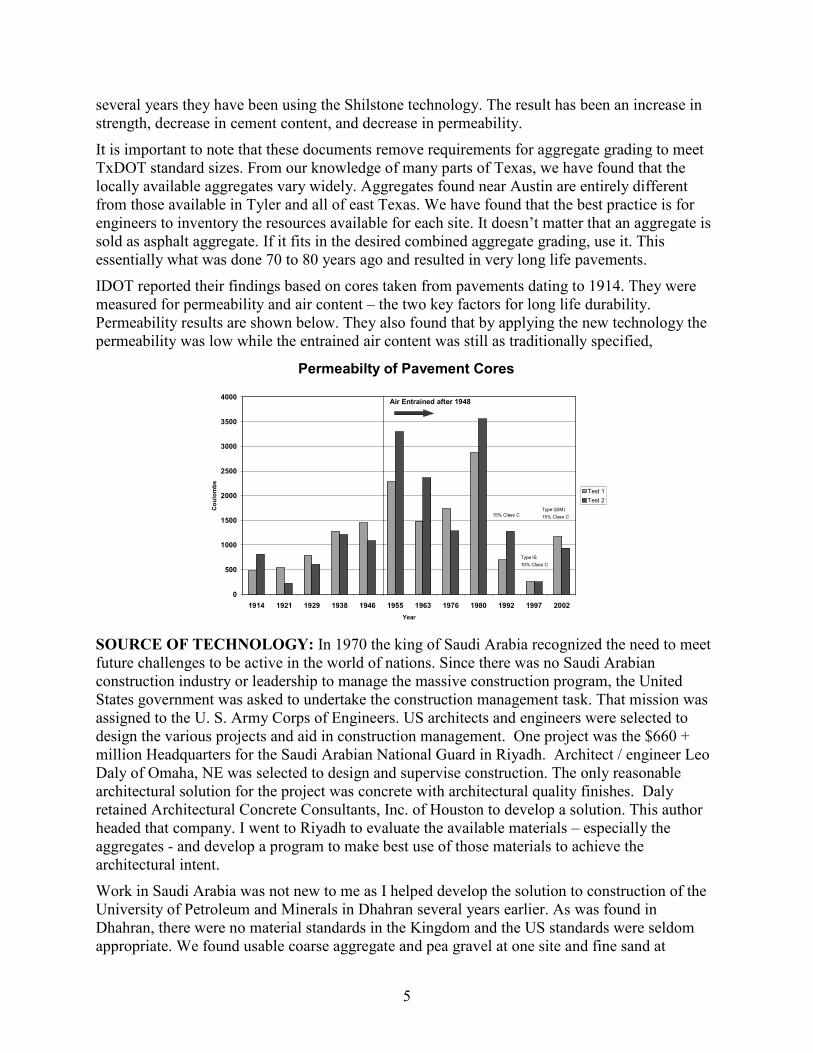
IDOT reported their findings based on cores taken from pavements dating to 1914. They were measured for permeability and air content – the two key factors for long life durability. Permeability results are shown below. They also found that by applying the new technology the permeability was low while the entrained air content was still as traditionally specified,
Permeabilty of Pavement Cores
0
500
1000
1500
2000
2500
3000
3500
4000
1914 1921 1929 1938 1946 1955 1963 1976 1980 1992 1997 2002
Year
Coulombs
Test 1
Test 2
15% Class C
Air Entrained after 1948
Type IS
10% Class C
Type I(SM)
15% Class C
SOURCE OF TECHNOLOGY: In 1970 the king of Saudi Arabia recognized the need to meet future challenges to be active in the world of nations. Since there was no Saudi Arabian construction industry or leadership to manage the massive construction program, the United States government was asked to undertake the construction management task. That mission was assigned to the U. S. Army Corps of Engineers. US architects and engineers were selected to design the various projects and aid in construction management. One project was the $660 + million Headquarters for the Saudi Arabian National Guard in Riyadh. Architect / engineer Leo Daly of Omaha, NE was selected to design and supervise construction. The only reasonable architectural solution for the project was concrete with architectural quality finishes. Daly retained Architectural Concrete Consultants, Inc. of Houston to develop a solution. This author headed that company. I went to Riyadh to evaluate the available materials – especially the aggregates - and develop a program to make best use of those materials to achieve the architectural intent.
Work in Saudi Arabia was not new to me as I helped develop the solution to construction of the University of Petroleum and Minerals in Dhahran several years earlier. As was found in Dhahran, there were no material standards in the Kingdom and the US standards were seldom appropriate. We found usable coarse aggregate and pea gravel at one site and fine sand at
6
another. Samples were collected and flown by the US Air Force to Athens, Greece where a former Corps of Engineers laboratory was located and where we could research and develop the new technology.
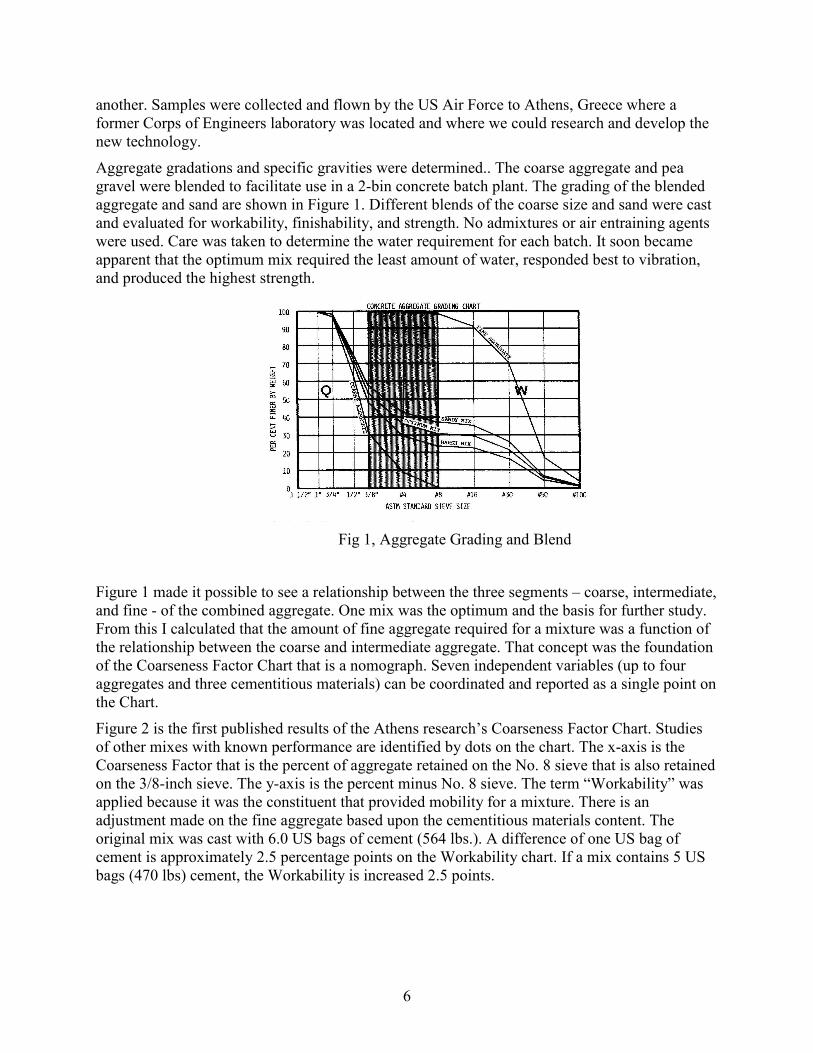
Aggregate gradations and specific gravities were determined.. The coarse aggregate and pea gravel were blended to facilitate use in a 2-bin concrete batch plant. The grading of the blended aggregate and sand are shown in Figure 1. Different blends of the coarse size and sand were cast and evaluated for workability, finishability, and strength. No admixtures or air entraining agents were used. Care was taken to determine the water requirement for each batch. It soon became apparent that the optimum mix required the least amount of water, responded best to vibration, and produced the highest strength.
Fig 1, Aggregate Grading and Blend
Figure 1 made it possible to see a relationship between the three segments – coarse, intermediate, and fine - of the combined aggregate. One mix was the optimum and the basis for further study. From this I calculated that the amount of fine aggregate required for a mixture was a function of the relationship between the coarse and intermediate aggregate. That concept was the foundation of the Coarseness Factor Chart that is a nomograph. Seven independent variables (up to four aggregates and three cementitious materials) can be coordinated and reported as a single point on the Chart.
Figure 2 is the first published results of the Athens research’s Coarseness Factor Chart. Studies of other mixes with known performance are identified by dots on the chart. The x-axis is the Coarseness Factor that is the percent of aggregate retained on the No. 8 sieve that is also retained on the 3/8-inch sieve. The y-axis is the percent minus No. 8 sieve. The term “Workability” was applied because it was the constituent that provided mobility for a mixture. There is an adjustment made on the fine aggregate based upon the cementitious materials content. The original mix was cast with 6.0 US bags of cement (564 lbs.). A difference of one US bag of cement is approximately 2.5 percentage points on the Workability chart. If a mix contains 5 US bags (470 lbs) cement, the Workability is increased 2.5 points.

7
Figure 2 – SANG Initial Chart and Other Mixes
The diagonal bar is known as the “Trend Bar” that divides the sandy mixtures and the very coarse mixtures. The Trend Bar location reflects the changes in fine aggregate requirement as the two coarser sizes become finer. A “100” mixture has no intermediate particles so it is gap-graded. A “0” mixture is a pea gravel mix with nothing retained on the 3/8-ich sieve. A Bar is used to reflect the effects of aggregate shape and texture on mix workability.
The dots in the Trend Bar, or near it, represent intentionally gap graded mixtures – often using masonry sand – to assure a high density of coarse aggregate when the concrete was sand blasted. The SANG mixes were to be used in that manner.
The final SANG report was issued in September 1975. The third section was titled “Conclusions" ending with the statement:
“In summary, this limited scope and time study has been very rewarding and caused, through failure to comply with expected results, an in-depth research of the state-of-the-art and the
evolution of a new concept which bares potential of being a significant breakthrough in
simplicity for concrete mix designed technology in all structural work using hard rock
aggregates appropriate for building construction.”
Within two years the value of the CFC was tested and verified for construction of the new Jeddah International Airport. Slip formed paving was done using tongue and groove center-line joints. I was asked to meet with the German Project Manager for contractor Hochtief to help resolve problems. The engineering had been done by a US firm and US standards were specified. I saw 100 ft of 14-inch runway being cut out. An “army” of Pakistani laborers were placing “crutches” under the tongues to prevent their falling off. The concrete had to be placed within 20 minutes as the aggregates were bone dry and absorbed the free water.
The problem was wind blown segregation of the sand – not covered in ASTM C-33. I suggested that the sand be reprocessed to provide fine and intermediate sizes. The minus 3/8-inch sieve size particles removed from the coarse aggregate should be blended with the coarse (3/8 inch to No.8 sieve) from the fine aggregate. I explained the Coarseness Factor Chart and showed him how to calculate a combined aggregate mix. I visited the site a year later and spoke with the Project Manager. He said they were having no problems and the workers were sent home to Pakistan.

8
Following the Athens research, we conducted a literature search. Among the documents that drew special attention was Lewis Institute Bulletin 1. The research introduced the water-cement ratio vs strength theory. All mixes were based upon the grading of the combined aggregate.
Lewis Institute: In 1914 the Portland Cement Association and Lewis Institute agreed to jointly conduct a 10-year research program aimed at improving the understanding of concrete mix technology. The program was under the direction of Professor Duff Abrams. Before proceeding with the work, the researchers listed questions they wanted to answer. Some of the most significant questions that should be asked today are:
• “What mix is necessary to produce concrete of proper strength for given works?
• “With given materials, what proportions will give the best concrete at minimum cost?
• “With different lots of materials of different characteristics which is the best suited for
the purpose?
• What is the effect on strength of changes in consistency or size and grading of the
aggregate?”
Then they reviewed the then current mix proportioning practices listed below and found they did not fit the need for the accuracy required to provide the answers they sought:
• “There is a difference in mixture design and mixture proportions and they must be considered as work progresses,
• “Arbitrary selection such as 1:2:4 mix, without reference to the size or grading of the
fine and coarse aggregate;
• “Density of aggregates in which the endeavor is made to secure an aggregate of
maximum density;
• “Density of concrete in which the attempt is made to secure concrete of maximum
density;
• “Sieve analysis, in which the grading of the aggregates is made to approximate some
predetermined sieve analysis curve which is considered to give the best results; and
• “Surface area of aggregates.
• “Sieve analysis to approximate density of a combined aggregate.”
The researchers developed the combined aggregate fineness modulus formula. It was the foundation for selecting proportions of aggregates from different sources and with differing characteristics. That research led to the development of the water-cement ratio based upon the absolute volume of the water and the loose volume of one 94-pound bag of cement. The current practice of using mass units was first applied in the mid 1960s.
During the research, Bulletins were issued and adjusted as found necessary. Bulletin 1 is the most important as it led to recognition of the importance of the ratio of water to cement and its affect on strength. Throughout his work, Abrams always stressed the importance of the "water-ratio." Recognition of the water - cement ratio is extremely important for sound control of quality and extending durability. Abrams wrote in the closure to his last issue of the Lewis Institute Bulletin 1:
9
"The above considerations show that the water content is the most important element of a
concrete mix, in that small variations in the water cause a much wider change in strength
than similar variations in cement content or size or grading of the aggregate. This shows
the absurdity of our present practice in specifying definite gradings for aggregates and
carefully proportioning the cement, then guessing at the water. It would be more correct
to carefully measure the water and guess at the cement in the batch."
“The mere use of richer mixes has encouraged a feeling of security, whereas in most cases
nothing more has been established than wasting a large quantity of cement due to an
excess of mixing water. The universal acceptance of this false theory of concrete has
exerted a most pernicious influence on the proper use of concrete materials and has
proven to be an almost insurmountable barrier in the way of progress in the development
of sound principles of concrete proportioning and construction.”
The early researchers reported that the separation of aggregates at the No. 4 sieve was purely arbitrary and used only as an approach to minimize segregation in stock piles.
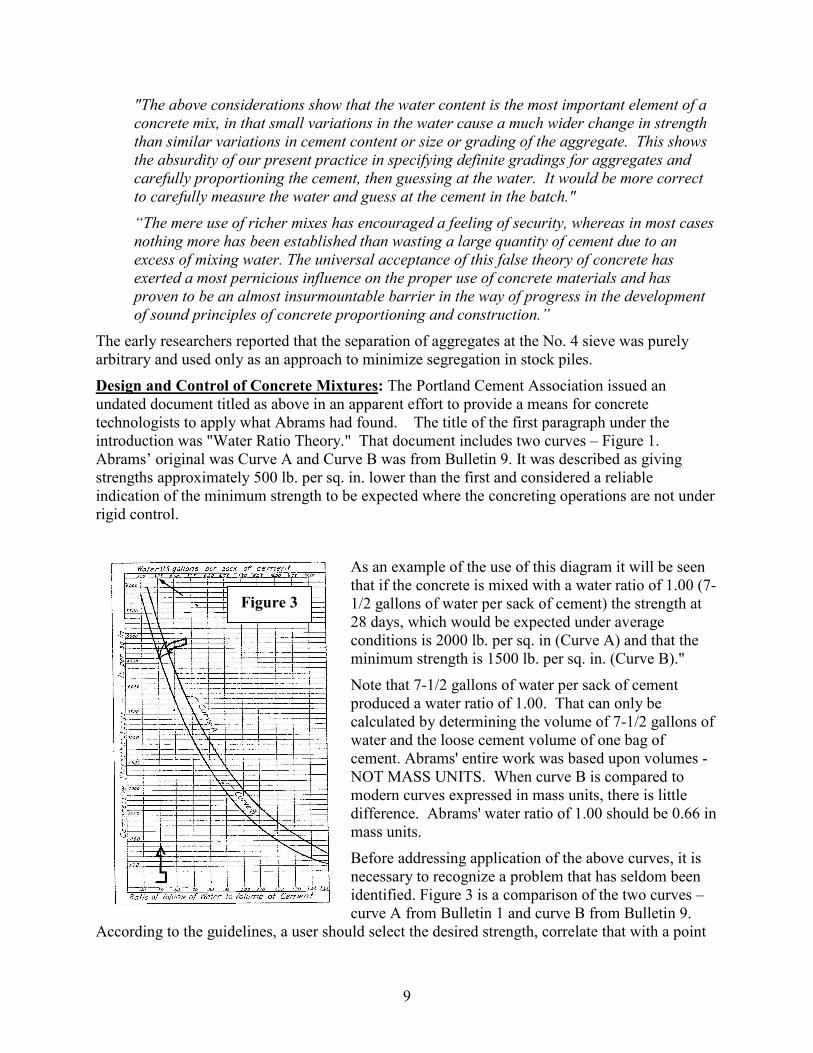
Design and Control of Concrete Mixtures: The Portland Cement Association issued an undated document titled as above in an apparent effort to provide a means for concrete technologists to apply what Abrams had found. The title of the first paragraph under the introduction was "Water Ratio Theory." That document includes two curves – Figure 1. Abrams’ original was Curve A and Curve B was from Bulletin 9. It was described as giving strengths approximately 500 lb. per sq. in. lower than the first and considered a reliable indication of the minimum strength to be expected where the concreting operations are not under rigid control.
As an example of the use of this diagram it will be seen that if the concrete is mixed with a water ratio of 1.00 (7-1/2 gallons of water per sack of cement) the strength at 28 days, which would be expected under average conditions is 2000 lb. per sq. in (Curve A) and that the minimum strength is 1500 lb. per sq. in. (Curve B)."
Note that 7-1/2 gallons of water per sack of cement produced a water ratio of 1.00. That can only be calculated by determining the volume of 7-1/2 gallons of water and the loose cement volume of one bag of cement. Abrams' entire work was based upon volumes - NOT MASS UNITS. When curve B is compared to modern curves expressed in mass units, there is little difference. Abrams' water ratio of 1.00 should be 0.66 in mass units.
Before addressing application of the above curves, it is necessary to recognize a problem that has seldom been identified. Figure 3 is a comparison of the two curves – curve A from Bulletin 1 and curve B from Bulletin 9.
According to the guidelines, a user should select the desired strength, correlate that with a point
Figure 3

10
on Curve B, and trace that to the upper X-axis to determine water requirement in gallons per sack of cement. In the example, a strength of 4,600 psi is appropriate for a 4,000 psi with a safety factor of 20%. The water required 3.75 gallons of water per US bag of cement as shown on the upper X-axis is appropriate for the mixture. A simple calculation of the water–cement ratio in decimals for that mixture is shown on the bottom X-axis. The formula is:
(Gallons of water per sack x 8.33 pounds per gallon) / 62.4 pounds per cubic foot of water =
(3.75 x 8.33) / 62.4 = 0.50
The requirements of ASTM C33-23 included the statement: “Fine aggregate shall be preferably graded from fine to coarse, with the coarser particles predominating.” Such a specification made it possible to assure a well-graded combined aggregate with a 2-bin plant. The ASTM C33 current aggregate grading specification – and AASHTO and DOT standards – make it difficult to avoid gap-grading. ASTM C33 was amended in 2004 to overcome the problem.
The foregoing curves were based upon “old cement” – the cement produced from the 1920s to the 1970s. The effects of changes in C3A, C2S, and fineness of grind of cement in the early 1970s have never been researched much less develop related water-cement ratio vs strength curves shown in Figure 3.
2nd
Edition, Design and Control of Concrete Mixtures: of DCCM, issued in January 1927, followed completion of the 10-year Lewis Institute-PCA research program. It provides an excellent foundation for understanding the practical implications of that research. The last page which provides a list of 18 projects completed in that era, was technical data about the construction and the mixture designs. Some of those projects are still in service and can be evaluated.
The introduction to that document includes the following statement:
"The fundamental requirements of practically all concrete are strength, durability and
economy. These can be obtained only by the proper selection of the materials, and
intelligent design of the mixture and the adoption of prop up methods of mixing and
placing the concrete and protection during the curing period."
The next section is titled "Water--Cement Ratio Strength Law.” The more significant statements are:
"For given materials and conditions of manipulation, the strength of concrete is determined solely by the ratio of the volume of mixing water to the volume of cement so
long as the mixture is plastic and workable. . . . Designing a concrete mix for a given
strength, therefore, consists in selecting the water-cement ratio corresponding to that
strength and finding the most suitable combination of aggregates which will give the
desired workability when mixed with cement and water in this ratio.”
The third section title is "Effect of Water-Cement Ratio on Other Qualities." The opening statement recognizes that the water-cement ratio correlates with other desirable qualities including flexural strength, resistance to wear, modulus of elasticity, and bond between the concrete and reinforcement.:
“The resistance of concrete to the severe conditions of weathering and to the action of
sulfate waters is determined largely by the degree of impermeability. Impermeable
concrete requires non-porous aggregates thoroughly incorporated in a cement paste that
11
itself is impermeable. An impermeable paste requires in turn a low water-cement ratio;
the thorough incorporation of aggregates necessitates a plastic, puddleable mix. Thus
proper control of the mixing water is the vital factor in the production of durable
concrete.”
Early ideas of “low water-cement ratio” were very different from those considered “low” today. Table I in the 2nd Edition describes mixtures to be used for “Roadways, piles, pressure pipe and tanks. Thin structural members in severe exposure. Walls, dams, piers, etc., where exposure to
severe action of water and frost.” It was suggested that construction of such projects required 3000 psi concrete at 28-days with a maximum mixing water content of 6.0 gal per sack of cement. Using the volumetric water-cement ratio of 6.0 gal volume of water to one cubic foot of loose cement volume produced a w/c of 0.80. Today with mass units, 0.53 would be appropriate. A similar water-cement ratio was found in structures cast in that era and still in service.
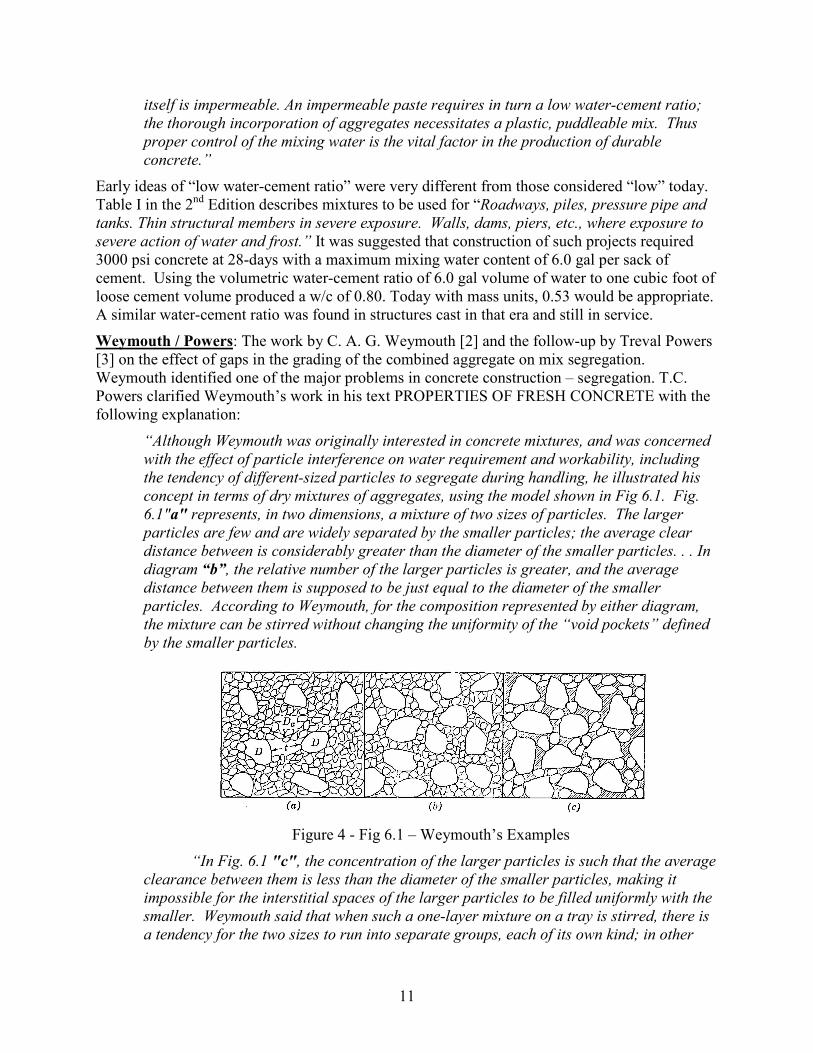
Weymouth / Powers: The work by C. A. G. Weymouth [2] and the follow-up by Treval Powers [3] on the effect of gaps in the grading of the combined aggregate on mix segregation. Weymouth identified one of the major problems in concrete construction – segregation. T.C. Powers clarified Weymouth’s work in his text PROPERTIES OF FRESH CONCRETE with the following explanation:
“Although Weymouth was originally interested in concrete mixtures, and was concerned
with the effect of particle interference on water requirement and workability, including
the tendency of different-sized particles to segregate during handling, he illustrated his
concept in terms of dry mixtures of aggregates, using the model shown in Fig 6.1. Fig.
6.1"a" represents, in two dimensions, a mixture of two sizes of particles. The larger
particles are few and are widely separated by the smaller particles; the average clear
distance between is considerably greater than the diameter of the smaller particles. . . In
diagram “b”, the relative number of the larger particles is greater, and the average
distance between them is supposed to be just equal to the diameter of the smaller
particles. According to Weymouth, for the composition represented by either diagram,
the mixture can be stirred without changing the uniformity of the “void pockets” defined
by the smaller particles.
Figure 4 - Fig 6.1 – Weymouth’s Examples
“In Fig. 6.1 "c", the concentration of the larger particles is such that the average
clearance between them is less than the diameter of the smaller particles, making it
impossible for the interstitial spaces of the larger particles to be filled uniformly with the
smaller. Weymouth said that when such a one-layer mixture on a tray is stirred, there is
a tendency for the two sizes to run into separate groups, each of its own kind; in other

12
words, stirring such a mixture tends to produce segregation of the two sizes. To apply
this observation to a deep mass, he visualized a given size group as forming a sort of grid
structure through which the smaller particles move both horizontally and vertically
during manipulation of the mixture; so long as they can move freely, the mass remains
homogeneous, but if the larger particles interfere with the movement of the smaller,
segregation occurs, and large void pockets are developed with a great loss of strength
and workability.”
Edmund Shaw, Editor of ROCK PRODUCTS was Editor of the publishing company wrote in an introduction to Weymouth’s paper:
“With so many factors to take into consideration, it seems simpler to him to examine
gradings of commercial aggregates and correct them by the addition of those sizes in
which gradings appear to be deficient.”
Shaw’s recommendations were included in ASTM C33-93 and have been expanded since with the addition of new sizes. In 2004, ASTM was revised to provide for the use of combined aggregate grading with that standard governing on materials pertaining to materials quality. ASTM C-33-04 has modified the standard to allow the use of combined aggregate as a means to select mix proportions.
Texas Highway Department, Information Exchange, Issue 1938: Research involving construction of 14 highways followed four years of work in the laboratory to establish guidelines. The motive was to improve the product and, at the same time, reduce the cost. Following the research and highway construction, the State Auditor reported that there was a credit based upon the actual cost savings of $1 million for the previous two years due to a general reduction in the cement factor.
The gradings and other characteristics of the individual fine and coarse we were studied . That was followed by a study of the grading of the combined aggregate. There was special study of the voidage of the combined aggregate in a mixture. They cited the fact that a change from 39% to 35% made a major difference in water requirement for a given consistency. Thus there was a reduction in portland cement. The research followed the principles established by Professor Abrams and of the Lewis Institute. They were assisted by staff from the Bureau of Public Roads.
Fourteen highways were constructed with cement factors varying from two to four bags of cement per cubic yard. Information concerning each project was provided along with a graphic showing the change in strength between cores cast of completion of the project and cores taken six years later. A brief description of each project was provided along with material sources, batch size, cement factor, water factor in gallons per bag, cylinder strength at 28 days, beam strengths, and the average strength and number of cores. The project completion and 6-year core strength are shown on the graph.
That data included six projects with a total length of 51-miles using 4.0 bags (376 pounds) of cement per cubic yard. Test results are shown on Table 1. Based upon that information, the average compressive per pound of cement at 28-day age is 11.81 psi per pound. At 6-year age, the strength produced is 16.39 psi per pound of cement. There has been prior mention of the change in chemistry of cement. That change resulted in an increased early strength and a reduction in a long-term strength. Recent comparisons with varying cement contents and air-entrainment provided compressive strengths at 28 day age: 423 lbs/cuyd and no entrained air =

13
6200 psi and 545 lbs/cuyd and 5% air - 6900 psi. The efficiencies were 14.59 psi per pound and 12.66 psi per pound.
The figure below is a graphical description of the need for a well-graded combined aggregate found in Texas in 1938.
Figure 4 – Aggregate Grading per Texas Highway Department
There appears to be a general correlation between the old cement and new cement when the potential air-entrainment of the old cement is considered. As will be noted in the following section on air-entrainment, the old cements were found to produce entrained air in concrete due to the presence of certain grinding aids used at that time.
Number of cylinders 1031
Average 28-day strength 4440 psi
Number of beams: 764
Average 7-day strength 601 psi
Average 28-day strength 764 psi
Number of cores: 337
Average strength: 4487 psi
Average strength 6-years: 6163 psi
Table 1 – Field Test Results
The Shilstone Companies Inc. developed MS DOS based software that included graphical analysis using the CFC and added asphalt industry’s modified 0.45 Power curve and the Percent of Aggregate Retained on Each Sieve. It has been found that each chart has special applications.
• The CFC shows over-all relationships,
• The 0.45 Power reflects trends and sharp changes, and
• The Percent of Aggregate shows details.

14
Experience has indicated that the CFC is the most important but information from the other two graphics and their supporting data can over-rule what might appear to be a good mix. This is
especially true for the Percent of Aggregate information. The sum of the percent of aggregate retained on two adjacent sieves should not be less than 13% of the combined aggregate. It has been found that when this occurs, that mix will segregate significantly. The adjacent figure includes 5 “Zones.” Each indicates potential mix performance as follows:
Zone I mixes with a Coarseness Factor of 75 or more will tend to segregate, experience edge slump or slough, and/or spall or scale.
Zone II mixes with Coarseness Factor between 45 and 75 will generally perform well. Caution should be exercised if a mix plot falls near Zones I and IV.
Zone III mixes with Coarseness factors less than 45 are similar to Zone II but for smaller top size aggregate.
Zone IV is the triangular portion of the chart above Zones I and II. Such mixes will generally exhibit the most undesirable features of concrete including cracking, spalling, and scaling.
Zone V is for mixes below the Trend Bar. They are too rocky to be readily placed and consolidated.
The CFC was widely tested in the field. The value became clear during construction of a large project that required two ready mixed concrete producers to supply the needs. Mixture proportions were selected by the responsible testing laboratory based upon historical data. When the effects of those mixes were evaluated using the CFC, it was found that the aggregates gradings from the two sources differed widely. One supplier’s mix would be superior to the other. It was necessary to decrease the fines and increase the coarse by approximately 100 pounds per cubic yard to make the mixes equal. Observers thought the change was not necessary but, when the two mixes were tested on the project, there was no difference in placeability or strength.
U.S. Air Force Research: The Air Force was experiencing premature deterioration of the runways in taxiways as early as one year after completion of the construction. This was a major problem because pieces of the small concrete could be sucked into the engines of the aircraft. This was especially a problem with the fighter aircraft. This was not only a problem of safety of the pilot and aircraft but also the cost of reparing the nicks on the impeller blades started at $10,000.
The Civil Engineering Research Foundation was asked to intervene and develop a solution.. A committee was organized with this author as a member. After discussing many possibilities, the committee agreed that many problems were caused by small spalls at construction and saw joints. Segregated mortar rose to the top of the slab and developed a point of weakness on the surface. It was suggested that the Air Force track results of poor performing airfield runways and taxiways. Following a six-month investigation, the investigators found performance was dependent upon aggregate grading. After discussing options, combined aggregate grading and
15
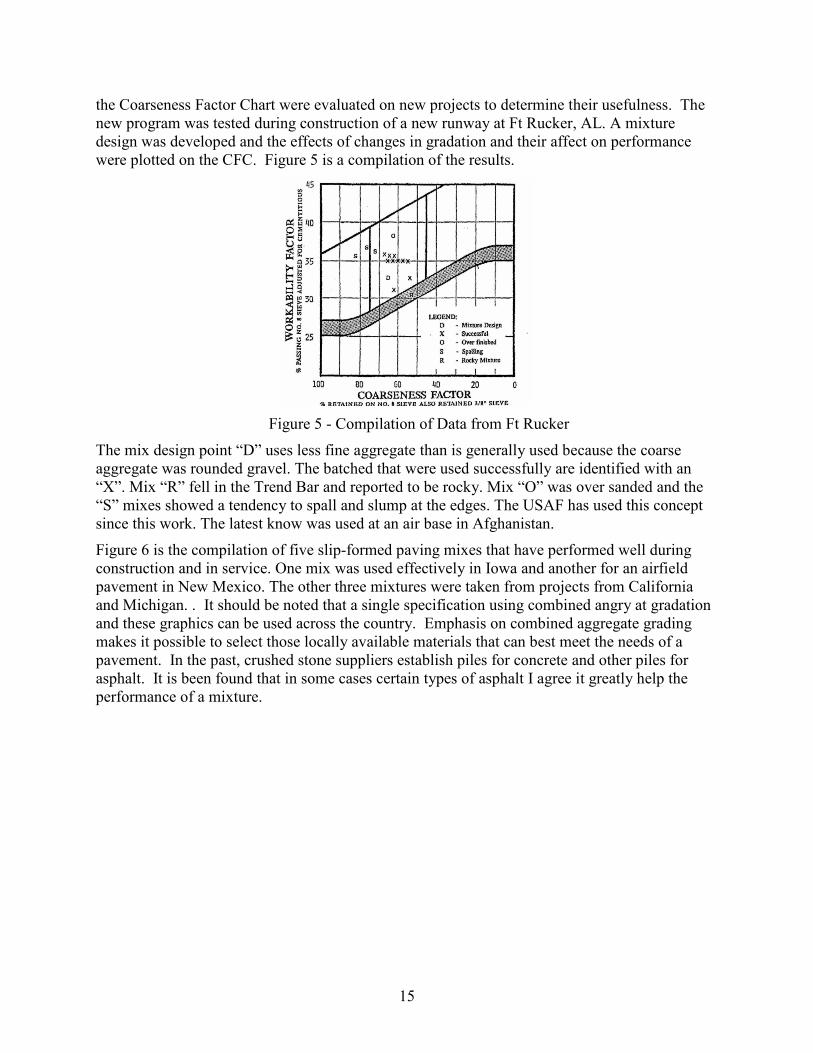
the Coarseness Factor Chart were evaluated on new projects to determine their usefulness. The new program was tested during construction of a new runway at Ft Rucker, AL. A mixture design was developed and the effects of changes in gradation and their affect on performance were plotted on the CFC. Figure 5 is a compilation of the results.
Figure 5 - Compilation of Data from Ft Rucker
The mix design point “D” uses less fine aggregate than is generally used because the coarse aggregate was rounded gravel. The batched that were used successfully are identified with an “X”. Mix “R” fell in the Trend Bar and reported to be rocky. Mix “O” was over sanded and the “S” mixes showed a tendency to spall and slump at the edges. The USAF has used this concept since this work. The latest know was used at an air base in Afghanistan.
Figure 6 is the compilation of five slip-formed paving mixes that have performed well during construction and in service. One mix was used effectively in Iowa and another for an airfield pavement in New Mexico. The other three mixtures were taken from projects from California and Michigan. . It should be noted that a single specification using combined angry at gradation and these graphics can be used across the country. Emphasis on combined aggregate grading makes it possible to select those locally available materials that can best meet the needs of a pavement. In the past, crushed stone suppliers establish piles for concrete and other piles for asphalt. It is been found that in some cases certain types of asphalt I agree it greatly help the performance of a mixture.

16
Figure 6 - Paving Mixes with 1-1/2 – Inch Aggregate
Air Entrained Concrete: One of the projects described in the 2nd Edition of D&CCCM was the Wacker Double-Decked Drive in Chicago. It has long been thought that it, like other old projects, was not air entrained. Recently a sample from the concrete that was replaced in 2002 was examined in the laboratory of Kansas DOT using petrographic methods. Table 2 lists the results of the tests:
Average Chord Intercept -------------------- 0.0074 in.
Voids per Inch -------------------------------- 4.41
Specific Surface (1/in) ----------- ----------- 537.8
Paste to Air Ratio ---------------------------- 7.62
Air Content ----------------------------------- 3.28 %
Spacing Factor ------------------------------- 0.0104 in
Table 2 – Wacker Driver Results by ASTM C 587
Powers in PCA Research Bulletin 94 described the freezing process in such a manner that it can be a model for future discussion. He wrote:
"Water can be caused to freeze in capillary cavities, but it cannot freeze in gel pores. Gel
pores apparently are too small to permit nucleation of ice crystals. The fraction of total
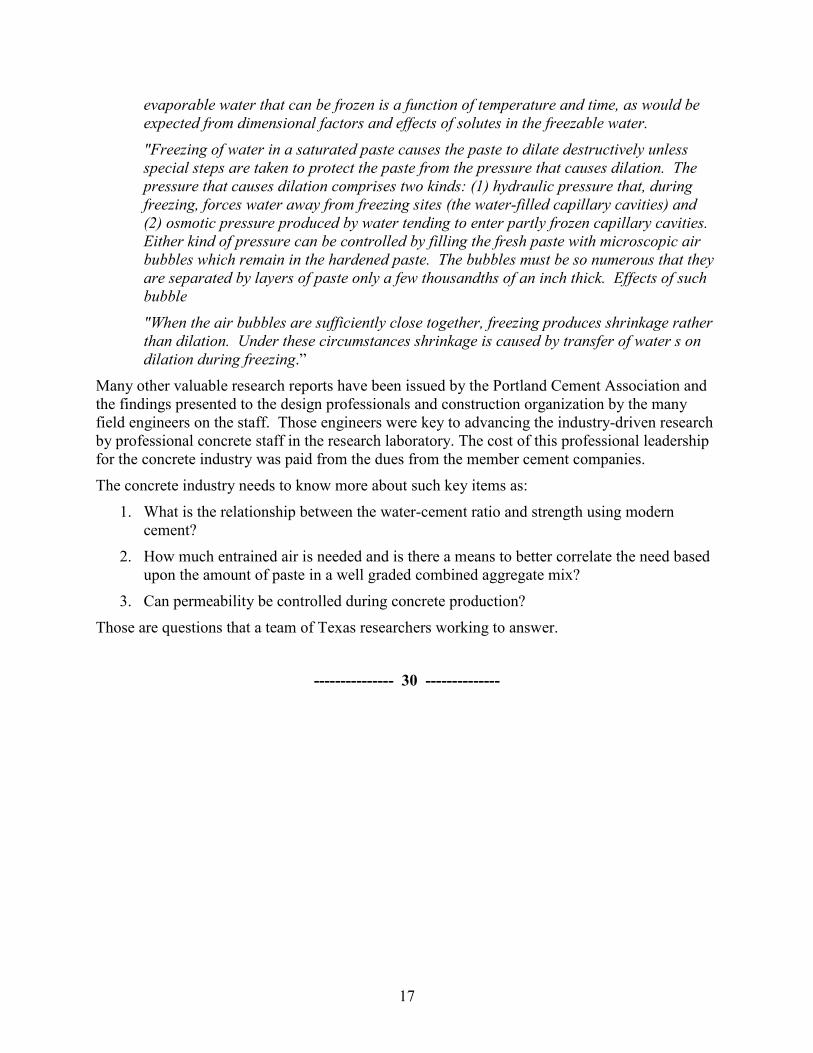
17
evaporable water that can be frozen is a function of temperature and time, as would be
expected from dimensional factors and effects of solutes in the freezable water.
"Freezing of water in a saturated paste causes the paste to dilate destructively unless
special steps are taken to protect the paste from the pressure that causes dilation. The
pressure that causes dilation comprises two kinds: (1) hydraulic pressure that, during
freezing, forces water away from freezing sites (the water-filled capillary cavities) and
(2) osmotic pressure produced by water tending to enter partly frozen capillary cavities.
Either kind of pressure can be controlled by filling the fresh paste with microscopic air
bubbles which remain in the hardened paste. The bubbles must be so numerous that they
are separated by layers of paste only a few thousandths of an inch thick. Effects of such
bubble
"When the air bubbles are sufficiently close together, freezing produces shrinkage rather
than dilation. Under these circumstances shrinkage is caused by transfer of water s on
dilation during freezing.”
Many other valuable research reports have been issued by the Portland Cement Association and the findings presented to the design professionals and construction organization by the many field engineers on the staff. Those engineers were key to advancing the industry-driven research by professional concrete staff in the research laboratory. The cost of this professional leadership for the concrete industry was paid from the dues from the member cement companies.
The concrete industry needs to know more about such key items as:
1. What is the relationship between the water-cement ratio and strength using modern cement?
2. How much entrained air is needed and is there a means to better correlate the need based upon the amount of paste in a well graded combined aggregate mix?
3. Can permeability be controlled during concrete production?
Those are questions that a team of Texas researchers working to answer.
--------------- 30 --------------

18
APPENDIX 1
SPECIAL PROVISION
421---007
Hydraulic Cement Concrete
For this project, Item 421, “Hydraulic Cement Concrete,” of the Standard Specifications, is hereby amended with respect to the clauses cited below, and no other clauses or requirements of this Item are waived or changed hereby. Article 421.2. Materials, Section E.2. Fine Aggregate. The fifth paragraph is voided and replaced by the following: Acid insoluble (%) = {(A1)(P1)+(A2)(P2)}/100 where:
A1 = acid insoluble (%) of aggregate 1 A2 = acid insoluble (%) of aggregate 2 P1 = percent by weight of aggregate 1 of the fine aggregate blend P2 = percent by weight of aggregate 2 of the fine aggregate blend
Article 421.2. Materials, Section E.2. Fine Aggregate. The eighth paragraph is voided and replaced by the following: For all classes of concrete, provide fine aggregate with a fineness modulus between 2.30 and 3.10 as determined by Tex-402-A.
Article 421.2. Materials, Section E. Aggregate. is supplemented by the following:
4. Optimized Aggregate Gradation. Provide coarse and fine aggregates meeting the requirements in Sections 421.2.E.1 and 421.2.E.2, unless otherwise stated. Coarse and fine aggregate gradation charts shown in Sections 421.2.E.1 and 421.2.E.2 will not apply for aggregates used for optimized concrete mix designs. Sample and test coarse and fine aggregates as specified below.
Contractor Material QC Sampling and Testing Frequencies
Material Test Method Frequency1
Coarse Aggregate Sieve Analysis Tex-401-A Minimum of 2 per day
Fine Aggregate Sieve Analysis Tex-401-A Minimum of 2 per day 1. 1 test per day for concrete pours less than 200 cubic yards.
When multiple coarse aggregate grades are blended to produce an optimum gradation, use the following equation to determine the loss by decantation for the combined coarse aggregates. Total Loss by Decantation (%) = {Σ(Pi)(Di)}/100 Where:

19
Pi = percent of coarse aggregatei of the combined coarse aggregate Di = loss by decantation of aggregatei
Submit sieve analysis reports showing the cumulative combined percent passing, the cumulative combined percent retained, and the combined percent retained, including all standard sieves starting with the nominal maximum aggregate size to the No. 200 sieve. Use the following charts, developed in accordance with Tex-470-A, “Optimized Aggregate Gradation for Hydraulic Cement Concrete Mix Designs,” to determine the optimum combined aggregate gradation: • Coarseness Factor Chart, • Percent Retained Chart, and • 0.45 Power Chart.
Article 421.4. Construction, Section A. Classification and Mix Design, Section 6. Mix
Design Options. The second paragraph is voided and replaced by the following: For concrete classes not identified as structural concrete in Table 5 and designed using less than 520 lb. of cementitious material per cubic yard, use one of the mix design Options 1-8 shown below, except that Class C fly ash may be used instead of Class F fly ash for Options 1, 3, and 4 unless sulfate-resistant concrete is shown on the plans.
Article 421.4. Construction, Section A. Classification and Mix Design, Section 6. Mix
Design Options, Section c. Option 3 is voided and replaced by the following:
c. Option 3. Replace 35 to 50% of the cement with a combination of Class F fly ash, GGBFS, UFFA, metakaolin, or silica fume. However, no more than 35% may be fly ash, and no more than 10% may be silica fume.
Article 421.4. Construction, Section A. Classification and Mix Design is supplemented by the following:
7. Concrete Mix Designs with Optimized Aggregate Gradation. When shown on the plans, design Class P, C, F, S, DC, CO, SS, K concrete, meeting the strength requirements as specified in Items 360, 420, and 421, using optimized aggregate gradations meeting the requirements of Section 421.2.E.4. Submit concrete mix design in the Concrete Works program format. Concrete Works program will be supplied to the Contractor and supplier. A class will be held to educate on the use of the Concrete Works program. Submit proposed concrete mix design information including: • material source information, • material property information, • combined aggregate sieve analysis and charts according to Tex-470-A,” Optimized Aggregate Gradation for Hydraulic Cement Concrete Mix Designs,” • concrete mix design proportions, and • results from trial batches.

20
During concrete production, monitor the aggregate gradation by plotting the results of each sieve analysis on the coarseness factor chart, percent retained chart, and 0.45 power chart in accordance with Tex-470-A “Optimized Aggregate Gradation for Hydraulic Cement Concrete Mix Designs.” Perform the first sieve analysis before each production day. Adjust aggregate proportions, if necessary, to keep the coarseness factor and workability factor plotted within the workability box on the coarseness factor chart as described in Tex-470-A, “Optimized Aggregate Gradation for Hydraulic Cement Concrete Mix Designs.” Adjustments to the aggregate proportions that also require adjustments to water or cementitious material contents will require development of new concrete mix proportions and results from trial batches.

21
APPENDIX 2
Section #. Tex-470-A, Optimized Aggregate Gradation for Portland Cement Concrete Mix
Designs
Overview
This method outlines the procedure for analyzing combined aggregate gradations for optimized concrete mix designs for Class P concrete.
Apparatus
The apparatus required for sampling aggregates and performing sieve analysis shall be as stated in Tex- 400-A, “Sampling Stone, Gravel, and Mineral Aggregates,” and Tex-401-A, “Sieve Analysis of Fine and Coarse Aggregate.”
Procedure
The Contractor shall submit sieve analysis reports showing the cumulative combined percent passing, the cumulative combined percent retained, and the combined percent retained as shown in the table below. The sieve analysis reports shall include all standard sieves starting with the nominal maximum aggregate size of the proposed aggregate to the No. 200 sieve. The Contractor shall also submit the following charts used to perform aggregate gradation analysis:
♦ Coarseness Factor Chart,
♦ 0.45 Power Chart, and
♦ Percent Retained Chart.
Perform sieve analysis as per Tex-401-A for each aggregate that will be used in the optimized mix design. The percent passing and the percent of each aggregate used in the proposed mix design shall be filled into the sieve analysis table shown below.
Sieve Analysis Table
Sieve
Size
Coarse
Agg. 1
%
passing
Coarse
Agg. 2
%
Passing
Coarse
Agg. 3
%
Passing
Fine Agg. 1
% Passing
Fine Agg. 2
% Passing
Cumulative
Combined
% Passing
Cumulative
Combined
% Retained
Combined
% Retained
2 in 100 100 100 100 0 0
1 ½ in 100 100 100 100 0 0
1 in 95 100 100 98 2 2
¾ in 62 100 100 81 19 17
½ in 35 100 100 67 33 14
3/8 in 20 95 100 59 41 8
No. 4 1 65 100 46 54 13
No. 8 1 96 36 64 10
No. 16 79 29 71 7
No. 30 45 17 83 12
No. 50 17 6 94 11
No. 100 7 3 97 3
No. 200 2 1 99 3
Pan 0 0 100 1
Percent
of Agg. 50% 13% 0% 37% 0%

22
The percent of each aggregate used shall be determined by the gradation analysis.
The cumulative combined percent passing each sieve is calculated using the following equation:
Cumulative Combined % Passing = ∑{(% Passing of Aggregatei)(% of Aggregatei)
The cumulative combined percent retained on each sieve is calculated using the following equation:
Cumulative Combined % Ret. = 100% - Cumulative Combined % Passing
The combined percent retained on each sieve is calculated using the following equation:
Comb. % Ret. = Cum. Comb. % Ret. - Cum. Comb. % Ret. of next larger sieve
Coarseness Factor Chart
The cumulative combined sieve analysis shall be used to determine the coarseness and workability factors. The coarseness and workability factors shall be plotted on the Coarseness Factor Chart (Figure 1).
The coarseness factor is determined by using the following equation:
100Sieve8No.onRetained Cumulative%
Sievein.3/8onRetained Cumulative%FactorCoarseness ×=
The workability factor is the cumulative combined percent passing the No. 8 sieve. The workability factor shall be increased by 2.5 percentage points for every 94 lbs. per cu.yd. of cementitious material used in excess of 564 lbs. per cu. yd. in the mix design. The workability factor shall be decreased by 2.5 percentage points for every 94 lbs. per cu.yd. of cementitious material used below 564 lbs. cu. yd. in the mix design. The workability factor shall not be adjusted if the amount of cementitious material is 564 lbs. per cu. yd.
The coarseness factor and workability factor shall be plotted within the workability box defined as follows:
♦ the coarseness factor shall not be greater than 68 or less than 52,
♦ the workability factor shall not be greater than 38 or less than 34 when the coarseness factor is 52, and
♦ the workability factor shall not be greater than 36 or less than 32 when the coarseness factor is 68.
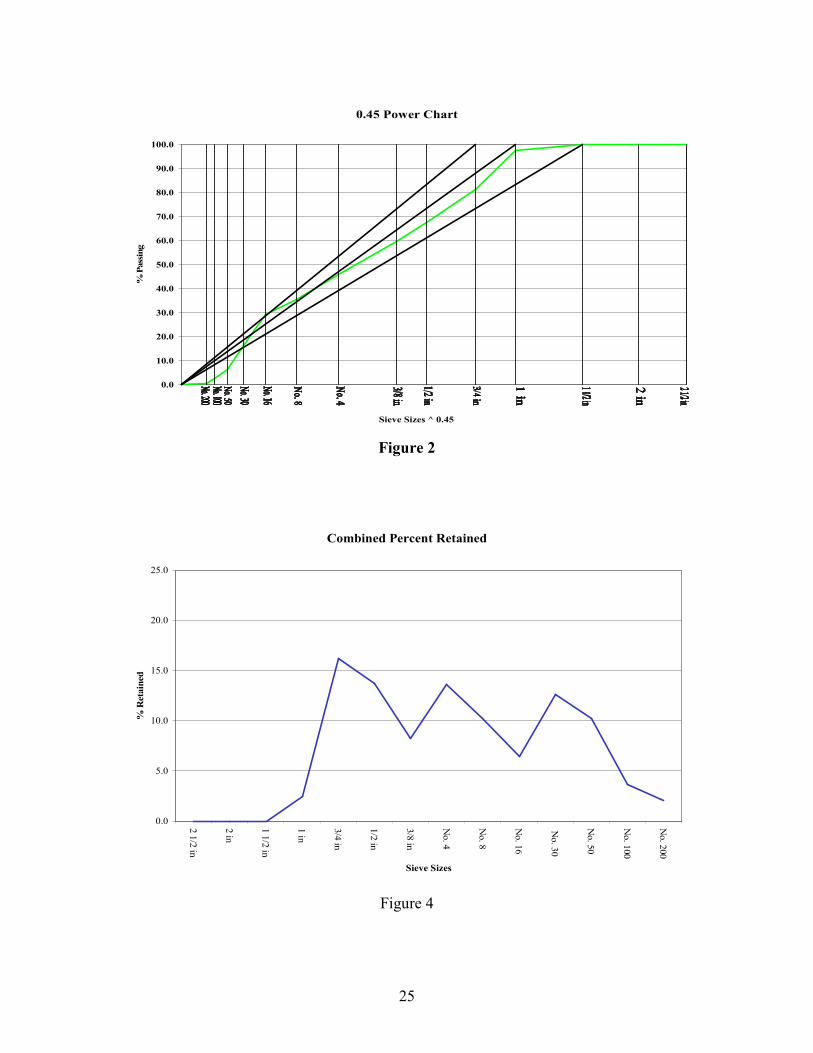
0.45 Power Chart
The 0.45 Power Chart (Figure 2) is created by plotting the cumulative percent passing (y-axis) vs. the sieve sizes raised to the power of 0.45 (x-axis). The cumulative percent passing should generally follow the maximum density line and should not deviate beyond the maximum and minimum tolerance lines. However, there typically will be a “hump,” possibly beyond the tolerance line, above the maximum density line around the No. 16 sieve. There will always be a dip below the maximum density line around the No. 30 sieve. These deviations are typical and should not be cause for rejection of a gradation unless results from trial batches indicate workability problems.

23
The maximum density line is a straight line calculated with the following equation:
45.0
D
d Passing %
=
where:
d = sieve size being considered
D = nominal maximum sieve size
The nominal maximum sieve size is one sieve larger than the first sieve to have ≤ 90 percent passing.
The tolerance lines are straight lines drawn on either side of the maximum density line. The tolerance lines are drawn from the origin of the chart to 100 percent of the next sieve size smaller and larger than the maximum density sieve size.
Percent Retained Chart
The Percent Retained Chart (Figure 3) is created by plotting the combined percent retained (y-axis) vs. the sieve sizes (x-axis). The sum of the percent retained on any two adjacent sieves, excluding the first and last sieve that retains material, shall not be less than 13%.
Electronic Spreadsheet
The attached Excel workbook may be used to perform the aggregate gradation analysis. This Excel workbook allows the user to input sieve analysis results and aggregate percentages, and it creates all of the charts needed for aggregate proportions selection. Double click on the icon to open the workbook.
Optimized Aggregate Gradation
Selection of Optimized Aggregate Gradation
The aggregate gradations and proportions that plot within the limits of the three charts described above should be used as the basis for trail batches. Trial batches, with varying aggregate proportions that meet the limits of the three charts, should be performed to determine which concrete mix proportions meet the strength requirements.
The Engineer may allow the use of aggregate gradations and proportions that exceed the limits of the 0.45 power chart and the percent retained chart provided the coarseness and workability
24
factors plot within the workability box on the coarseness factor chart and the trial batch results meet all requirements.
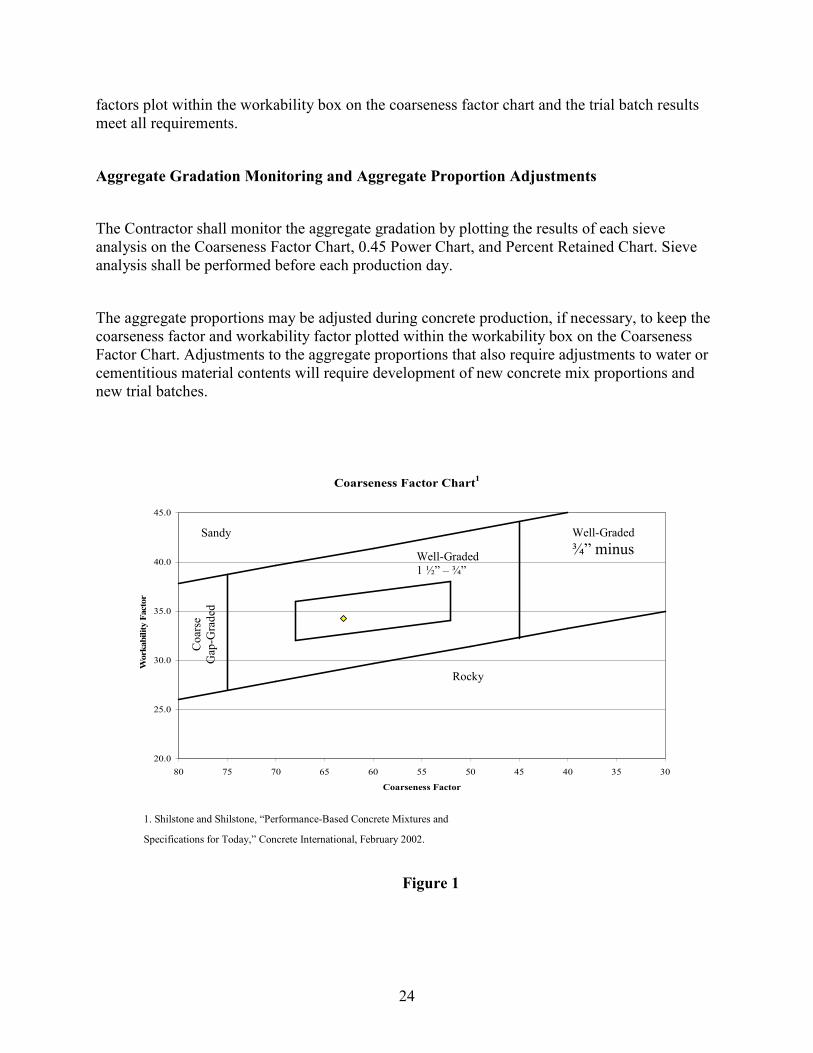
Aggregate Gradation Monitoring and Aggregate Proportion Adjustments
The Contractor shall monitor the aggregate gradation by plotting the results of each sieve analysis on the Coarseness Factor Chart, 0.45 Power Chart, and Percent Retained Chart. Sieve analysis shall be performed before each production day.
The aggregate proportions may be adjusted during concrete production, if necessary, to keep the coarseness factor and workability factor plotted within the workability box on the Coarseness Factor Chart. Adjustments to the aggregate proportions that also require adjustments to water or cementitious material contents will require development of new concrete mix proportions and new trial batches.
Coarseness Factor Chart1
20.0
25.0
30.0
35.0
40.0
45.0
3035404550556065707580
Coarseness Factor
Work
ability F
acto
r
1. Shilstone and Shilstone, “Performance-Based Concrete Mixtures and
Specifications for Today,” Concrete International, February 2002.
Figure 1
Rocky
Sandy Well-Graded
¾” minus Well-Graded 1 ½” – ¾”
Coarse
Gap-Graded
25
0.45 Power Chart
0.0
10.0
20.0
30.0
40.0
50.0
60.0
70.0
80.0
90.0
100.0
Sieve Sizes ^ 0.45
% P
ass
ing
Figure 2
Combined Percent Retained
0.0
5.0
10.0
15.0
20.0
25.0
2 1/2 in
2 in
1 1/2 in
1 in
3/4 in
1/2 in
3/8 in
No. 4
No. 8
No. 16
No. 30
No. 50
No. 100
No. 200
Sieve Sizes
% R
etain
ed
Figure 4