two-ways to fix our downtown neighborhoodssun.louisville.edu/pdfs/love is a two-way...
TRANSCRIPT

Two-Ways to Fix Our Downtown
Neighborhoods
John Gilderbloom, PhD –Professor of Urban Planning, University of Louisville
William Riggs, Ph.D, AICP, LEED, AP—California Polytchnic State University
With Zaria Murrell, MD—Pediatric Surgeon, U of Louisville School of Medicine
Emmanuel Frimpong Boamah, University of Louisville
Nick York – Hendrix College
Samantha Alexis Smith – University of Louisville
Brad Cronin – Louisville, KY
Thomas Duffy III – Louisville, KY
Winston Mitchell Scott—University of Louisville
Wesley Meares, PhD – Georgia Regents University
Chad Frederick, MUEP – University of Louisville

One Strategy to Regenerate
Neighborhoods
▫ Conversation of one to two-way What are the impacts?
▫ If they can improve neighborhoods they could be a potential regeneration strategy for a myriad of mid-size cities: Nashville Charleston Indianapolis Denver San Antonio Louisville
COMPLETE STREET POLICY • Streets for EVERYONE, regardless of age or
ability!
▫ Pedestrians
▫ Bicyclists
▫ Motorists
▫ Transit riders
▫ Baby carriages
▫ Skaters
▫ Scooters

COMPLETE STREET POLICY • Streets are the life-blood of cities, simply put it is
where life occurs.
• It is where citizens interact with each other and the policies of the locality every day.
• The streets of a city are a significant determinate of whether the neighborhood is hostile towards pedestrians or is a home for multiple modes of transportation.

COMPLETE STREET POLICY

Difference Between One and Two Way
One Way
Tracts
(N=22)
Two-Way
Tracts
(N=168)
Differenc
e
Tract Area (acres) 0.5 2.3 -1.8
Population 2606.1 3927.4 -1321.3
HS Educated 76.5 83.8 -7.3
Minority Population 1986.0 1011.2 974.8
Percent Minority 74.9 24.9 50.0
Percent Below Poverty
Level 42.8 14.0 28.8
Median Household
Income 20554.7 49170.7 -28616.0
Median Family Income 27310.6 65183.0 -37872.4
Average Life Expect 65.2 74.5 -9.3
Percent Employed 45.2 58.2 -13.0
Percent Unemployed 11.5 5.9 5.6
Number in HH 1108.7 1589.3 -480.6
Number of Non-
Hispanics 620.1 2916.2 -2296.1
Total Housing 1413.3 1744.9 -331.6
Median Housing Age 68.3 42.0 26.3
Owned 370.7 1068.1 -697.4
Rented 738.0 521.3 216.7
Percent Vacant 20.9 8.6 12.3
Average SQFT 19.3 7.6 11.7
Median Assessed
Housing 64681.7 152629.2 -87947.5
Walkscore 56.4 34.4 22.0
Average House Size 2.3 2.3 0.0
Median Age 34.1 37.0 -2.9
Distance to CBD 2.5 8.5 -6.0
Total Crime 536.5 296.6 239.9
Total 1-year Collisions 367.0 241.0 126.0
Injuries 62.2 25.8 36.4
Table 1: Means Comparison of Tracts with One-way vs. Other Segments Source: 2010 Census, Louisville PVA, Walkscore, Kentucky State Police

Impact of One-ways on Collisions:
Regression
Standardized
Coefficients
t Sig.
Beta
(Constant) 2.614 ***
Total Collisions 16.029 3.079 ***
Auto Collisions -13.598 -2.651 ***
Fatalities -.056 -.676 ---
Injuries .323 2.234 *** a. Statistical Significance: *** (p<0.05) ** (0.05<p<0.10 * (0.10<p<0.20)
b. Dependent Variable: One Way Segments
c. R2 = .176

Impact of One-ways on Housing and
Crime: Regression
Standardized
Coefficients
t Sig. Beta
(Constant) -2.541 ***
Average Square Feet of the
Neighborhood Housing 1.221 8.523 ***
Mean Assessed Value (MAV) in 2006
(in dollars) -1.218 -6.706 ***
Nominal % change in MAV, 06-08
(ratio*100) -.178 -2.632 ***
Foreclosure Rate -.050 -.716 ---
Crime Rate (per 100,000) -.083 -1.004 ---
Walkscore .149 1.923 **
Family Poverty 2000 -.111 -1.197 ---
Average Household Size .124 1.591 *
Percent Minority .305 3.435 ***

A Tale of Two
Streets
Louisville, KY
• Brook and First Streets ▫ One way multi-lane
parallel streets since the 1950’s
▫ Converted to a two way, single lane street with a bike lane in Summer 2011
• So what happened?
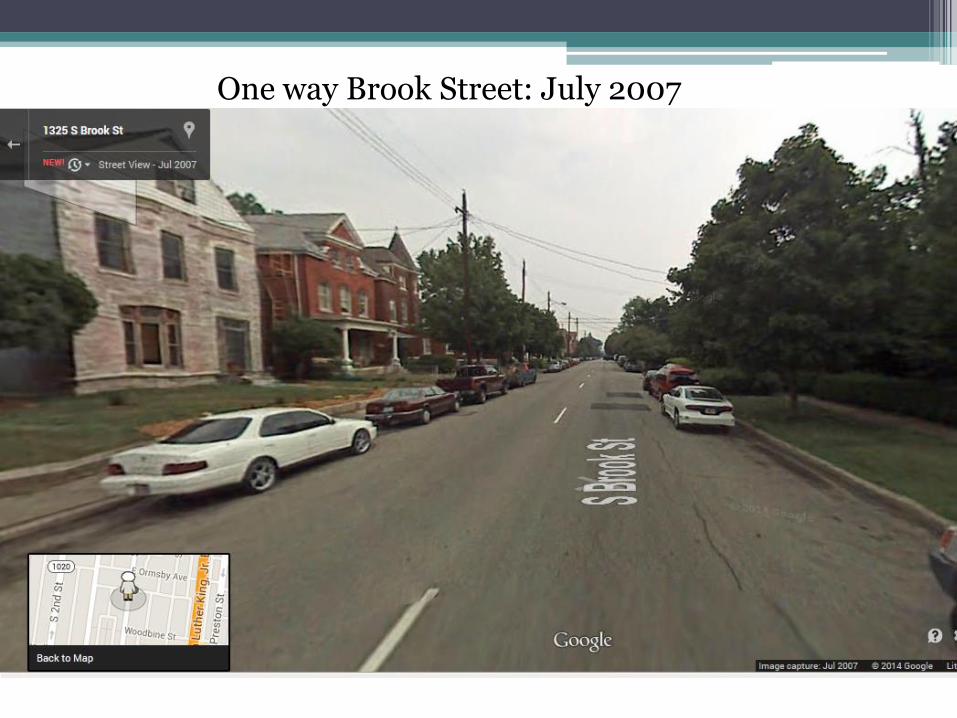
One way Brook Street: July 2007

Two-way Brook Street August 2011

A Tale of Two City-Streets
Louisville, KY
•First & Brook now two-way streets 2011-2013
• Decreased
• Collisions:
• 36% on Brook
• 60% on First
• Crime 23%
• Increased
• Traffic Volumes
• Calmer traffic
• Pedestrian & bike traffic
• Business revenues
• Property Improvements: 2x
• Property Values:
• 39% on Brook
• Taxes

Do one vs. two-way streets matter?
• Methods:
▫ Traffic / Accidents
▫ Housing valuation / Property Taxes
▫ Crime
▫ Photographs & Qualitative

Traffic / Accidents
Significant decrease in accidents despite slight increase in volumes

Do one vs. two-way streets matter?
• Methods:
▫ Traffic / Accidents
▫ Housing valuation / Property Taxes
▫ Crime
▫ Photographs & Qualitative
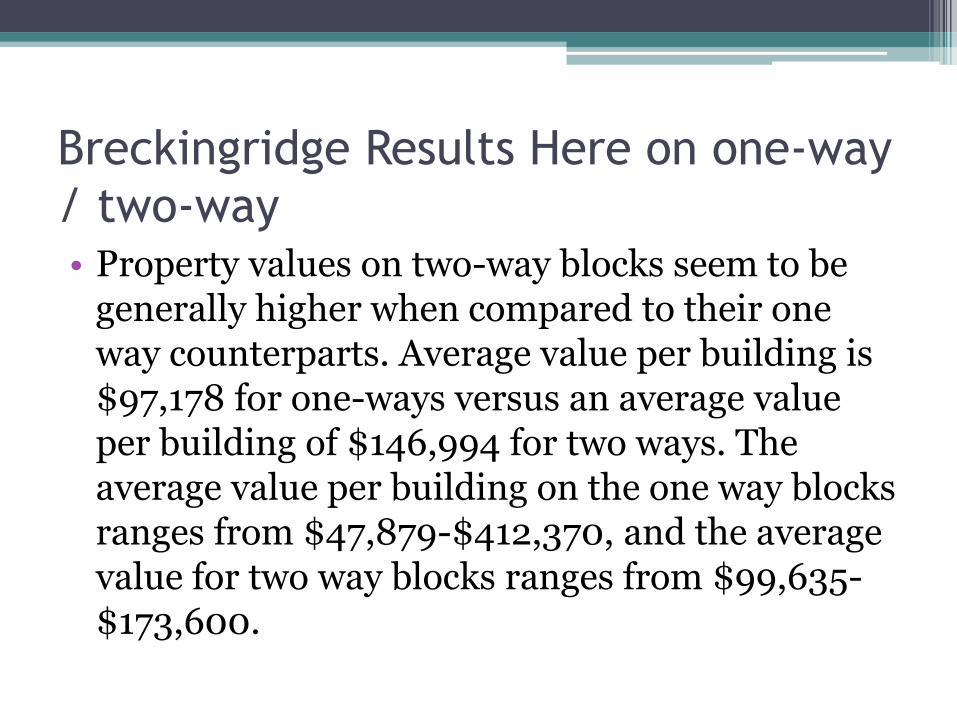
Breckingridge Results Here on one-way
/ two-way • Property values on two-way blocks seem to be
generally higher when compared to their one way counterparts. Average value per building is $97,178 for one-ways versus an average value per building of $146,994 for two ways. The average value per building on the one way blocks ranges from $47,879-$412,370, and the average value for two way blocks ranges from $99,635-$173,600.

Housing Valuation / Property Taxes
Block One-Way or Two-Way Total Value of Buildings Total Property Tax
on Buildings
200 One-Way $ 632,050
$ 8369
300 One-Way $ 1,231,940
$ 16312
1400 One-Way $ 824,180
$ 10913
500 One-Way $ 912,120
$ 12077
600 One-Way $ 836,520
$ 11076
700 One-Way $ 1,340,620
$ 17751
900 One-Way $ 824,740
$ 10920
1000 One-Way $ 2,768,890
$ 36663
1100 One-Way $ 1,976,780
$ 26175
1200 One-Way $ 2,159,930
$ 28600
1300 Two-Way $ 1,693,810
$ 22428
1400 Two-Way $ 4,860,800
$ 64362
1500 Two-Way $ 3,147,050
$ 41670
TABLE 2. Property Taxes Paid by Block Breckinridge

Oak Street
• Property values on two-way blocks seem to be generally higher when compared to their one way counterparts. Average value per building is $74,083 for one-ways versus an average value per building of $134,302 for two ways. The average value per building on the one way blocks ranges from $55,500-$96,430; the average value for two way blocks ranges from $54,400 to $242,885.

Block No. of
Buildings
Property Value One-way OR
Two-Way Total Value Average Value per Building
400E 18 $1,024,170 $55,500 One-way
500E 34 $1,722,210 $66,045 One-way
600E 32 $2,382,150 $68,900 One-way
700E 24 $1,729,260 $88,460 One-way
900E 39 $2,742,490 $70,250 One-way
1000E 63 $3,403,580 $73,000 One-way
300E 13 $385,690 $96,430 One-way
500W 14 $1,558,710 $114,100 Two-way
400W 7 $1,534,500 $239,260 Two-way
200W 2 $102,000 $102,000 Two-way
100W 8 $847,050 $151,560 Two-way
100E 11 $2,169,960 $106,000 Two-way
200E 18 $2,308,670 $110,000 Two-way
1100E 7 $388,100 $54,400 Two-way
1200E 7 $2,127,260 $242,885 Two-way
1300E 21 $2,480,690 $117,720.00 Two-way
1400E 34 $4,360,070 $132,965.00 Two-way
1500E 10 $1,171,500 $101,035.00 Two-way
1600E 3 $431,150 $139,710.00 Two-way
Property Valuation by Block – Oak Street

Property Taxes Cont.
• Average for one-way streets is: $17,886
• Average for two-way streets is: $42,820
▫ Increased property taxes could pay for conversion.
▫ >$250,000 lost taxes
▫ West Louisville: multi-lane one-way streets lose ~$2 million in taxes

Do one vs. two-way streets matter?
• Methods:
▫ Traffic / Accidents
▫ Housing valuation / Property Taxes
▫ Crime
▫ Photographs & Qualitative
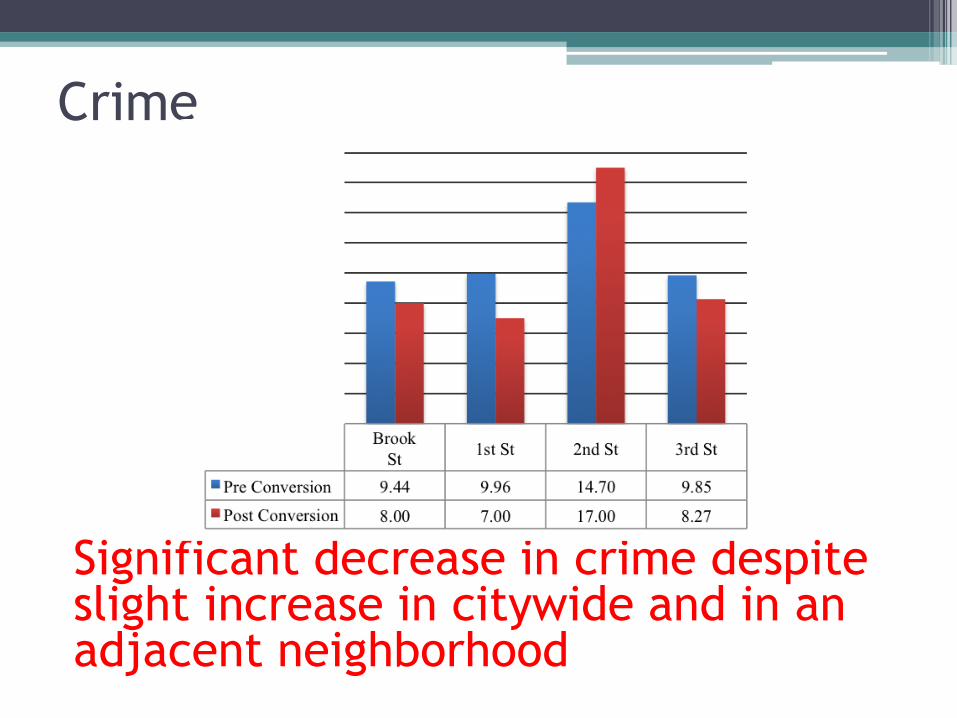
Crime
Significant decrease in crime despite slight increase in citywide and in an adjacent neighborhood

Do one vs. two-way streets matter?
• Methods:
▫ Traffic / Accidents
▫ Housing valuation / Property Taxes
▫ Crime
▫ Photographs & Qualitative
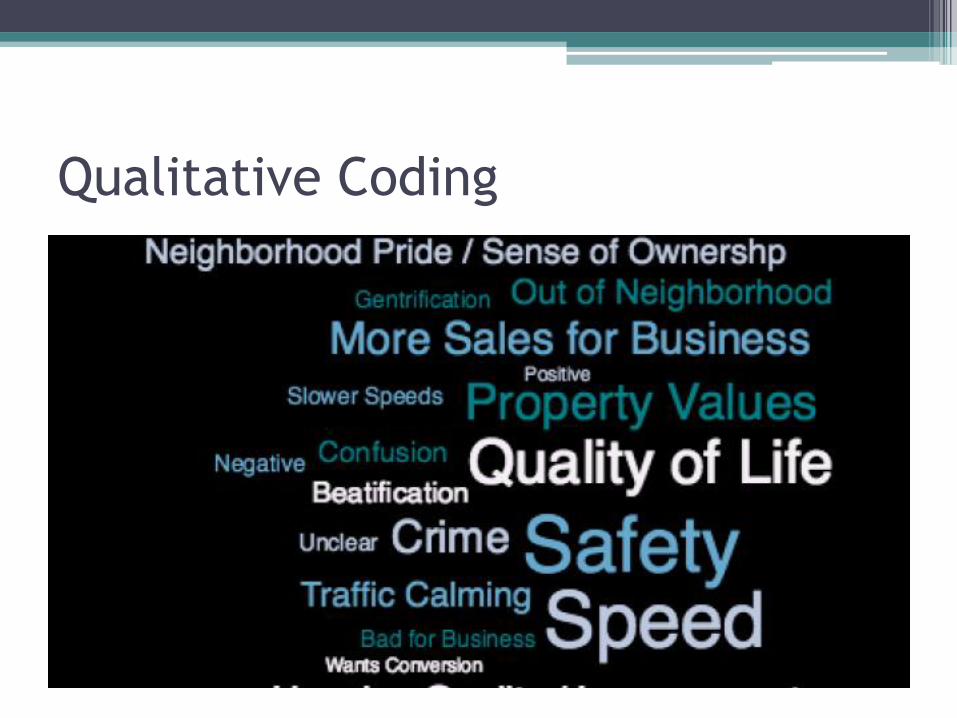
Qualitative Coding

Photos tell a story of speeds up to 50-60 mph during the am peak on one-way segments (limit is 35 mph)

And slower streets with well maintained sidewalks on two-way segments

Photos tell the story of thriving business on two-way
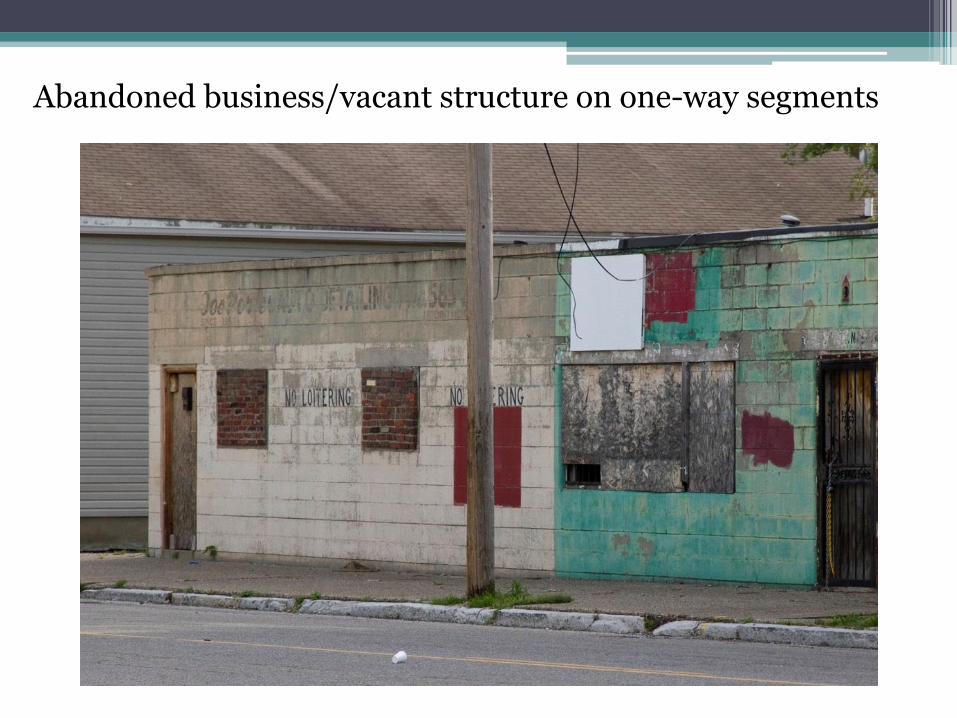
Abandoned business/vacant structure on one-way segments

Many Individuals Expressed Socio-
Economic and Health Concerns Before
Traffic Safety
• More businesses / jobs
• Cleaner air / environment / less health problems
• Less crime / drugs / prostitution
• More community / “we-ness”


Across America there is a movement
for Two way Streets!

Summary
• Two way streets are great for ▫ Traffic Safety ▫ Home values (especially for low and moderate
income) ▫ People & children / health ▫ Local businesses ▫ Reduce crime ▫ Less foreclosure
• Calm streets helps to regenerate neighborhoods.

Paul Goodman in 1959
• “A man has only one life and if during it he has no great environment, no community, he has been irreparably robbed of a human right.”

Looking for a Great Planning School?
• Both CalPoly and Louisville have nationally ranked planning schools
• We lead the nation in doing cutting edge sustainability research and have funding available
http://sun.louisville.edu http://www.planning.calpoly.edu


Block One-way OR Two-Way Number of Trees
400E One-way 6
500E One-way 8
600E One-way 16
700E One-way 13
900E One-way 4
1000E One-way 5
300E One-way 0
500W Two-way 29
400W Two-way 19
200W Two-way 12
100W Two-way 19
100E Two-way 14
200E Two-way 27
1100E Two-way 2
1200E Two-way 0
1300E Two-way 4
1400E Two-way 0
1500E Two-way 0
1600E Two-way 0
Table 7. Presence of Street Trees by Block on Oak Street
