two-stage sampling in surveys to substantiate freedom from ... · disease in livestock populations...
TRANSCRIPT

ELSEVIER Preventive Veterinary Medicine 34 (1998) 19-30
Two-stage sampling in surveys to substantiate freedom from disease
Angus R. Cameron a, F. Chris Baldock b, * a Lao- Australian Animal Health Project, PO Box 7042, Vientiane, Laos
b AusVet Animal Health Services, 12 Thalia Court, Corinda, Queensland 4075, Australia
Accepted 18 July 1997
Abstract
Disease in livestock populations tends to cluster at the herd level. In order to account for this-and to overcome the problems of simple random sampling from a very large population- large-scale livestock surveys usually involve two-stage sampling. However, the use of two-stage
sampling presents particular problems for sample-size calculation and analysis. We developed a probability formula for two-stage sampling, initially based on the assumption of a perfect test, We used this formula to demonstrate how combinations of first-stage (number of herds) and second-stage (number of animals in selected herds) sample sizes can be altered to achieve a least-cost survey, and used simulation to validate the formula. To overcome the unrealistic assumption of a perfect test, we then applied an exact-probability formula (which takes imperfect tests and finite population sizes into account) to the two-stage sampling design. An example is given which shows how implementing the formula with the FreeCalc computer program allows least-cost first and second-stage sample sizes to be calculated. 0 1998 Elsevier Science B.V.
Keywords: Diagnosis-basic matters; Sampling; Aggregate test
Abbreviations: Ph: prevalence amongst herds, or the proportion of herds with the characteristic of interest;
H+: disease-positive herd; H-: disease-negative herds; A’: disease-positive animals; A-: disease-negative
animals; PC>: the probability of an event with the event of interest described in the brackets; n,,: number of
herds drawn in a sample from the population (herd sample size); n,: number of animals drawn in a sample
from a herd (animal sample size); N,: average herd size; d,: number of disease-positive animals (A+ ) in a
herd
* Corresponding author: Tel.: +61 7 3379 5385; fax: +61 7 3278 1953; email: [email protected]
0167-5877/98/$19.00 0 1998 Elsevier Science B.V. All rights reserved. PII SO167-5877(97)00073-l

20 A.R. Cameron, F.C. Ba.!dock/Preventiue Veterinary Medicine 34 (1998) 19-30
1. Introduction
Surveys to substantiate freedom from disease may be used at either the herd ’ level (for example, in herd-accreditation schemes) or at a regional or national level (for example, to meet the requirements of trading partners or international organisations such as the Office International des Epizooties [OIE] for international trade purposes).
In a large population where animals are separated into herds, disease has a strong tendency to cluster. This is because the disease agent or agents (whether infectious, environmental or genetic) are generally not evenly distributed throughout the population (Rothman, 1990). With rare diseases, this clustering is usually even more pronounced. As a result, a very low proportion of herds may be affected by a particular disease-but within those affected herds, the prevalence of the disease amongst animals may be quite high. If a survey designed to detect the presence of disease fails to take into account the clustering of disease in the population, the results of the survey are likely to be very unreliable. This is because the probability formulae that the surveys are based on assume that every unit in the population has the same probability of being affected.
Another problem with large-area surveys is the logistics of sampling. Probability formulae assume simple random sampling. Simple random sampling of individual animals from a national herd requires the creation of a sampling frame which may need to list millions of animals (each uniquely identified). Such a sampling frame is usually impossible to construct.
The solution to both these problems is to use a two-stage sampling strategy in which herds form the first stage, and individual animals within selected herds, the second stage. In this way, the sample sizes at each stage can be adjusted to reflect the different disease prevalences (the proportion of herds affected in the first stage, and the proportion of animals affected in the herd at the second stage). Two-stage sampling also means that the construction of sampling frames is much simpler. At the first stage, only a list of all herds in the population is required, and at the second stage, only animals in each of the selected herds is to be included in the list.
This paper examines the theory and practice of two-stage sampling to substantiate freedom from disease-first using a perfect screening 2 test, and then with imperfect tests which is the more realistic situation. An example is given of how planning and
’ In this paper, ‘herd’ is used to refer to a group of animals under the same management system that are
able to frequently mix. Animals in a herd share common risk factors for disease, so the distribution of disease
within the herd is assumed to be relatively homogenous. This may equally apply to the animals on a single
farm, a subgroup of animals on larger farms, or all the animals in a village.
’ The term ‘screening’ test is used here to describe a test that is applied to detect disease in apparently
healthy populations, in contrast to a diagnostic test that is to distinguish between individual animals that have
the disease in question and those that have other diseases on the differential list (Smith, 1995). Screening is
not used here to describe a rapid initial test that requires follow up (cf. Last, 1988; Thrusfleld, 1995). In our
context, a screening test or ‘test system’ (which may involve multiple tests, in any structured combination, with an identifiable sensitivity and specificity) may be used to divide a population into those that are likely to
have the disease in question and those who are not.

A.R. Cameron, F.C. Baldock/Preventive Veterinary Medicine 34 (1998) 19-30 21
analysis of a two-stage survey can be simplified by using the FreeCalc software
program.
2. Two-stage sampling with perfect tests
In the simplest situation, the screening test used is considered to be perfect. That is, sensitivity and specificity are both equal to one. In a few limited situations, this assumption is valid, and greatly simplifies the calculations involved. The more common situation of two-stage sampling with an imperfect test is discussed later.
2.1. Probability and sample size formulae
When selecting a herd (using simple random sampling) from a population with herd prevalence of ph, the probability of choosing a diseased herd, P(H+), is equal to ph. The probability of choosing a non-diseased herd, P(K), is equal to (1 - phh At the second stage of sampling, the conditional probability of choosing ~1, animals all of which are non-diseased, given that a diseased farm is chosen, P( D-1 H+), is given by
the formula (Cannon and Roe, 1982):
P(al1 D-1 H+) = (N,-d,)!(iY-n,)!
(N,--d,-n,)!N,! (1)
or its approximation (for large herd sizes):
(2)
Obviously, the conditional probability, P( A-1 H-) (of choosing na non-diseased
animals given that an non-diseased farm is chosen) is equal to 1. The joint probability of first choosing a diseased farm and then choosing all
non-diseased animals equals the product of the probability of selecting a diseased herd and the conditional probability of selecting all non-diseased animals given that a disease herd is selected i.e. P(H+ n A-) = P(H+) X P( A-1 H+) (Larson, 1982). This can be expressed (using the more convenient approximation) as:
[ Vdaa2 ) na
P(H+nA-)=p, l- n -1 (3)
The joint probability of choosing both a diseased farm and all non-diseased animals is the corresponding product, P(H- n A-) = P(K) X P(A-IH-) = (1 -p,,) X 1. The

22 A.R. Cameron, F.C. Bala!ock/Preuentiue Veterinary Medicine 34 (1998) 19-30
overall probability of choosing all non-diseased animals is the probability that either a diseased herd is chosen and all non-diseased animals are chosen, or a non-diseased herd is chosen:
P[(H+ fl A-) U (H- f-l A-)] =P(H+ n A-)+P(H- f-j A-)
n,
+ (1 - Ph)
(4)
Finally, let us consider selecting n,, herds. For simplicity’s sake, it is reasonable to assume that the number of herds is very large, and that they are chosen with replacement. When such surveys are used over large areas where thousands of herds are present, this assumption is valid. The probability that at least one diseased animal will be identified if disease is present at the stated levels is:
P (detect at least one diseased animal)
In order to calculate the required sample size, Eq. (5) may be rearranged:
ln( 1 - P)
nh=ln[p,,[l-Na :;l I’ii’-ph)]
(6)
where P is the required confidence level (e.g. 95% or 99%).
2.2. Cost function
Eq. (6) will yield a range of combinations of nh (number of herds sampled) and n, (number of animals sampled per herd)-each of which will produce the same level of confidence. The optimal combination can then be selected based on minimum cost. A cost function which describes the total variable costs of the survey generally takes the simple form:
c total = Chnh + ‘a’h% (7)

80
75
70
In e cm B 65
1
5
= 60
55
0
A.R. Cameron, F.C. Baldock/ Preventive Veterinary Medicine 34 (1998) 19-30
. .
I-
80
58
54
52
50
0 0 10 15 20 25 30 35 40 45 50
Number of animals
Fig. 1. Combinations of number of herds, and number of animals per herd required to achieve a probability of
95% of detecting at least 1 diseased animal, based on assumed prevalence of 0.2 amongst animals, and a
prevalence of 0.05 amongst herds. The cost of the varying survey designs is also shown.
where C, are the costs associated with testing each herd, and C, are the costs of testing each animal (Co&ran, 1977). Cost functions which are more complex may be required for specific purposes. To determine the combination of sample sizes which yields the
minimum cost, the range of sample-size combinations that produce the required level of
accuracy are used to calculate a range of costs. The minimum-cost point might also be determined directly using calculus (depending on the form of the sample-size and cost
equations). Fig. 1 shows sample sizes and costs for a hypothetical survey, in which it was
assumed that prevalence amongst animals was 0.2 and amongst herds was 0.05. Cost estimates are based on actual survey costs incurred during village livestock surveys in Northern Thailand in 1994-1995, and are measured in Thai Baht. The combination yielding the minimum cost can be seen graphically as 20 animals per herd, and 59 herds.
2.3. Simulation
To confii the validity of these formulae, a program was written to simulate sampling, based on sampling of herds with replacement, and of animals without replacement. (The assumption of large population relative to sample size is often not valid for sampling animals within herds.) Rows one and two of Table 1 illustrate the effects of finite herd populations. Row three shows sample sizes necessary to achieve a probability of approximately 99%. Rows four to six illustrate that a similar probability

24 A.R. Cameron, F.C. Baldock/Preventive Veterinary Medicine 34 (1998) 19-30
Table 1
Comparison of the probabilities of detecting at least one diseased animal, based both on Eq. (3) and
simulations using 10000 iterations, over a range of survey designs
Row Proportion Proportion Average Total Animals Probability Probability Probability
number of herds of animals herd herds sampled based on based on based on diseased diseased size sampled per herd formula 1 formula 2 simulation
1 1% 10% 100 100 9 46.78% 46.76% 47.14%
2 1% 10% 10 100 9 59.51% 55.49% 60.13%
3 5% 20% 100 90 19 98.97% 98.97% 98.98%
4 5% 20% 200 100 4 95.08% 95.08% 95.10%
5 5% 20% 200 70 8 95.00% 95.00% 95.15%
6 5% 20% 200 60 16 95.03% 95.03% 95.43%
level (about 95%) can be obtained from the same population, using a range of different sampling designs.
3. Two-stage sampling with imperfect tests
With imperfect tests, it is not possible to derive a relatively simple formula to calculate the necessary sample sizes. Instead, a two-stage approach must be used: first, each selected herd is classified as diseased or non-diseased based on the results of tests
on individual animals drawn randomly from the herd, and then the population of herds is classified as diseased or non-diseased, based on the findings from classifying the
selected herds.
3.1. Herd tests
When a screening test is applied to a sample of animals from a herd for the purpose of classifying the herd as diseased or non-diseased, the total procedure may be thought of as a single, herd-level screening test (with its own sensitivity and specificity). The sensitivity and specificity of herd tests are influenced by the sensitivity and specificity of the individual-animal test used, the number of animals tested, and the way in which
individual-animal results are interpreted (Martin et al., 1992; Donald et al., 1994; Jordan, 1995). The most common approach for classifying herds is to use a cutpoint for the number of reactors to the individual animal tests. If the number of reactors found is the same or fewer than the cutpoint, then the herd is classified as disease-free. If more than the cutpoint number are found, then the herd is classified as diseased. If the cutpoint chosen is zero, herd-level specificity will be low-but the sensitivity will be high. As the cutpoint is increased, the sensitivity decreases and the specificity increases. Designing an optimal herd-level survey is therefore a question of determining both the best sample size and the cutpoint level that will give the optimal combination of sensitivity and specificity for the purposes of the survey. Ideally, the investigator should

A.R. Cameron, F.C. Baldock/Preventive Veterinary Medicine 34 11998) 19-30 25
be able to specify the herd-test sensitivity and specificity required and then calculate the
corresponding sample size and cutpoint number of reactors. We developed a modification of the hypergeometric formula to determine the exact
probability of observing a given number (x) of test-positive CT+) reactors, taking into account individual-animal test sensitivity (Se) and specificity (Sp), and finite populations (Cameron and Baldock, 1998):
x(1 - SP) X-jSpn-x-yfj (8) This formula has been implemented in a computer program, FreeCalc, 3 to automate
the calculation. To calculate the sample size, it is necessary to first define the levels of Type-I and -11 errors. The Type-I error ( (Y) is the probability of falsely rejecting the null
hypothesis (falsely concluding that the population is free from disease). The Type II error ( p) is the probability of falsely accepting the null hypothesis, (falsely concluding that disease is present). Together, they determine the level of confidence we will have in
the survey. As it is impossible to ‘prove’ complete freedom from disease when examining only a
sample of the population, the survey can only fail to detect disease at a predetermined level--the minimum expected prevalence, 4 and is thus really a ‘substantiation’ of
freedom from disease. In keeping with the convention that the null hypothesis is the
default hypothesis, the null hypothesis is that the disease is present at a level equal to or greater than the minimum expected prevalence. The alternate hypothesis is that it is present at a lower level. All tests used are therefore one-sided.
In the context of herd testing, the herd-level sensitivity is the probability that a diseased herd will be classified as diseased. This is equal to one minus the probability
that a diseased herd will be classified as disease-free, or 1 - cy. Similarly, the herd-level specificity is equal to 1 - p.
Herd-level testing Animal-level testing
Sensitivity = 1-a = Confidence level Specificity = 1-p = Power
These simple relationships allow us to specify the required herd-level sensitivity and specificity by specifying the animal-level power and confidence levels, and to calculate the animal-level sample size and cutpoint number of reactors needed to achieve them.
3 Available on the World Wide Web from the EpiVetNet Web site (http://epiweb.massey.ac.nz).
4 For simplicity, the term ‘minimum expected prevalence’ is used throughout this paper. At the animal-level
within a single herd, this is the minimum prevalence that would be expected if the disease were present in the
herd (based on a knowledge of the biology of the disease). At the herd-level, this is the lowest non-zero
prevalence of diseased herds that would be considered unacceptable (based on political, economic or other
considerations).

26 A. R. Cameron, F’. C. Baldock/ Preventive Veterinary Medicine 34 I19981 19-30
3.2. Suruey procedure
The following sections outline the steps in planning and analysing a two-stage sample survey to substantiate freedom from disease.
3.2.1. Define parameters A number of parameters must be established prior to starting the survey. The
sensitivity and specificity of the screening test used on individual animals must be known or estimated.
The minimum expected prevalence of the disease within a herd should also be estimated. This is based on a knowledge of the biology of the disease, and is influenced
by how infectious the disease is and the nature of the screening test. Highly contagious diseases are more likely to have a higher prevalence. Serological tests that detect antibodies which are present long after an infection will give a higher prevalence than a
test designed to detect the disease only during a brief active phase. The lower the
expected prevalence, the more conservative the survey, and the higher the sample size required.
The minimum expected prevalence of the disease amongst herds also needs to be defined. If a survey is being conducted to substantiate freedom from the disease, it is assumed that there is currently no evidence of the disease. Therefore, if the disease is present, it is likely to be present in only a small proportion of herds. Substantiation of freedom from disease means finding that disease, if present, is present in fewer than a
given percentage of herds. The choice of this value is a compromise based on economics, an understanding of the biology of the particular disease and, sometimes, politics. A value must be chosen which is small enough to be convincing to those requiring assurance of the population’s freedom from disease. Financially, the lower the
minimum expected prevalence, the more expensive the survey. Substantiation of free- dom from disease at very low assumed prevalences will require very large sample sizes and will be very expensive.
Confidence levels for the survey also need to be specified in order to calculate sample size. The optimal probability of one-sided Type-I and Type-II errors should be deter- mined. Again, these decisions require an understanding of the political and economic consequences of each type of error. A country hoping to open export markets by substantiating freedom from disease would probably be very concerned that it does not make a Type-II error, incorrectly concluding that disease is present and rendering it ineligible to export. On the other hand, an importing country monitoring the survey conducted by a potential trading partner, is likely to demand that the chances of a Type-I error are very low, so that the danger of importing diseased animals is minimised.
3.2.2. Calculate number of herds required The first-stage sample size can be calculated using the FreeCalc computer program.
The probability of Type-I and Type-II errors are first set, and then the desired herd test sensitivity and specificity entered. (The way to select the optimal herd test sensitivity and specificity are discussed below.) After entering the minimum expected prevalence and population size (total number of herds), the program will calculate the number of

A.R. Cameron, F.C. Baldock/Preuentiue Veterinary Medicine 34 (1998) 19-30 21
herds that need to be sampled. In addition, the program reports the cutpoint number of
reactors-or, in this case, the maximum number of herds that can test positive and still
allow the investigators to conclude that the population is free from disease.
3.2.3. Calculate the number of animals required in each herd
When testing each herd, the sample size and cutpoint number of reactors used must achieve a herd-level sensitivity and specificity equal to those used to calculate the number of herds to be tested. To achieve a specified herd-level sensitivity, the
probability of a Type-I error ( (Y > at the animal-level is set to 1-(herd-level sensitivity). The probability of a Type-II error ( /3 > is set to 1 -(herd-level specificity). When the other parameters (animal-level sensitivity and specificity, minimum expected within-herd
prevalence, and herd size) are set, the program will calculate the required sample size, (and again report the cutpoint number of reactors used to classify the herd as positive or negative).
3.2.4. Conduct survey
Once sample sizes have been calculated, a simple random sample of the required number of herds is chosen. The population of each sampled herd is determined, and the exact sample size required for each of the herds calculated separately. For practical purposes, the sample size and cutpoints for a range of herd sizes can be tabulated for
easy reference-but this should include every integer value in the relevant range, to maintain accuracy. Selection of individual animals within the herd must also be done by simple random sampling.
3.2.5. Analysis of results
Each herd sampled is classified as ‘diseased’ or ‘non-diseased’ based on the observed number of reactors. (If the number is less than or equal to the cutpoint number of reactors for that sample size, the herd is classified as free from disease. If the number of reactors is greater, it is classified as diseased.) The exact probability that each herd is diseased can be calculated using the modified hypergeometric formula implemented in the FreeCalc program (Cameron and Baldock, 1998). When each herd has been classified, the total number of reactor herds is compared to the cutpoint number of
reactors for the first stage of sampling. (If the number of positive herds exceeds the
cutpoint, the population is classified as diseased, otherwise it can be considered free from disease.) The exact probability can again be calculated using the analysis module in FreeCalc.
3.3. Determining the optimal sample sizes
The herd-level sensitivity and specificity needs to be decided by the investigator. For a given screening test, the herd-level sensitivity and specificity can be set to a range of values by varying the sample size and cutpoint number of reactors. While sensitivity plays a role in the sample size, herd-level specificity is more important, due to the much greater proportion of false positive results than false negative when prevalence is very low. If specificity is increased, the number of herds that needs to be sampled decreases,

28 A.R. Cameron, F.C. BaMock/Preuentiue Veterinary Medicine 34 (1998) 19-30
but the number of animals that must be sampled from each herd to achieve this level of herd test specificity increases. The choices of herd-level sensitivity and (especially) specificity therefore determine the balance between the required number of herds and the number of animals per herd.
The choice of the optimal combination of number of herds and number of animals in two-stage sampling is generally done by minimising a cost function as described
previously. If the cost of sampling each herd and the cost of sampling each animal are known, the total variable survey costs for each combination of number of animals and number of herds can be calculated. The usual approach is to formulate the cost function expressed in terms of (for instance) the number of herds, and to find the value that minimises the cost. The required number of animals per herd is then calculated.
In the current situation, such an approach is not feasible. Firstly, in order to maintain constant herd-level sensitivity and specificity, different numbers of animals must be
sampled from each herd-depending on the herd size. Secondly, the probability formula is complex and it is not possible to formulate a simple cost function in terms of the
number of herds required. Finally, the probability curves produced by the modified hypergeometric formula produce stepped (rather than smooth) curves due to changes in the cutpoint number of reactors as sample size changes. This makes finding the
minimum value mathematically very difficult. These problems do not undermine the fact that the approach is very flexible and that
a range of sample-size combinations is possible. While a mathematical solution to the
problem of optimal allocation is not practical, it is still possible to compare survey costs for a range of sample-size combinations. Using a trial-and-error approach, the optimal or a near-optimal combination can be found relatively quickly. Although the optimal solution will depend on the ratio of herd to animal costs, it is generally more efficient to use a high herd-level specificity and a low herd-level sensitivity. This generally
produces a low number of herds and a moderate number of animals per herd.
4. Hypothetical example
Suppose a survey were to be conducted to substantiate freedom from disease agent X in a population of 8532 herds. A screening test is available with a sensitivity of 94% and
a specificity of 90% at the individual-animal level. Veterinary authorities have decided that the survey should be able to detect the presence of disease with 95% confidence and power (type I and type II errors both equal 0.05) even if as few as 5% of herds are infected. Within herds, it is expected that more than 20% of animals will be affected if the disease is present. Funding and logistic considerations dictate that no more than 200 of the 8532 herds in the population can be sampled.
Using this information, the specifications of the herd test can be calculated. The FreeCalc computer program can be used to explore the different combinations of sensitivity and specificity that will produce a sample size of less than 200 herds. By trial-and-error, a herd-level sensitivity of 90% and a specificity of 98.4% produces a sample size of 193 herds. The program also tells us that no more than six positive herds would be expected (with 95% confidence) from a sample of this size if the population were negative.
A.R. Cameron, F.C. Baldock/Preventiue Veterinary Medicine 34 (1998) 19-30 29
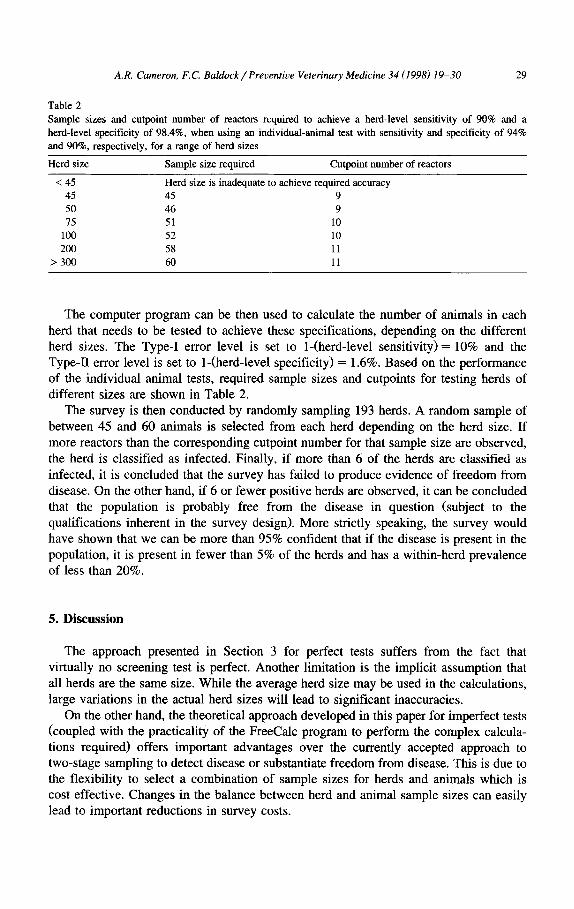
Table 2
Sample sizes and cutpoint number of reactors required to achieve a herd-level sensitivity of 90% and a
herd-level specificity of 98.4%, when using an individual-animal test with sensitivity and specificity of 94%
and 90%. respectively, for a range of herd sizes
Herd size Sample size required Cutpoint number of reactors
< 45 Herd size is inadequate to achieve required accuracy
45 45 9
50 46 9
15 51 10
100 52 10
200 58 11
>300 60 11
The computer program can be then used to calculate the number of animals in each herd that needs to be tested to achieve these specifications, depending on the different herd sizes. The Type-I error level is set to 1-(herd-level sensitivity) = 10% and the Type-II error level is set to I-(herd-level specificity) = 1.6%. Based on the performance of the individual animal tests, required sample sizes and cutpoints for testing herds of different sizes are shown in Table 2.
The survey is then conducted by randomly sampling 193 herds. A random sample of between 45 and 60 animals is selected from each herd depending on the herd size. If
more reactors than the corresponding cutpoint number for that sample size are observed, the herd is classified as infected. Finally, if more than 6 of the herds are classified as
infected, it is concluded that the survey has failed to produce evidence of freedom from disease. On the other hand, if 6 or fewer positive herds are observed, it can be concluded that the population is probably free from the disease in question (subject to the qualifications inherent in the survey design). More strictly speaking, the survey would have shown that we can be more than 95% confident that if the disease is present in the population, it is present in fewer than 5% of the herds and has a within-herd prevalence of less than 20%.
5. Discussion
The approach presented in Section 3 for perfect tests suffers from the fact that virtually no screening test is perfect. Another limitation is the implicit assumption that all herds are the same size. While the average herd size may be used in the calculations, large variations in the actual herd sizes will lead to significant inaccuracies.
On the other hand, the theoretical approach developed in this paper for imperfect tests (coupled with the practicality of the Free&k program to perform the complex calcula- tions required) offers important advantages over the currently accepted approach to two-stage sampling to detect disease or substantiate freedom from disease. This is due to the flexibility to select a combination of sample sizes for herds and animals which is cost effective. Changes in the balance between herd and animal sample sizes can easily lead to important reductions in survey costs.

30 A.R. Cameron, F.C. Baldock/ Preventive Veterinary Medicine 34 (1998) 19-30
This flexibility is made possible by being able to calculate the sample size for each herd separately, based on the size of the herd. The cutpoint number of reactors (which determines the herd-level sensitivity and specificity) is automatically tailored to the size of each herd by the FreeCalc program. The herd-level sensitivity and specificity can therefore be set by the investigator, and kept very nearly constant across herds to meet the requirements of the first-stage sample size.
Due to the need to calculate all probabilities based on integer values (whole animals instead of fractions of animals), the exact probabilities will usually be just less than
those specified. For instance, if a herd-level sensitivity of 95% is required (Type-I error
5%), the sample size and cutpoint number of reactors are calculated such that the error probability is equal to or just less than 5%. This means that the herd-level sensitivity and specificity will usually be slightly higher than those specified, and the confidence in the results of the survey slightly better than that specified. This inaccuracy always errs on the conservative side and is an unavoidable consequence of probability calculations which demand integer values.
Acknowledgements
This research was conducted as part of a project funded by the Australian Centre for
International Agricultural Research, working in cooperation with the Thai Department of Livestock Development. Angus Cameron is supported by a research fellowship from the Australian Meat Research Corporation.
References
Cameron, A.R., Baldock, F.C., 1998. A new probability formula for surveys to substantiate freedom from
disease. Prev. Vet. Med. 34, 1-17.
Cannon, R.M., Roe, R.T., 1982. Livestock disease surveys. A field manual for veterinarians. Bureau of Rural
Science, Department of Primary Industry. Australian Government Publishing Service, Canberra.
Cocbran, W.G., 1977. Sampling Techniques, 3rd edn. Wiley, New York.
Donald, A.W., Gardner, LA., Wiggins, A.D., 1994. Cut-off points for aggregate herd testing in the presence of
disease clustering and correlation of test errors. Prev. Vet. Med. 19, 167-187.
Jordan, D., 1995. Aggregate testing for the evaluation of Johne’s disease herd status. In: Morton, J. (Ed.),
Epidemiology Chapter, Australian College of Veterinary Scientists Proceedings. Australian Veterinary
Association Annual Conference, Melbourne, May 21-26, 1995. Australian College of Veterinary Scien-
tists, Indooroopilly, 60-67.
Larson, H.J., 1982. Introduction to probability theory and statistical inference. Wiley, New York.
Last, J.M. (Ed.), 1988. A dictionary of epidemiology, 2nd edn. Oxford Univ. Press, New York.
Martin, S.W., Shoukri, M., Thorburn, M.A., 1992. Evaluating the health status of herds based on tests applied
to individuals. Prev. Vet. Med. 14, 33-43.
Rothman, K.J., 1990. A sobering start for the cluster busters’ conference. Am. J. Epidemiol. 132, S6-S13.
Smith, R.D., 1995. Veterinary Clinical Epidemiology: A Problem-Oriented Approach, 2nd edn. CRC Press,
Boca Raton, FL.
Thrusfield, M., 199.5. Veterinary Epidemiology, 2nd edn. Blackwell, Oxford.