two methods for assessing oral reading prosodylisten/pdfs/tslp-prosody-final.pdf · two methods for...
TRANSCRIPT

Two Methods for Assessing Oral Reading Prosody
MINH DUONG Carnegie Mellon University JACK MOSTOW Carnegie Mellon University SUNAYANA SITARAM Carnegie Mellon University
We compare two types of models to assess the prosody of ch ildren rsquos ora l reading Templa te
models measure how well the ch ildrsquos prosodic contour in reading a given sen tence correla tes in
pitch in tensity pauses or word reading t imes with an adult narra t ion of the same sen tence We
evaluate templa te models direct ly against a common rubr ic used to assess fluency by hand and
indirect ly by their ability to predict fluency and comprehension test scores and gains of 10
ch ildren who used Project LISTEN rsquos Reading Tutor the template models ou tpredict the human
assessment
We a lso use the same set of adult narra t ions to tra in genera lized models for mapping text to
prosody and use them to evaluate ch ildren rsquos prosody Using only dura t ion al fea tures for both
types of models the genera lized m odels per form bet ter a t predict ing fluency and comprehension
post test scores of 55 ch ildren ages 7-10 with adjusted R2 of 06 Such models could help
teachers iden t ify which students a re making adequate progress The genera lized models have
the addit ional advantage of not requir ing an adult nar ra t ion of every sen tence
Categor ies and Subject Descr iptors I 27 [Artific ial Inte lligen ce ] Natura l language
processing ndash Speech recognit ion and synthesis K31 [Computers an d Edu cation ] Computer
Uses in Educat ion ndash Computer -assisted inst ruct ion (CAI)
Genera l Terms Algor ithms Exper imenta t ion Human Factors Measurement
Addit ional Key Words and Phrases Ora l reading fluency prosody assessment in telligent
tu tor ing system ch ildren
ACM Referen ce Format
DUONG M MOSTOW J and SITARAM S 2011 Two methods for assessing ora l reading
prosody ACM T ransactions on S peech and Language Processing (Specia l Issue on Speech and
Language Processing of Childrenrsquos Speech for Child-machine In teract ion Applica t ions)
_________________________________________________________________________________________
The research repor ted here was suppor ted by the Inst itute of Educat ion Sciences US
Depar tment of Educat ion through Grant R305A0628 The opinions expressed are those of the
au thors and do not necessar ily represen t the views of the Inst itu te or the US Depar tment of
Educat ion The fir st au thor par t icipa ted in th is research as a graduate student a t Carnegie
Mellon Language Technologies Inst itu te
Authorsrsquo addresses Minh Duong Facebook 1601 S Californ ia Ave Pa lo Alto CA 94304 USA
E-mail mnduongcscmuedu J ack Mostow Robot ics Inst itu te Carnegie Mellon University
P it t sburgh PA 15213 USA E-mail mostowcscmuedu Sunayana Sitaram Language
Technologies Inst itu te Carnegie Mellon University P it t sburgh PA 1521 3 USA E-mail
ssita ramcscmuedu
Permission to make digita lhard copy of par t of th is work for personal or classroom use is
gran ted without fee provided that the copies are not made or dist r ibu ted for profit or commercia l
advantage the copyr igh t not ice the t it le of the publica t ion and its da te of appear and not ice is
given tha t copying is by permission of the ACM Inc To copy otherwise to republish to post on
servers or to redistr ibu te to lists requires pr ior specific permission andor a fee Permission
may be requested from the Publica t ions Dept ACM Inc 2 Penn P laza New York NY 11201 -
0701 USA fax +1 (212) 869-0481 permissionacmorg
1 INTRODUCTION
Assessment of ch ildren rsquos ora l reading is impor tan t for mult iple r ea son s ndash t o
compare fluency aga in st expected norms [Hasbrouck and Tindal 2006]
provide mot iva t iona l feedback on r er eading to improve flu ency [Kuhn and
Stah l 2003] ana lyze th e longitudin a l developmen t of flu ency [OConn or et
a l 2007] compare the efficacy of differ en t types of r eading pract ice [Beck
and Mostow 2008 Kuh n et a l 2006] study the rela t ion of flu ency to
compreh ension [Schwanenflugel et a l 2006] and even est ima te the r eader rsquos
fluctua t ing compreh ension of a given t ext [Zhang et a l 2007]
Table 1 Fluency rubric adapted from [Zutell and Rasinski 1991] downloaded from wwwtimrasinskicompresentationsmultidimensional_fluency_rubric_4_factorspdf
Dim en sion 1 2 3 4
Express ion and
Volu m e
Reads as if just
t rying to ldquoget
words out rdquo Lit t le
sense of trying to
make text sound
like na tura l
language Tends
to read in a qu iet
voice
Begins to use
voice to make
text sound like
na tura l language
in some areas bu t
not in others
Focus remains
la rgely on
pronouncing
words St ill
r eads in a qu iet
voice
Makes text sound
like na tura l
language
throughout the
bet ter par t of the
passage
Occasionally slips
in to
expression less
reading Voice
volume is
genera lly
appropr ia te
th roughout the
text
Reads with good
expression and
en thusiasm
throughout the
text Var ies
expression and
volume to m atch
h is or her
in terpreta t ion of
the passage
P h ras in g Reads in
monotone with
lit t le sense of
phrase
boundar ies
frequent ly reads
word-by-word
Frequent ly reads
in two and three
word phrases
giving the
impression of
choppy reading
improper st ress
and in tonat ion
fa il to mark ends
of sen tences and
clauses
Reads with a
mixture of run-
ons mid sen tence
pauses for
brea th and some
choppiness
r easonable stress
and in tonat ion
Genera lly reads
with good
phrasing most ly
in clause and
sen tence unit s
with adequa te
a t ten t ion to
expression
Smooth n ess Makes frequent
extended pauses
hesita t ions fa lse
star t s sound-
outs repet it ions
andor mult iple
a t tempts
Exper iences
severa l ldquorough
spotsrdquo in text
where extended
pauses or
hesita t ions are
more frequent
and disrupt ive
Occasionally
breaks smooth
rhythm because
of difficu lt ies
with specific
words andor
st ructures
Genera lly reads
smooth ly with
some breaks bu t
resolves word and
st ructure
difficu lt ies
qu ickly usually
th rough self-
correct ion
P ace Reads slowly and
labor iously
Reads modera tely
slowly
Reads with an
uneven mixture
of fast and slow
pace
Consisten t ly
reads a t a
conversa t ional
pace appropr ia te
ra te th roughout
reading
Oral reading fluency is th e ability to ldquoread text with speed accuracy and
proper expression rdquo [NRP 2000] Expressiveness is the ability to r ead with a
prosodic con tour appropr ia te to th e meaning of th e t ext which reflect s an
underst anding of the t ext [Schwanenflugel et a l 2006] Educa tors measure
ora l reading fluency in two ways Ora l r eading ra t e is the number of words
read cor r ect ly per minute Th is measure is qu ick an d easy to ad min ister and
cor rela t es st r ongly with ch ildrenrsquos compreh en sion test scores [Den o 1985]
However ora l reading ra t e ignores expressiveness
F luency ru br ics [eg P in nell et a l 1995] score r eading more subject ively
and qualita t ively aga in st specified cr iter ia On e widely used fluency ru br ic
shown in Table 1 r a t es expression phrasing smoothness and pace on
separa t e 4-poin t sca les For example the sca le for pace ranges from 1 for
slow and labor iou s to 4 for consisten t ly conversa t ion al
In th is paper we address the problem of assessing ora l reading prosody
au tomat ica lly Solving th is problem wou ld make it possible to assess r eading
more r ich ly and in format ively than ora l r eading ra t e and more pr ecisely and
consist en t ly than human -scored rubr ics It cou ld more sen sit ively detect
improvement in ora l reading wheth er acr oss successive re -r eadings of th e
same pract ice text or in the ability to read unpract iced t ext fluen t ly It cou ld
serve as th e basis for giving ch ildren feedback on their or a l reading telling
them h ow to r ead more expressively It migh t even enable a tu tor to gauge a
studen t rsquos comprehen sion of a given text unobtru sively [Zhang et a l 2007]
without in t er rupt ing to in ser t mult iple-ch oice probes [Mostow et a l 2004] or
ask open-ended quest ion s [Gerosa and Narayanan 2008]
Our da ta consist of ch ildren rsquos ora l reading a ssist ed and r ecorded by
Project LISTEN rsquos Readin g Tutor which listen s to ch ildren read a loud and
helps th em learn to read [Mostow et a l 2003] Th e Reading Tutor and t he
ch ild take tu rns choosing what to r ead from a collect ion of severa l hundred
stor ies with r ecorded adult nar ra t ions Th e Reading Tutor displays t ext
incrementa lly adding a sen tence a t a t ime It uses th e Sphinx au toma t ic
speech recognizer (ASR) [CMU 2008] to list en to the ch ild read the sen tence
a loud t racking the ch ild rsquos posit ion in th e t ext t o detect devia t ion s from it and
iden t ify th e st a r t and end poin t s of each word and silence in th e r ecorded ora l
reading [Mostow et a l 1994] It r esponds with spoken and graphica l
feedback when th e ASR detect s hesit a t ions or miscues or wh en the ch ild
clicks for help on hard words or sen tences Th e spoken feedback uses
recorded human speech including a fluen t adu lt n ar ra t ion of each sen tence
t ime-a ligned aga in st the sen tence t ext by forced a lignment
We presen t two types of models for assessing ch ildren rsquos or a l r eading
prosody Both models score ora l r eading one sen tence a t a t ime A tem plate
m odel scores the ch ildrsquos reading of a sen tence by it s similar ity to the adu lt
nar ra t ion of the same sen tence based on wha tever prosodic con tour the
sen tence led th e nar ra tor to produce Thus it may implicit ly captu re subt le
text fea tures to which a human nar ra tor is sen sit ive However it cann ot
eva lua te unnar ra ted sen tences A generalized m odel is t ra ined on a corpus of
adu lt nar ra t ions and scores th e ch ild rsquos reading aga inst th e t r a ined model
inst ead of a ssuming tha t an adu lt nar ra t ion is ava ilable for th a t sen tence
Moreover gen era lized models a r e t ra ined on mult iple adu lt voices so they
are n ot specific to th e idiosyncrasies of any one speaker To determin e
whether such gen era liza t ion is possible with out sa cr ificing the accuracy of
the sen tence-specific approach we compare th e models rsquo ability to pr edict
studen tsrsquo fluency and comprehen sion t est scores
The r est of th is paper is organ ized a s follows Sect ion 2 discu sses rela t ed
work Sect ion 3 descr ibes templa te models and Sect ion 4 eva lu a tes th em
against var ious baselin es Sect ion s 5 and 6 r espect ively descr ibe and
eva lua te genera lized models Sect ion 7 con cludes by summar izing
con t r ibu t ions and proposing fu ture work
2 RELATION TO PRIOR WORK
Previous work has a ssessed ch ildrenrsquos ora l reading a t differ en t levels of
granular ity Some work especia lly to a ssess pronuncia t ion by na t ive and
non-nat ive speaker s has focused on r eading individual words eith er in
isola t ion [Tepperman et a l 2011] or in list s [Pr ice et a l 2009] Other work
has focused on reading connected text using speech recognit ion in au toma ted
tu tor s to t r ack the r eader rsquos posit ion and detect miscues [Beat t ie 2010 Hagen
et a l 2007 Mostow et a l 1994] Assessment of connected reading has
focused on accuracy of word iden t ifica t ion [Ban er jee et a l 2003 Black et a l
2007 Lee et a l 2004] mastery of grapheme-to-phon eme mappings [Beck and
Sison 2006] and fluency of ora l r eading ndash more specifica lly ora l r eading ra t e
[Balogh et a l 2007] or closely r ela ted var ian ts su ch as average in t er -word
la t ency [Beck et a l 2004 Mostow and Aist 1997] or word reading t ime [Beck
and Mostow 2008] Some work [Bern st ein et a l 1990 Tepperman et a l
2007] h as assessed (adu lt ) non-na t ive speakersrsquo ora l language Th at problem
is r ela t ed to ora l r eading fluency bu t very differen t because it measures th e
ability to t r ansla t e though ts in to language ra ther th an t ext in to speech
Our work differs from previou s au toma ted assessment s of ora l reading
fluency in what and h ow they est imate Balogh et a l [2007] used a
propr ieta ry syst em to score th e speed and accuracy of adu lt s rsquo ora l reading
They va lida ted aga inst human judges count ing th e number of words r ead
cor rect ly in the same r ecorded readings The h uman judges cor rela t ed
st rongly (096-100) with the au toma ted assessmen t ndash as st r ongly a s th ey did
with each other It is impor tan t to n ote tha t individuals rsquo r eading ra tes
fluctua te for many reasons so their ra tes on differen t passages or even the
same passage a t differ en t t imes cor r ela te less than per fect ly with each oth er
Thus predict ing post t est fluency is inheren t ly harder than measur ing reading
ra te on the same r ecordin g
Beck et a l [2004] used var iou s aggrega te fea tures of word la tencies and
help requ est s by 87 ch ildren in grades 1-4 over a two-mon th window in
Project LISTEN rsquos Reading Tutor to pr edict th eir fluency test scores
However they did n ot predict compreh ension scores or ga in s
Zhang et a l [2007] a t t empted to detect moment -to-moment fluctua t ions in
ch ildren rsquos comprehen sion of the text they were r eading a loud in th e Reading
Tutor Th ey t ra in ed a model to pr edict per formance on mult iple -choice
compreh ension qu est ions inser t ed dur ing the reading Ora l reading behavior
improved model fit on ly margina lly a ft er con t rolling for studen t iden t ity an d
quest ion a t t r ibu tes a ffect ing difficu lty Only ora l reading fea tur es rela t ed to
ora l r eading ra t e and accuracy ach ieved sign ificance ndash bu t non e of their
prosodic fea tur es compared prosodic con tours to fluen t nar ra t ion s
3 TEMPLATE MODELS
We n ow descr ibe h ow we represen t and compare prosodic con tour s and the
manual an a lysis meth odology tha t inspir ed our approach
31 Representing prosodic contours
Figure 1 Visualization of a prosodic contour
ldquoExpressivenessrdquo is impor tan t bu t defined imprecisely and judged
subject ively Therefore we use a more precisely defined con st ruct prosodic
con tour We r epresen t a prosodic con tour of a read sen tence as th e sequence
of va lu es on e for each word in the sen tence of a prosodic fea tur e such a s th e
wordrsquos la tency dura t ion mean pitch or mean in t ensity As Figure 1 sh ows
we can visua lize a prosodic con tour as a sequence of rectangles displayin g
prosodic fea tur es of each read word as graphica l fea tur es of th e rectangle
represen t ing it dura t ion as width pitch as ver t ica l posit ion and in ten sity as
heigh t and color F igure 2a b and c visu a lize prosodic con tour s for r eadings
of the sam e sen tence by an adu lt nar ra tor a fluen t ch ild and a disflu en t
ch ild The con tour for th e disflu en t reading reflect s it s longer dura t ion and
frequen t pau ses
a Fluent adult narration
b Fluent child reading
c Disfluent child reading
Figure 2 3 prosodic contours for ldquoThey have to put food on the table so that we can eatrdquo
32 Scaling up manual analysis of oral reading prosody
The t empla te model approach is in spired by previous ana lys es of ch ildr en rsquos
ora l r eading prosody based on th e insigh t tha t th e more expressive a ch ild rsquos
reading of a t ext th e more it s prosody tends to resemble flu en t adu lt r eading
of the same t ext Schwanenflugel and her collabora tor s [Miller an d
Schwanenflugel 2006 Miller and Schwan enflugel 2008 Schwanenflugel et
a l 2004 Schwan enflugel et a l 2006] ana lyzed adultsrsquo and ch ildren rsquo r eadings
of th e same sh or t text They pa instakingly han d-a ligned th e t ext to a
spect rogram of each r eading to compute th e dura t ion of pau ses between
sen tences a t commas a fter phrases and in mid-phrase ca lled ldquopausa l
in t rusion srdquo th e number of pau sa l in t ru sions th e drop in F0 (pitch) a t th e
ends of sen tences and th e in tona t ion con tours of the fir st th r ee sen tences
which they computed by measur ing F0 a t th e voca lic nucleus of each word
Averaging th ese va lues across 34 adu lt s yielded a profile of expressive
reading Cor r ela t ing th is profile aga in st the cor r esponding prosodic profile of
each ch ild quant ified th e expressiven ess of th e ch ild rsquos or a l reading a nd it s
changes from th e end of grade 1 to th e end of grade 2 so as to r ela t e them to
scores and ga ins on r eading test s admin ist er ed a t those poin t s F0 match
(cor rela t ion to adu lt in tona t ional con tour ) and the number of pausa l
in t rusion s were the best in dica tor s of prosodic change between fir st and
second grades
Our goal was to ana lyze the prosody of ch ildren rsquos a ssist ed ora l r eading in
Project LISTEN rsquos Reading Tutor Our da ta came from the 2005-2006 ver sion
of the Reading Tutor To au tomate our ana lysis we adapted Schwanenflugel
et a lrsquos approach with severa l key differences in da ta methods and fea tures
We u sed th e Reading Tutor rsquos single adu lt nar ra t ion of each sen tence
ra ther than mult iple adu lt readings of it Although a sen tence can be
read flu en t ly in more than one way Schwanenflugel (per son al email
communica t ion 10182008) found ldquoext r emely h igh cor rela t ion among
adults in our sample even across regionsrdquo
We used ch ildren rsquos ora l reading r ecorded over a whole semester of
using the Reading Tu tor ra ther than br iefly by research ers for an
exper iment
We admin ister ed test s a t sta r t and end of semester ra th er than a year
apar t
We computed prosodic con tour s on thou sands of sen tences n ot ju st a
few
We used wha tever a ch ild happen ed to r ead ra t her th an a single
common t ext
We replaced manual methods with au tomated on es
We used th e Reading Tu tor rsquos ASR-based t ime-a lignment s of text t o
ora l r eading ra th er than iden t ifying each word rsquos sta r t and end t ime
by hand
We est imated F0
u sing Praa t [Boersma and Weenink 2008] and
averaged F0 over th e t ime in terva l occupied by each word ra th er than
hand-measur ing F0 a t the wordrsquos manu ally loca ted voca lic nucleu s in a
spect rogram
We computed pitch var iability as st andard devia t ion of F0 ra th er than
as difference between h igh and low F0
va lues becau se standard
devia t ion is more robust t o ou t lier s than range is
We used a somewha t differen t set of word-level fea tures list ed in Table 2
We computed con tour s for word la t ency dura t ion and in t en sity n ot
just pitch
We computed product ion t ime to say each word n ot just th e la t ency
preceding each word and tota l reading t ime for each word a s la t ency
plus product ion t ime
We compu ted la t ency product ion and r eading t ime not on ly a s
absolu te dura t ions bu t a lso normalized by word length a s t ime per
let ter
We computed the la t ency preceding every word of each sen ten ce
except th e fir st word n ot just a t phra se-fina l commas and in mid-
phrase in t ru sions
We did n ot compu te the la tency of pauses between sen tences because
the Reading Tu tor displayed t ext incrementa lly adding one sen tence
a t a t ime con sequen t ly in ter -sen ten t ia l pauses included t ime wait ing
for the Reading Tutor to give feedback (if any) an d then display the
next sen tence
Table 2 Word-level features used by template model
Raw reading time Normalized reading time
Raw latency Normalized latency
Raw production Normalized production
33 Comparing prosodic contours
To quant ify th e similar ity of the ch ild rsquos ora l r eadin g to an adu lt nar ra t ion of
the same sen tence we adopted Schwanenflugel et a lrsquos metr ic simply
compute th e cor r ela t ion between the two contours We get separa t e
similar ity scores for each prosodic fea tur e For example the in ten sity
con tours in Figure 2a (adu lt ) and b (flu en t ch ild) cor rela t e a t 077 In
con t ra st the in t ensity con tour s in Figures 2a (adu lt ) and c (disfluen t ch ild)
cor rela t e a t on ly 002
Represen t ing ch ild and adult con tour s as sequ ences of word-level va lues
let s u s compare them despite differences between their t ime a lignmen ts
Moreover u sing cor rela t ions to score th e sim ila r ity of ch ild and adult
con tours is an elegan t way to n orma lize th em it serves to factor ou t
differences between ch ildren and adult s in baselin e F0 (adu ltsrsquo lower pitch)
individual var ia t ions in in ten sity and fluctua t ion s in r ecording condit ions
from one sen tence to another An a ltern a t ive way to normalize pitch and
in ten sity va lu es would use th eir devia t ions from baseline va lues computed by
averaging over the u t t erance or recen t u t t erances
Table 3 list s th r ee ca tegor ies of sen tence-level fea tures used in templa te
models Cor r ela t ing aga inst an adu lt con tour is just one way to score a
ch ildrsquos ora l r eading of a sen tence Many prosodic fea tures a r e a lso
in format ive to average over the u t ter ance F in a lly some fea tures a re defined
a t th e sen tence level bu t n ot for individual words
Table 3 Sentence-level features used by template models
1 Correla t ion of pitch contour to adult narra t ion
2 Correla t ion of in tensity contour to adult narra t ion
3 Correla t ion of raw reading t ime to adult narra t ion
4 Correla t ion of raw product ion to adult nar ra t ion
5 Correla t ion of raw la tency to adult narra t ion
6 Correla t ion of normalized reading t ime to adult nar ra t ion
7 Correla t ion of normalized product ion to adult nar ra t ion
8 Correla t ion of normalized la tency to adult nar ra t ion
9 Mean raw reading t ime
10 Mean normalized reading t ime
11 Mean raw product ion
12 Mean normalized product ion
13 Mean raw la tency
14 Mean normalized la tency
15 Pause frequency
16 Pitch var ia t ion
To assess a ch ildrsquos ora l r eading prosody overa ll we average each sen tence-
level fea tur e over a ll the sen tences r ead by tha t ch ild The read sen tences in
our corpu s averaged 67 words long bu t var ied in length so th ey sh ould n ot
count equally In averaging sen tence-level fea tur es over mult iple sen tences
we ther efore weigh t th e average by the number of words on which each
fea tur e is based
Prosodic fea tur es can be undefined for some words For inst ance in t er -
word la tency is undefin ed for th e fir st word of a sen tence because the
Reading Tutor displays one sen tence a t a t ime Prosodic fea tures a re
undefined for words the Reading Tutor gave h elp on or did not accept a s r ead
cor rect ly such a s th e words on so and we in Figure 2c
We adjust for such missing va lues as follows If a prosodic fea tur e is
undefined for on e or more words in an adu lt or (more typica lly) ch ild con tour
we exclude th em compute th e sen tence-level fea tur e by cor r ela t ing or
averaging over th e r est of the words and pena lize the resu lt ing score by th e
propor t ion of undefin ed va lues
It is not en ough just to weigh t each sen tence by the number of words with
defined va lu es becau se undefined va lu es in a ch ild rsquos con tour indica te
misma tches with the adu lt con tour Thus a ch ild con tour with on ly 5 defined
word-level va lu es for a 10-word sen tence get s on ly ha lf of th e sen tence-level
fea tur e va lue tha t a complete con tour for a 5-word sen tence with the same 5
defined word-level va lu es would get
Besides averaging each fea ture per studen t we want to charact e r ize how
it evolved over the course of th e semester in which the studen t used the
Reading Tutor because we car e not on ly about ch ildren rsquos r eading proficiency
bu t about th eir ra te of progress over t ime We plot the fea ture va lues
observed for each studen t aga in st th e ca lendar t imes when they were
observed We u se th eir linear r egression coefficien t to est ima te th e fea tur ersquos
ra te of change for tha t stu den t and th eir cor r ela t ion to measure th e st r ength
of th eir r ela t ionsh ip for tha t studen t We mu lt iply the linear r egression
coefficien t by th e cor r ela t ion to obta in th e weigh ted ra te-of-change fea tur es
listed in Table 4
Table 4 Weighted rate-of-change features
1 Growth in correla t ion of tota l
2 Growth in correla t ion of pitch
3 Growth in correla t ion of in tensity
4 Growth in correla t ion of raw reading t ime
5 Growth in correla t ion of raw product ion
6 Growth in correla t ion of raw la tency
7 Growth in correla t ion of normalized reading t ime
8 Growth in correla t ion of norma lized product ion
9 Growth in correla t ion of normalized la tency
10 Growth in mean raw reading t ime
11 Growth in mean raw product ion
12 Growth in mean raw la tency
13 Growth in mean normalized reading t ime
14 Growth in mean normalized product ion
15 Growth in mean normalized la tency
16 Growth in pause frequency
17 Growth in help ra te
18 Growth in percentage words correct
Given a set of fea tur es we predict a dependent var iable by using st epwise
linear regression to fit sta t ist ica l models and select ing the model with
maximum adjust ed R2
4 EVALUATION OF TEMPLATE MODELS
We eva lua ted our approach direct ly aga in st a human -scored flu ency rubr ic
and indirect ly by it s abilit y to pr edict test scores an d ga ins
41 Estimating rubric scores
To analyze th e fea sibilit y of au toma t ing a convent ion al mult i-dimen siona l
fluency rubr ic we took a sample of 10 studen ts in our da ta set st ra t ified by
ora l reading ra te to ensure a diver se sample We took the fir st 10 sen tences
each from th e fir st and last stor ies each studen t read so a s to include
var ia t ion cau sed by ch ange in flu ency over t ime Two independent
annota tors hand-ra t ed studen tsrsquo expression phrasing smoothness and pace
for each sen tence on a 4-poin t sca le specified by th e fluency ru br ic shown in
Table 1 [Zutell and Rasinski 1991]
We averaged th e two ju dgesrsquo r a t ings over th e 20 sen tences for each
studen t on each dimen sion and overa ll (averaged across th e 4 dimen sions)
(One judge marked 3 sen tences ldquoun scorablerdquo becau se th ey were off-ta sk so
we changed th eir ra t ings to 1 on each dimen sion for purposes of ana lysis ) To
quant ify th e in t er -ra ter reliability of these two cont inu ous-va lu ed average
ra t ings for each dimen sion of th e rubr ic Table 5 uses two types of measures
The in t raclass cor r ela t ion coefficien t [Shrou t an d Fleiss 1979] measures
in ter -ra ter r eliability on a sca le from 0 (worst ) t o 1 (per fect ) Absolu t e
difference on a 4-poin t sca le is less sophist ica t ed sta t ist ica lly bu t more
underst andable in tu it ively both as an average va lue and in t erms of how
oft en it fa lls under some th resh old
In t racla ss cor r ela t ion would be 1 for per fect agreemen t and was
approxima tely 07 or bet t er a t the studen t level for every dimen sion except
smoothn ess whose scor in g was impeded by two factor s F ir st th e Reading
Tutor pr esen ted text on e sen tence a t a t ime which precluded observa t ion of
normal pau ses before sen tences Second th e annota tor s used a tool [Mostow
et a l 2010] tha t played back or a l reading one u t terance a t a t ime ra th er
than an en t ir e sen tence making some a spect s h arder to score An u t ter ance
is a segment of speech delim it ed by a silence so a sen tence r eading tha t
con ta ins pau ses can con sist of mult iple u t t erances
To compare to publish ed resu lt s we a lso ana lyzed in ter -ra ter differ ences
as repor t ed by Rasinski et a l [2009] for a var ian t sca le tha t collapsed
Phrasing and Expression ldquoExact match es or agreement between coder s was
ach ieved in 81 of th e samples and adjacen t (on e poin t difference)
agreemen t was found in the remain ing 19rdquo In con t rast t o th eir discr ete 4-
poin t studen t -level scores our studen t -level scores a re averages of sen tence-
level scores which seldom match exact ly Therefore the last two columns of
Table 5 repor t the equ iva len t r eliabilit ies ndash the percen tages of studen ts for
whom th ese averages differed by less than 05 or up to 1 We had lower
percen tages of agreemen t with in 05 poin t s than the 81 ra t e of exact
matches r epor t ed by Rasinski et a l bu t like them we ach ieved 100
agreemen t with in 1 poin t on a ll sca les ndash except smoothness where th e two
judges never th eless differ ed by less than 15 poin t s on a ll 10 studen t s
However even th e reliability r epor ted by th e rubr ic au th or is
disappoin t ing Agreemen t with in on e poin t on a 4-poin t sca le is not a very
st r ingen t cr it er ion consider ing th a t two randomly chosen va lues will ach ieve
it 75 of the t ime Moreover th is agreement is a t t he studen t level ba sed on
reading an en t ire passage
It is th er efore unsurpr ising tha t in t er -ra t er reliability was con siderably
lower for scor ing individu al sen tences on a discr et e 4-poin t sca le as
Table 6 shows in compar ison to Table 5 Average in ter -ra ter differ ences
were la rger for single sen tences than aver aged over the 20 sen tences for each
studen t Perhaps readin g professiona ls would agree bet t er or the rubr ic is
simply too su bject ive However the simplest explanat ion is tha t a single
sen tence is in sufficien t t o ra te reliably on th is rubr ic
Table 5 Inter-rater agreement on fluency rubric at the student level (N=10 students)
Ru bric
d im en sion
In ter-rater re liability
(In traclass
corre lat ion )
Mean absolu te
d ifferen ce
Un der
05 With in 1
Expression
and Volume 0798 0290 70 100
Phrasing 0681 0415 60 100
Smoothness 0283 0695 30 80
Pace 0721 0400 50 100
Overa ll 0685 0408 60 100
Table 6 Inter-rater agreement on fluency rubric at the sentence level (N=200 sentences)
Ru bric
d im en sion
In ter-rater re liability
(In traclass
corre lat ion )
Mean absolu te
d ifferen ce
Un der
05 With in 1
Expression
and Volume 0593 0570 50 94
Phrasing 0535 0685 43 89
Smoothness 0398 0845 34 84
Pace 0578 0620 46 93
Overa ll 0638 0570 41 87
Table 7 Experiments to estimate rubric scores
Model Fluency rubr ic
In pu t Prosodic fea tures of 200 sen tences read by 10
students
Train Stepwise linear regression
Aggregate Averages over 20 sen tences for each student
P redict Sentence level rubr ic scores on four dimensions
Evalu ate Leave-1-out cross-valida ted cor rela t ion
To compu te cross-va lida ted cor rela t ion s we pr edicted the average of the
two annota tor srsquo ra t ings from st a t ic (ie excluding ra te -of-change) fea tures of
each studen t rsquos ora l reading using SPSS stepwise lin ear r egression on th e
rest of the studen t s
Table 7 summar izes th is exper iment As Table 8 shows predicted va lu es
cor rela t ed sign ifican t ly (plt001) [Soper 2010] with th ese ra t ings for
expression and smoothn ess bu t n ot for phrasing an d pace Th is per formance
is even less impressive because the sample of 10 studen ts was st ra t ified and
the resu lt ing heterogen eity tends to magnify cor r ela t ions In sh or t dir ect
compar ison far ed poor ly for want of a reliable h uman gold standard we
needed a bet t er way to eva lua te our approach so we r esor t ed to an indir ect
compar ison
Table 8 Estimating student-level rubric scores using automated features (N=10 students)
Ru bric d im ens ion Cross -validated
corre lat ion P valu e
Expression and Volume 0902 0000
Phrasing 0281 0431
Smoothness 0768 0009
Pace 0448 0194
42 Predicting test scores
Idea lly we would eva lua te meth ods for au tomated a ssessment of or a l r eading
prosody direct ly aga in st a gold standard measure assessing the prosody of
each r ead sen tence Th e obvious candida te for such a measure is a human -
scored rubr ic to eva lu a te ora l r eading flu ency a s descr ibed in Sect ion 41
However these labor -in t ensive ra t ings would cost too much to score la rge
amount s of da ta Moreover their in t er -ra ter reliability on a sample of 200
read sen tences was disappoin t ing especia lly a t the level of individual
sen tences
In the absence of a reliable gold standard we eva lua ted our au toma ted
meth ods indir ect ly by how well they predict ed stu dentsrsquo scores and ga ins on
standard measures of or a l reading fluency and compreh ension ou t side th e
Reading Tutor We admin ist er ed h igh ly r eliable psychometr ica lly va lida ted
paper t est s individually a t th e beginn ing (pretest ) and end (post test ) of th e
semester We measured ga ins as post test (end-of-semester ) minus pret est
(before u sing th e Reading Tutor )
The fluency t est measured ora l reading ra t e a s the number of words read
cor rect ly in on e minute on a passage a t th e studen t rsquos grade level (2 3 or 4)
[Deno 1985] To measure ora l reading ra t e we used grade-appropr ia t e
fluency passages provided by reading exper t a n d former LISTENer Dr
Rollanda OrsquoConnor In pr ior studies with th ese test passages th e with in -
grade para llel form r eliability was 092 con sisten t with other r eliability
est ima tes for or a l r eading ra te [eg Compton and Appleton 2004]
Long words t ake longer to read mean word reading t ime for k-let t er
words cor r ela tes very st rongly with k (R2 = 983) [Mostow and Beck 2005]
Harder text has longer words so our test passages for grades 23 and 4
differed in average word length (38 41 and 44 r espect ively) To con t rol for
th is difference we n ormalized fluency test scores a s let ter s per second
inst ead of words per minu te
The ora l r eading ra t e measured by such fluency test s is n ot the same
const ruct a s the ora l r eading prosody assessed dir ect ly (though unreliably) by
human ra t ers However previous work [Benjamin and Schwan enflugel
2010] had a lr eady rela t ed ch ildrenrsquos ora l reading prosody on two text
passages to th eir comprehension scores Moreover idea l assessment of ora l
reading prosody wou ld u nobtru sively measure comprehen sion of th e t ext
Thus r eading comprehen sion scores a r e a compelling cr it er ion to va lida te
aga inst An even more compelling cr iter ion would be comprehen sion of th e
specific sen tences read a loud [Zhang et a l 2007] However in t er rupt ing
after each sen tence to test compreh en sion would slow down reading disrupt
it s flow and affect comprehension
To measure reading comprehen sion we used the Passage Compreh ension
compon ent of th e commercia lly ava ilable Woodcock Reading Mastery Test
[Woodcock 1998] The Passage Compreh ension subtest con sist s of sh or t
passages with mult iple choice cloze (fill-in -th e-blank) quest ion s and has
with in -grade r eliability of 09 in ear ly grades [Bern inger et a l 2006]
To eva lua te our prosody measures we needed models to predict t est scores
from them Beck et a l [2004] in t roduced a model using fea tur es based on
in ter -word la t ency Th is latency-based model pr edicted post test flu ency well
with cross-va lida ted mean with in -grade cor r ela t ion of 083 compared to th e
upper bound of 1 (Th e overa ll cor r ela t ion for a sample tha t spans mult iple
grades reflect s th e heterogeneity of the sample a s much as the accuracy of
the model Comput ing the cor r ela t ion with in each grade and averaging these
with in -grade cor r ela t ions avoids th is spur iou s in fla t ion ) Beck et a l did not
predict compreh en sion or ga ins bu t we did so by replica t ing their model
We then extended th is la tency-based model in to a correlation+latency
model by adding our t empla te-based fea tur es of or a l reading including ra t e -
of-change fea tures as well as sta t ic fea tures To avoid ou t lier s we considered
on ly th e 55 studen t s who read a t least 20 sen tences We t r a in ed models on
a ll th e da ta from th ese 55 studen ts using st epwise linear r egression in SPSS
Test scores sh ould incr ease over t ime Cor r ela t ing predict ed aga in st
actua l post t est scores an d ga ins gives cr edit on ly for predict ing differences
among students n ot merely for predict ing the average incr ease over pr et est
scores
In genera l pr et est scores a re st rong predictor s of post t est scores so we
compared cor rela t ion +la tency models aga in st pretest scores as predictor s of
studen tsrsquo post test scores and pre- to post test ga in s We a lso t r a in ed hybr id
correlation+latency+pretest models to predict post t est scores and ga ins by
augment ing pretest scores with the au tomated fea tures so as to measure th e
addit iona l pr edict ive power con t r ibu ted by th e fea tu res
Table 9 summar izes th is exper imen t We eva lua ted models by th eir cross -
va lida ted mean with in -grade cor r ela t ions between predicted and actua l
va lues Like Beck et a l [2004] we cor rela t ed predicted with actua l va lu es for
each grade and compu ted the a r ithmet ic mean of th ese with in -grade
cor rela t ion s As Table 10 shows th e cor rela t ion+la t ency models
ou tper formed pret est scores and la t ency-based models acr oss the board in
predict ing flu ency and comprehen sion scores and ga ins ndash in two ca ses even
bet t er than aft er adding pret est scores The fir st r ow of the t able sh ows h ow
well each pr et est predict ed post t est and ga ins in the same skill We a lso
found tha t fluency pr et est predicted post t est scores and ga ins in
com prehension with respect ive mean with in -grade cor r ela t ions of 0617
(unsurpr isingly lower th an using pret est t o predict post t est scores for th e
same skill) and 0297 (actua lly bet ter than comprehension pr et est predict ed
compreh ension ga ins) We computed th ese cor r ela t ions with in th r ee grades
(2 3 and 4) with N = 33 14 and 8 studen t s respect ively Cor rela t ion s in
grades 3 and 4 were genera lly h igher than in grade 2 and th e mean s r epor ted
in Table 10
Table 9 Experiment to predict test scores and gains
Model Template model
In pu t 77600 sen tence readings by 55 students aged 7-10 with test scores
24816 sen tence nar ra t ions by 20 adult s
Train Stepwise linear regression
Aggregate Average fea tures across sen tences weighted by number of words read
P redict Post test fluency and comprehension scores and gains
Evalu ate Leave-one-out cross-valida ted cor rela t ion of actua l and predicted va lues
Table 10 Cross-validated mean within-grade correlations of actual values (N=55 students) to values
predicted using regression against different features
Model featu res P ostte st
flu en cy
Comp
postte st
Flu en cy
gain
Comp gain
Pretest score 0809 0738 -0741 0202
Latency 0859 0724 0524 0453
Cor rela t ions+la tency 0872 0763 0934 0504
Cor rel+la tency+pretest 0965 0690 0867 0643
In our cor rela t ion+la t ency model th e fea tur es th a t expla in ed the most
var iance in post t est flu en cy were in order percen tage of words accepted a s
read with out hesita t ion normalized product ion t ime word reading t ime
normalized product ion cha nge ra te and la t ency cor r ela t ion with adu lt
nar ra t ions La tency st rongly in fluences 3 of our 5 top fea tur es (including
word reading t ime which is the sum of la t ency and product ion) The top
predictors in our cor rela t ion+la t ency model of post t est comprehen sion scores
were the percen tage of words with defin ed la tency (ie accepted by th e
speech r ecognizer as r ead cor rect ly without omit t ing the previous word [Beck
et a l 2004]) la t ency cor r ela t ion pitch cor r ela t ion percen tage of Dolch (h igh -
frequency) words with min imal la t ency and ch ange ra te of n ormalized
product ion cor r ela t ion n
Table 11 sh ows th e adjusted R2 of successive models tha t added each of
these fea tures in st epwise linear regression
Table 11 Top predictors in correlation+latency model
P ostte st flu en cy P ostte st compreh ens ion
Feature Adjusted R2 Fea ture Adjusted R
2
Percentage of words accepted as
read fluent ly 0836
Percentage of words with
defined la tency 0619
Normalized product ion t ime 0845 Cor rela t ion of la tency 0652
Speedup in normalized product ion 0859 Cor rela t ion of pitch 0674
Cor rela t ion of la tency 0860 Percentage of Dolch words 0673
In compar ison Miller an d Schwanenflugel [2008] found pitch cor r ela t ion
to be th e best prosodic pr edictor of grade 3 fluency and r educt ion in pausa l
in t rusion s from grade 1 to grade 2 to be th e best a t predict ing grade 3
compreh ension La tency and pitch cor rela t ion were likewise among our most
predict ive fea tures However la t ency predicted flu ency and pitch cor rela t ion
predict ed compr ehen sion ra ther than vice versa Our resu lt s make sense
insofar a s disflu ency ndash slow labor ious reading with many fa lse sta r t s and
resta r t s ndash is closely r ela ted to la t ency Also one expect s in tona t ion to r eflect
underst anding as it r equ ir es sen sit ivity to syn tax con t rast ive st r ess and t ext
style
43 Com parin g to ru bric -base d pre dic tion
How did our au tomat ica lly computed t empla te-based fea tur es compare to th e
hand-scored fluency rubr ic in predict ing the same studen ts rsquo t est scores To
find ou t we t ra ined models on th e hand-scored rubr ic ra t ings for the 10
studen ts using Wekarsquos linear r egression with the M5 fea tur e select ion
meth od We evalua ted th e t ra ined models u sing leave-1-ou t cross-va lida t ion
to avoid over fit t ing Table 12 summar izes rubr ic-based predict ion of test
scores
Table 12 Experiments in rubric-based prediction of test scores
Model Fluency rubr ic
In pu t Sentence level rubr ic scores on 4 dimensions of 200 sen tences read by 10 students
Train WEKA linear regression with M5 fea ture select ion
Aggregate Average over 20 sen tences for each student
P redict Post test fluency and comprehension scores
Evalu ate Cross-valida ted correla t ion of actua l and predicted va lues
We fit templa te-based pr et est -based and pret est+templa te models to th e
45 remain ing studen t srsquo post t est scores To eva lu a te th ese models we used
the da ta from the 10 studen t s with rubr ic scores as a h eld -ou t t est set Th is
procedure enabled us to compare the rubr ic-based and oth er models on th e
da ta from th e same 10 stu den ts
Table 13 compares cor r ela t ions for th e four types of model All models
predict ed post t est fluency with cor rela t ion 08 or bet t er th anks to th e
heterogeneity of a small sample of studen ts st ra t ified by fluency In
predict ing post t est comprehen sion th e templa te-based model per formed
bet t er th an th e rubr ic-based model But was it becau se it s fea tur es were
actua lly more pr edict ive or just th a t it u sed more da ta
Table 13 Correlation of predicted to actual posttest scores for 10 rubric-scored students
Model P ostte st flu en cy P ostte st
compreh ens ion
Rubr ic-based 0930 0300
Pretest -based 0946 0786
Templa te-based 0946 0454
Pretest + templa te 0801 0310
44 Varying the amount of training data
To dist inguish whether the in fer ior per formance of the rubr ic-based models
was due to wor se fea tu res or to less da ta we compared th em aga inst
templa te-based models t ra ined on th e same 10 studen ts One t ra in ing
condit ion used on ly the 200 sen tences scored by the rubr ic annota tor bu t
inst ead of th eir manual scores it used th eir au tomated fea tur es Another
condit ion t ra in ed on a ll the sen tences r ead by these 10 studen t s (2503
sen tences ranging from 95 to 464 sen tences per studen t ) not just th e hand-
scored ones
Table 14 compares th e leave-ou t -one cr oss-va lida ted accuracy of both
these models to th e models eva lua ted in Table 13 Tra ined on th e same 200
sen tences th e t empla te-based model expla in ed 3 less of th e var iance in
fluency than the ru br ic-based model bu t 4 more of the var iance in
compreh ension
Table 14 Cross-validated correlations of predicted to actual posttest scores using template models trained on different amounts of data
Train in g data for template mode ls P ostte st flu en cy P ostte st
compreh ens ion
Trained on only 200 sen tences from 10 students 0902 0342
Tra ined on a ll sen tences from 10 students 0981 0713
Tra ined on a ll 45 other students 0946 0454
As expected u sing more da ta from th e same 10 studen t s resu lted in bet t er
templa te-based models for fluency (expla in ing 8 more var iance) and
especia lly for comprehen sion (doubling th e amount of var iance expla in ed)
The templa te-based models t r a ined on the oth er 45 studen t s did bet t er
than th e rubr ic- and t empla te-based models t ra ined on on ly 200 sen tences
from th e 10 studen t s bu t not as well as models t r a ined on a ll of th eir da ta
Given en ough da ta about the 10 studen ts th e t r a in ed models eviden t ly
exploit ed some character ist ics of th is group even th ough they were cr oss -
va lida ted acr oss studen t s to keep th em from using in format ion about th e
held-ou t studen t
In shor t th e templa te-based models ou tpredict ed th e rubr ic-based models
pr imar ily th anks to t r a in ing on more da ta about the 10 studen ts than to it s
fea tur es which were actu a lly a bit wor se than the rubr ic-based fea tur es a t
predict ing flu ency from th e same da ta and on ly sligh t ly bet t er than th em a t
predict ing compreh ension Th e rest of th is paper does n ot depend on human -
scored ra t ings of ora l r eading prosody
5 GENERALIZED MODELS
Sect ion 42 sh owed (in Table 10) th a t cor r ela t in g ch ildren rsquos or a l r eading
prosody again st adu lt na r ra t ions of th e same t ext helped (a long with other
sen tence fea tur es in Table 3) to pr edict th eir flu ency and comprehen sion
post t est scores about as well as or bet t er than pret est scores did and
predict ed th eir ga ins con siderably bet ter In th is sect ion we t ackle the same
problem of a ssessing ch ildren rsquos or a l reading prosody bu t elimin ate the n eed
for an adu lt nar ra t ion of each sen tence scored In st ead we adapt pr ior work
[J urafsky and Mar t in 2008] tha t t r a in s models of du ra t ion F0 and in t ensity
in order to map t ext to prosody We t ra in sim ilar models bu t inst ead of using
them to prescr ibe a specific prosodic con tour we use them to a ssess ch ildr en rsquos
prosody We t ra in our model on mult iple adu lt voices so it is not specific to
the idiosyncrasies of on e speaker Th is model a lso lets us score r eadings of
new t ext unnar ra t ed by adu lts
Prosody can be quan t ified by dura t ion pitch and in t ensity As Sect ion 42
repor ted we found dura t ion -based fea tur es st rongest in predict ing paper
test s of fluency and comprehen sion Our work on detect ing prosody
improvement [Duong and Mostow 2009] a lso found dura t ion -based fea tur es
st r ongest Th is sect ion th erefore focu ses on dura t ion how we t ra in a model
to syn th esize dura t ions t he fea tur es it u ses and how we t ran sform it in to a
model to a ssess ora l r eading prosody
51 Duration model for synthesis
Severa l dura t ion models eith er ru le-based or st a t ist ica l have been shown to
work well in speech syn th esis Most well-kn own among th e ru le-based
meth ods is the method of Kla t t [1979] which uses ru les to model th e average
dura t ion of a phon e given it s sur rounding context Examples of good mach in e
learn ing meth ods for prosody models a r e decision t r ees [Breiman et a l 1984
Quin lan 1986] and the su m-of-products model [van San ten 1994 van
San ten 1997 van San ten 1998] Using adu lt n ar ra t ion s of hundreds of
stor ies in th e Reading Tutor a s t r a in ing da ta we decided to t r a in a decision
t ree model of ph one dura t ion using tools in th e Fest iva l Speech Synthesis
System [Hun t and Black 1996] Given r ecorded t r anscr ibed u t t erances the
t ra in er computes a set of fea tur es for each ph one an d bu ilds a decision t ree
using th ese fea tur es Ra ther than simply using a ll fea tur es th e t ra in er uses
a greedy st epwise approach to select which set of fea tures to u se Each st ep
test s th e fea tur es to find the best fea tur e to add n ext Given a n ew t ext t o
syn thesize the model gen era t es each phon ersquos dura t ion a s follows F ir st it
computes the select ed fea tures of th e ph one and it s sur rounding context up
to the u t t erance level t o place the phon e in the appropr ia te leaf node It th en
uses th e mean dura t ion of a ll t ra in ing da ta inst ances tha t have fa llen in to
tha t leaf node a s th e syn thesized dura t ion for the phone We n ow descr ibe
the fea tur es used in the model
52 Features in duration model
Our dura t ion model uses fea tur es of th e phon e it self a s well a s con textu a l
fea tur es abou t the syllable st ructur e and the word con ta in ing th e phone
Phon e level fea tures include th e phon e name it s posit ion in th e syllable
whether it occur s before or a ft er the syllablersquos nu cleus and wh eth er it rsquos a
consonant or a vowel For a vowel we compute length (shor t long diph th ong
or schwa) h eigh t (h igh mid or low) fron tn ess (fron t mid or back) and
roundedness (rounded or unrounded) For a conson ant we include type (stop
fr ica t ive a ffr ica t ive nasa l la ter a l or approximant) place of a r t icu la t ion
(labia l a lveolar pa la ta l labio-den ta l den ta l vela r or glot ta l) and voicing
(voiced or unvoiced) For some of th ese fea tures we a lso look two ph ones to
the left and r igh t Syllable level fea tur es include n umber of phones in on set
and coda posit ion in word dist ance to end of the phrase number of syl lables
from la st and next phrase breaks number of st r essed syllables from la st and
next phrase breaks and the lexica l st r ess of the syllable At the word level
we use th e number of syllables in the word and it s con text -sensit ive par t of
speech
53 Using a synthesis model for assessment
So far we have simply descr ibed common pract ice in prosodic syn th esis The
novelty of our meth od is in t ransforming a model for syn thesizing speech in to
a model for a ssessing ch ildren rsquos or a l reading To th is end we t ra in the model
similar ly to what is don e for syn thesis bu t u se it differen t ly In st ead of u sing
the mean dura t ion a t each leaf node of th e decision t ree to prescr ibe the
dura t ion for a phon e bein g syn thesized we use the mean (and possibly th e
standard devia t ion ) of a ll the in stances a t th e leaf n ode to score th e observed
dura t ion of the ph one bein g assessed
Figure 3 Decision tree fragment with two IH nodes
Figure 3 depict s a fragment of a simple (ma de-up) t r ee cover ing the two
inst ances of the phon e IH in speaking th e sen tence T his is an exam ple Th e
IH in T his is in th e middle of th e syllable so wh en it reach es the ldquoSyllable
in it ia lrdquo t est it follows the left branch to th e bot tom left leaf Conver sely the
IH in is occur s a t th e beginn ing of the syllable so it follows the r igh t branch
to the bot tom r igh t leaf Each ph one con t r ibu tes to the t r a in ing in st ances
used to est imate the mean and standard devia t ion a t it s leaf node According
to these (fict it iou s) est imates adu lt nar r a tors t end to pronounce IH longer
in is than in T his bu t with grea ter var iability How can we use such
sta t ist ics to score ch ildrenrsquos or a l r eading
Given a ch ildrsquos u t t erance and a t ra in ed decision t ree we eva lu a ted
differen t formulas for how to compute phon e-level scores and aggregate th em
in to an overa ll score for the u t ter ance In th e following equa t ion s u is th e
u t ter ance to score con ta in ing n phones th e pirsquos a r e phones in tha t u t ter ance
di is th e actua l dura t ion produced by the ch ild for phone p
i and μ
i and σ
i are
the mean and standard devia t ion of the t ra in ing da ta for tha t ph one
1 Average log likelih ood
up i
ii
i
d
nllavg )
2
)(exp(
2
11_
2
2
2
2 Average z-score
up i
ii
i
d
nzscoreavg
1_
3 Pearson cor rela t ion coefficien t
up
i
d
i
iss
dd
nncorrelatio ))((
1
1
where sd and s
μ are th e st andard devia t ion of the actua l dura t ion and
mean dura t ion r espect ively of th e ph ones in th is u t terance
4 Root mean squared er ror (RMSE)
up
ii
i
dn
RMSE 2)(1
5 Mean absolu te er ror (MAE)
up
ii
i
dn
MAE1
6 Correla t ion of word dura t ions
jword
j
D
j
ss
DD
wordscorreldurword ))((
1
1__
where Dj and M
j r epresen t the actua l and prescr ibed dura t ion s of
wordj r espect ively
7 Weighted average of word-level cor r ela t ions
jword
jj correlwordphonesn
correlwordavg _1
__
Measures 1-5 combin e th e scores of individual phones (including silences)
direct ly in to an u t t erance level score Measure 1 (average log likelih ood)
indica tes h ow close th e ch ildren rsquos dura t ion s a r e to the model and a ssumes
tha t a ll th e phon es in the u t t erance ar e independent It takes in to account
both th e means and th e standard devia t ions est imated from the t r a in ing
da ta Measure 2 (z-score) a lso u ses the st andard devia t ion s a s well as th e
mean s specifica lly to normalize th e distance of an instance from th e mean
Measures 3-5 con sider on ly the mean dura t ions measur ing h ow far th e
ch ildren rsquos dura t ion s a r e from these mean s Measu res 4 (root mean squ ared
er ror ) and 5 (mean absolu te er ror ) con sider on ly the differ ence between t he
modelrsquos mean s and th e ch ildren rsquos actua l dura t ions wh ereas measure 3
(dura t ion cor r ela t ion) looks in addit ion a t whether the two sequences follow
similar con tours
Measures 6 and 7 fir st compute scores a t the word level and th en combin e
these word level scores in to u t t erance level scores For Measure 6 we fir st
compute th e tota l dura t ions of the ph ones in each word (including th e
preceding silence) ndash both the actu a l dura t ions of the phones spoken by the
ch ild and the dura t ions prescr ibed by the syn th esis model (namely th e mean
dura t ion s of th e t ra in ing examples for the cor responding leaf nodes) We
then compute the cor r ela t ion between the actu a l an d prescr ibed dura t ion s of
the words in the u t t erance For Measure 7 we fir st cor r ela te the actua l and
prescr ibed dura t ion s of th e ph ones in each word obta in ing one cor r ela t ion for
each word We then t ake th e weigh ted average of these cor r ela t ions u sing
the number of phon es in each word a s th e weigh t
When we compute these scores we mu st h andle cases where a ch ild
misr ead skipped or r epea ted words J u st as for t empla te models we
consider on ly the ch ild rsquos fir st a t tempt to r ead a word and exclude words tha t
the ch ild skipped or tha t the tu tor a ssisted before the ch ild cou ld a t tempt
them We count th e nu mber of such words in each u t ter ance and use th e
percen tage of included words to weigh t the score of each u t t erance wh en we
combin e th e scores of a ll t he u t t erances Th is weigh t ing scheme gives h igh er
weigh ts to sen tences with fu ller observa t ions of th e ch ildrsquos per formance
Our models leave room for fu r ther improvement We plan to t ra in similar
models for la tency pit ch and in tensity in order to der ive a more
compreh ensive set of scores for ch ildren rsquos ora l r eading prosody The Fest iva l
toolkit pr ovides st ra igh t forward modules to t r a in syn thesis models for these
fea tur es and t ransforming them in to models for scor ing sh ould be very
similar t o t r ansforming the dura t ion model Another limita t ion con sists of
comput ing decision t r ee est imates (mean an d st andard devia t ion) solely from
the sta t ist ics a t the leaf level Alth ough taking standard devia t ion in to
account uses more in format ion th an syn thesizing based solely on the mean
est ima tes a t leaf nodes may be based on spar se da ta To mit iga te th is
problem we had a ru le to stop split t ing th e t r ee whenever ther e a re fewer
than 20 t ra in ing instances A more pr incipled approach would use deleted
in terpola t ion [Magerman 1995] which smooth es sparse est imates of leaf-
level probabilit ies condit ioned on many fea tur es of the phon e by combin ing
them with bet t er -est imated bu t less specific probabilit ies a t h igher levels in
the t r ee However before extending the approach to eva lua te la t ency pitch
and in t ensity or u se more sophist ica t ed est ima tes it ma kes sen se to eva lua te
the basic idea as we n ow descr ibe
6 EVALUATION OF GENERALIZED MODELS
What is a bet ter way to score ch ildren rsquos ora l r eading prosody ndash compar ison to
fluen t adu lt nar ra t ion s of the same sen tences or a genera lized model t r a ined
on th ose nar r a t ion s To address th is qu est ion we eva lua ted both meth ods
We combined th e u t ter an ce-level scores for each studen t a s descr ibed in
Sect ion 53 t o a r r ive a t 7 differen t scores for the studen t We th en t ra in ed a
linear regression model to predict studen ts rsquo t est per formance u sing th ese
scores a s independen t var iables Table 15 summar izes th e overa ll eva lua t ion
procedure
We compared our genera lized models aga inst t empla te models To make
the compar ison fa ir th e templa te models used on ly fea tures rela t ed to
dura t ion not pitch or in ten sity Th ese fea tu res included ch ild -adult
cor rela t ion s for word product ion la tency and r eading t ime both raw and
after n orma lizing for word length Here product ion or word dura t ion is th e
t ime to speak th e word la tency is th e t ime between successive t ext words
including ldquofa lse st a r t s sounding ou t r epet it ion s and oth er in ser t ions
whether spoken or silen trdquo [Beck et a l 2004 Mostow and Aist 1997] and
word reading t ime is th e sum of product ion and la tency
Table 15 Generalized model experiments
Mode l Genera lized model
Data 24816 sen tence nar r a t ion s by 20 adu lts 77600 sen tence
readings by 55 studen t s aged 7-10 with t est scores
Train Regression t r ees to map t ext fea tures to adu lt phon eme
dura t ion s linear r egression (Enter and Stepwise) to predict
test scores from ch ild rsquos prosody
Aggre gate 7 formulas to combine phone level fea tures in to sen tence level
prosodic fea tur es
P re dic t Post test comprehen sion and fluency scores
Evalu ate Adjusted R2 of pr edict ed vs actua l scores
In our exper iment s we used SPSSrsquos lin ear regression funct ion with either
the Stepwise or Enter meth od of select ing fea tures The Enter method
simply includes a ll the fea tur es in the model whereas the bidir ect ion a l
Stepwise meth od in ser ts or r emoves on e fea ture a t each step based on an F -
test Th is gr eedy method somet imes does worse so we t r ied both methods
and repor t ed th e adjust ed R2 of the two
Table 16 compares the adjusted R2 of two types of models The templa te
models use fea tur es computed by cor rela t ing th e ch ild rsquos and adult nar r a tor rsquos
prosodic con tour for each sen tence as descr ibed in Sect ion 3 Th e genera lized
models u se scores ou tpu t by the syn thesis model t r a ined on the same set of
adu lt nar r a t ions a s descr ibed in Sect ion 5
As Table 16 shows th e genera lized model account s for 72 more var iance
in fluency and 233 in compreh ension th an the templa te model based on
adjusted R2
for Enter or Stepwise which ever is h igher Th e fact tha t th e
genera lized models ou t -predict ed the t empla te models means th ey ga ined
more by gen era lizing across differ en t sen tences th an they lost by ignor ing the
sen tence deta ils th ey did not capture Table 16 Adjusted R
2 of competing models
Dependent variable Template Generalized
Enter Stepwise Enter Stepwise
Posttest fluency 0555 0565 0635 0637
Posttest comprehension 0355 0362 0580 0595
Table 17 Adjusted R2 of pretest with vs without generalized model scores
Dependent variable Pretest Pretest + generalized
Enter Stepwise Enter Stepwise
Posttest fluency 0873 0852 0852 0866
Posttest comprehension 0783 0792 0813 0813
Speaker s did n ot over lap between th e adu lt nar r a t ions used to t ra in the
genera lized models and th e ch ildrenrsquos ora l r eading used to test th em bu t t ext
over lapped th e ch ildren read th e same sen tences nar ra ted by the adu lt s
However th e amount of t ra in ing da ta (24816 sen tences t im es roughly 50
phonemes per sen tence) is so la rge r ela t ive to the size of th e ph oneme-level
decision t ree t r a ined on them (11123 decision n odes) a s to a ssu age fears of
over fit t ing th ose par t icu la r sen tences Con sequen t ly the gen era lized models
should per form well on un seen sen tences drawn from a similar dist r ibu t ion
Pretest scores a re typica lly st r ong predictor s of post -test scores so we a lso
test ed wheth er gen era lized models with pretest score as an addit iona l fea tur e
did bet t er than pr et est score a lone Table 17 shows tha t pret est scores
ach ieved h igh adjusted R2 Adding th e genera lized modelrsquos fea tures actua lly
reduced adjust ed R2
for fluency by 07 from 0873 to 0866 (conceivably an
ar t ifact of over fit t ing by Enter ) bu t accoun ted for 21 addit iona l var iance in
compreh ension
In models const ructed by st epwise regression we not iced tha t th e average
log likelih ood score for th e u t t erance (Measure 1) was a lways th e fir st fea ture
to be selected somet imes the on ly on e Th is findin g demon st ra tes th e va lu e
of incorpora t ing th e standard devia t ion of ph one dura t ions in to th e scores
7 CONTRIBUTIONS AND FUTURE WORK
In th is paper we presen ted two methods to a ssess or a l r eading prosody
au tomat ica lly and eva lu a ted them on a la rge corp us of r ea l or a l r eading by
rea l ch ildren r ecorded by Project LISTEN rsquos Reading Tutor in r ea l sch ools
The t empla te model method scores a ch ildrsquos ora l reading prosody by
cor rela t ing it aga inst a fluen t adu lt nar r a t ion of the same sen tence More
precisely it u ses such cor rela t ions as inpu t var iables in a lin ear r egression
model to predict studen tsrsquo t est scores and ga ins
The genera lized model meth od t ra ins a prosodic syn thesis model on the
same fluen t adu lt nar r a t ion s and t ransforms it to score ch ildr en rsquos or a l
reading prosody We showed how to u se th e t ra ined syn thesis model to score
each phon e and invest iga ted seven differen t formulas to combin e phon e
scores to score words and u t ter ances Two of th ese formulas exploit standard
devia t ion s of th e fea ture va lues under lying each leaf of the t r a ined decision
t ree Th e meth od t ra ins genera lized models of ora l reading prosody tha t
cou ld be u sed to score sen tences n ot in th e t ra in ing corpus
We evalua ted th e t empla te meth od aga inst a flu ency rubr ic on a sample of
10 studen t s st r a t ified by reading proficiency Two human judges scored 20
sen tence r eadings by each studen t However th eir in ter -ra ter r eliability was
low especia lly for individual sen tences making th em problemat ic to predict
au tomat ica lly we did bet t er in est imat in g scores a t the studen t level
We evalu a ted both of our meth ods indir ect ly by their ability to pr edict
studen tsrsquo scores on flu ency and comprehen sion t est s Th e gen era lized models
bea t the templa te models on both tasks Moreover the gen era lized model
meth od is qua lita t ively su per ior in tha t it elim inates th e r equ irement for an
adu lt t o nar ra te each sen tence in order for the computer to score it Although
it st ill r equ ires a nar ra t ed t ra in ing corpus a genera lized model applies to any
sen tence wh ereas a t empla te model is r est r icted to th e sen tences in the
corpus Th e opposit e r esu lt would have suggested tha t th e phon e fea tur es
employed by th e gen era lized model fa iled to capture enough in format ion
abou t the sen tence text t o score it s prosody as accura tely as compar ing it t o
the adu lt n ar ra t ion Eviden t ly the smoothness added by gen era lizing over
mult iple nar ra tor s and sen tences more than compensa ted for whatever
in format ion was lost by ignor ing sen tence deta ils unrepresen ted by the ph one
and context fea tur es in the gen era lized model
Besides extending the genera lized model method to score la tency pitch
and in t ensity we are working to min e the t r a ined models for usefu l
knowledge [Mostow and Sita r am 2011] F ir st charact er izing which
sen tences a r e scored more accura tely by a templa te model than by a
genera lized model may revea l impor tan t t ext fea tures tha t govern ora l
reading prosody bu t a r e missing from th e gen era lized model Second
charact er izing which decision t ree nodes a r e especia lly st r ong predictor s of
compreh ension test scores or ga ins may revea l specific prosodic kn owledge
tha t facilita t es r eading comprehen sion Th ird charact er izing which
sen tences a r e especia lly st rong pr edictors of test scores or ga ins may revea l
fea tur es of t ext tha t make it especia lly diagnost ic for scor ing ora l reading
prosody or predict ing comprehen sion Evidence for the poten t ia l va lue of th is
direct ion comes from r ecen t work [Benjamin an d Schwanenflugel 2010]
rela t ing ch ildr en rsquos ora l r eading of two t ext passages to th eir compreh ension
scores Th eir per formance on th e harder text passage tu rned ou t to be h igh ly
predict ive in con t r ast t o the ea sier passage Th is finding suggests tha t we
might improve th e predict ive accuracy of our models simply by ignor ing
ch ildren rsquos prosody on easy t ext More genera lly it suggests tha t discover ing
fea tur es of words and sen tences especia lly predict ive of t est scores and ga in s
may shed new ligh t on how to a ssess pr edict an d improve ch ildren rsquos or a l
reading flu ency and comprehen sion
ACKNOWLEDGMENTS
We thank Drs Pau la Schwanenflugel and Melanie Kuhn for their exper t ise the
educa tors students and LISTENers who h elped gen era te our da ta and Anders
Weinstein for implement ing the prosodic display depicted in F igure 2 Last bu t
defin itely not least we thank the reviewers for their const ruct ive cr it icisms and
helpfu l suggest ions
REFERENCES
BALOGH J BERNSTEIN J CHENG J and TOWNSHEND B 2007 Automatic evaluation of reading
accuracy assessing machine scores In Proceedings of the ISCA Tutorial and Research Workshop on
Speech and Language Technology in Education (SLaTE) Farmington PA October 1-3 2007 M ESKENAZI Ed 112-115
BANERJEE S BECK JE and MOSTOW J 2003 Evaluating the effect of predicting oral reading miscues
In Proc 8th European Conference on Speech Communication and Technology (Eurospeech 2003) Geneva Switzerland September 1-4 2003 3165-3168
BEATTIE VL 2010 Scientific Learning Reading Assistanttrade CMU Sphinx technology in a commercial
educational software application In CMU Sphinx Users and Developers Workshop Dallas TX March13 2010
BECK JE JIA P and MOSTOW J 2004 Automatically assessing oral reading fluency in a computer tutor
that listens Technology Instruction Cognition and Learning 2(1-2) 61-81 BECK JE and MOSTOW J 2008 How who should practice Using learning decomposition to evaluate the
efficacy of different types of practice for different types of students [Best Paper Nominee] In 9th
International Conference on Intelligent Tutoring Systems Montreal June 23-27 2008 353-362 BECK JE and SISON J 2006 Using knowledge tracing in a noisy environment to measure student reading
proficiencies International Journal of Artificial Intelligence in Education (Special Issue Best of ITS
2004) 16(2) 129-143 BENJAMIN RG and SCHWANENFLUGEL PJ 2010 Text complexity and oral reading prosody in young
readers Reading Research Quarterly 45(4) 388-404
BERNINGER VW ABBOTT RD VERMEULEN K and FULTON CM 2006 Paths to reading comprehension in at-risk second-grade readers Journal of Learning Disabilities 39(4) 334-351
BERNSTEIN J COHEN M MURVEIT H RTISCHEV D and WEINTRAUB M 1990 Automatic
evaluation and training in English pronunciation In International Conference on Speech and Language Processing (ICSLP-90) Kobe Japan 1990 1185-1188
BLACK M TEPPERMAN J LEE S PRICE P and NARAYANAN S 2007 Automatic detection and
classification of disfluent reading miscues in young childrenrsquos speech for the purpose of assessment In Proceedings of ICSLP Antwerp Belgium October 2007 2007
BOERSMA P and WEENINK D 2008 Praat doing phonetics by computer (Version 5033) [Computer
program downloaded from httpwwwpraatorg] BREIMAN L FRIEDMAN JH OLSHEN RA and STONE CJ 1984 Classification and Regression
Trees Wadsworth amp Brooks Pacific Grove CA
CMU 2008 The CMU Sphinx Group open source speech recognition engines [software at httpcmusphinxsourceforgenet]
COMPTON DL and APPLETON AC 2004 Exploring the relationship between text-leveling systems and
reading accuracy and fluency in second-grade students who are average and poor decoders Learning Disabilities Research amp Practice 19(3) 176ndash184
DENO SL 1985 Curriculum-Based Measurement The emerging alternative Exceptional Children 52(3)
219-232 DUONG M and MOSTOW J 2009 Detecting prosody improvement in oral rereading In Second ISCA
Workshop on Speech and Language Technology in Education (SLaTE) Wroxall Abbey Estate
Warwickshire England September 3-5 2009 M RUSSELL Ed GEROSA M and NARAYANAN SS 2008 Investigating automatic assessment of reading comprehension in
young children In Proceedings of the International Conference on Acoustics Speech and Signal
Processing (ICASSP) 2008 2008 5057-5060 HAGEN A PELLOM B and COLE R 2007 Highly accurate childrenrsquos speech recognition for interactive
reading tutors using subword units Speech Communication 49(12) 861-873
HASBROUCK JE and TINDAL GA 2006 Oral reading fluency norms a valuable assessment tool for reading teachers The Reading Teacher 59(7) 636-644
HUNT A and BLACK A 1996 Unit selection in a concatenative speech synthesis system using a large
speech database In Proceedings of ICASSP 96 Atlanta GA 1996 373-376 JURAFSKY D and MARTIN JH 2008 Speech and Language Processing (2nd ed) Pearson Prentice Hall
Upper Saddle River NJ KLATT DH 1979 Synthesis by rule of segmental durations in English sentences In Frontiers of Speech
Communication Research BEF LINDBLOM and S OHMAN Eds Academic 287-299
KUHN MR SCHWANENFLUGEL PJ MORRIS RD MORROW LM BRADLEY BA
MEISINGER E WOO D and STAHL SA 2006 Teaching children to become fluent and
automatic readers Journal of Literacy Research 38(4) 357-387
KUHN MR and STAHL SA 2003 Fluency A review of developmental and remedial practices Journal of
Educational Psychology 95(1) 3ndash21
LEE K HAGEN A ROMANYSHYN N MARTIN S and PELLOM B 2004 Analysis and detection of reading miscues for interactive literacy tutors In 20th International Conference on Computational
Linguistics (Coling) Geneva Switzerland August 2004
MAGERMAN DM 1995 Statistical decision-tree models for parsing In Proceedings of the 33rd Annual Meeting of the Association for Computational Linguistics MIT Cambridge MA June 26-30 1995
276-283
MILLER J and SCHWANENFLUGEL PJ 2006 Prosody of syntactically complex sentences in the oral reading of young children Journal of Educational Psychology 98(4) 839-853
MILLER J and SCHWANENFLUGEL PJ 2008 A longitudinal study of the development of reading prosody
as a dimension of oral reading fluency in early elementary school children Reading Research Quarterly 43(4) 336ndash354
MOSTOW J and AIST G 1997 The sounds of silence Towards automated evaluation of student learning in a Reading Tutor that listens In Proceedings of the Fourteenth National Conference on Artificial
Intelligence (AAAI-97) Providence RI July 1997 American Association for Artificial Intelligence
355-361 MOSTOW J AIST G BURKHEAD P CORBETT A CUNEO A EITELMAN S HUANG C
JUNKER B SKLAR MB and TOBIN B 2003 Evaluation of an automated Reading Tutor that
listens Comparison to human tutoring and classroom instruction Journal of Educational Computing Research 29(1) 61-117
MOSTOW J and BECK J 2005 Micro-analysis of fluency gains in a Reading Tutor that listens Wide vs
repeated guided oral reading Twelfth Annual Meeting of the Society for the Scientific Study of Reading Toronto
MOSTOW J BECK J BEY J CUNEO A SISON J TOBIN B and VALERI J 2004 Using automated
questions to assess reading comprehension vocabulary and effects of tutorial interventions Technology Instruction Cognition and Learning 2 97-134
MOSTOW J BECK J CUNEO A GOUVEA E HEINER C and JUAREZ O 2010 Lessons from
Project LISTENs Session Browser In Handbook of Educational Data Mining C ROMERO S VENTURA SR VIOLA M PECHENIZKIY and RSJD BAKER Eds CRC Press Taylor amp
Francis Group New York 389-416
MOSTOW J ROTH SF HAUPTMANN AG and KANE M 1994 A prototype reading coach that listens [AAAI-94 Outstanding Paper] In Proceedings of the Twelfth National Conference on Artificial
Intelligence Seattle WA August 1994 American Association for Artificial Intelligence 785-792
MOSTOW J and SITARAM S 2011 Mining data from Project LISTENs Reading Tutor to analyze development of childrenrsquos oral reading prosody In D COMPTON (Editor) Eighteenth Annual
Meeting of the Society for the Scientific Study of Reading St Pete Beach Florida
NRP 2000 Report of the National Reading Panel Teaching children to read An evidence-based assessment of the scientific research literature on reading and its implications for reading instruction 00-4769
National Institute of Child Health amp Human Development At
wwwnichdnihgovpublicationsnrppubskeycfm Washington DC OCONNOR RE WHITE A and SWANSON HL 2007 Repeated reading versus continuous reading
Influences on reading fluency and comprehension Exceptional Children 74(1) 31-46
PINNELL GS PIKULSKI JJ WIXSON KK CAMPBELL JR GOUGH PB and BEATTY AS
1995 Listening to children read aloud Oral reading fluency National Center for Educational
Statistics Washington DC
PRICE P TEPPERMAN J ISELI M DUONG T BLACK M WANG S BOSCARDIN CK HERITAGE M PEARSON PD NARAYANAN S and ALWAN A 2009 Assessment of
emerging reading skills in young native speakers and language learners Speech Communication 51
968ndash984 QUINLAN JR 1986 Induction of decision trees Machine Learning 1 81-106
RASINSKI T RIKLI A and JOHNSTON S 2009 Reading fluency More than automaticity More than a
concern for the primary grades Literacy Research and Instruction 48 350-361 SCHWANENFLUGEL PJ HAMILTON AM KUHN MR WISENBAKER JM and STAHL SA
2004 Becoming a fluent reader Reading skill and prosodic features in the oral reading of young
readers Journal of Educational Psychology 96(1) 119-129 SCHWANENFLUGEL PJ MEISINGER EB WISENBAKER JM KUHN MR STRAUSS GP and
MORRIS RD 2006 Becoming a fluent and automatic reader in the early elementary school years
Reading Research Quarterly 41(4) 496-522
SHROUT PE and FLEISS JL 1979 Intraclass correlations Uses in assessing rater reliability Psychological
Bulletin 86(2) 420-428
SOPER DS 2010 The Free Statistics Calculators Website httpwwwdanielsopercomstatcalc
TEPPERMAN J KAZEMZADEH A and NARAYANAN S 2007 A text-free approach to assessing
nonnative intonation In Proceedings of ICSLP Antwerp Belgium October 2007 2007
TEPPERMAN J LEE S ALWAN A and NARAYANAN SS 2011 A generative student model for scoring word reading skills IEEE Transactions on Audio Speech and Language Processing 19(2)
348-360
VAN SANTEN JPH 1994 Assignment of segmental duration in text-to-speech synthesis Computer Speech and Language 8 95-128
VAN SANTEN JPH 1997 Segmental duration and speech timing In Computing Prosody Computational
Models for Processing Spontaneous Speech Y SAGISAKA N CAMBELL and N HIGUCHI Eds Springer 225-250
VAN SANTEN JPH 1998 Timing In Multilingual Text-To-Speech Synthesis The Bell Labs Approach R
SPROAT Ed Kluwer 115-140 WOODCOCK RW 1998 Woodcock Reading Mastery Tests - Revised (WRMT-RNU) American Guidance
Service Circle Pines Minnesota ZHANG X MOSTOW J and BECK JE 2007 Can a computer listen for fluctuations in reading
comprehension In Proceedings of the 13th International Conference on Artificial Intelligence in
Education Marina del Rey CA July 9-13 2007 R LUCKIN KR KOEDINGER and J GREER Eds IOS Press 495-502
ZUTELL J and RASINSKI TV 1991 Training teachers to attend to their students oral reading fluency
Theory into Practice 30(3) 211-17
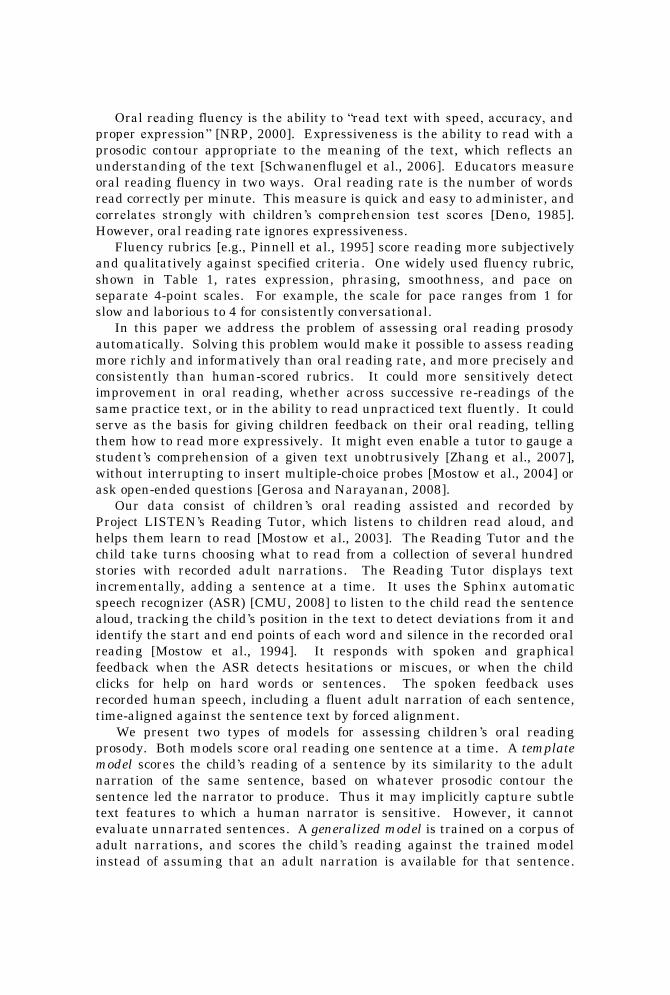
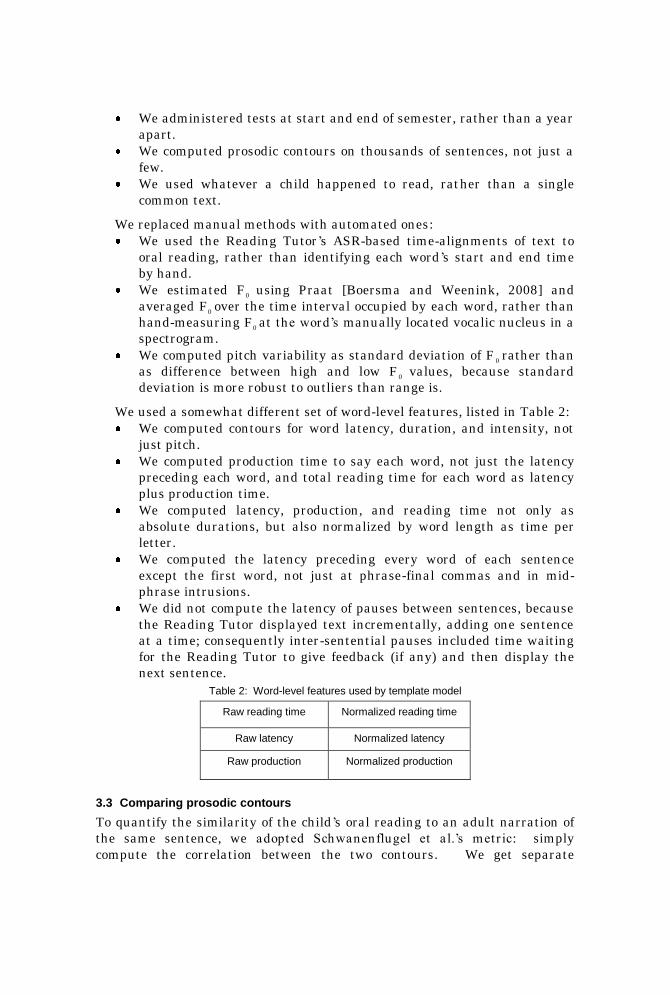
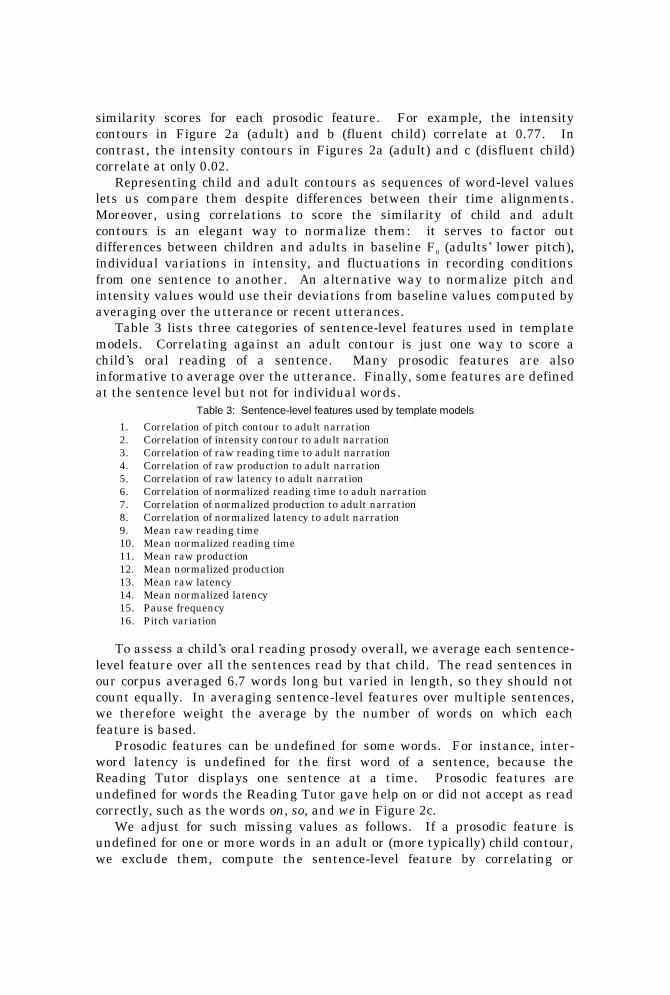
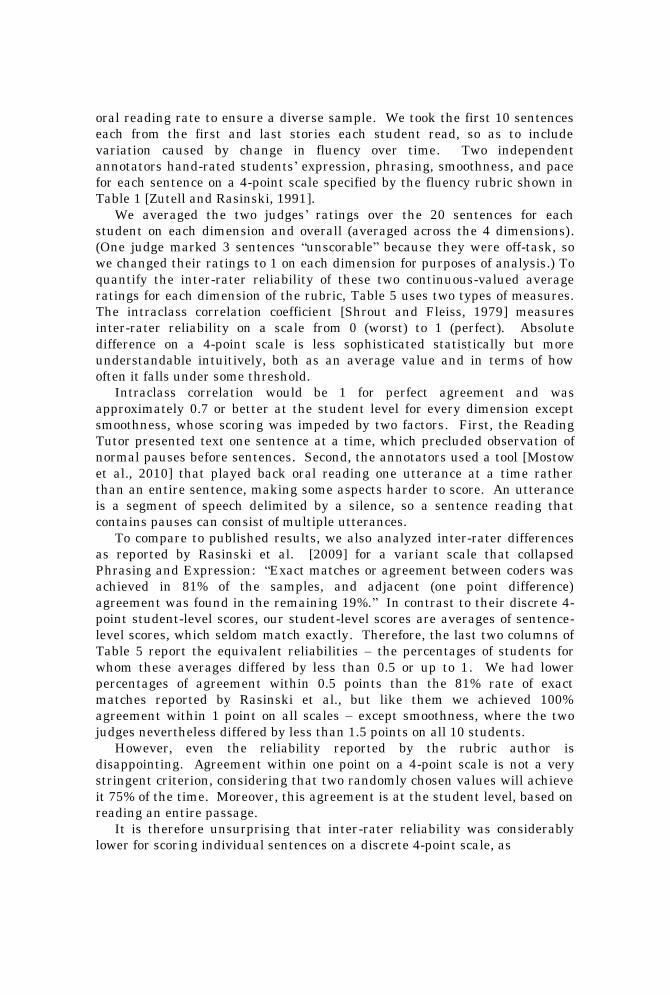
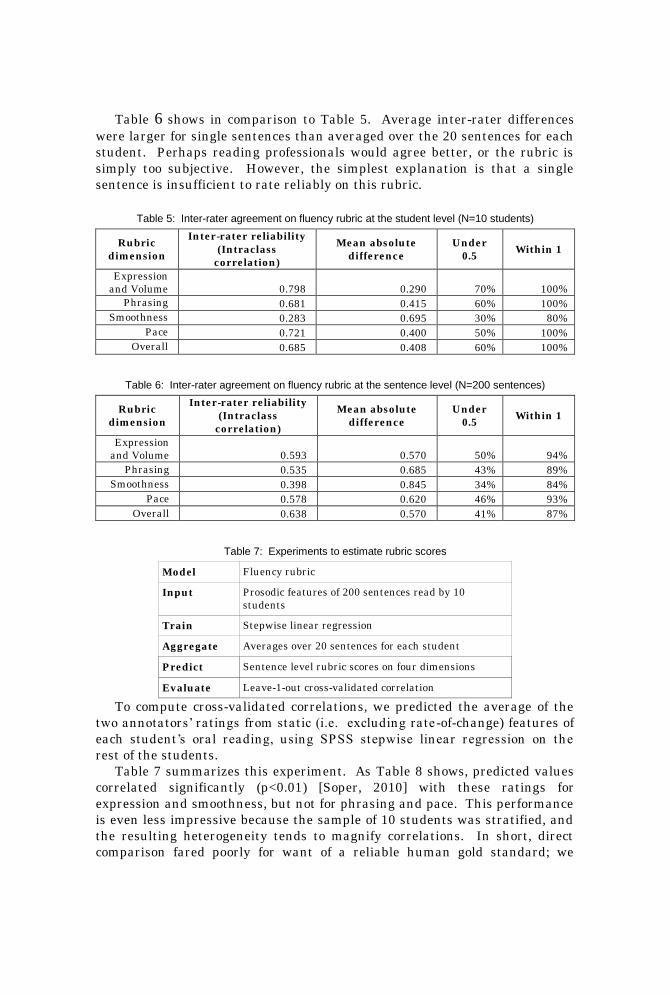
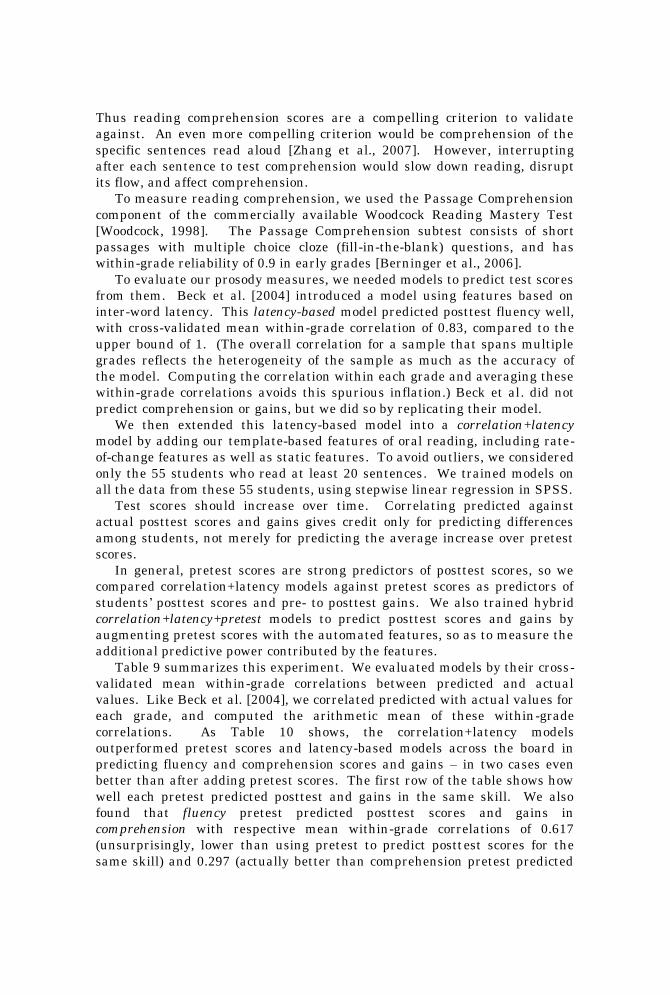
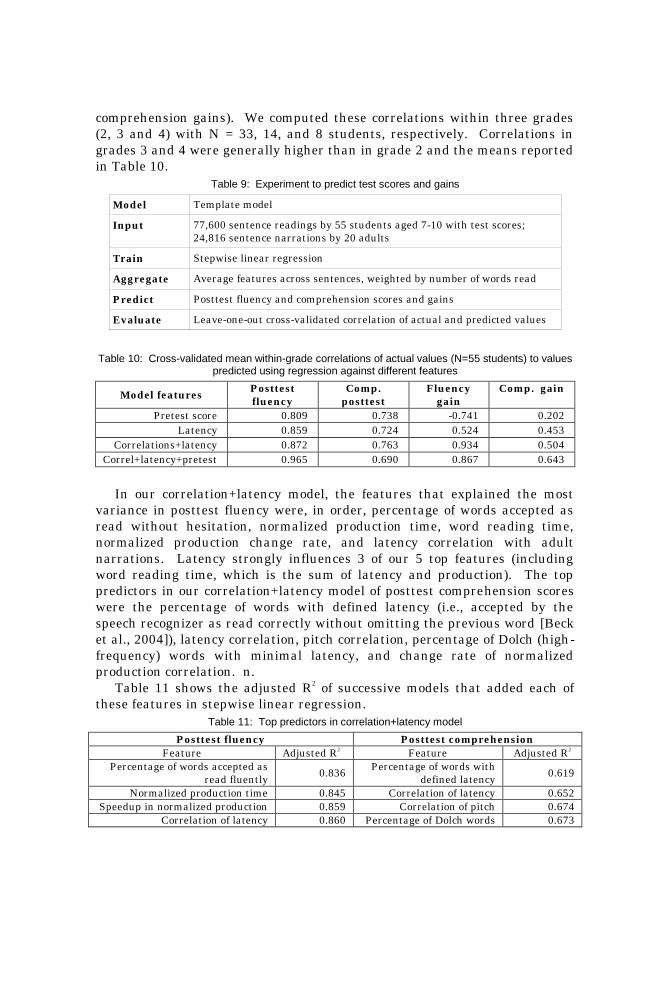
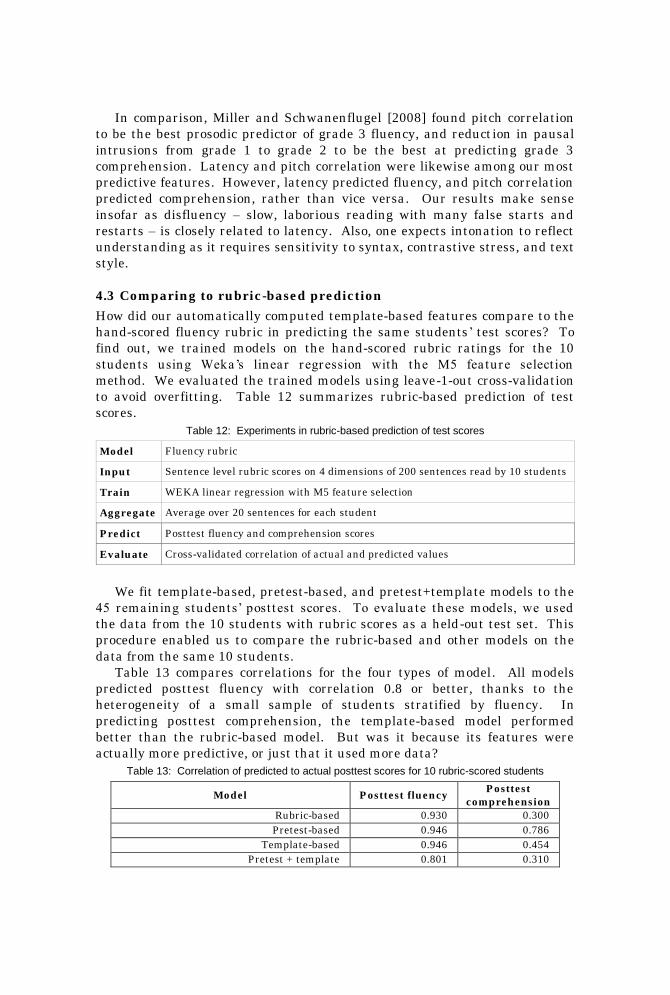
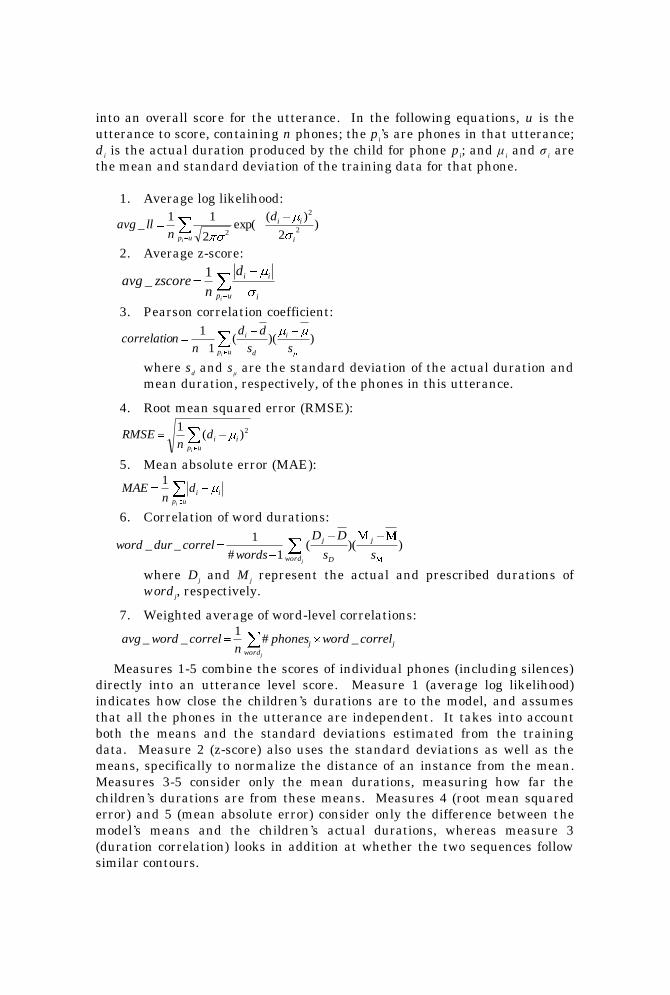