two-lane highway report_tgte_final
TRANSCRIPT
Two-Lane Highway Analysis
County Route 553
Pittsgrove, Salem County, New Jersey
October 26th
, 2015
Prepared for:
Dr. Bhavsar
Glassboro, NJ 08028
Prepared by:
Top Gun Traffic Engineers
Mark Politi
David Shornshadt
Cody Dietrich
Top Gun Traffic Engineers Page ii Rt. 553 Two-Lane Highway Analysis
Table of Contents
Executive Summary ....................................................................................................................... iii
Project Scope: ................................................................................................................................. 1
Background on Facilities: ............................................................................................................... 1
Individual Reports on Facilities: ..................................................................................................... 1
Mile Post 27.98 ........................................................................................................................... 1
Mile Post 29.89 ........................................................................................................................... 2
Mile Post 31.53 ........................................................................................................................... 3
Design Flowchart: ........................................................................................................................... 3
Re-design of Road Segment Results: .............................................................................................. 5
Benefit-Cost Analysis – Background.............................................................................................. 5
Benefits ........................................................................................................................................ 5
Costs ............................................................................................................................................ 7
Benefit-Cost Analysis – Results ..................................................................................................... 9
Conclusions and Recommendations: .............................................................................................. 9
References ..................................................................................................................................... 10
Appendices:................................................................................................................................... 11
List of Figures
Figure 1: Flowchart of Design Methodology.................................................................................. 4
Figure 2: Map of Route 553 in Pittsgrove, NJ .............................................................................. 11
List of Tables
Table 1: MP 27.98 Input Data......................................................................................................... 2
Table 2: MP 29.89 Input Data......................................................................................................... 2
Table 3: MP 31.53 Input Data......................................................................................................... 3
Table 4: LOS Results of Re-Design from HCS .............................................................................. 5
Table 5: Reduction factors for shoulder widening on two-lane highways. .................................... 6
Table 6: NYSDOT Cost per Accident Type and Accident Severity Distribution .......................... 7
Table 7: Breakdown of Construction Costs (6ft Shoulder) ............................................................ 8
Table 8: Results from Benefit-Cost Analysis ................................................................................. 9

Top Gun Traffic Engineers Page iii Rt. 553 Two-Lane Highway Analysis
Executive Summary The goal of this project is to upgrade facilities on a two-lane highway in New Jersey to a level of
service (LOS) A. Top Gun Traffic Engineers propose widening the shoulder on two segments of County
Route 553 in Pittsgrove, NJ from MP 29.89 to MP 31.53. Furthermore, the addition of a passing lane is
also being proposed at MP 27.98. These improvements will help increase the safety and LOS of Route
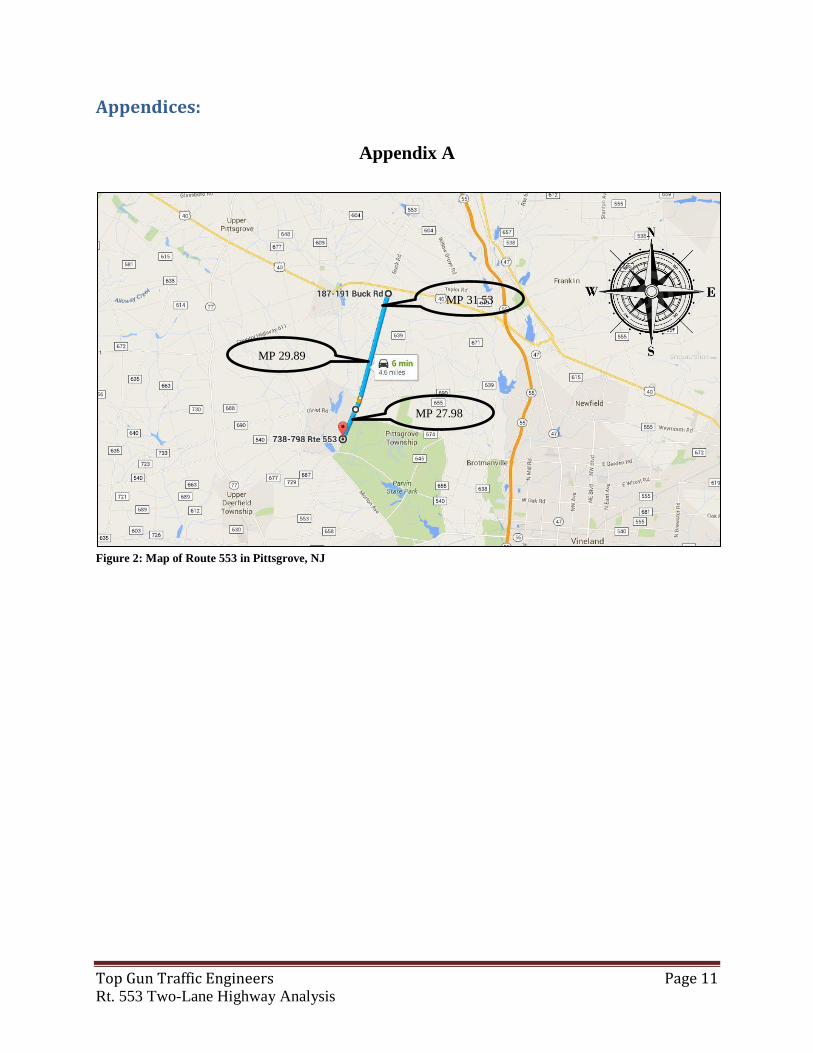
553. The project location and vicinity are shown in the report in figure 2 in Appendix A (along with street
views of each facility). The existing facility consists of 12ft lanes in each direction of traffic (for MP
29.89 and 31.53), 15ft lane widths in each direction of traffic (for MP 27.98), shoulder widths of 0.5ft for
MP 29.89 and 31.53, and shoulder widths of 6ft for MP 27.98. County Route 553 serves 51 miles, north
and south, from Commercial Township to Deptford Township in South New Jersey. It is a two-lane,
undivided highway set in a rural landscape.
Each road segment in question is not operating at an LOS A. Initial analysis of each facility
generated LOS’s of B for MP 27.98 and C for MP’s 29.89 and 31.53. Anticipating future growth in the
area, it was determined that these LOS values would hold for an increase in volume of daily traffic of
10% and 25%. Analysis was performed as prescribed in the Highway Capacity Manual (HCM 2010).
Therefore, different scenarios were undertaken in an effort to upgrade each facility to an LOS A.
The only way to achieve this was by; (1) Adding a passing lane (11.4ft wide), reducing lane width (12ft),
and reducing the shoulder width (4ft) for MP 27.98 and (2) Increasing the shoulder (6ft) and increasing
the speed limit (55mph) for MP 29.89 and MP 31.53. The Highway Capacity Software (HCS) was
utilized in this endeavor in order to quickly run through different build scenarios.
A benefit-cost analysis was performed by analyzing the cost of each proposed road work and
estimating the benefits each produces. The primary benefits produced; (1) Travel time savings, (2)
Reduction in accidents, and (3) Reduction in vehicle operating costs. These benefits were estimated by
finding the proper value of time for drivers, the time saved through an improved facility, the reduction in
accidents, the cost that is incurred from accidents, and the reduction in vehicle operating costs from such
an improvement.
After a thorough literature review and benefit-cost analysis it was found that each prescribed
facility improvement is economically acceptable. A benefit cost ratio (B/C) was found for each facility by
comparing the “build” scenario to a “do-nothing” scenario. These B/C values were found to be; (1) MP
27.98 = 7.23, (2) MP 29.89 = 2.57, and (3) MP 31.53 = 2.53. These improvements were found to
drastically increase the LOS of each facility now, and into the future. Therefore, with positive LOS
results, together with excellent B/C ratios, it is the recommendation of Top Gun Traffic Engineers to
pursue these facility upgrades.

Top Gun Traffic Engineers Page 1 Rt. 553 Two-Lane Highway Analysis
Project Scope: The objective of this report was to utilize the Highway Capacity Manual (HCM) to analyze a two-
lane highway in the Tri-State area. Once a level of service (LOS) of the road segment in question was
determined, the group was charged with “upgrading” the road segment to an LOS A. An upgrade refers to
any changes made to the road segment (i.e. shoulder width, lane width, additional lane, etc.) in order to
achieve the target LOS. A flowchart of the methods used to optimize the LOS of the given road segment
is also included to help future traffic engineers in their design techniques. A benefit-cost analysis was
used to determine if these improvements are economically acceptable. The appendix of this report
contains all supplemental materials that were crucial in creating this deliverable. Examples of appendix
materials include the original hand calculations to determine the LOS of the road segment, HCS results
detailing the best designs, straight line diagrams of the two-lane highway being analyzed, and the volume
data used to gather input for the analysis.
Background on Facilities: As the primary traffic agency involved in this study, Top Gun Traffic Engineers focused their
search for a two-lane highway in South New Jersey. The group singled out a County Route in Pittsgrove,
NJ, which is located in Salem County. CR 553 is a county highway that has a total length of 51.22 miles.
The route runs from Commercial Township to Deptford Township. The segments being analyzed were at
mile posts 27.98, 29.89, and 31.53. This section of route 553 passes through a densely forested area in
which some homes are located. A school (Olivet Elementary School) is located near the most southern
facility (MP 27.98). The traffic count locations (found on NJDOT’s Roadway Information and Traffic
Monitoring System Program) were designated with a “V”, which meant that vehicles were counted for a
48 hour period. This information is then extrapolated to determine the Annual Average Daily Traffic
(AADT) value. The traffic count reports for each facility detailing the daily volume for the given 48 hour
time frame are located in Appendix C-2.
Individual Reports on Facilities: Although the segments analyzed were in close proximity to each other, it was necessary to adjust
the input data required for analysis for each individual section. The modification of inputs is discussed
below for each mile post analyzed.
For all sections, the AADT that was given in the traffic reports was converted to a Directional
Design Hourly Volume (DDHV) by using equation 1.
𝐷𝐷𝐻𝑉 = 𝐴𝐴𝐷𝑇 × 𝐷 × 𝐾 [1]
Where D is the directional distribution and K is the proportion of daily traffic occurring during peak hour.
D was taken as 0.50 to simplify the analysis, since the northbound and southbound volume was almost
identical. K was taken as 0.08, given that this is a fairly rural roadway. The percentage of trucks was
assumed to be 3%-4% (at the discretion of the analyst). This was derived from the fact that the default
value for the percentage of trucks on a two-lane highway is 6%. That value was then halved because in
the New Jersey Administrative Code, Chapter 16, it is concluded that this stretch of Route 553 is not
suitable for trucks. An excerpt of this document is included in Appendix B.
Identifying the class of each two-lane highway segment was also crucial for analysis. Two
segments of Route 553 were classified as class I two-lane highways. The speeds along these segments are
relatively high and each was designated as major collectors (another sign that these are class I). The most
southern segment was deemed a class III two-lane highway. This conclusion was made due to the fact that
the area by this facility becomes more developed and passes through a small town with a school.
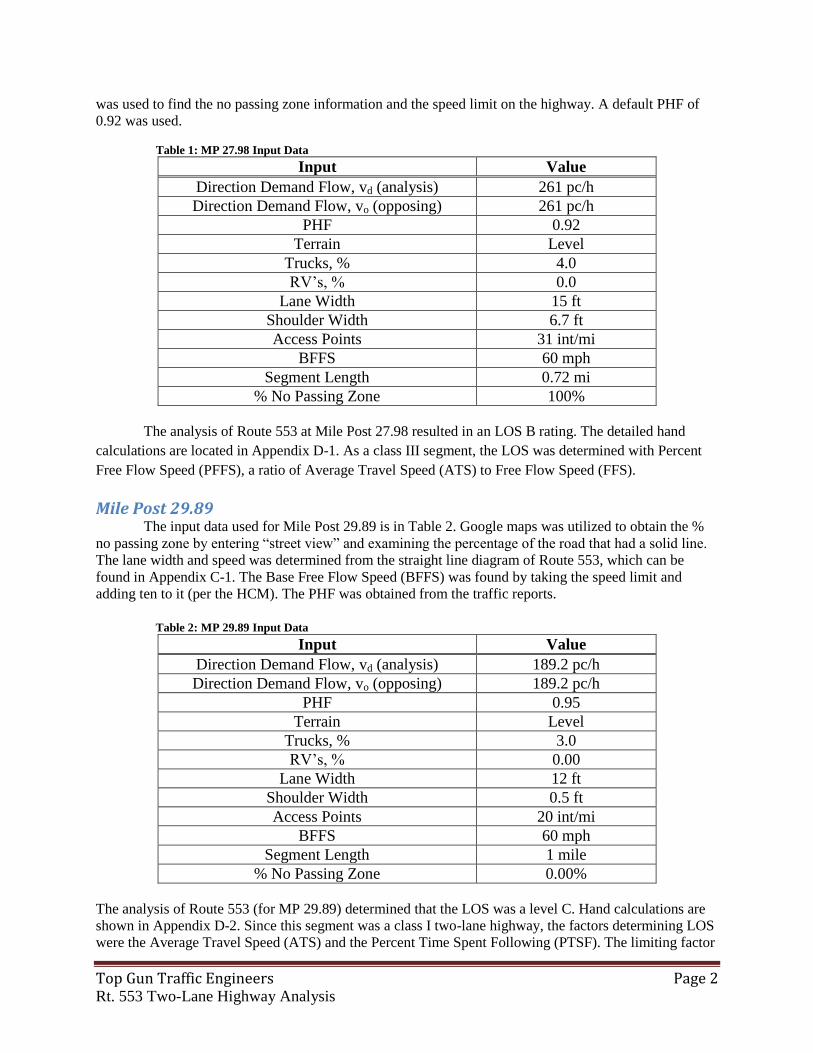
Mile Post 27.98 The input data used for Mile Post 27.98 is shown in Table 1 below. Google Maps was used to
find the lane width, shoulder width, and access point density. The “street view” mode in Google Maps
Top Gun Traffic Engineers Page 2 Rt. 553 Two-Lane Highway Analysis
was used to find the no passing zone information and the speed limit on the highway. A default PHF of
0.92 was used.
Table 1: MP 27.98 Input Data
Input Value
Direction Demand Flow, vd (analysis) 261 pc/h
Direction Demand Flow, vo (opposing) 261 pc/h
PHF 0.92
Terrain Level
Trucks, % 4.0
RV’s, % 0.0
Lane Width 15 ft
Shoulder Width 6.7 ft
Access Points 31 int/mi
BFFS 60 mph
Segment Length 0.72 mi
% No Passing Zone 100%
The analysis of Route 553 at Mile Post 27.98 resulted in an LOS B rating. The detailed hand
calculations are located in Appendix D-1. As a class III segment, the LOS was determined with Percent
Free Flow Speed (PFFS), a ratio of Average Travel Speed (ATS) to Free Flow Speed (FFS).
Mile Post 29.89 The input data used for Mile Post 29.89 is in Table 2. Google maps was utilized to obtain the %
no passing zone by entering “street view” and examining the percentage of the road that had a solid line.
The lane width and speed was determined from the straight line diagram of Route 553, which can be
found in Appendix C-1. The Base Free Flow Speed (BFFS) was found by taking the speed limit and
adding ten to it (per the HCM). The PHF was obtained from the traffic reports.
Table 2: MP 29.89 Input Data
Input Value
Direction Demand Flow, vd (analysis) 189.2 pc/h
Direction Demand Flow, vo (opposing) 189.2 pc/h
PHF 0.95
Terrain Level
Trucks, % 3.0
RV’s, % 0.00
Lane Width 12 ft
Shoulder Width 0.5 ft
Access Points 20 int/mi
BFFS 60 mph
Segment Length 1 mile
% No Passing Zone 0.00%
The analysis of Route 553 (for MP 29.89) determined that the LOS was a level C. Hand calculations are
shown in Appendix D-2. Since this segment was a class I two-lane highway, the factors determining LOS
were the Average Travel Speed (ATS) and the Percent Time Spent Following (PTSF). The limiting factor

Top Gun Traffic Engineers Page 3 Rt. 553 Two-Lane Highway Analysis
in this case was the ATS, which was found to be 46.2mph. Based solely on PTSF, this segment would
have had an LOS A (since the PTSF was 23.2%).
Mile Post 31.53 The input data used for Mile Post 31.53 is shown in Table 3 below. Bing Maps was used to find
the lane width, shoulder width, and access point density. The “street view” mode in Google Maps was
used to find the no passing zone information and the speed limit on the highway. Using data from the
NJDOT traffic counts, a PHF of 0.96 was used.
Table 3: MP 31.53 Input Data
Input Value
Direction Demand Flow, vd (analysis) 185 pc/h
Direction Demand Flow, vo (opposing) 185 pc/h
PHF 0.96
Terrain Level
Trucks, % 4.0
RV’s, % 0.0
Lane Width 12 ft
Shoulder Width 2.0 ft
Access Points 15 int/mi
BFFS 60 mph
Segment Length 1.0 mi
% No Passing Zone 20.0%
The analysis of Route 553 (for MP 31.53) determined that the LOS was a level C. Detailed hand
calculations are shown in Appendix D-3. Since this segment was a class I two-lane highway, LOS was
determined based on ATS and the Percent Time Spent Following (PTSF). The limiting factor in this case
was the ATS, which was found to be 49.4 mph. Based solely on PTSF; this segment would have had an
LOS A (since the PTSF was 25.27%).
Design Flowchart: Figure 1 below is a flowchart that details the steps taken in this report to arrive at an LOS A for
each road segment. The work plan was split up into two phases; (1) Individual Assignment and (2) Group
Assignment. Phase I consisted of each team member analyzing their individual segment using the
procedures set forth in the HCM. Subsequently, Phase II involved optimizing each section in order to
achieve an LOS A. Since each section was not at a level of service A, execution of Phase II was necessary
in order to complete the report.
ATS and PTSF are the factors that determine the LOS of class I two-lane highways. Therefore, in
order to optimize the LOS of the roadway, it was critical to obtain values of ATS and PTSF that fell into
the category of LOS A. ATS is dependent on shoulder width and lane width, among other factors, and
since these can be changed this is where the design optimization started. If these changes did not achieve
an LOS A, then one additional strategy is to add a passing lane. This is very beneficial in decreasing the
PTSF.
For class III two-lane highways, the LOS is determined using Percent Free Flow Speed (PFFS),
the ratio of ATS to FFS. Therefore, the LOS can be raised by increasing the ATS using similar strategies
as for a Class I highway.

Top Gun Traffic Engineers Page 4 Rt. 553 Two-Lane Highway Analysis
Select a Two-Lane Highway for
Analysis
Perform Analysis, per HCM, by Hand
PH
AS
E I
: In
div
idu
al
Ass
ign
men
t
LOS A? Stop
Design
YES
NO
Re-design Road Segment to Achieve
LOS A
Class I
Two-Lane Highway
Class III
Two-Lane Highway
PH
AS
E I
I: G
rou
p A
ssig
nm
ent
Adjust Shoulder
Width
Adjust Lane Width
Add a Passing Lane
Adjust Shoulder
Width
Adjust Lane Width
Add a Passing Lane
Figure 1: Flowchart of Design Methodology

Top Gun Traffic Engineers Page 5 Rt. 553 Two-Lane Highway Analysis
Re-design of Road Segment Results: Table 4 below shows the results of the iterations of the design process to achieve an LOS A. HCS
results of the solutions yielding an LOS A are located in Appendix E.
Table 4: LOS Results of Re-Design from HCS
Mile-Post Description Base Volume
(BV) 110% BV 125% BV
27.98
No-Build B B B
Add Passing Lane A A A
Add passing lane (11.4ft wide)
Reduce lane width (to 12ft)
Reduce shoulder (to 4ft)
A A B
29.89
No-Build C C C
Increase shoulder to 6ft B B C
Raise speed limit to 55mph B B B
Increase shoulder to 6ft
Raise speed limit to 55mph A B B
31.53
No-Build C C C
Increase shoulder to 6ft B B B
Increase shoulder to 6ft
Increase speed to 55mph A A A
Benefit-Cost Analysis – Background Benefits In recent years, appropriating funds towards construction projects has become an arduous task
since there is less money in State DOT budgets. Therefore, conducting a benefit-cost analysis of
prospective projects is used to economically justify any public work. To perform a benefit/cost analysis of
a particular project, the costs (initial and annual), the benefits, and the disbenefits (if applicable) must be
estimated as accurately as possible in monetary units. Accordingly, it becomes important to justify
findings and develop good standards for calculating benefits since it is difficult to estimate the economic
impact they have in a public project. In performing the analysis, all costs and benefit estimates must be
converted to a common equivalent monetary unit. The benefit-cost ratio (B/C) is then calculated using
equation 2.
𝐵𝐶⁄ =
𝑃𝑊 𝑜𝑓 𝑏𝑒𝑛𝑒𝑓𝑖𝑡𝑠
𝑃𝑊 𝑜𝑓 𝑐𝑜𝑠𝑡𝑠 [2]
The guideline in using this analysis is quite simple. If B/C is greater than one, then the project is
considered economically justified. Conversely, if B/C is less than one, then the project is not
economically justified.
Performing a benefit-cost analysis incorporates a set of specific steps that an analyst must make
in order to effectively determine the applicability of a project (Thompson et al. 2008). Specific benefits
must be calculated before the B/C ratio can be obtained which include Value of Travel-Time Savings
(VTTS), Value of Accidents (VOA), and Value of Operating Costs (VOC).
The VTTS can be determined by finding the time saved of a vehicle traveling a road segment and
multiplying this by the value of time. The travel-time saved (TTS) is found by investigating the change in
average travel speed (ATS) that is induced from road improvements. The TTS can be realized by finding
the difference between the ATS before and after improvement (ATS1 & ATS2) and dividing by the
product of these two ATS values. Equation 3 shows this function below, where TTS has units in seconds.
𝑇𝑇𝑆 =𝐴𝑇𝑆2−𝐴𝑇𝑆1
𝐴𝑇𝑆2×𝐴𝑇𝑆1×
3600𝑠𝑒𝑐
1ℎ𝑟 [3]

Top Gun Traffic Engineers Page 6 Rt. 553 Two-Lane Highway Analysis
Investigating the value of time led to a few key findings. The USDOT lists a plausible range for
value of time between $12.00 and $16.70 for personal travel and a value of 22.90$ for business travel
(additionally reporting an average VTTS of $12.50), while another study out of New Zealand found
ranges between $7.00 and $10.55 for personal travel and $15.80 to $21.30 for business travel (Litman et
al. 2011). One more study found ranges for hourly values of travel time savings between $8.40 and
$14.30 for personal travel and $18.30 and $27.50 for business travel (Belenky 2011). It was also found
that the value of time can be approximated as 40% of the average hourly wage in the area where road
improvements are to occur (Song 2000). With this detail, the Salem County medium household income
was found to be about $60,000 per year (US Census 2010). This translates to roughly $31.25 per hour.
40% of this Salem County wage per hour results in a value of time of $12.50. Coincidentally, this is
approximately what the USDOT found for their VTTS calculations and is in between what Belenky
reported. Therefore, a VTTS of $12.50/hour will be used further in this report.
The value of accidents is found by estimating the reduction in crashes (including fatal, injury, and
property damage only (PDO)) and the cost these crashes incur. Some reports list the reduction in crashes
as a percentage or as a Crash Modification Factor (CMF). A CMF of 1 is a baseline, while a CMF below
1 means a reduction in crashes and vice versa. For example a CMF of 0.80 represents a 20% reduction in
crashes, while a CMF of 1.20 represents an increase of 20% in crashes. Researching the effect of road
improvements on accidents led to conflicting reports. For the most part, however, increasing shoulder
width on two-lane highways has a positive outcome (Gross et al. 2007; Abdel-Rahim et al. 2012; Schrock
et al. 2011; Abboud et al. 2001; Zongzhi et al. 2013). Table 5 shows the results of this research in terms
of the reduction found by road improvements on two-lane highways.
Table 5: Reduction factors for shoulder widening on two-lane highways.
Author(s) Results Notes
Zegeer (1981) 21% Reduction in crashes 9ft shoulder
Zegeer (1988) Up to 40% reduction for run-off,
head-on, and sideswipe accidents
This new study by Zegeer saw a
more drastic decrease in
accidents with a wider shoulder
on two-lane highways.
Gross et al. (2007) CMF = 0.80 For shoulder widening of 6ft.
Schrock et al. (2011) CMF = 0.945
For two-lane highways in Kansas
with an increase of 6ft in
shoulder width and an AADT
over 1500.
Abdel-Rahim (2012) CMF = 0.93
For all crashes in Idaho on a
moderate volume two-lane
highway.
Zongzhi et al. (2013)
9% reduction (fatal crashes)
7% increase (injury crashes)
20% increase PDO
For urban two-lane highway with
a shoulder widening of 6ft in
Illinois.
Zongzhi et al. (2013)
8% reduction (fatal crashes)
5% increase (injury crashes)
25% increase PDO
For rural two-lane highway with
a shoulder widening of 6ft in
Illinois.
After reviewing the reduction rates after a shoulder widening of 6 feet, it is apparent that the outcome is a
positive one. However, this factor clearly varies based on location, type of traffic, and area designation.
The results range from a reduction of 5.5% to 40%. Zegeer’s study’s came out over twenty years ago and
seem fairly high. The more recent results show a reduction up to 10%, which seems fairly reasonable.

Top Gun Traffic Engineers Page 7 Rt. 553 Two-Lane Highway Analysis
Therefore, this report will utilize the results from Zongzhi et al. because it is a fairly conservative
estimate and breaks down the change in accidents by type.
The New York State Department of Transportation (NYSDOT) is one of 17 state DOTs that use
modified values for crash analysis (Hanley 2004). Instead of calculating crash costs by severity or type of
crash, the NYSDOT calculates crash costs by facility and area type. Below in Table 6, the cost associated
with crashes on a free-access, rural/urban, undivided, two-lane highway is shown, alongside the accident
severity distribution. A detailed cost per accident type from NYSDOT is shown in Appendix C-4.
Table 6: NYSDOT Cost per Accident Type and Accident Severity Distribution
Classification Fatal Injury PDO
Accident
Severity
Distribution
(%)
Free-Access, rural,
undivided, 2-lane $3,691,600 $88,900 $5,200
Fatal: 0.49
Injury: 17.04
PDO: 82.47
Free-Access, urban,
undivided, 2-lane $3,512,600 $90,200 $3,800
Fatal: 0.29
Injury: 24.21
PDO: 75.50
Accident data for the last 14 years in Salem County was reviewed in order to determine the
amount of accidents on Route 553. The average amount of fatal and injury accidents on roads in Salem
County amounted to 12 and 460 per year, respectively. The average amount of crashes on all county roads
in Salem County was 1940 per year (see Appendix C-3 for details). There are about 70 county roads that
run through Salem County, so taking the amount of accidents of county roads and dividing by 70 yields
about 28 accidents per year for each county route. Route 553 is heavily traveled, so 8 more accidents will
be added to account for this. Therefore, it is estimated that there are about 35 accidents on Route 553.
Breaking this down even further, the totals for fatal crashes, injury crashes, and PDO will be assumed as
1, 7, and 27 crashes per year, respectively. This is roughly the same accident severity distribution that
NYSDOT reports, as well as what the NJDOT reports for county roads in Salem County.
The final benefit that can be evaluated is the vehicle operating cost. A road improvement should
allow drivers to commute faster and safer. Less travel time will allow the vehicle to consume less fuel and
less vehicle deterioration. This means the driver will save money on improved roads. To determine
vehicle operating costs, the Hepburn Model was used. The Hepburn Model uses coefficients based on
vehicle class and speed of the vehicle to determine the impact on vehicle operating costs (Sinha et al.
2011). An explanation of the full analysis can be found in Appendix F-4.
Costs Adding a passing lane or width to the shoulder may produce safety and operational benefits, but
these additions come at a cost. The cost of improving the different segments of Route 553 includes
various items such as mobilization, traffic control, earthwork, restriping, and paving the shoulder. A
survey and analysis performed by Zegeer (1994) focused on identifying costs of new construction or
reconstruction. The results from Zegeer’s study were used to develop a construction cost model that is
based on estimates for the major construction items of pavement, earthwork, and shoulders and then
applies factors (or percentages) for the other line items. This guide was used to determine the cost of
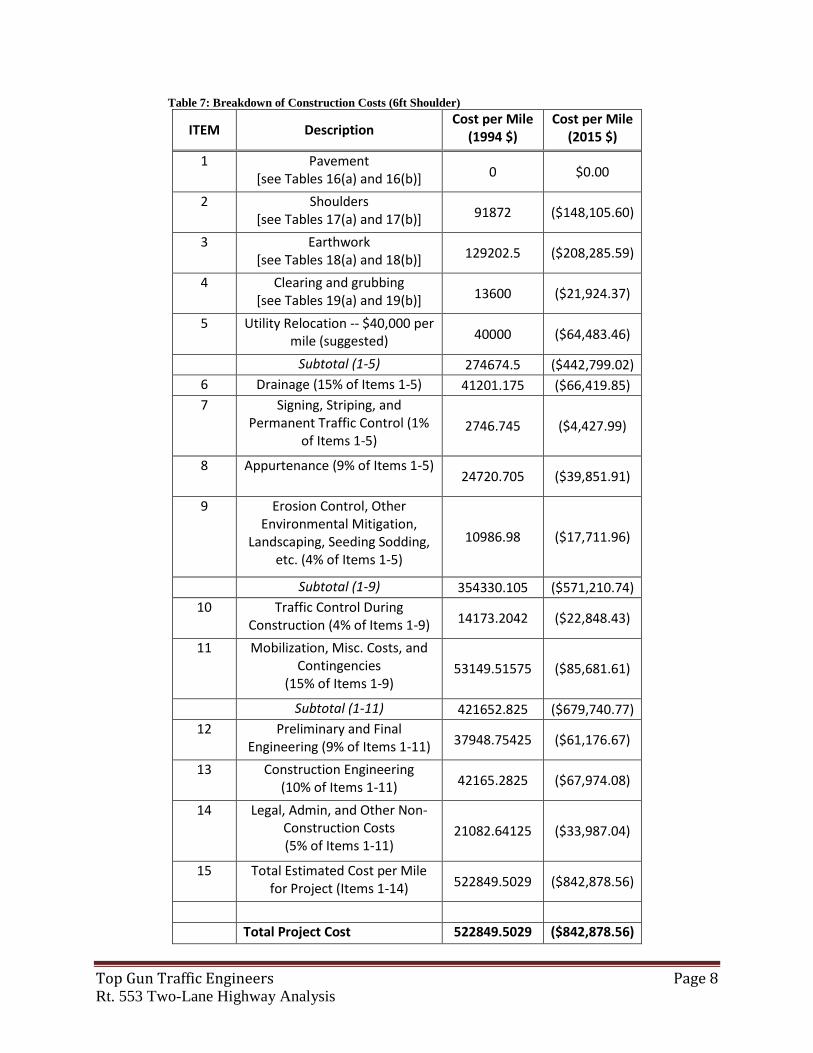
constructing a 6 foot shoulder on MP 29.89 and MP 31.53 on Route 553. The breakdown of cost by
service is shown below in table 7. For a detailed explanation of obtaining these costs, the construction
cost guide used in this analysis can be found in Appendix G.
When considering the addition of the passing lane for MP 27.98, only the cost for repainting the
road and traffic control during the upgrade needs to be considered. This cost is estimated as $50,000.
Top Gun Traffic Engineers Page 8 Rt. 553 Two-Lane Highway Analysis
Table 7: Breakdown of Construction Costs (6ft Shoulder)
ITEM Description Cost per Mile
(1994 $) Cost per Mile
(2015 $)
1 Pavement [see Tables 16(a) and 16(b)] 0 $0.00
2 Shoulders [see Tables 17(a) and 17(b)] 91872 ($148,105.60)
3 Earthwork [see Tables 18(a) and 18(b)] 129202.5 ($208,285.59)
4 Clearing and grubbing [see Tables 19(a) and 19(b)] 13600 ($21,924.37)
5 Utility Relocation -- $40,000 per mile (suggested) 40000 ($64,483.46)
Subtotal (1-5) 274674.5 ($442,799.02)
6 Drainage (15% of Items 1-5) 41201.175 ($66,419.85)
7 Signing, Striping, and Permanent Traffic Control (1%
of Items 1-5) 2746.745 ($4,427.99)
8 Appurtenance (9% of Items 1-5) 24720.705 ($39,851.91)
9 Erosion Control, Other Environmental Mitigation,
Landscaping, Seeding Sodding, etc. (4% of Items 1-5)
10986.98 ($17,711.96)
Subtotal (1-9) 354330.105 ($571,210.74)
10 Traffic Control During Construction (4% of Items 1-9) 14173.2042 ($22,848.43)
11 Mobilization, Misc. Costs, and Contingencies
(15% of Items 1-9) 53149.51575 ($85,681.61)
Subtotal (1-11) 421652.825 ($679,740.77)
12 Preliminary and Final Engineering (9% of Items 1-11) 37948.75425 ($61,176.67)
13 Construction Engineering (10% of Items 1-11) 42165.2825 ($67,974.08)
14 Legal, Admin, and Other Non-Construction Costs (5% of Items 1-11)
21082.64125 ($33,987.04)
15 Total Estimated Cost per Mile for Project (Items 1-14) 522849.5029 ($842,878.56)
Total Project Cost 522849.5029 ($842,878.56)

Top Gun Traffic Engineers Page 9 Rt. 553 Two-Lane Highway Analysis
Benefit-Cost Analysis – Results The results of the benefit-cost analysis are shown below in table 8. A detailed analysis of the
benefit-cost analysis can be found in Appendix F-1 through Appendix F-3.
Table 8: Results from Benefit-Cost Analysis
Scenario Total Benefits Total Costs B/C (selected/do nothing)
MP 27.98 – Do Nothing 0 0 7.23
MP 27.98 – Passing Lane $361,730 $50,000
MP 29.89 – Do Nothing 0 0
2.57 MP29.89 – Speed and
Shoulder Increase $2,166,648 $842,879
MP 31.53 – Do Nothing 0 0
2.53 MP 31.53 – Speed and
Shoulder Increase $2,132,346 $842,879
Conclusions and Recommendations: This report presents the findings of the current LOS of three segments of Route 553,
solutions to improve the LOS of those facilities, and the benefit-cost ratio of the selected
improvement versus a no-build scenario. Initial LOS of each facility was found to be at a level of
B (MP 27.98) and C (MP 29.89 and MP 31.53) for current traffic and was estimated to stay at
these values when considering future growth of volume by 10% and 25%. Road improvements
consisting of an additional passing lane, construction of 6ft shoulders in each direction of the
traveled way, and increasing the speed limit of the two-lane highway were considered. An LOS
of A was achievable for each facility when taking into account these upgrades, but will go down
to an LOS B in certain future scenarios. The best solutions found, using the Highway Capacity
Software, were measured against a no-build scenario in a benefit-cost analysis. All B/C ratios
were well above 1.0, which proves they are economically acceptable. Values of B/C for MP’s
27.98, 29.89, and 31.53 were 7.23, 2.57, and 2.53, respectively.
As expected, these upgrades to each facility have enormous benefits in relating to safety
and LOS. As a result, Top Gun Traffic Engineers recommend making these improvements to the
facilities on Route 553. These include;
1. MP 27.89 – Adding an 11.4ft wide passing lane, reducing lane width to 12ft, and
reducing the shoulder width to 4ft.
2. MP 29.89 – Constructing a 6ft shoulder in each direction and increasing the speed
limit to 55mph.
3. MP 31.53 – Constructing a 6ft shoulder in each direction and increasing the speed
limit to 55mph.

Top Gun Traffic Engineers Page 10 Rt. 553 Two-Lane Highway Analysis
References Thompson, Eric; Rosenbaum, David; Hall, Arthur (2008). Evaluating Roads as Investments: A Primer on
Benefit-Cost and Economic-Impact Analysis. Bureau of Business Research Publications. Paper 5.
Litman, Todd and Doherty, Eric (2011). Transportation Cost and Benefit Analysis. Victoria Transport
Policy Institute. Available: http://www.vtpi.org/tca/tca0502.pdf
Belenky, Peter (2011). The Value of Travel Time Savings: Departmental Guidance for Conducting
Economic Evaluations. USDOT MEMO: to Secretarial Officers & Modal Administrators. Available:
https://www.transportation.gov/sites/dot.dev/files/docs/vot_guidance_092811c.pdf
United States Census Data (2010). Median Household Income for Salem County, NJ.
Song, Yong Nam (2000). Estimating the Value of Time-Savings-Expected Traffic Accident Cost and
Contingent Valuation Method. Chonbuk National University. Available: http://easts.info/on-
line/journal/vol4no6/46006.pdf
Gross, F. and Jovanis, Paul. (2007). Estimation of the Safety Effectiveness of Lane and Shoulder Width:
Case-Control Approach. J. Transp. Eng., 133(6), 362-369.
Abdel-Rahim, Ahmed and Sonnen, Joseph (2012). Potential Safety Effects of Lane Width and Shoulder
Width on Two-Lane Rural State Highways in Idaho. Idaho Transportation Department Research
Program.
Available: http://www.webpages.uidaho.edu/NIATT/research/Final_Reports/KLK559_RP200Final.pdf
Schrock, Steven; Parsons, Robert; and Zeng, Huanghui (2011). Estimation of Safety Effectiveness of
Widening Shoulders and Adding Passing Lanes on Rural Two-Lane Roads. Journal of the Transportation
Research Board, 2203, 57-63.
Abboud, Nasser and Bowman, Brian (2001). Evaluation of Two- and Four-Foot Shoulders on Two-Lane
State Routes. ITE Journal, 34-39.
Zongzhi, Li; Konstantinos, Kepaptsoglou; Lee, Yongdoo; Patel, Harshingar; Liu, Yi; Kim, Han Gyol
(2013). Safety Effects of Shoulder Paving for Rural and Urban Interstate, Multilane, and Two-Lane
Highways. Journal of Transportation Engineering, 139(10), 1010-1019.
New York State Department of Transportation (2013). Average Accident Costs/Severity Distribution
State Highways. Safety Information Management System.
Hanley, Paul F. (2004). Using Crash Costs in Safety Analysis. Public Policy Center – The University of
Iowa.
Sinha, Kumares and Labi, Samuel (2011). Impact of Transportation System Interventions on Vehicle
Operating Cost (VOC). Presentation: Purdue University (Transportation Decision Making).
Zegeer, C. V., R. Stewart, F. Council, and T. R. Neuman. NCHRP Report 362: Roadway Widths for Low-
Traffic-Volume Roads. TRB, National Research Council, Washington, D.C., 1994.
Top Gun Traffic Engineers Page 11 Rt. 553 Two-Lane Highway Analysis
Appendices:
Appendix A
Figure 2: Map of Route 553 in Pittsgrove, NJ
MP 27.98
MP 29.89
MP 31.53