two distinct determinants of ligand specificity in t1r1/t1r3 (the
TRANSCRIPT

1
Two distinct determinants of ligand specificity in T1R1/T1R3 (the umami taste receptor)
Yasuka Toda1, Tomoya Nakagita
1, Takashi Hayakawa
2,3, Shinji Okada
1, Masataka Narukawa
1,
Hiroo Imai2, Yoshiro Ishimaru
1, and Takumi Misaka*
1
1 Department of Applied Biological Chemistry, Graduate School of Agricultural and Life Sciences, The
University of Tokyo, Tokyo 113-8657, Japan
2 Primate Research Institute, Kyoto University, Inuyama, Aichi 484-8506, Japan
3 Japan Society for the Promotion of Science, Tokyo, Japan
Running title: Ligand specificity in T1R1/T1R3
To whom correspondence should be addressed: Takumi Misaka, Department of Applied Biological
Chemistry, Graduate School of Agricultural and Life Sciences, The University of Tokyo, 1-1-1 Yayoi,
Bunkyo-ku, Tokyo 113-8657, Japan. Tel.: +81-3-5841-8117; Fax: +81-3-5841-8100; and E-mail:
Keywords: taste receptor, umami, G protein-coupled receptor
CAPSULE
Background: T1R1/T1R3 exhibits
species-dependent differences in ligand
specificity.
Results: The ligand specificity is dependent on a
combination of amino acid selectivity at the
orthosteric site and receptor activity modulation at
the nonorthosteric site.
Conclusion: The molecular mechanism
underlying the amino acid recognition of
T1R1/T1R3 has been elucidated.
Significance: This study provides new insights
into the molecular mechanisms of the
L-Glu-specific response in human T1R1/T1R3.
ABSTRACT
Umami taste perception in mammals is
mediated by a heteromeric complex of two
G-protein-coupled receptors, T1R1 and T1R3.
T1R1/T1R3 exhibits species-dependent
differences in ligand specificity: human
T1R1/T1R3 specifically responds to L-Glu,
whereas mouse T1R1/T1R3 responds more
strongly to other L-amino acids than to L-Glu.
The mechanism underlying this species
difference remains unknown. In this study, we
analyzed chimeric human-mouse receptors and
point mutants of T1R1/T1R3 and identified 12
key residues that modulate amino acid
recognition in the human- and mouse-type
responses in the extracellular Venus flytrap
domain of T1R1. Molecular modeling revealed
http://www.jbc.org/cgi/doi/10.1074/jbc.M113.494443The latest version is at JBC Papers in Press. Published on November 8, 2013 as Manuscript M113.494443
Copyright 2013 by The American Society for Biochemistry and Molecular Biology, Inc.
by guest on April 14, 2018
http://ww
w.jbc.org/
Dow
nloaded from
2
that the residues critical for human-type acidic
amino acid recognition were located at the
orthosteric ligand-binding site. In contrast, all
of the key residues for the mouse-type broad
response were located at regions outside of both
the orthosteric ligand-binding site and the
allosteric binding site for
inosine-5′-monophosphate (IMP), a known
natural umami taste enhancer. Site-directed
mutagenesis demonstrated that the newly
identified key residues for the mouse-type
responses modulated receptor activity in a
manner distinct from that of the allosteric
modulation via IMP. Analyses of multiple point
mutants suggested that the combination of two
distinct determinants, amino acid selectivity at
the orthosteric site and receptor activity
modulation at the nonorthosteric sites, may
mediate the ligand specificity of T1R1/T1R3.
This hypothesis was supported by the results of
studies using nonhuman primate T1R1
receptors. A complex molecular mechanism
involving changes in the properties of both the
orthosteric and nonorthosteric sites of T1R1
underlies the determination of ligand specificity
in mammalian T1R1/T1R3.
Umami (amino acid taste), which has been
identified as the savory sensation produced by
L-glutamate (1), has recently been accepted as one
of the five basic tastes. The unique sensory
characteristic of umami derives from the
synergistic enhancement between L-amino acids
and 5′ ribonucleotides, such as IMP and GMP (2).
Over the past decade, several candidate umami
taste receptors have been proposed, including the
heteromeric receptors T1R1/T1R3 (3), mGluR1
(4), mGluR4 (5), taste-mGluR1 (6), and
taste-mGluR4 (7,8). Moreover, several studies
have subsequently revealed the crucial roles of
T1R1/T1R3 in the perception of L-amino acids
and the synergistic effect of IMP using T1R1- and
T1R3-KO mice (9-11).
T1R1 and T1R3 are class C G-protein-coupled
receptors (GPCRs), as are metabotropic glutamate
receptors (mGluRs), the calcium-sensing receptor
(CaSR), the sweet taste receptor component T1R2
(T1R2/T1R3), and others (12). Each of these
receptors possesses a large extracellular Venus
flytrap domain (VFTD) that is linked to a small
extracellular cysteine-rich domain (CRD) and a
seven-transmembrane domain (TMD). The
structures of the extracellular domains of mGluRs
have been determined using X-ray crystallography
and indicate that the VFTD consists of two lobes
and that the ligand-binding site is located in a
hinge region between the two lobes (13,14).
Molecular modeling based on the structures of
mGluRs and site-directed mutagenesis analysis
have also shown that the L-Glu binding site of
T1R1/T1R3 lies in the hinge region of the VFTD
of T1R1 (15,16) and that the IMP-binding site lies
near the opening of the VFTD of T1R1 (16).
Heterologous expression studies have revealed
that mouse T1R1/T1R3 (mT1R1/mT1R3) is
broadly activated by most L-amino acids, whereas
human T1R1/T1R3 (hT1R1/hT1R3) specifically
responds to L-Glu (3,17). Additionally, the
responses of mT1R1/mT1R3 to acidic amino acids
are much weaker than those to other amino acids
by guest on April 14, 2018
http://ww
w.jbc.org/
Dow
nloaded from

3
(3). Differences in T1R ligand specificity between
species have also been reported for the sweet taste
receptor T1R2/T1R3, and multiple ligand-binding
sites for several sweeteners have been
characterized using molecular modeling and
site-directed mutagenesis studies of human-rodent
(18-21) or human-squirrel monkey (22) chimeric
receptors. In contrast, the binding sites for
L-amino acids (except for L-Glu) have not been
well defined. Additionally, although five residues
at the hinge region of hT1R1 have been identified
as crucial for L-Glu binding (16), all five residues
are conserved between human and mouse T1R1,
indicating that the additional residues that are
critical for acidic amino acid recognition remain to
be identified. Using human-mouse chimeric
receptors and point mutants of T1R1/T1R3, we
have elucidated the mechanism underlying this
difference between species in amino acid
recognition.
EXPERIMENTAL PROCEDURES
Materials- Amino acids were obtained from
commercial sources as follows: L-aspartic acid
sodium salt, L-glutamic acid monosodium salt,
L-serine, L-lysine monohydrochloride, L-histidine
monohydrochloride monohydrate, L-proline, and
L-phenylalanine were purchased from Nacalai
Tesque (Kyoto, Japan); L-glutamine, L-threonine,
glycine, L-alanine, L-valine, L-isoleucine,
L-leucine, L-arginine, and L-asparagine
monohydrate were obtained from Kanto Chemical
(Tokyo, Japan); L-methionine was obtained from
Tokyo Chemical Industry (Tokyo, Japan); and
coelenterazine was purchased from Promega
(Madison, WI, USA). The buffer for the
luminescence assay comprised 10 mM
4-(2-hydroxyethyl)-1-piperazineethanesulfonic
acid (HEPES), 130 mM NaCl, 10 mM glucose, 5
mM KCl, 2 mM CaCl2, and 1.2 mM MgCl2 and
was supplemented with 0.1% bovine serum
albumin (Sigma Aldrich, St. Louis, MO, USA);
the pH was adjusted to 7.4 using NaOH. The
ligands were diluted to the desired concentrations
in the assay buffer.
Constructs for Human, Mouse, and Human-Mouse
Chimeric Taste Receptors and their Point
Mutants- hT1R1 (NCBI RefSeq number
NM_138697.3), hT1R3 (NM_152228.1), mT1R1
(NM_031867.2), mT1R3 (NM_031872.2),
human-mouse T1R1 chimeras, and point mutants
of hT1R1 and mT1R1 were constructed by
polymerase chain reaction (PCR) using
overlapping primers and were subcloned into the
pEAK10 expression vector (Edge Biosystems,
Gaithersburg, MD) at the AscI-NotI site. The
Kozak consensus sequence was introduced
upstream of the start codon for efficient translation.
To identify the residues that are critical for ligand
specificity, we constructed the following chimeric
receptors and single-point mutants:
hVFTD-mCRD-mTMD T1R1,
mVFTD-hCRD-hTMD T1R1, hT1R1 (m.1-143),
(m.144-178), (m.179-370), (m.371-380),
(m.381-497), (m.179-279), (m.280-329),
(m.280-305), (m.306-314), (m.315-329),
(m.330-370), (m.373-375), (m.376-380),
(m.381-440), (m.452-472), and (m.473-497);
hT1R1-S148N, -R151H, -A170E, -E174V,
by guest on April 14, 2018
http://ww
w.jbc.org/
Dow
nloaded from
4
-R281G, -E285R, -T290A, -V298I, -A302D,
-L305I, -R307T, -H308Y, -G311N, -R317G,
-M320T, -K328Q, -M371T, -A372T, -K377E,
-K379G, -S385A, -D435K, -T464E, and -K460E;
mT1R1 (h.1-142), (h.143-177), (h.178-369),
(h.370-379), (h.380-496), (h.144-151),
(h.152-169), (h.170-177), (h.178-218),
(h.219-278), (h.380-391), (h.392-422),
(h.423-439), and (h.460-471); and mT1R1-N149S,
-D151N, -H152R, -E171A, -V175E, -I176T,
-N277S, -H279Q, -D303A, -T308R, -T321M,
-Q329K, -E378K, -G380K, -A386S, -V390A,
-E392R, -Q424E, -Y427H, -N430H, -K436D, and
-E461K. Moreover, the multiple point mutants
hT1R1-A170E/A302D/M320T/K379G and
mT1R1-N149S/H152R/E171A/V175E/D303A/T3
08R/T321M/Q329K/E378K/G380K/K436D/E461
K were also constructed.
Nonhuman Primate T1R1 Constructs- This study
was performed in strict accordance with the
recommendations in the Guide for the Care and
Use of Nonhuman Primates of the Primate
Research Institute, Kyoto University (Version 3,
issued in 2010). Genomic DNA was isolated from
tongue (macaque) or liver (baboon and squirrel
monkey) tissues by digestion with proteinase K.
All deduced exons of Tas1r1 were amplified and
sequenced. The PCR primers were designed based
on the genome assemblies of the macaque
(NC_007858.1), baboon (NW_003871134.1), and
squirrel monkey (NW_003943720.1), whose
T1R1 loci were annotated using a BLASTN
search (23). The amino acid positions P278 and
M320 in the macaque and P459 in the baboon in
this study are distinct from those of the reference
sequences because of single nucleotide variations;
the P595 codon in the baboon reference sequence
also contains a frame-shift mutation. The PCR
products of each exon were assembled into one
full-length sequence using overlapping PCR and
were subcloned into the pEAK10 expression
vector, as described above for hT1R1 and mT1R1.
Luminescence-based Assay for T1R1/T1R3-
HEK293T cells were transfected with expression
vectors for T1R1, T1R3, rG15i2, and
mt-apoclytin-II (24) and maintained at 37 °C
under 5% CO2 in DMEM supplemented with
GlutaMAX (GIBCO) and 10% dialyzed FBS
(GIBCO) to minimize glutamate-induced
desensitization. The transfected cells were seeded
on 96-well black-walled CellBIND surface plates
(Corning); after 48 h of transfection, a
luminescence assay was performed as previously
described (25). The response from each well was
calculated based on the area under the curve
(AUC) and expressed as RLU (relative light units).
To examine the EC50 values, plots of the
amplitudes versus concentrations were fitted to
Hill equation. L-Trp and L-Tyr were not assayed
because of their insolubility, and L-Cys was not
evaluated because of instability in the assay buffer
at pH 7.4. The osmotic pressures of the L-Arg and
L-His solutions were higher than those of the other
amino acid solutions because large amounts of
HCl or NaOH were required for the pH adjustment.
Statistical analysis was performed using Student’s
t-test and one-way ANOVA followed by
Dunnett’s test using the software Ky Plot version
by guest on April 14, 2018
http://ww
w.jbc.org/
Dow
nloaded from
5
3.0.
Homology Modeling- A homology model of
hT1R1 was constructed using MOE (Chemical
Computing Group Inc.). In this study, we selected
the open form of mGluR1 (PDB ID: 1EWT) (13)
as a template. The model was rendered using
Discovery Studio Visualizer (Accelrys).
RESULTS
Key Domains for Amino Acid Recognition- We
previously established a novel high-throughput
screening system for the human sweet taste
receptor hT1R2/hT1R3 using a
luminescence-based assay (25). The assay showed
higher sensitivities to intracellular [Ca2+
] changes
than the standard fluorescence-based assay when
HEK293T cells were transiently transfected with
the sweet taste receptor. Therefore, we applied this
luminescence-based assay to the umami taste
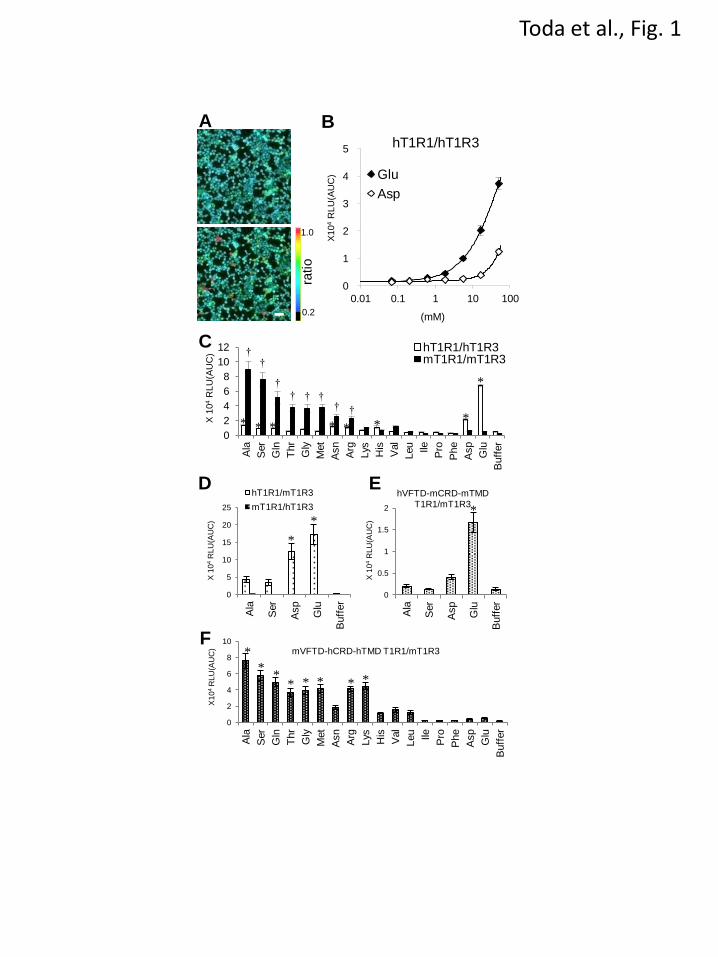
receptor. Consistent with the results of previous
studies using fluorescence-based assays (3,16,17)
(Fig. 1A), the responses to L-Glu were detected
using the luminescence-based assay (Fig. 1B).
Additionally, although it has been difficult to
detect weak cellular responses to L-Asp using the
fluorescence-based assay (17), the responses to
L-Asp were successfully detected using the
luminescence-based assay (Fig. 1B). Thus, we
chose to use the luminescence-based assay for the
following investigations.
To examine the response profiles to L-amino acids,
HEK293T cells expressing the T1R1/T1R3
receptor were stimulated with 50 mM of each
amino acid, and the luminescence intensities
following the receptor activations were compared
among seventeen types of amino acids. A
concentration of 50 mM was the upper limit for
the L-Glu concentration in our luminescence assay
due to its high osmotic pressure. In sensory tests
of the 20 proteinogenic amino acids, humans
perceived neutralized salts of L-Glu and L-Asp as
having an umami taste (26). hT1R1/hT1R3
exhibited the highest response intensities to L-Glu
and L-Asp of the 17 evaluated amino acids (Fig.
1C). hT1R1/hT1R3 also demonstrated slight but
significant responses to L-Ala, L-Ser, L-Gln,
L-Asn, L-Arg and L-His (Fig. 1C). Of these amino
acids, L-Ala, L-Ser, L-Gln and L-Asn elicit a
weak umami taste at high concentrations in human
sensory tests (27). Because cellular responses for
hT1R1/hT1R3 were subject to interference from
the osmotic pressure of the sample solutions, the
L-Arg and L-His responses for hT1R1/hT1R3 may
result from the high osmotic pressure of the
respective sample solutions (see
EXPERIMENTAL PROCEDURES). In contrast,
the response intensities of mT1R1/mT1R3 to
several types of L-amino acids were much higher
than those to acidic amino acids, which is
consistent with a previous report (Fig. 1C) (3).
These results indicate that the sequence
differences in these receptors influences the
differences in ligand specificity between human
and mouse T1R1/T1R3.
To determine which subunit is most important
in defining the ligand specificity, the response
patterns of mixed pairs of human and mouse T1Rs
(i.e., hT1R1/mT1R3 or mT1R1/hT1R3) were
examined. We selected four amino acids as
by guest on April 14, 2018
http://ww
w.jbc.org/
Dow
nloaded from
6
representative ligands for human or mouse
T1R1/T1R3: L-Glu and L-Asp for hT1R1/hT1R3
and L-Ala and L-Ser for mT1R1/mT1R3 (Fig. 1C).
hT1R1/mT1R3 exhibited higher response
intensities to acidic amino acids than to L-Ala and
L-Ser (Fig. 1D), as was the case for hT1R1/hT1R3,
which suggests that the T1R1 subunit is
responsible for amino acid recognition. In contrast,
mT1R1/hT1R3 did not respond to any amino acid
tested (Fig. 1D). It has been reported that cells
expressing mT1R2/hT1R3 also failed to respond
to all evaluated sweeteners (19,21).
To determine which domain of T1R1 is most
critical for amino acid recognition, we
investigated the response patterns of human and
mouse chimeric T1R1 receptors by exchanging
their VFTDs, which should contain the L-Glu
binding site (16). hVFTD-mCRD-mTMD
T1R1/mT1R3 exhibited higher response
intensities to acidic amino acids than those to
L-Ala and L-Ser, as did hT1R1/mT1R3 (Fig. 1E).
In contrast, mVFTD-hCRD-hTMD T1R1/mT1R3
demonstrated higher response intensities to L-Ala
and L-Ser than those to acidic amino acids (Fig.
1F). Additionally, mVFTD-hCRD-hTMD
T1R1/mT1R3 exhibited higher response
intensities to most of the other amino acids than to
acidic amino acids, as did mT1R1/mT1R3 (Fig.
1F). These results suggest that the VFTD of T1R1
is critical for both human-type and mouse-type
amino acid recognition.
To identify the region that is crucial for amino
acid recognition more precisely, we constructed
five human-to-mouse chimeric receptors
encompassing the entire region of the VFTD of
T1R1 (Fig. 2A). Dose-response curves for the
representative four L-amino acids were examined,
and the regions that affected the activity (potency
and/or efficacy) of acidic amino acids were
selected as the region that is crucial for
human-type responses, and the regions that
affected the L-Ala and L-Ser activities were
chosen as the regions that were important for the
mouse-type responses, respectively. Of the five
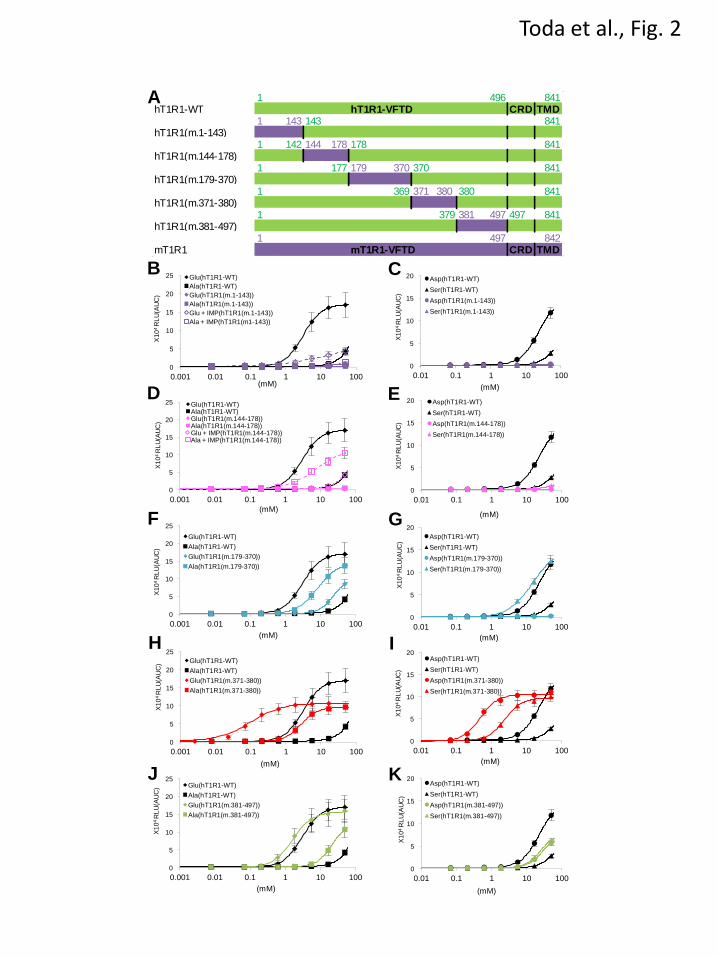
evaluated chimeric mutants, hT1R1(m.1-143) and
hT1R1(m.144-178) demonstrated either slight or
no responses to the four amino acids even at the
highest evaluated concentration (50 mM) (Figs.
2B-2E). To evaluate the ligand specificity of these
two receptors, we examined their responses to
L-Glu and L-Ala in the presence of IMP because it
has been reported that the responses of
T1R1/T1R3 to various L-amino acids are
dramatically enhanced by the addition of IMP
(3,16). In the presence of IMP, both L-Glu and
L-Ala responses for hT1R1(m.144-178) were
potentiated, but the L-Glu activity was lower than
the L-Ala activity (Fig. 2D). These results suggest
that hT1R1(m.144-178) retained its receptor
function, but the introduction of mouse-type
mutations in this region severely reduced the
activity of acidic amino acids. Among the reverse
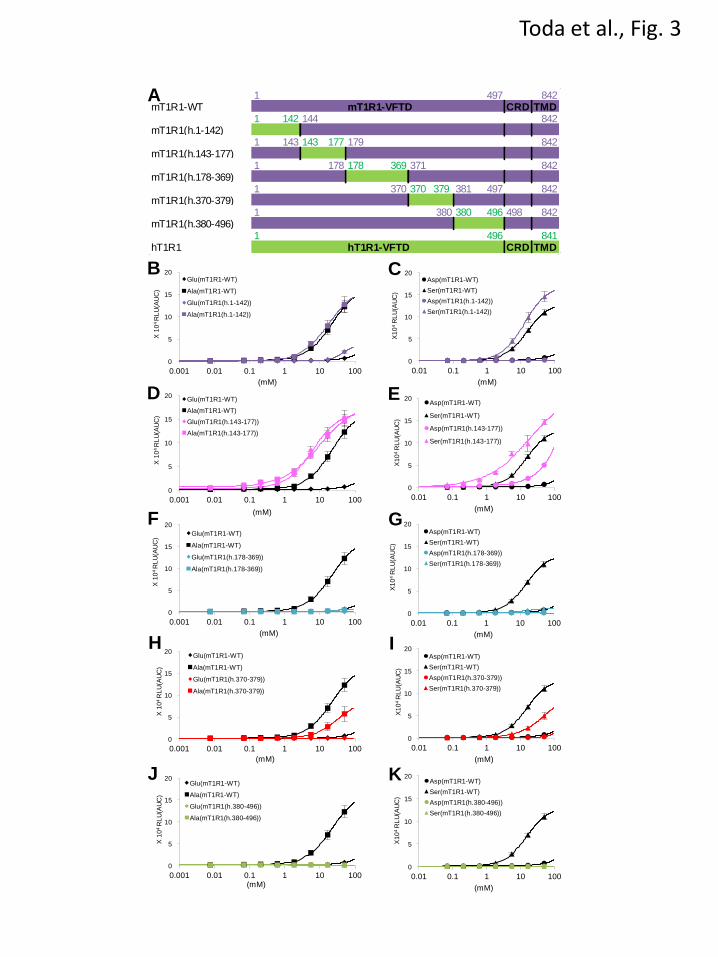
set of chimeric receptors (Fig. 3),
mT1R1(h.143-177) exhibited remarkable
increases in the activity of acidic amino acids, and
L-Glu activity was as high as the L-Ala activity
(Figs. 3D and 3E). These results suggested that the
crucial residues for acidic amino acid recognition
lie within residues 143-177 in hT1R1. In contrast,
the L-Glu activity for hT1R1(m.1-143) was higher
by guest on April 14, 2018
http://ww
w.jbc.org/
Dow
nloaded from

7
than the L-Ala activity in the presence of IMP, as
was observed for hT1R1-WT (Fig. 2B). The
response intensities to 50 mM L-Glu for
mT1R1(h.1-142) were higher than those for
mT1R1-WT (Fig. 3B), but the L-Asp responses
for this receptor were lower than those for
mT1R1-WT at several evaluated concentrations
(Fig. 3C). The substitution of residues 1-142 in
hT1R1 to the corresponding mouse residues
(residues 1-143) may have affected the functional
expression of the receptors (e.g., the maintenance
of the overall conformation of T1R1/T1R3 or the
cell-surface targeting of the receptors) rather than
the specific recognition of acidic amino acids.
hT1R1(m.179-370) exhibited decreases in the
activity of acidic amino acids, whereas it exhibited
increases in the L-Ala and L-Ser activity (Figs. 2F
and 2G). hT1R1(m.381-497) exhibited decreases
in the L-Asp activity, whereas it exhibited
increases in the L-Ala and L-Ser activity (Figs. 2J
and 2K). These results indicate that the regions
corresponding to residues 179-370 and 381-497 in
mT1R1 (residues 178-369 and 380-496 in hT1R1)
include important residues for both human-type
and mouse-type responses. The reverse chimeras
for these two regions, i.e., mT1R1(h.178-369) and
mT1R1(h.380-496), demonstrated either slight or
no responses to the four evaluated L-amino acids
(Figs. 3F, 3G, 3J and 3K). Because IMP barely
potentiated the responses of these receptors to
L-Glu and L-Ala (data not shown), the
introduction of human-type mutations in these
regions (residues 179-370 and 381-497 in mT1R1)
may have affected the functional expression of
mT1R1/mT1R3. The potency of L-Ala and L-Ser
for hT1R1(m.371-380) was higher than that for
hT1R1-WT (Figs. 2H and 2I), indicating that the
residues 371-380 in mT1R1 include those that are
important for mouse-type responses.
hT1R1(m.371-380) exhibited remarkable
increases in the potency of not only the ligands of
mT1R1/mT1R3 (L-Ala and L-Ser) but also acidic
amino acids (the EC50 for L-Glu was 0.11 ± 0.01
mM for hT1R1(m.371-380) and 3.13 ± 0.19 mM
for hT1R1-WT) (Figs. 2H and 2I). Conversely, the
reverse chimera mT1R1(h.370-379) demonstrated
decreases in the activity of all four evaluated
L-amino acids (Figs. 3H and 3I).
We thus selected residues within the 143-177,
178-369, and 380-496 regions of hT1R1 to screen
for residues that may be critical for acidic amino
acid recognition, whereas residues within the
179-370, 371-380, and 381-497 regions of mT1R1
were selected to screen for residues that may be
critical for the mouse-type broad response.
Critical Residues for Acidic Amino Acid
Recognition- To identify the residues that are
critical for human-type acidic amino acid
recognition, additional mouse-to-human T1R1
chimeras and T1R1 point mutants (see
EXPERIMENTAL PROCEDURES) were
constructed involving residues 143-369 and
380-496 in hT1R1 because these regions were
shown to contain the residues that are critical for
human-type responses in the previous studies
(Figs. 2 and 3). These receptors were examined for
their response patterns to the four representative
L-amino acids, and we identified the set of
residues that influenced the response to acidic
by guest on April 14, 2018
http://ww
w.jbc.org/
Dow
nloaded from

8
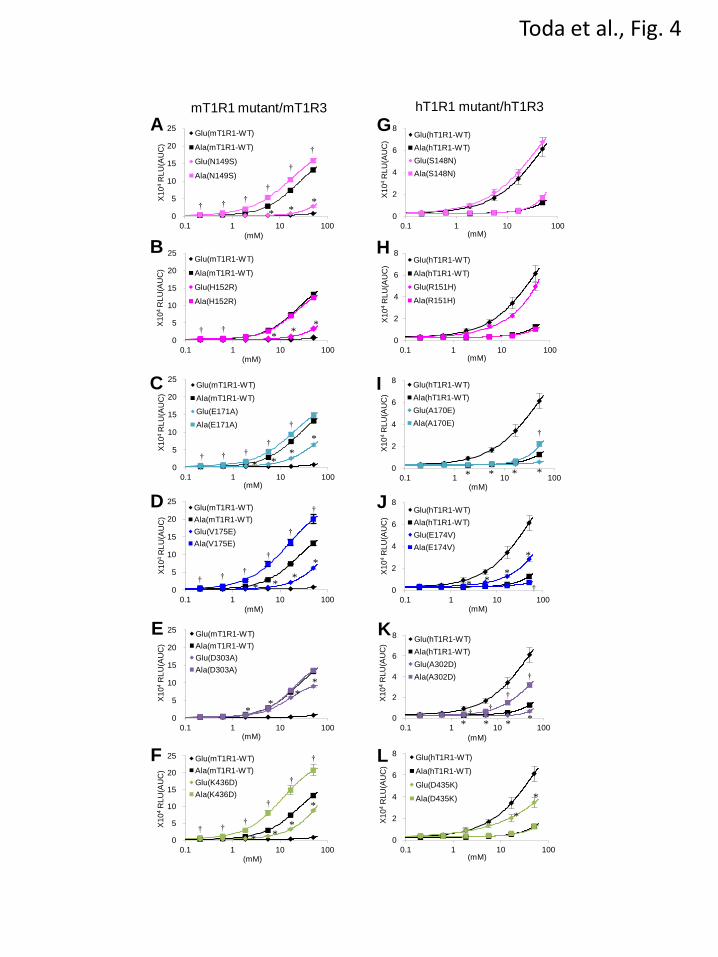
amino acids. Among the point mutants in these
regions, the following six mutants that exhibited
increases in the L-Glu responses were identified:
mT1R1-N149S, -H152R, -E171A, -V175E,
-D303A, and -K436D (Figs. 4A-4F). These six
mutants demonstrated higher responses to L-Glu
than those for mT1R1-WT at several evaluated
concentrations (Figs. 4A-4F). These results
suggest that S148, R151, A170, E174, A302, and
D435 in hT1R1 contributed to the changes in the
acidic amino acid responses for the human-mouse
chimeric receptors in the previous studies (Figs. 2
and 3). To determine whether any of these six
residues played an essential role in hT1R1/hT1R3
function, we generated hT1R1 point mutants of
these residues (Figs. 4G-4L). Of the six mutant
receptors, hT1R1-A170E and -A302D did not
exhibit detectable responses to L-Glu up to the
highest evaluated concentration (50 mM) (Figs. 4I
and 4K). Conversely, these mutations did not
result in decreases in the L-Ala responses in
comparison to hT1R1-WT (Figs. 4I and 4K),
which indicates that the mutations A170E and
A302D selectively reduced the L-Glu activities.
hT1R1-E174V and -D435K exhibited lower
responses to L-Glu than those for hT1R1-WT at
several evaluated concentrations (Figs. 4J and 4L).
Because the mutation D435K in hT1R1 did not
affect the L-Ala responses, its functional
expression was confirmed (Fig. 4L). Conversely,
the E174V mutation resulted in decreases in both
the L-Glu and the L-Ala responses (Fig. 4J). The
E174V mutation should affect the general amino
acid recognition (or the functional expression of
receptors) rather than the specific acidic amino
acid responses. hT1R1-S148N and -R151H
exhibited little direct effect on the L-Glu and
L-Ala activity (Figs. 4G and 4H). These results
suggest that of the six residues, A170 and A302 in
hT1R1 (E171 and D303 in mT1R1) are the most
critical residues for acidic amino acid recognition.
Key Residues for the Broad L-Amino Acid
Response- To better identify the residues
responsible for mouse-type responses, we
constructed additional human-to-mouse chimeric
receptors of T1R1 and point mutants within
residues 179-497 in mT1R1 (see Materials and
Methods) because this region should contain the
residues that are critical for L-Ala and L-Ser
recognition (Figs. 2 and 3). These receptors were
coexpressed with mT1R3, and their response
patterns to the four representative L-amino acids
were compared with the response pattern of
hT1R1-WT. Six single point mutations in hT1R1
that enhanced the L-Ala and L-Ser responses were
identified: R307T, M320T, K328Q, K377E,
K379G, and K460E (Figs. 5A and 5B). To
confirm whether these residues were related to the
broadly tuned response of mT1R1/mT1R3, the
response patterns of these hT1R1 mutants to 17
amino acids were examined. These six hT1R1
mutants exhibited detectable responses to various
amino acids, some of which were not detected for
hT1R1/mT1R3 (Fig. 5A). These results suggest
that these six residues are responsible for the
mouse-type, broadly tuned response. Notably,
although mT1R1/mT1R3 only weakly recognizes
acidic amino acids, increases in the potency of
L-Glu were found for all six hT1R1 mutants in
by guest on April 14, 2018
http://ww
w.jbc.org/
Dow
nloaded from
9
comparison to hT1R1-WT (Fig. 5C and Table 1),
as was observed for the chimeric receptor
hT1R1(m.371-380) (Fig. 2H). Even when
coexpressed with hT1R3, all of the hT1R1
mutants exhibited increased responses to L-Ala at
several evaluated concentrations (Fig. 5D). Of the
six mutations in hT1R1, the K379G mutation
resulted in the greatest increases in the activity of
most of the evaluated 17 amino acids (Figs.
5A-5D). However, among the reverse mutants,
only mT1R1-T321M exhibited lower responses to
L-Ala in comparison to mT1R1-WT at several
evaluated concentrations, and mT1R1-G380K did
not exhibit reduced activity in response to L-Ala
(Fig. 5E). These results suggest that the
mouse-type responses should be retained with the
cooperation of multiple residues, including these
six residues.
Two Distinct Determinants of the Amino Acid
Recognition of T1R1- We mapped each of the six
key residues for the human-type and mouse-type
responses onto a molecular model of the VFTD of
hT1R1, which was built using the open-form
structures of mGluR1 (Fig. 6A) (13). Of the six
key residues that are involved in acidic amino acid
recognition, five residues, i.e., S148, R151, A170,
E174, and A302, are positioned in the hinge
region near the residues that were identified as
critical for L-Glu binding in a previous
site-directed mutagenesis study (16). In particular,
the two most critical residues, A170 and A302
(Fig. 4), are paired at the edges of the upper and
lower lobes of the L-Glu binding site, respectively.
The remaining residue, D435, is located outside of
the hinge region (Fig. 6A-2).
In contrast, all of the residues that are critical for
the broadly tuned response lie in regions that are
distinct from the orthosteric binding site (Fig. 6A).
Of the six key residues, four (R307, K377, K379,
and K460) are positioned on the outer side of the
predicted IMP-binding region (16) near the
opening of the VFTD. Another residue, M320, is
located at the internal side of the lower lobe, and
the final residue, K328, is located outside of the
hinge region. To clarify whether L-amino acids
other than L-Glu bind at the reported L-Glu
binding site or at the newly identified
nonorthosteric site, we examined the response
patterns to the four representative L-amino acids
of two hT1R1-mutants, hT1R1-S172A and
-E301A. These two mutants contained mutations
at residues that are reportedly critical for L-Glu
binding (Fig. 6), and these mutations reduced the
activity in response to L-Glu (16). Consequently,
neither hT1R1-S172A nor -E301A demonstrated
detectable responses to L-Ala or L-Ser (Fig. 7A),
suggesting that L-amino acids other than L-Glu
also bind at the L-Glu binding site in the hinge
region. Collectively with the results that the
introduction of mouse-type mutations in the six
key residues for mouse-type responses conferred
higher activities of mT1R1/mT1R3 ligands and
acidic amino acids for the hT1R1 receptor (Fig.
5C and Table 1), the residues that were critical for
broadly tuned responses should be related to the
modulation of receptor activity rather than to the
binding of L-amino acids.
Because some residues that were critical for
broadly tuned responses were located near the
by guest on April 14, 2018
http://ww
w.jbc.org/
Dow
nloaded from
10
reported IMP-binding site (Fig. 6A), we examined
whether the key residues for the broadly tuned
responses modulated the receptor activity in an
identical manner as the enhancement via IMP. We
compared the effect of IMP application on the
L-amino acid responses among the six hT1R1
mutants in the newly identified nonorthosteric
sites and a hT1R1 mutant in the IMP-binding site
(hT1R1-H308E). hT1R1-H308E was introduced
as a reverse charge mutation in the IMP-binding
site, which partly mimicked the stable closed
conformation that is induced upon IMP binding
(16). All six mutants that exhibited high receptor
activity in this study retained the synergistic effect
between L-amino acids and IMP (Fig. 7B and 7C;
R307T). Conversely, the receptor activity of
hT1R1-H308E was no longer enhanced upon the
addition of IMP, as reported in a previous study
(Fig. 7C) (16). These results suggest that the
residues that are critical for broadly tuned
responses modulate the receptor activity in a
manner that is distinct from that of IMP.
Based on our site-directed mutagenesis
analysis and molecular modeling results, we
hypothesized that the ligand specificity of T1R1 is
determined by a combination of two distinct
factors: 1) the amino acid selectivity, which is
characterized by the residues at the orthosteric
binding site, and 2) the receptor activity, which is
modulated by residues at the nonorthosteric site.
To confirm this hypothesis, we constructed
multiple point mutants for both determinants in
hT1R1 and mT1R1 and evaluated whether the
ligand specificities of these receptors were similar
to those of the T1R1s of other species. First, we
generated a quadruple mutant hT1R1 in which
each of the residues that are critical for acidic
amino acid recognition (A170 and A302 in hT1R1,
Fig. 4) and broadly tuned responses (M320 and
K379 in hT1R1, Fig. 5) were mutated to the
corresponding mouse residues. The mutant,
hT1R1-A170E/A302D/M320T/K379G, exhibited
higher response intensities to various amino acids
than to acidic amino acids, as was observed for
mT1R1-WT when the response intensities to 50
mM of each amino acid were compared among 17
types of amino acids (Fig. 8A). In contrast, the
12-point mutant mT1R1, in which all 12 key
residues were mutated to the corresponding human
residues, exhibited the highest response intensity
to L-Glu among 17 evaluated amino acids, as was
observed for hT1R1-WT (Fig. 8B). These results
confirm the validity of our hypothesis that a
combination of these two factors determines the
ligand specificity of T1R1/T1R3.
Characteristics of Nonhuman Primate T1R1-
Sensitivity to L-Glu varies among primate species
(28). Expecting that altering key determinant
residues of T1R1 would modify their sensitivity to
L-amino acids, we compared the deduced coding
sequences of T1R1 from three nonhuman primate
species and examined the response patterns of the
encoded receptors. We selected two species of Old
World monkeys (the rhesus macaque, Macaca
mulatta, and the hamadryas baboon, Papio
hamadryas) and one species of New World
monkeys (the Bolivian squirrel monkey, Saimiri
boliviensis).
When coexpressed with mT1R3, the macaque
by guest on April 14, 2018
http://ww
w.jbc.org/
Dow
nloaded from
11
T1R1, in which all 12 critical residues are
identical (10 residues) or similar (2 residues) to
those in hT1R1 (Fig. 9A), exhibited higher L-Glu
activity than L-Ala activity, as with hT1R1 (Figs.
9B and 9C). Baboon T1R1, in which all key
residues except for T320 are identical to those in
macaque T1R1 (Fig. 9A), also exhibited higher
L-Glu activity than L-Ala activity (Fig. 9D).
Moreover, baboon T1R1 exhibited higher L-Glu
and L-Ala activities than those for macaque T1R1
(Figs. 9C and 9D). The introduction of the
mutation M320T into macaque T1R1 resulted in
increases in both L-Glu and L-Ala activities (Fig.
9C), demonstrating that T320 contributes to
increased receptor activity in baboon T1R1.
In contrast, in the squirrel monkey T1R1, 5 of
the 12 key residues are identical to those in
mT1R1 (Fig. 9A). Notably, one of the residues
that is critical for acidic amino acid recognition
(D302) is identical to that in mT1R1. Additionally,
of the six key residues that are important for the
broadly tuned response, three are conserved (T307,
T320 and Q328), whereas T379 is similar to the
corresponding residue in mT1R1 (G380). As
expected from the amino acid sequence, the L-Glu
activity for the squirrel monkey T1R1 was as low
as that for the hT1R1-A302D mutant receptor (Fig.
9E). Conversely, the squirrel monkey T1R1
demonstrated the greatest L-Ala potency among
the four primate T1R1 receptors (Figs. 9B-9E).
These results reinforce the importance of the 12
residues that were identified in this study.
DISCUSSION
In this study, we investigated the molecular
mechanism underlying species-dependent
differences in the ligand specificity of T1R1/T1R3.
Site-directed mutagenesis analysis and molecular
modeling indicated that the human-type acidic
amino acid recognition and mouse-type broadly
tuned response are controlled by separate sets of
amino acids in the VFTD of T1R1 (Fig. 6).
The Orthosteric Site is Responsible for
Human-type Acidic Amino Acid Recognition- The
L-Glu binding site of hT1R1 has been previously
proposed to lie within the hinge region of the
VFTD based on site-directed mutagenesis analysis
and molecular models that are based on the
structures of mGluRs (15,16,29). However, the
crucial determinants of the L-Glu-specific
response in human receptors have not yet been
examined. In this study, six residues that
contributed to the acidic amino acid responses
have been identified: S148, R151, A170, E174,
A302, and D435 in hT1R1 (Fig. 4). Of the six
residues, five (S148, R151, A170, E174, and
A302) are located in the hinge region (Fig. 6A).
Additionally, S148, R151, A170, and A302
reportedly correspond to the L-Glu binding site in
mGluR1 (15,30), indicating that acidic amino acid
recognition is primarily attributable to the
properties of the orthosteric ligand-binding site.
One marked difference between hT1R1 and
mT1R1 lies in the electrostatic potential profile of
this site. Of the six key residues, four are
negatively charged in either hT1R1 or mT1R1 (i.e.,
h/m; A170/E171, E174/V175, A302/D303, and
D435/K436) (Fig. 6B). Of the mT1R1 mutants in
which one of these six residues was mutated, four
involving negatively charged residues (i.e.,
by guest on April 14, 2018
http://ww
w.jbc.org/
Dow
nloaded from

12
mT1R1-E171A, -V175E, -D303A and -K436D)
exhibited greater effects than the other two
mutants (i.e., mT1R1-N149S and -H152R) (Fig. 4).
In particular, the two most critical residues in
hT1R1, A170 and A302 (E171 and D303 in
mT1R1), are located in pairs at the edges of the
upper and lower lobes of the orthosteric binding
site, respectively (Fig. 6A). S186 in mGluR1,
which corresponds to A170 in hT1R1, is known to
interact with the distal carboxylic acid moiety of
L-Glu via a water molecule (13,30). Additionally,
G319 in mGluR1, which corresponds to A302 in
hT1R1, is also positioned near the carboxylate
side chain of L-Glu (30,31). In mT1R1, mutating
Ala to an acidic residue at this position is certainly
expected to affect acidic amino acid binding due
to the electrostatic repulsion between the negative
charges of the carboxylic acid moieties.
Nonorthosteric Sites Responsible for Mouse-type
Broadly Tuned Responses to L-Amino Acids- In
contrast to the recognition mechanism for L-Glu
binding, the recognition mechanism for other
L-amino acids is unknown. We identified six
residues that are responsible for the mouse-type
broadly tuned response (Fig. 5). The molecular
model indicated that all six residues lie in regions
that are distinct from the orthosteric binding site
(Fig. 6A). The T1R family possesses multiple
ligand-binding sites in addition to its orthosteric
binding domain (32). Therefore, it is possible that
these residues are related to a novel amino acid
binding site. However, these residues modulated
the activities of not only the ligands of
mT1R1/mT1R3 but also acidic amino acids,
which are assumed to bind at the orthosteric
binding site (Figs. 5B, 5C and 5D). Moreover, we
examined whether L-Ala and L-Ser bind at the
orthosteric binding site using two hT1R1-mutants,
hT1R1-S172A and -E301A, in which residues that
are reportedly critical for L-Glu binding in the
hinge region were mutated to an Ala residue (Fig.
7A) (16). Although hT1R1-S172A and -E301A
reportedly retained their responses to the ligand
‘S807’, which interacts with the TMD of T1R1
(16), neither receptor exhibited a response to
L-Ala or L-Ser (Fig. 7A). These results suggest
that various L-amino acids bind at the orthosteric
binding site and that the key residues for broadly
tuned responses are related to the modulation of
receptor activity. The mT1R1/mT1R3 receptor
should thus exhibit broadly tuned responses to
various amino acids because of its high receptor
activity. We propose at least two possible
mechanisms through which the receptor activity
could be modulated: 1) the key residues for
broadly tuned responses regulate the potencies of
orthosteric ligands (L-amino acids) by inducing a
conformational change that affects the association
and/or dissociation rate of ligands at the
orthosteric site (affinity modulation) and/or 2)
these residues affect the signaling capacity
following the binding of the amino acid to the
orthosteric binding site (efficacy modulation) (33).
Zhang et al. previously proposed the existence of
‘pincer residues’ near the opening of the VFTD
and suggested that such pincer residues could be
involved in lobe-lobe or lobe-enhancer
interactions to help stabilize the closed
conformation of T1Rs (34). For example, the
by guest on April 14, 2018
http://ww
w.jbc.org/
Dow
nloaded from
13
enhancement activity of IMP may be induced by
its coordination of the positively charged pincer
residues via its negatively charged phosphate
group to stabilize the closed conformation of the
VFTD of T1R1 (16). Therefore, the introduction
of a reverse charge mutation in the IMP-binding
site of hT1R1 (H308E) conferred the receptor with
greater L-Glu potency and efficacy, in part by
mimicking the enhancement mechanism of IMP
(16). However, all mutants that exhibited high
receptor activity in this study retained the
synergistic effect between L-amino acids and IMP
(Figs. 7B and 7C; R307T), whereas the activity of
hT1R1-H308E was no longer enhanced by the
addition of IMP, as reported in a previous study
(Fig. 7C) (16). These results suggest that the
residues that are critical for broadly tuned
responses modulate the receptor activity in a
manner that is distinct from that of IMP. Using
molecular modeling, Roura et al. proposed that
R307 in hT1R1 was critical for amino acid
recognition and suggested that the presence of Thr
(which is a neutral polar residue) in rodent T1R1
at this position rather than Arg (which is a charged
polar residue) allows a wider range of L-amino
acids to enter and interact with the orthosteric
ligand-binding site (29). Note that all five key
residues on the surface of the VFTD differ in
charge between hT1R1 and mT1R1 (i.e., h/m;
R307/T308, K328/Q329, K377/E378, K379/G380,
and K460/E461) (Fig. 6). Although the
mechanism through which these residues enhance
the receptor activity remains unclear, the
electrostatic properties of the nonorthosteric site
likely play an important role in the ligand
specificity of T1R1, as was observed for the
orthosteric binding site. Conversely, the other key
residue 320, which is located at the internal side of
the lower lobe, modulated the L-amino acid
activities without altering the electrostatic
properties (Figs. 5 and 9C). The receptor activity
of T1R1/T1R3 should be determined by multiple
residues that regulate the potency and/or efficacy
of the orthosteric ligands through various
mechanisms, including the modulation of the local
or general conformation of receptors from the side
of the nonorthosteric site.
Determinants of the Ligand Specificity of
T1R1/T1R3- Multiple point mutants for both
determinants experimentally validated our
hypothesis that the ligand specificity of
T1R1/T1R3 is determined by a combination of
two distinct factors: 1) the amino acid selectivity,
which is characterized by the residues at the
orthosteric binding site, and 2) the receptor
activity, which is modulated by the residues at the
nonorthosteric sites (Fig. 8). Additionally, we
confirmed that the hypothesis regarding the
existence of two determinants is also applicable to
the T1R1 receptors of three species of nonhuman
primates (Fig. 9). Although we cannot ignore the
possibility that an introduction of a mutation
affects the expression levels of the receptors rather
than the efficacy of the ligands, these results
validated the interpretation of the results from
chimeric receptors and point mutants. Because the
receptor activity of hT1R1/mT1R3 was higher
than that of hT1R1/hT1R3, we propose that the
residues that are critical for the receptor activities
by guest on April 14, 2018
http://ww
w.jbc.org/
Dow
nloaded from
14
should lie at various nonorthosteric sites,
including T1R3. Mammalian T1R1/T1R3 should
vary in ligand specificity due to changes in the
properties of both the orthosteric and
nonorthosteric sites of T1R1/T1R3.
Recent studies have revealed that T1Rs and
their downstream molecules (e.g., Gαgust, PLCβ2,
and TRPM5) are widely distributed in a variety of
organs (35-37). Although the function of
T1R1/T1R3 in non-taste tissues remains unclear,
the difference in ligand specificity between
species should also affect physiological events
other than taste perception. When and why did the
changes in the ligands of T1R1/T1R3 occur? In
this study, we have elucidated “how” human T1R1
is specific for acidic amino acids. The
identification of the residues that are crucial for
amino acid recognition should provide a clue to
reveal the evolutionary and physiological
importance of changes in the ligands of
T1R1/T1R3.
REFERENCES
1. Ikeda, K. (2002) New seasonings. Chem Senses 27, 847-849
2. Yamaguchi, S., and Ninomiya, K. (2000) Umami and food palatability. J Nutr 130, 921S-926S
3. Nelson, G., Chandrashekar, J., Hoon, M. A., Feng, L., Zhao, G., Ryba, N. J., and Zuker, C. S.
(2002) An amino-acid taste receptor. Nature 416, 199-202
4. Toyono, T., Seta, Y., Kataoka, S., Kawano, S., Shigemoto, R., and Toyoshima, K. (2003)
Expression of metabotropic glutamate receptor group I in rat gustatory papillae. Cell Tissue Res
313, 29-35
5. Toyono, T., Seta, Y., Kataoka, S., Harada, H., Morotomi, T., Kawano, S., Shigemoto, R., and
Toyoshima, K. (2002) Expression of the metabotropic glutamate receptor, mGluR4a, in the taste
hairs of taste buds in rat gustatory papillae. Arch Histol Cytol 65, 91-96
6. San Gabriel, A., Uneyama, H., Yoshie, S., and Torii, K. (2005) Cloning and characterization of a
novel mGluR1 variant from vallate papillae that functions as a receptor for L-glutamate stimuli.
Chem Senses 30 Suppl 1, i25-26
7. Chaudhari, N., Landin, A. M., and Roper, S. D. (2000) A metabotropic glutamate receptor variant
functions as a taste receptor. Nat Neurosci 3, 113-119
8. Chaudhari, N., Yang, H., Lamp, C., Delay, E., Cartford, C., Than, T., and Roper, S. (1996) The
taste of monosodium glutamate: membrane receptors in taste buds. J Neurosci 16, 3817-3826
9. Damak, S., Rong, M., Yasumatsu, K., Kokrashvili, Z., Varadarajan, V., Zou, S., Jiang, P.,
Ninomiya, Y., and Margolskee, R. F. (2003) Detection of sweet and umami taste in the absence of
taste receptor T1r3. Science 301, 850-853
10. Zhao, G. Q., Zhang, Y., Hoon, M. A., Chandrashekar, J., Erlenbach, I., Ryba, N. J., and Zuker, C.
S. (2003) The receptors for mammalian sweet and umami taste. Cell 115, 255-266
by guest on April 14, 2018
http://ww
w.jbc.org/
Dow
nloaded from
15
11. Kusuhara, Y., Yoshida, R., Ohkuri, T., Yasumatsu, K., Voigt, A., Hubner, S., Maeda, K., Boehm,
U., Meyerhof, W., and Ninomiya, Y. (2013) Taste responses in mice lacking taste receptor subunit
T1R1. J Physiol 591, 1967-1985
12. Pin, J. P., Galvez, T., and Prezeau, L. (2003) Evolution, structure, and activation mechanism of
family 3/C G-protein-coupled receptors. Pharmacol Ther 98, 325-354
13. Kunishima, N., Shimada, Y., Tsuji, Y., Sato, T., Yamamoto, M., Kumasaka, T., Nakanishi, S.,
Jingami, H., and Morikawa, K. (2000) Structural basis of glutamate recognition by a dimeric
metabotropic glutamate receptor. Nature 407, 971-977
14. Muto, T., Tsuchiya, D., Morikawa, K., and Jingami, H. (2007) Structures of the extracellular
regions of the group II/III metabotropic glutamate receptors. Proc Natl Acad Sci U S A 104,
3759-3764
15. Lopez Cascales, J. J., Oliveira Costa, S. D., de Groot, B. L., and Walters, D. E. (2010) Binding of
glutamate to the umami receptor. Biophys Chem 152, 139-144
16. Zhang, F., Klebansky, B., Fine, R. M., Xu, H., Pronin, A., Liu, H., Tachdjian, C., and Li, X.
(2008) Molecular mechanism for the umami taste synergism. Proc Natl Acad Sci U S A 105,
20930-20934
17. Li, X., Staszewski, L., Xu, H., Durick, K., Zoller, M., and Adler, E. (2002) Human receptors for
sweet and umami taste. Proc Natl Acad Sci U S A 99, 4692-4696
18. Koizumi, A., Tsuchiya, A., Nakajima, K., Ito, K., Terada, T., Shimizu-Ibuka, A., Briand, L.,
Asakura, T., Misaka, T., and Abe, K. (2011) Human sweet taste receptor mediates acid-induced
sweetness of miraculin. Proc Natl Acad Sci U S A 108, 16819-16824
19. Koizumi, A., Nakajima, K., Asakura, T., Morita, Y., Ito, K., Shmizu-Ibuka, A., Misaka, T., and
Abe, K. (2007) Taste-modifying sweet protein, neoculin, is received at human T1R3 amino
terminal domain. Biochem Biophys Res Commun 358, 585-589
20. Xu, H., Staszewski, L., Tang, H., Adler, E., Zoller, M., and Li, X. (2004) Different functional
roles of T1R subunits in the heteromeric taste receptors. Proc Natl Acad Sci U S A 101,
14258-14263
21. Jiang, P., Ji, Q., Liu, Z., Snyder, L. A., Benard, L. M., Margolskee, R. F., and Max, M. (2004) The
cysteine-rich region of T1R3 determines responses to intensely sweet proteins. J Biol Chem 279,
45068-45075
22. Liu, B., Ha, M., Meng, X. Y., Kaur, T., Khaleduzzaman, M., Zhang, Z., Jiang, P., Li, X., and Cui,
M. (2011) Molecular mechanism of species-dependent sweet taste toward artificial sweeteners. J
Neurosci 31, 11070-11076
23. Altschul, S. F., Gish, W., Miller, W., Myers, E. W., and Lipman, D. J. (1990) Basic local
alignment search tool. J Mol Biol 215, 403-410
by guest on April 14, 2018
http://ww
w.jbc.org/
Dow
nloaded from
16
24. Inouye, S. (2008) Cloning, expression, purification and characterization of an isotype of clytin, a
calcium-binding photoprotein from the luminous hydromedusa Clytia gregarium. J Biochem 143,
711-717
25. Toda, Y., Okada, S., and Misaka, T. (2011) Establishment of a new cell-based assay to measure
the activity of sweeteners in fluorescent food extracts. J Agric Food Chem 59, 12131-12138
26. Yamaguchi, S. (1971) Measurement of the relative taste intensity of some L-a-amino acids and
5'-nucleotides. J Food Sci 36, 846-849
27. Kawai, M., Sekine-Hayakawa, Y., Okiyama, A., and Ninomiya, Y. (2012) Gustatory sensation of
L: - and D: -amino acids in humans. Amino Acids 43, 2349-2358
28. Laska, M., and Hernandez Salazar, L. T. (2004) Gustatory responsiveness to monosodium
glutamate and sodium chloride in four species of nonhuman primates. J Exp Zool A Comp Exp
Biol 301, 898-905
29. Roura, E., Humphrey, B., Klasing, K., and Swart, M. (2011) Is the pig a good umami sensing
model for humans? A comparative taste receptor study. Flavour and Fragrance Journal 26,
282-285
30. Wellendorph, P., and Brauner-Osborne, H. (2009) Molecular basis for amino acid sensing by
family C G-protein-coupled receptors. Br J Pharmacol 156, 869-884
31. Madsen, U., Bräuner-Osborne, H., Greenwood, J., Johansen, T., Krogsgaard-Larsen, P., Liljefors,
T., Nielsen., M., and Frølund., B. (2005) GABA and Glutamate Receptor Ligands and their
Therapeutic Potential in CNS Disorders. Drug Discovery Handbook, 797-907
32. Jiang, P., Cui, M., Zhao, B., Snyder, L. A., Benard, L. M., Osman, R., Max, M., and Margolskee,
R. F. (2005) Identification of the cyclamate interaction site within the transmembrane domain of
the human sweet taste receptor subunit T1R3. J Biol Chem 280, 34296-34305
33. Conn, P. J., Christopoulos, A., and Lindsley, C. W. (2009) Allosteric modulators of GPCRs: a
novel approach for the treatment of CNS disorders. Nat Rev Drug Discov 8, 41-54
34. Zhang, F., Klebansky, B., Fine, R. M., Liu, H., Xu, H., Servant, G., Zoller, M., Tachdjian, C., and
Li, X. (2010) Molecular mechanism of the sweet taste enhancers. Proc Natl Acad Sci U S A 107,
4752-4757
35. Finger, T. E., and Kinnamon, S. C. (2011) Taste isn't just for taste buds anymore. F1000 Biol Rep
3, 20
36. Wauson, E. M., Zaganjor, E., Lee, A. Y., Guerra, M. L., Ghosh, A. B., Bookout, A. L., Chambers,
C. P., Jivan, A., McGlynn, K., Hutchison, M. R., Deberardinis, R. J., and Cobb, M. H. (2012) The
G protein-coupled taste receptor T1R1/T1R3 regulates mTORC1 and autophagy. Mol Cell 47,
851-862
37. Yamamoto, K., and Ishimaru, Y. (2012) Oral and extra-oral taste perception. Semin Cell Dev Biol
by guest on April 14, 2018
http://ww
w.jbc.org/
Dow
nloaded from
17
Acknowledgements- We thank the Genome Institute at the Washington University School of Medicine, the
Baylor College of Medicine Human Genome Sequencing Center, and the Broad Institute for
sequencing and assembling the baboon and squirrel monkey DNA.
FOOTNOTES
The work was supported in part by the Cooperation Research Program of the Primate Research
Institute of Kyoto University, by the Funding Program for Next Generation World-Leading Researchers of
the Japan Society for the Promotion of Science (LS037 to T.M.), and by a grant (E0111501) from the
Korea Food Research Institute (to T.M.).
FIGURE LEGENDS
FIGURE 1. The domains of T1R1/T1R3 that are critical for ligand specificity. (A) The responses of
hT1R1/hT1R3 to L-Glu were detected using a Ca2+
-sensitive fluorescent dye (fura-2). HEK293T cells
coexpressing hT1R1/hT1R3 together with rG15i2 were stimulated with 100 mM L-Glu. The figures show
representative cell images obtained before (upper) and after (lower) L-Glu application. The color scale
indicates the F340/F380 ratio. Scale bar, 50 μm. (B) The dose-response curves of hT1R1/hT1R3 to L-Glu
and L-Asp. The changes in intracellular [Ca2+
] mobilization were measured based on the luminescence of
mt-clytin-II. The values represent the mean ± SEM of the RLU (AUC) of four recorded wells. (C) The
response patterns of hT1R1/hT1R3 and mT1R1/mT1R3 to 16 L-amino acids and glycine. HEK293T cells
coexpressing hT1R1/hT1R3 or mT1R1/mT1R3 together with rG15i2 were separately stimulated with 50
mM of each amino acid. (D) The mixed pairs of human and mouse T1Rs were transiently transfected into
HEK293T cells with rG15i2, and the cells were stimulated with 50 mM of L-Ala, L-Ser, L-Asp, and
L-Glu. (E, F) The cells expressing hVFTD-mCRD-mTMD T1R1 (E) or mVFTD-hCRD-hTMD T1R1 (F)
together with both mT1R3 and rG15i2 were stimulated with 50 mM of each amino acid. VFTD: residues
1-496 in hT1R1 and residues 1-497 in mT1R1; CRD-TMD: residues 497-841 in hT1R1 and residues
498-842 in mT1R1. The values represent the mean ± SEM of the RLU (AUC) of 5-6 recorded wells.
Significant differences from the response to buffer were analyzed using one-way ANOVA followed by
Dunnett’s test (*p<0.05 for hT11R1/hT1R3 (C), hT1R1/mT1R3 (D), hVFTD-mCRD-mTMD
T1R1/mT1R3 (E), and mVFTD-hCRD-hTMD T1R1/mT1R3 (F); and †p<0.05 for mT1R1/mT1R3 (B)).
FIGURE 2. The ligand specificity of human-to-mouse chimeric T1R1. (A) Schematic diagrams of
human-to-mouse chimeric T1R1 receptors. Regions from hT1R1 are shown in green, and regions from
mT1R1 are shown in purple. hT1R1(m.1-143) comprised residues 1-143 from mT1R1 with the remaining
by guest on April 14, 2018
http://ww
w.jbc.org/
Dow
nloaded from
18
sequence of hT1R1. hT1R1(m.144-178) comprised residues 1-142 from hT1R1, residues 144-178 from
mT1R1, and residues 178-841 from hT1R1. The other chimeras follow an identical naming scheme. The
alignments of the amino acid sequences are shown in Fig. 6B. (B-K) The critical regions in the VFTD of
T1R1. Each human-to-mouse chimeric T1R1 was coexpressed with both mT1R3 and rG15i2, and the
dose-response curves to L-Glu, L-Ala (B, D, F, H, J), L-Asp, and L-Ser (C, E, G, I, K) were examined in
the absence (solid lines with filled symbols) or presence (dashed lines with open symbols) of 1 mM IMP.
The values represent the mean ± SEM of the RLU (AUC) of 5-6 recorded wells.
FIGURE 3. The ligand specificity of mouse-to-human chimeric T1R1. (A) Schematic diagrams of
mouse-to-human chimeric T1R1 receptors. Regions from hT1R1 are shown in green, and regions from
mT1R1 are shown in purple. The alignments of the amino acid sequences are shown in Fig. 6B. (B-K).
The critical regions in the VFTD of T1R1. Each mouse-to-human chimeric T1R1 was coexpressed with
both mT1R3 and rG15i2, and the dose-response curves to L-Glu, L-Ala (B, D, F, H, J), L-Asp, and L-Ser
(C, E, G, I, K) were examined. The values represent the mean ± SEM of the RLU (AUC) of 6 recorded
wells.
FIGURE 4. Residues that are critical for acidic amino acid recognition. (A-F) Point mutants in the VFTD
of mT1R1 demonstrated increased responses to L-Glu. Each WT and mutant mT1R1 was transfected into
HEK293T cells together with mT1R3 and rG15i2, and the dose-response curves to L-Glu and L-Ala were
determined using a luminescence-based assay. (G-L) Dose-response curves of the hT1R1-mutants and WT
to L-Glu and L-Ala. Each WT and mutant hT1R1 was transfected into HEK293T cells together with
hT1R3 and rG15i2. The values represent the mean ± SEM of the RLU (AUC) of 6-7 recorded wells.
Significant differences between WT (A-F, mT1R1-WT; G-L, hT1R1-WT) and mutant receptors were
analyzed using Student’s t-test (*p<0.05 for L-Glu responses; and †p<0.05 for L-Ala responses).
FIGURE 5. Residues that are critical for the broadly tuned response to L-amino acids. (A) The response
profiles to 17 amino acids for hT1R1 mutants, which exhibited increased activity to various amino acids.
Each WT and hT1R1-mutant was transfected into HEK293T cells together with mT1R3 and rG15i2, and
50 mM of each amino acid was applied. The values represent the mean ± SEM of the RLU (AUC) of 5-6
recorded wells. Significant differences from the responses to buffer were analyzed using one-way
ANOVA followed by Dunnett’s test (*p<0.05). (B-D) Each WT and mutant hT1R1 was transfected into
HEK293T cells together with mT1R3 (B, C) or hT1R3 (D), and the dose-response curves to L-Ala (B, D)
and L-Glu (C) were examined. (E) The dose-response curves of mT1R1 mutants to L-Ala. Each WT and
mutant mT1R1 was transfected into HEK293T cells together with mT1R3 and rG15i2. The values
represent the mean ± SEM of the RLU (AUC) of 5-8 recorded wells.
by guest on April 14, 2018
http://ww
w.jbc.org/
Dow
nloaded from
19
FIGURE 6. Two distinct determinants of amino acid selectivity in T1R1. (A) Mapping of the critical
residues on a molecular model of the VFTD of hT1R1. The models are oriented in the horizontal (A-1)
and vertical (A-2) directions. The hinge region is to the right, and the opening is to the left. The six
residues that are critical for acidic amino acid recognition that were identified in this study are colored
green (S148, R151, E174, and D435) and cyan (A170 and A302). The six residues that are critical for the
broadly tuned responses to L-amino acids (R307, M320, K328, K377, K379, and K460) are colored
purple. The residues that were reported to be critical for L-Glu binding based on a previous study (16)
(T149, S172, D192, Y220, and E301) are colored yellow, and those that were reported to be critical for
IMP binding (H71, R277, S306, and H308) are colored red (16). (B) Sequence alignment of the VFTD of
human and mouse T1R1. The six residues that are critical for acidic amino acid recognition that were
identified in this study are colored green. The six residues that are critical for the broadly tuned responses
to L-amino acids are colored purple. The residues that were reported to be critical for L-Glu binding based
on a previous study (16) are colored yellow, and the residues that were reported to be critical for IMP
binding (16) are colored red.
FIGURE 7. (A) hT1R1 mutants in the L-Glu binding site exhibited weaker responses to L-Ala, L-Ser, and
acidic amino acids. HEK293T cells were transfected with each hT1R1 mutant and WT together with
mT1R3 and rG15i2 and stimulated with 50 mM of each amino acid. The values represent the mean ± SEM
of the RLU (AUC) of four recorded wells. Significant differences from the response to buffer were
analyzed using one-way ANOVA followed by Dunnett’s test (*p<0.05 for hT11R1-WT; and †p<0.05 for
hT1R1-S172A). (B, C) hT1R1 mutants in the residues that are critical for the broadly tuned response
retained the enhanced activity in response to IMP. (B) The IMP-enhanced activities of hT1R1 mutants that
gained the ability to induce broadly tuned responses. Cells expressing each of the hT1R1 mutants together
with hT1R3 and rG15i2 were stimulated with L-Ala or L-Glu in the absence or presence of 1 mM IMP.
The L-Glu concentrations used in the assay were 1 (WT), 0.1 (R307T), 0.2 (M320T, K328Q, K377E, and
K460E), and 0.01 (K379G) mM, whereas the Ala concentrations used were 15 (WT), 5 (R307), 10
(M320T, K328Q, K377E, and K460E), and 1 (K379G) mM. Significant differences between the amino
acid responses with and without IMP were analyzed using Student’s t-test (*p<0.05 for L-Glu; and
†p<0.05 for L-Ala). (C) IMP activities of hT1R1 mutants of either the IMP-binding site (H308E) or the
residue that is critical for the broadly tuned response (R307T). The activity of hT1R1-R307T was
enhanced by IMP (The EC50 values are 0.7 ± 0.1 mM for L-Glu and 0.008 ± 0.002 mM for L-Glu + IMP),
whereas the activity of H308E was not enhanced by IMP (The EC50 values are 0.7 ± 0.1 mM for L-Glu
and 0.8 ± 0.1 mM for L-Glu + IMP). Each of the hT1R1 mutants was coexpressed with both mT1R3 and
rG15i2, and the dose-response curves to L-Glu were evaluated in the presence and absence of 1 mM IMP.
by guest on April 14, 2018
http://ww
w.jbc.org/
Dow
nloaded from
20
The values represent the mean ± SEM of the RLU (AUC) of 5-7 recorded wells.
FIGURE 8. The response profiles of the multiple point mutants to 17 amino acids. The multiple point
mutants included mutations in residues that are critical for both acidic amino acid recognition and the
broadly tuned response. HEK293T cells were transfected with
hT1R1-A170E/A302D/M320T/K379G/hT1R3 (A) or
mT1R1-N149S/H152R/E171A/V175E/D303A/T308R/T321M/Q329K/E378K/G380K/K436D/E461K/mT
1R3 (B) together with rG15i2 and then stimulated with 50 mM of each amino acid. The values represent
the mean ± SEM of the RLU (AUC) of 6 recorded wells. Significant differences from the response to
buffer were analyzed using one-way ANOVA followed by Dunnett’s test (*p<0.05)
FIGURE 9. Twelve critical residues and the amino acid responses of T1R1 in nonhuman primates. (A)
The twelve residues that are critical for acidic amino acid recognition and the broadly tuned response of
human and mouse T1R1 and the equivalent residues of T1R1 in nonhuman primates. Residues that are
conserved with hT1R1 are colored green, and residues that are conserved with mT1R1 are colored purple.
(B-F) The dose-response curves of human (B), macaque (C), baboon (D), squirrel monkey (E), and mouse
(F) T1R1/mT1R3 to L-Glu and L-Ala. The results obtained for mutants (macaque T1R1-M320T and
hT1R1-A302D) are also shown in C and E, respectively (dashed lines with open symbols). The values
represent the mean ± SEM of the RLU (AUC) of 5 recorded wells. The EC50 values of L-Glu are 3.3 ± 0.4
mM for macaque T1R1-M320T and 1.8 ± 0.4 mM for baboon T1R1.
by guest on April 14, 2018
http://ww
w.jbc.org/
Dow
nloaded from
21
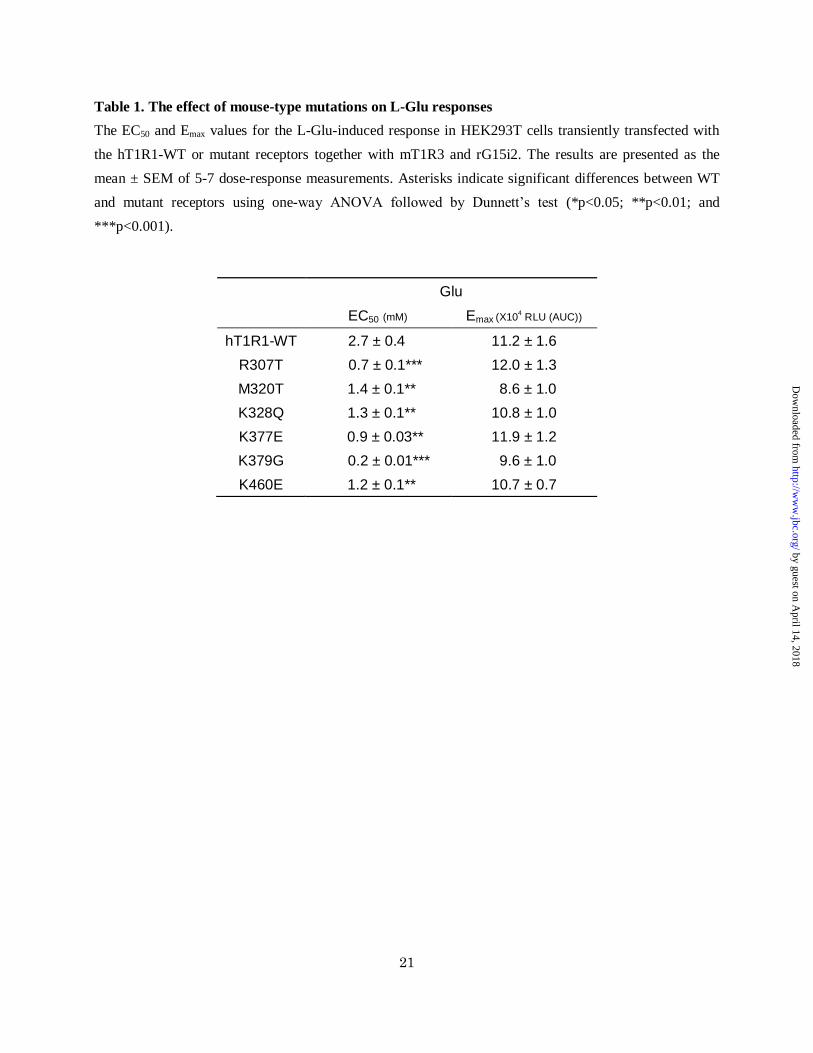
Table 1. The effect of mouse-type mutations on L-Glu responses
The EC50 and Emax values for the L-Glu-induced response in HEK293T cells transiently transfected with
the hT1R1-WT or mutant receptors together with mT1R3 and rG15i2. The results are presented as the
mean ± SEM of 5-7 dose-response measurements. Asterisks indicate significant differences between WT
and mutant receptors using one-way ANOVA followed by Dunnett’s test (*p<0.05; **p<0.01; and
***p<0.001).
Glu
EC50 (mM) Emax (X104 RLU (AUC))
hT1R1-WT 2.7 ± 0.4 11.2 ± 1.6
R307T 0.7 ± 0.1*** 12.0 ± 1.3
M320T 1.4 ± 0.1** 8.6 ± 1.0
K328Q 1.3 ± 0.1** 10.8 ± 1.0
K377E 0.9 ± 0.03** 11.9 ± 1.2
K379G 0.2 ± 0.01*** 9.6 ± 1.0
K460E 1.2 ± 0.1** 10.7 ± 0.7
by guest on April 14, 2018
http://ww
w.jbc.org/
Dow
nloaded from
Toda et al., Fig. 1
A B
1.0
0.2 ra
tio
C
D E
F
0
2
4
6
8
10
12
Ala
Ser
Gln
Thr
Gly
Met
Asn
Arg
Lys
His
Val
Leu
Ile
Pro
Phe
Asp
Glu
Buff
er
X
10
4 R
LU
(AU
C)
hT1R1/hT1R3 mT1R1/mT1R3
*
* * * * * *
*
† †
†
† † † † †
0
5
10
15
20
25
Ala
Ser
Asp
Glu
Buff
er
X 1
04 R
LU
(AU
C)
hT1R1/mT1R3
mT1R1/hT1R3
*
*
0
0.5
1
1.5
2
Ala
Ser
Asp
Glu
Buff
er
X 1
04 R
LU
(AU
C)
hVFTD-mCRD-mTMD T1R1/mT1R3
*
0
2
4
6
8
10
Ala
Ser
Gln
Thr
Gly
Met
Asn
Arg
Lys
His
Val
Leu
Ile
Pro
Phe
Asp
Glu
Buff
er
X1
04 R
LU
(AU
C) mVFTD-hCRD-hTMD T1R1/mT1R3 *
* *
* * * * *
0
1
2
3
4
5
0.01 0.1 1 10 100
X
10
4 R
LU
(AU
C)
(mM)
hT1R1/hT1R3
Glu
Asp
by guest on April 14, 2018
http://ww
w.jbc.org/
Dow
nloaded from
1 496 841hT1R1-WT hT1R1-VFTD CRD TMD
1 143 143 841hT1R1(m.1-143)
1 142 144 178 178 841hT1R1(m.144-178)
1 177 179 370 370 841hT1R1(m.179-370)
1 369 371 380 380 841hT1R1(m.371-380)
1 379 381 497 497 841hT1R1(m.381-497)
1 497 842mT1R1 mT1R1-VFTD CRD TMD
0
5
10
15
20
25
0.001 0.01 0.1 1 10 100
X
10
4 R
LU
(AU
C)
(mM)
Glu(hT1R1-WT)
Ala(hT1R1-WT)
Glu(hT1R1(m.371-380))
Ala(hT1R1(m.371-380))
Toda et al., Fig. 2
A
J
0
5
10
15
20
25
0.001 0.01 0.1 1 10 100
X
10
4 R
LU
(AU
C)
(mM)
Glu(hT1R1-WT)
Ala(hT1R1-WT)
Glu(hT1R1(m.179-370))
Ala(hT1R1(m.179-370))
0
5
10
15
20
25
0.001 0.01 0.1 1 10 100
X
10
4 R
LU
(AU
C)
(mM)
Glu(hT1R1-WT)
Ala(hT1R1-WT)
Glu(hT1R1(m.381-497))
Ala(hT1R1(m.381-497))
0
5
10
15
20
0.01 0.1 1 10 100
X
10
4 R
LU
(AU
C)
(mM)
Asp(hT1R1-WT)
Ser(hT1R1-WT)
Asp(hT1R1(m.1-143))
Ser(hT1R1(m.1-143))
0
5
10
15
20
0.01 0.1 1 10 100
X
10
4 R
LU
(AU
C)
(mM)
Asp(hT1R1-WT)
Ser(hT1R1-WT)
Asp(hT1R1(m.144-178))
Ser(hT1R1(m.144-178))
0
5
10
15
20
0.01 0.1 1 10 100
X
10
4 R
LU
(AU
C)
(mM)
Asp(hT1R1-WT)
Ser(hT1R1-WT)
Asp(hT1R1(m.371-380))
Ser(hT1R1(m.371-380))
0
5
10
15
20
0.01 0.1 1 10 100
X
10
4 R
LU
(AU
C)
(mM)
Asp(hT1R1-WT)
Ser(hT1R1-WT)
Asp(hT1R1(m.381-497))
Ser(hT1R1(m.381-497))
0
5
10
15
20
25
0.001 0.01 0.1 1 10 100
X
10
4 R
LU
(AU
C)
(mM)
Glu(hT1R1-WT) Ala(hT1R1-WT) Glu(hT1R1(m.144-178)) Ala(hT1R1(m.144-178)) Glu + IMP(hT1R1(m.144-178)) Ala + IMP(hT1R1(m.144-178))
0
5
10
15
20
0.01 0.1 1 10 100
X
10
4 R
LU
(AU
C)
(mM)
Asp(hT1R1-WT)
Ser(hT1R1-WT)
Asp(hT1R1(m.179-370))
Ser(hT1R1(m.179-370))
0
5
10
15
20
25
0.001 0.01 0.1 1 10 100
X
10
4 R
LU
(AU
C)
(mM)
Glu(hT1R1-WT)
Ala(hT1R1-WT)
Glu(hT1R1(m.1-143))
Ala(hT1R1(m.1-143))
Glu + IMP(hT1R1(m.1-143))
Ala + IMP(hT1R1(m1-143))
B
D
F
H
K
C
E
G
I
by guest on April 14, 2018
http://ww
w.jbc.org/
Dow
nloaded from
1 497 842mT1R1-WT mT1R1-VFTD CRD TMD
1 142 144 842mT1R1(h.1-142)
1 143 143 177 179 842mT1R1(h.143-177)
1 178 178 369 371 842mT1R1(h.178-369)
1 370 370 379 381 497 842mT1R1(h.370-379)
1 380 380 496 498 842mT1R1(h.380-496)
1 496 841hT1R1 hT1R1-VFTD CRD TMD
0
5
10
15
20
0.001 0.01 0.1 1 10 100
X
10
4 R
LU
(AU
C)
(mM)
Glu(mT1R1-WT)
Ala(mT1R1-WT)
Glu(mT1R1(h.143-177))
Ala(mT1R1(h.143-177))
0
5
10
15
20
0.001 0.01 0.1 1 10 100
X
10
4 R
LU
(AU
C)
(mM)
Glu(mT1R1-WT)
Ala(mT1R1-WT)
Glu(mT1R1(h.178-369))
Ala(mT1R1(h.178-369))
0
5
10
15
20
0.001 0.01 0.1 1 10 100
X
10
4 R
LU
(AU
C)
(mM)
Glu(mT1R1-WT)
Ala(mT1R1-WT)
Glu(mT1R1(h.380-496))
Ala(mT1R1(h.380-496))
Toda et al., Fig. 3
A
J
B
D
F
H
K
C
E
G
I
0
5
10
15
20
0.01 0.1 1 10 100
X
10
4 R
LU
(AU
C)
(mM)
Asp(mT1R1-WT)
Ser(mT1R1-WT)
Asp(mT1R1(h.143-177))
Ser(mT1R1(h.143-177))
0
5
10
15
20
0.01 0.1 1 10 100
X
10
4 R
LU
(AU
C)
(mM)
Asp(mT1R1-WT)
Ser(mT1R1-WT)
Asp(mT1R1(h.178-369))
Ser(mT1R1(h.178-369))
0
5
10
15
20
0.01 0.1 1 10 100
X
10
4 R
LU
(AU
C)
(mM)
Asp(mT1R1-WT)
Ser(mT1R1-WT)
Asp(mT1R1(h.380-496))
Ser(mT1R1(h.380-496))
0
5
10
15
20
0.001 0.01 0.1 1 10 100
X
10
4 R
LU
(AU
C)
(mM)
Glu(mT1R1-WT)
Ala(mT1R1-WT)
Glu(mT1R1(h.1-142))
Ala(mT1R1(h.1-142))
0
5
10
15
20
0.01 0.1 1 10 100
X
10
4 R
LU
(AU
C)
(mM)
Asp(mT1R1-WT)
Ser(mT1R1-WT)
Asp(mT1R1(h.1-142))
Ser(mT1R1(h.1-142))
0
5
10
15
20
0.01 0.1 1 10 100
X
10
4 R
LU
(AU
C)
(mM)
Asp(mT1R1-WT)
Ser(mT1R1-WT)
Asp(mT1R1(h.370-379))
Ser(mT1R1(h.370-379))
0
5
10
15
20
0.001 0.01 0.1 1 10 100
X
10
4 R
LU
(AU
C)
(mM)
Glu(mT1R1-WT)
Ala(mT1R1-WT)
Glu(mT1R1(h.370-379))
Ala(mT1R1(h.370-379))
by guest on April 14, 2018
http://ww
w.jbc.org/
Dow
nloaded from
Toda et al., Fig. 4
A
F
B
C
D
E
G
L
H
I
J
K
0
5
10
15
20
25
0.1 1 10 100
X
10
4 R
LU
(AU
C)
(mM)
Glu(mT1R1-WT)
Ala(mT1R1-WT)
Glu(V175E)
Ala(V175E)
*
* * *
†
†
†
† † †
0
5
10
15
20
25
0.1 1 10 100
X
10
4 R
LU
(AU
C)
(mM)
Glu(mT1R1-WT)
Ala(mT1R1-WT)
Glu(D303A)
Ala(D303A)
* *
* *
0
5
10
15
20
25
0.1 1 10 100
X
10
4 R
LU
(AU
C)
(mM)
Glu(mT1R1-WT)
Ala(mT1R1-WT)
Glu(K436D)
Ala(K436D)
*
* *
*
†
†
†
† † †
0
2
4
6
8
0.1 1 10 100
X
10
4 R
LU
(AU
C)
(mM)
Glu(hT1R1-WT)
Ala(hT1R1-WT)
Glu(A170E)
Ala(A170E)
* * * *
†
0
2
4
6
8
0.1 1 10 100
X
10
4 R
LU
(AU
C)
(mM)
Glu(hT1R1-WT)
Ala(hT1R1-WT)
Glu(E174V)
Ala(E174V) *
* * * †
0
2
4
6
8
0.1 1 10 100
X
10
4 R
LU
(AU
C)
(mM)
Glu(hT1R1-WT)
Ala(hT1R1-WT)
Glu(A302D)
Ala(A302D) †
†
† †
* * * *
0
2
4
6
8
0.1 1 10 100
X
10
4 R
LU
(AU
C)
(mM)
Glu(hT1R1-WT)
Ala(hT1R1-WT)
Glu(D435K)
Ala(D435K) *
*
*
†
* *
†
†
† † †
0
5
10
15
20
25
0.1 1 10 100
X
10
4 R
LU
(AU
C)
(mM)
mT1R1 mutant/mT1R3
Glu(mT1R1-WT)
Ala(mT1R1-WT)
Glu(N149S)
Ala(N149S)
*
* † † *
0
5
10
15
20
25
0.1 1 10 100
X
10
4 R
LU
(AU
C)
(mM)
Glu(mT1R1-WT)
Ala(mT1R1-WT)
Glu(H152R)
Ala(H152R)
*
* * *
†
†
† † †
0
5
10
15
20
25
0.1 1 10 100
X
10
4 R
LU
(AU
C)
(mM)
Glu(mT1R1-WT)
Ala(mT1R1-WT)
Glu(E171A)
Ala(E171A)
0
2
4
6
8
0.1 1 10 100
X
10
4 R
LU
(AU
C)
(mM)
hT1R1 mutant/hT1R3
Glu(hT1R1-WT)
Ala(hT1R1-WT)
Glu(S148N)
Ala(S148N)
0
2
4
6
8
0.1 1 10 100
X1
04 R
LU
(AU
C)
(mM)
Glu(hT1R1-WT)
Ala(hT1R1-WT)
Glu(R151H)
Ala(R151H)
by guest on April 14, 2018
http://ww
w.jbc.org/
Dow
nloaded from

A B
C
D
E
Toda et al., Fig. 5
0
5
10
15
20
Ala
Se
r
Gln
Th
r
Gly
Me
t
Asn
Arg
Lys
His
Va
l
Le
u
Ile
Pro
Ph
e
Asp
Glu
Bu
ffe
r
X10
4 R
LU
(AU
C)
hT1R1-WT/mT1R3
* * *
*
*
*
*
0
5
10
15
20
Ala
Se
r
Gln
Th
r
Gly
Me
t
Asn
Arg
Lys
His
Va
l
Le
u
Ile
Pro
Ph
e
Asp
Glu
Bu
ffe
r
X10
4 R
LU
(AU
C)
hT1R1-R307T/mT1R3 * *
* *
*
* *
* *
0
5
10
15
20
Ala
Se
r
Gln
Th
r
Gly
Me
t
Asn
Arg
Lys
His
Va
l
Le
u
Ile
Pro
Ph
e
Asp
Glu
Bu
ffe
r
X10
4 R
LU
(AU
C)
hT1R1-M320T/mT1R3
* * *
* * *
*
* *
0
5
10
15
20
Ala
Se
r
Gln
Th
r
Gly
Me
t
Asn
Arg
Lys
His
Va
l
Le
u
Ile
Pro
Ph
e
Asp
Glu
Bu
ffe
r
X10
4 R
LU
(AU
C)
hT1R1-K328Q/mT1R3
* *
* * *
*
* *
*
0
5
10
15
20
Ala
Se
r
Gln
Th
r
Gly
Me
t
Asn
Arg
Lys
His
Va
l
Le
u
Ile
Pro
Ph
e
Asp
Glu
Bu
ffe
r
X10
4 R
LU
(AU
C)
hT1R1-K377E/mT1R3
* *
* *
*
* *
*
0
5
10
15
20
Ala
Se
r
Gln
Th
r
Gly
Me
t
Asn
Arg
Lys
His
Va
l
Le
u
Ile
Pro
Ph
e
Asp
Glu
Bu
ffe
r
X10
4 R
LU
(AU
C)
hT1R1-K460E/mT1R3
* *
* *
*
*
* *
*
0
5
10
15
20
Ala
Se
r
Gln
Th
r
Gly
Me
t
Asn
Arg
Lys
His
Va
l
Le
u
Ile
Pro
Ph
e
Asp
Glu
Bu
ffe
r
x10
4 R
LU
(AU
C)
hT1R1-K379G/mT1R3
* *
* * *
*
* * *
*
* *
* *
*
0
5
10
15
0.1 1 10 100
X 1
04 R
LU
(AU
C)
Ala (mM)
hT1R1 mutant/mT1R3
WT
R307T
M320T
K328Q
K377E
K379G
K460E
0
5
10
15
0.001 0.01 0.1 1 10 100
X
10
4 R
LU
(AU
C)
Glu (mM)
hT1R1 mutant/mT1R3
WT
R307T
M320T
K328Q
K377E
K379G
K460E
0
5
10
15
20
0.1 1 10 100
X1
04 R
LU
(AU
C)
Ala (mM)
hT1R1 mutant/hT1R3
WT
R307T
M320T
K328Q
K377E
K379G
K460E
0
5
10
15
20
0.1 1 10 100
X1
04 R
LU
(AU
C)
Ala (mM)
mT1R1 mutant/mT1R3
WT
T308R
T321M
Q329K
E378K
G380K
E461K
by guest on April 14, 2018
http://ww
w.jbc.org/
Dow
nloaded from

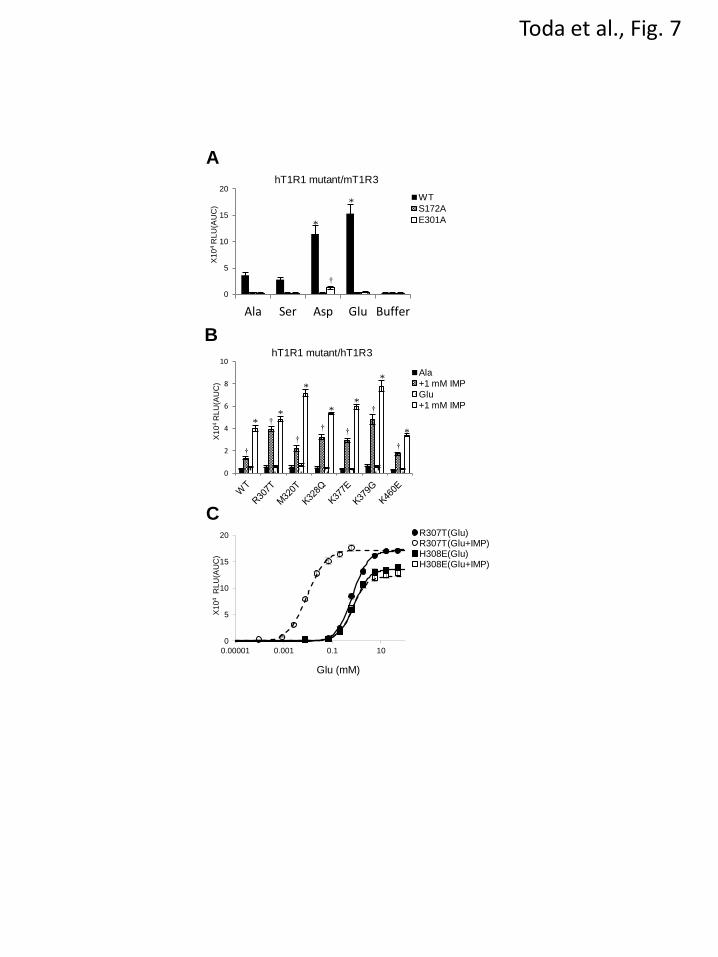
Toda et al., Fig. 7
A
B
C
0
5
10
15
20
0.00001 0.001 0.1 10
X1
04 R
LU
(AU
C)
Glu (mM)
R307T(Glu) R307T(Glu+IMP) H308E(Glu) H308E(Glu+IMP)
0
5
10
15
20
Ala Ser Asp Glu Buffer
X1
04 R
LU
(AU
C)
hT1R1 mutant/mT1R3
WT
S172A
E301A
*
*
†
0
2
4
6
8
10
X1
04 R
LU
(AU
C)
hT1R1 mutant/hT1R3
Ala
+1 mM IMP
Glu
+1 mM IMP
†
†
†
† †
†
†
* *
*
* *
*
*
by guest on April 14, 2018
http://ww
w.jbc.org/
Dow
nloaded from
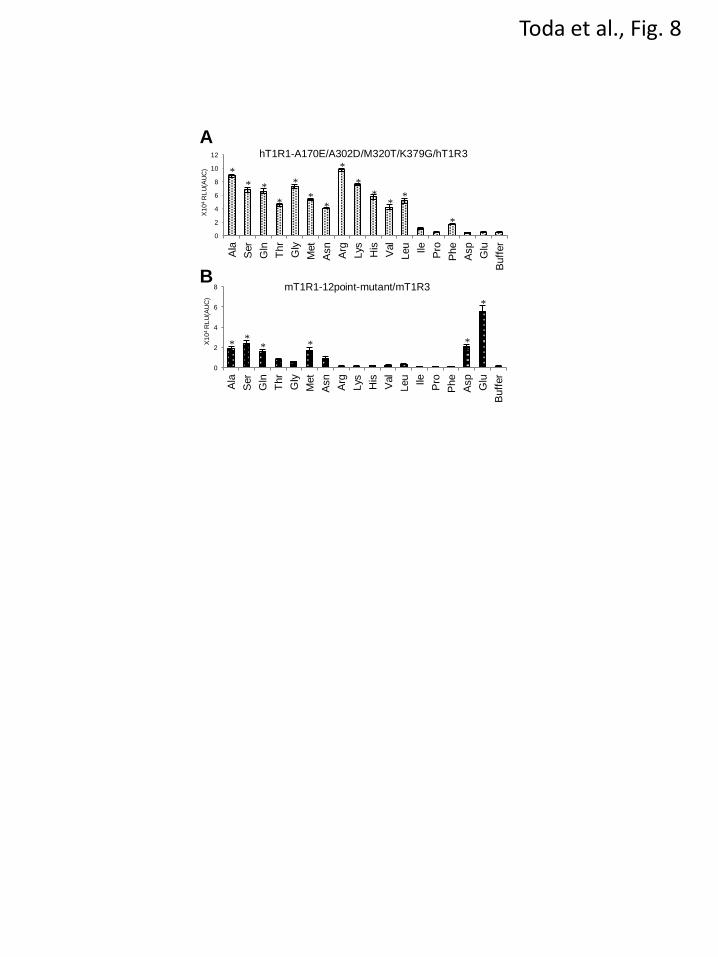
Toda et al., Fig. 8
B
A
0
2
4
6
8
10
12
Ala
Ser
Gln
Thr
Gly
Met
Asn
Arg
Lys
His
Val
Leu
Ile
Pro
Phe
Asp
Glu
Buff
er
X1
04 R
LU
(AU
C)
hT1R1-A170E/A302D/M320T/K379G/hT1R3
*
* *
*
*
* *
*
* *
* *
*
0
2
4
6
8
Ala
Ser
Gln
Thr
Gly
Met
Asn
Arg
Lys
His
Val
Leu
Ile
Pro
Phe
Asp
Glu
Buff
er
X1
04 R
LU
(AU
C)
mT1R1-12point-mutant/mT1R3
* *
* * *
*
by guest on April 14, 2018
http://ww
w.jbc.org/
Dow
nloaded from
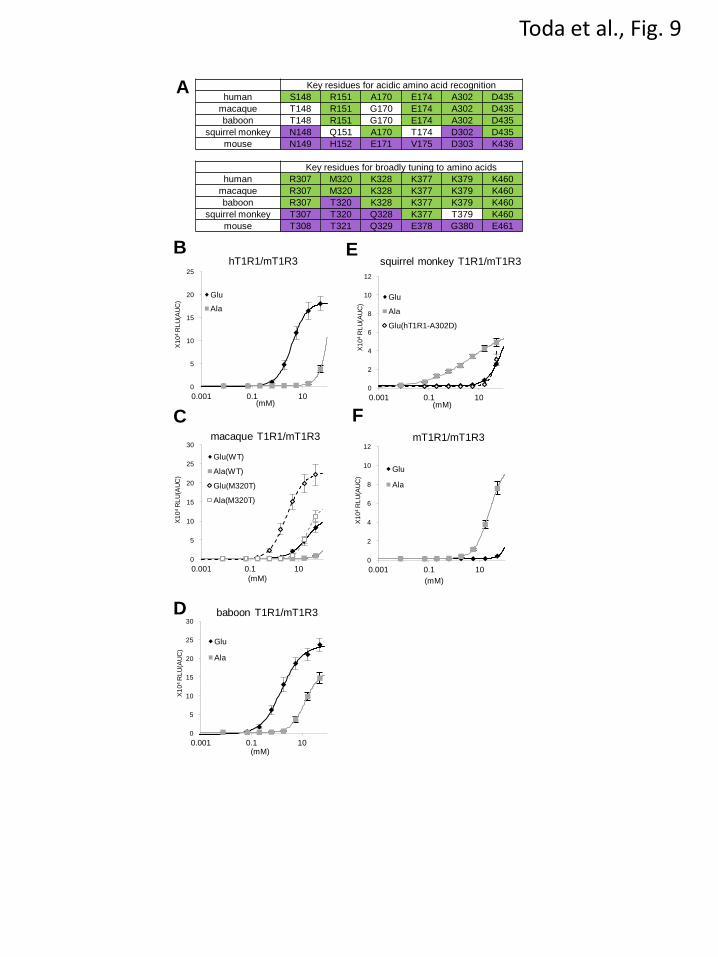
Toda et al., Fig. 9
E B
A
D
F
Key residues for acidic amino acid recognition
human S148 R151 A170 E174 A302 D435
macaque T148 R151 G170 E174 A302 D435
baboon T148 R151 G170 E174 A302 D435
squirrel monkey N148 Q151 A170 T174 D302 D435
mouse N149 H152 E171 V175 D303 K436
Key residues for broadly tuning to amino acids
human R307 M320 K328 K377 K379 K460
macaque R307 M320 K328 K377 K379 K460
baboon R307 T320 K328 K377 K379 K460
squirrel monkey T307 T320 Q328 K377 T379 K460
mouse T308 T321 Q329 E378 G380 E461
C
0
2
4
6
8
10
12
0.001 0.1 10
X1
04 R
LU
(AU
C)
(mM)
mT1R1/mT1R3
Glu
Ala
0
2
4
6
8
10
12
0.001 0.1 10
X1
04 R
LU
(AU
C)
(mM)
squirrel monkey T1R1/mT1R3
Glu
Ala
Glu(hT1R1-A302D)
0
5
10
15
20
25
0.001 0.1 10
X1
04 R
LU
(AU
C)
(mM)
hT1R1/mT1R3
Glu
Ala
0
5
10
15
20
25
30
0.001 0.1 10
X1
04 R
LU
(AU
C)
(mM)
macaque T1R1/mT1R3
Glu(WT)
Ala(WT)
Glu(M320T)
Ala(M320T)
0
5
10
15
20
25
30
0.001 0.1 10
X1
04 R
LU
(AU
C)
(mM)
baboon T1R1/mT1R3
Glu
Ala
by guest on April 14, 2018
http://ww
w.jbc.org/
Dow
nloaded from

Hiroo Imai, Yoshiro Ishimaru and Takumi MisakaYasuka Toda, Tomoya Nakagita, Takashi Hayakawa, Shinji Okada, Masataka Narukawa,
receptor)Two distinct determinants of ligand specificity in T1R1/T1R3 (the umami taste
published online November 8, 2013J. Biol. Chem.
10.1074/jbc.M113.494443Access the most updated version of this article at doi:
Alerts:
When a correction for this article is posted•
When this article is cited•
to choose from all of JBC's e-mail alertsClick here
by guest on April 14, 2018
http://ww
w.jbc.org/
Dow
nloaded from