two decades after the affirmative action ban: evaluating ... decades after the affirmative act ban:...
TRANSCRIPT
Two Decades After the Affirmative ActBan: Evaluating the University of California’s Race-Neutral Efforts
ion
William C. Kidder University of California, Riverside
Patricia Gándara The Civil Rights Project/Proyecto Derechos Civiles and UCLA
Graduate School of Education & Information Studies
October 2015

Copyright © Educational Testing Service. All Rights Reserved. ETS and the ETS logo are registered trademarks of Educational Testing Service (ETS). MEASURING
THE POWER OF LEARNING is a trademark of ETS. All other Educational Testing Service trademarks are property of their respective owners.

Evaluating UC’s Race-Neutral Effects i
Abstract
In this study, we examine the issues raised by the Supreme Court’s decision in the 2013
Fisher v. University of Texas at Austin case. The decision permitted affirmative action but
required colleges challenged by students claiming discrimination to show that they could
find no feasible way to achieve the needed diversity without considering race, among other
factors, in the admission process. For selective colleges and universities across the country,
the carefully considered study of the experiences of the University of California (UC) since
Proposition 209 prohibited affirmative action can help inform what the Fisher Court
described as “serious, good faith consideration of workable race-neutral alternatives.”
Moreover the Grutter Court’s guidance included that “universities in other states can and
should draw on the most promising aspects of these race-neutral alternatives as they
develop.” This paper provides a case study of the efforts and outcomes of the race-neutral
alternatives that were developed and implemented in the UC, the nation’s largest system of
research universities, in the wake of the loss of affirmative action. Operating in an extremely
diverse state, the UC has been very actively pursuing alternatives for nearly two decades
and invested a great deal of its scarce funds in these efforts in spite of cutbacks in overall
state funding. The study includes both campus-level enrollment outcomes, especially at the
UC Berkeley and UC Los Angeles (UCLA) campuses where the impact of Proposition 209
was felt most acutely, and the UC system activities and outcomes as a whole.
The UC and the state government reacted almost immediately to the affirmative action ban,
which had been strongly opposed by university leaders, with an array of race-neutral
alternatives, including outreach, partnerships with high minority schools, academic
preparation programs (some of which it invented), and targeted information and
recruitment efforts. Later it implemented a percent plan and invested heavily in
comprehensive review of vast numbers of applications. It modified admissions criteria and
gave special attention to low-income students. The state also came to operate one of the
most generous need-based financial aid programs in the country. The university has
implemented all of the major race-blind programs that have been shown to have potential
for increasing diversity, and private philanthropy has attempted to deal with the
shortcomings of those efforts with race-targeted funding.
In spite of high investments of both human and financial resources in many areas, the UC
has never recovered the same level of diversity that it had before the loss of affirmative
action nearly 20 years ago—a level that at the time was widely considered to be inadequate
to meet the needs of the state and its young people. It has never come close to a student
body representing the state’s population. The university’s efforts over two decades have
clearly fallen short, not only in undergraduate programs but in key professional schools,
particularly at the most competitive UC campuses, which are consistently ranked among the
world’s leading universities and that train leadership in many fields.

ii Evaluating UC’s Race-Neutral Effects
Acknowledgments
The views presented in this paper reflect Mr. Kidder’s perspectives as a researcher and do
not necessarily reflect the views of the University of California Riverside or University of
California administration. We thank Professor Gary Orfield, anonymous reviewers at ETS,
and scholars participating at a September 2013 ETS/CRP workshop in Washington, DC for
comments on earlier drafts of this paper.
Evaluating UC’s Race-Neutral Effects iii
Table of Contents
Setting the Context.......................................................................................................................... 1
Conceptual Framework: Fisher and Race-Neutral Alternatives .................................................. 2
Outreach and Academic Preparation Programs ........................................................................... 2
Academic Preparation Programs .............................................................................................. 6
Applications Have Soared After an Initial Collapse Among Underrepresented Minority
(URM) Students ........................................................................................................................ 13
A Widening Gap in Admissions Rates..................................................................................... 15
Have Enrollment Outcomes Recovered? ................................................................................ 17
Eligibility in Local Context (ELC): California’s Percent Plan Experience .................................22
Comprehensive Review: Holistic Review of Applications .................................................... 23
Changes in Standardized Test Requirements ........................................................................ 25
Community College Transfers: An Elusive Diversity Payoff? ....................................................26
University of California’s Need-Based Financial Aid Compared to Peer Universities ............27
University of California Financial Support, Price Sensitivity, and Recruitment of
Underrepresented Minority (URM) Students ........................................................................ 28
Critical Mass and Comparative Racial Climate ...........................................................................29
The Negative Impact at University of California Professional Schools ....................................29
How Lack of Faculty Affirmative Action Narrows the Pipeline to the Professoriate ......... 32
Why Class-Based Approaches Are Not Enough ..................................................................... 33
Conclusion .....................................................................................................................................33
References .....................................................................................................................................36
Appendix .......................................................................................................................................49
Notes ..............................................................................................................................................51


Evaluating UC’s Race-Neutral Effects 1
Setting the Context
In this paper we analyze the University of California (UC) as a case study and its various race-
neutral alternatives to affirmative action. Because California was the first state to adopt race-
blind alternatives in the face of the loss of affirmative action, it has the most extensive
experience and data on the results. In 1996 California voters passed Proposition 209 (Prop
209), a ballot initiative that prohibited affirmative action in university admissions, student
financial aid, and in state hiring as of 1998 (Cal. Const. art I. § 31). One year earlier, the UC
regents passed a special resolution (known as SP-1) prohibiting affirmative action within the
university.1 Both bans took effect at the undergraduate level in 1998. In this paper we simply
refer to Prop 209 except in cases where the regents’ ban took effect prior to the state ban
(Geiser, Ferri, & Kowarsky, 2000; Orfield, 1998).2
Many progressive legislators and other stakeholders were swift in denouncing the ban and
called for negative budget actions against the university in its wake (although the UC president
and all nine chancellors in the system opposed the policy the regents adopted). The new policy
was an apparent violation of the Organic Act, which established the UC in 1868, and stated:
. . . . it shall be the duty of the regents, according to population, to so apportion the
representation of students, when necessary, that all portions of the State shall enjoy
equal privilege therein. (Organic Act, 1868, Sec. 14)3
Clearly, all portions of the state were not enjoying equal privilege with respect to access to the
university and many believed the ban would exacerbate an already inequitable situation.4 Even
before the ban, there had been deep concern about the underrepresentation of Latino, African
American, and American Indian students in the state, which had led to a new admissions policy
only 7 years earlier in which the UC regents declared:
The University seeks to enroll, on each of its campuses, a student body that, beyond
meeting the University’s eligibility requirements, demonstrates high academic
achievement or exceptional personal talent, and that encompasses the broad diversity of
cultural, racial, geographic, and socioeconomic backgrounds characteristic of California.
(University of California [UC] Board of Regents, 1988, p. 1)
Gaining access to the UC for talented minorities is not just an issue of equity; the costs of not
attending a UC are high for both individuals and the state. It matters greatly where a student
attends college. Students who go to the less selective 4-year public campus have only about a
45% chance of completing a degree in 6 years compared to a UC-wide average completion rate
of 80%, and completion rate for UC Berkeley and UC Los Angeles (UCLA) between 88 and 90%
(California Postsecondary Education Commission, 2012). If students of color begin in a
community college, best estimates are that only about 17% will actually transfer to a 4-year
college and many fewer will receive a degree (Gándara, Alvarado, Driscoll, & Orfield, 2012).

2 Evaluating UC’s Race-Neutral Effects
Even controlling for prior grades and test scores, students who go to more selective schools
complete degrees at much higher rates than those who attend less selective institutions (Alon
& Tienda, 2005; Bowen & Bok, 1998).
It was therefore in this context that the UC undertook to address the limitations imposed on its
admissions process by Prop 209 with a series of race-neutral alternatives.
Conceptual Framework: Fisher and Race-Neutral Alternatives
In a 7-1 ruling in the Fisher v. University of Texas at Austin case (2013), the Supreme Court
accepted as given the Court’s existing precedents permitting affirmative action, including
Bakke (438 U.S. at 313, 1978), Gratz v. Bollinger (2003), and Grutter v. Bollinger (2003). The
Fisher majority then held that the lower court had erred by not correctly applying Grutter with
respect to the analysis of narrow tailoring—which refers to the university’s burden of proving
that the means it chose to attain diversity ensures that applicants are evaluated in an holistic
manner and that the consideration of race is the minimum necessary to achieve the
university’s goal of achieving the educational benefits of diversity.
Training leaders is an important goal of educational diversity. In Bakke, Justice Powell
emphasized that the “nation's future depends upon leaders trained through wide exposure' to
the ideas and mores of students as diverse as this Nation of many peoples” (539 U.S. at 324,
1978) and, moreover, the Grutter Court declared:
[U]niversities, and in particular, law schools, represent the training ground for a large
number of our Nation's leaders….In order to cultivate a set of leaders with legitimacy in
the eyes of the citizenry, it is necessary that the path to leadership be visibly open to
talented and qualified individuals of every race and ethnicity. All members of our
heterogeneous society must have confidence in the openness and integrity of the
educational institutions that provide this training. (539 U.S. at 332, 1978)
In California, with four major racial groups and rapid demographic change, severe racial
inequality, and intensely segregated and unequal public schools, this need has special urgency
(Orfield & Ee, 2014).
Outreach and Academic Preparation Programs
The UC regents’ July 1995 resolution banning affirmative action also required the UC to form a
task force to be composed of members of the business community, the university, other
segments of education, and organizations currently engaged in academic outreach to
recommend ways to increase the preparation and enrollment of educationally disadvantaged
students. The task force report, in 1997, laid out a four-pronged strategy to increase the
diversity of the university undergraduate population through outreach (University of
California Outreach Task Force, 1997, pp. 3–4). In order to increase diversity through race-

Evaluating UC’s Race-Neutral Effects 3
neutral means, the report recommended that UC: (a) expand the existing student centered
programs; (b) invest in new partnership programs that would bring 50 underperforming high
schools and their feeder schools into partnerships with local UC campuses to help strengthen
their academic offerings and effect whole school reform; (c) expand informational outreach;
and (d) create a research and evaluation team, composed in part of UC faculty, to oversee the
progress of the outreach efforts (Geiser et al., 2000).
A major expansion of outreach was immediately instituted, with the university doubling its
outreach expenditures from $60 million annually to $120 million (Karabel, 1998). The
objective was to work directly with the high schools that served high percentages of
underrepresented minority (URM) students in order to double the numbers of eligible URM
students. The search for alternatives had strong political support. Under legislative pressure
the UC proposed to redouble its efforts in outreach to gain back lost ground (Gándara, 2005).
At the programs’ height in 1999–2000, expenditures on outreach from both state and
university funds were in the range of $110 million (in 2011 constant dollars). However, this
level of funding would be short-lived. (See Figure 1.) This funding dynamic underlies what one
of us has called the politics of forgetting that surrounds the erosion in state financial
contributions post-Prop 209 to UC’s academic preparation and outreach programs for
disadvantaged K-12 youth in California (Gándara, 2005 ). In inflation-adjusted dollars, the
State of California’s overall contribution to UC (on a per-student basis) plummeted by more
than half since 1990—from $18,040 per student in 1990–1991, to $13,870 per student at the
time of SP-1 and Prop 209 (1995–1996) and only $8,280 per student in 2014–2015 (UC Board
of Regents, 2014). This is a characteristic pattern in the United States and creates a limit
regarding the feasibility of funding extensive race-neutral alternatives.5 As this study shows,
there is a high cost to recruiting and preparing even a small fraction of potentially eligible
students and universities cannot rely on their state legislatures to continue supporting these
efforts when state resources are constrained.
Expenditures on academic preparation programs came to over $61 million in 2014–2015 at
the UC (University of California Office of the President [UCOP], Diversity and Engagement,
2015), a significant amount of money, yet only slightly more than half the level of spending
compared to 2000 when all funds were provided by the state general fund and the university.
Over the last decade many of the nation’s most prestigious public universities have faced
similar, and even worse, reductions in state funding. This is a cautionary note for any
institution depending on state funding for its diversity efforts and a major barrier to the
feasibility of substantially expanding programs.

4 Evaluating UC’s Race-Neutral Effects
Figure 1. University of California Student Academic Preparation and Educational Partnerships (SAPEP), state and university budgeted funds in 1996–1997 to 2012–2013 (in constant 2011 dollars).
Some notable aspects of the strategies recommended by the task force in 1997 included
increasing informational outreach, a problem that was well documented in the final report of
the UC Latino Eligibility Task Force (1997), as a result of a survey that found a gross lack of
information in the Latino community about how to apply and pay for a UC education, a
problem that continues to this day. The task force report also recommended working with 50
underperforming schools (and their feeders), which meant effectively working with fewer than
5% of the state’s high schools—a small drop in a big bucket of underperforming schools.
Finally, while these recommendations were referred to as outreach efforts, suggesting a need
to simply establish better contact with diverse communities, it became increasingly apparent
educated in California schools would require far more than outreach. In 2005, the Academic
Outreach Program was renamed the Student Academic Preparation and Educational
Partnership (SAPEP) reflecting the goal of attempting to equalize some of the vast disparities
in academic preparation that are experienced by low income and underrepresented students
in California.
The challenge of preparing African American and Latino students for a highly competitive
admission process when they are so unequally distributed across the state’s schools is evident
from viewing Figure 2. Here we show the racial and ethnic distribution of students by deciles
on the state’s academic performance index (API), the accountability measure that ranks all
schools in the state according to student achievement test scores from lowest (1st decile) to
highest (10th decile).

Evaluating UC’s Race-Neutral Effects 5
While two thirds of all Latino and African American students are found in the lowest
performing half of the state’s schools, a much smaller percentage of White and Asian American
students attend these schools, and those Asian Americans who are in the lower performing
schools tend to be low-income Southeast Asians (Orfield, Kucsera, & Siegel-Hawley, 2012). The
more shocking story, however, is told in the percentage of each group found in the top-most
decile—the very highest performing schools in the state. These are the schools that prepare
the bulk of incoming UC students. Here is where one third of all Asian American students are
found and one in five of all White students. Yet barely 3% and 4% of Latinos and African
Americans are in these schools. A number of studies have documented school segregation
patterns in California (e.g., Orfield et al., 2012) and the related challenges unequal K-12
educational opportunities pose for UC and other higher education enrollment (Bonous-
Hammarth, 2012; Martin, Karabel, & Jaquez, 2005). Thus the SAPEP programs are effectively
charged with addressing the enormous disparities in academic preparation that URM students
receive prior to applying to college.
Figure 2. Distribution of racial/ethnic groups among California’s K-12 public schools by API decile, 2011–2012.
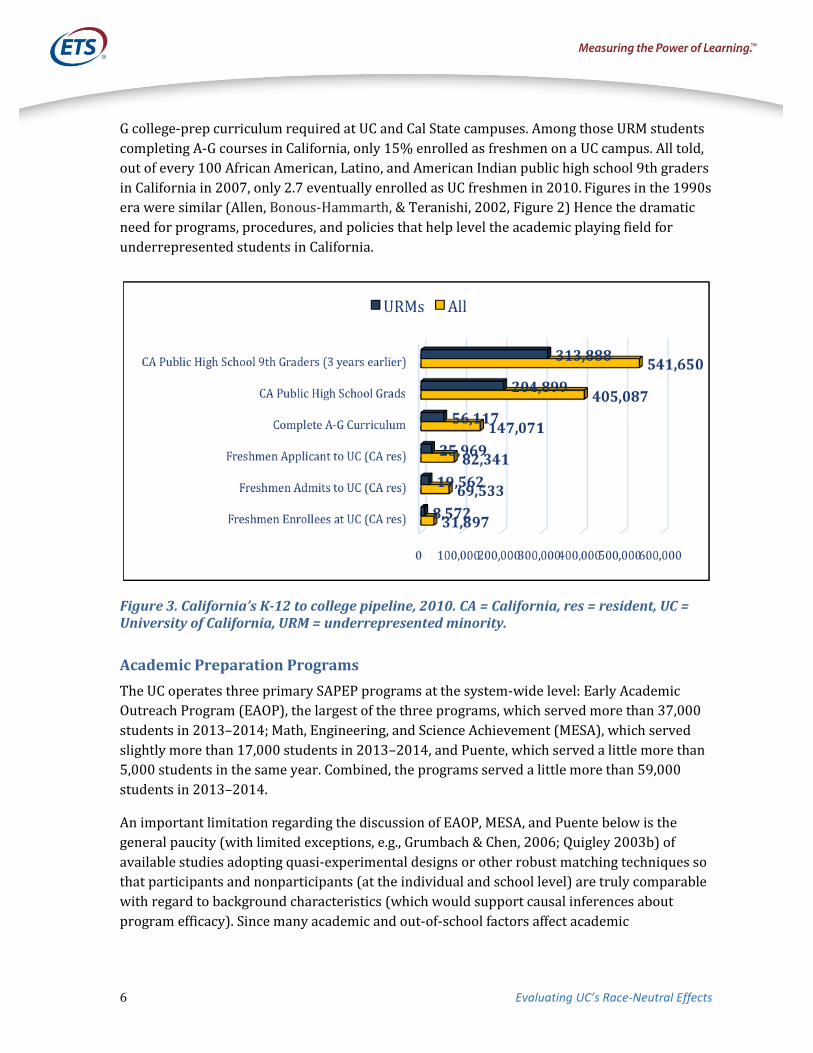
Figure 3 illustrates the profound magnitude of the educational pipeline challenge in California,
particularly for underrepresented minorities. Out of a base of nearly 314,000 URM public high
school 9th graders, less than two thirds graduated from California high schools in 2010, and
among those URM students who did graduate from high school only 27% had completed the A-
6 Evaluating UC’s Race-Neutral Effects
G college-prep curriculum required at UC and Cal State campuses. Among those URM students
completing A-G courses in California, only 15% enrolled as freshmen on a UC campus. All told,
out of every 100 African American, Latino, and American Indian public high school 9th graders
in California in 2007, only 2.7 eventually enrolled as UC freshmen in 2010. Figures in the 1990s
era were similar (Allen, Bonous-Hammarth, & Teranishi, 2002, Figure 2) Hence the dramatic
need for programs, procedures, and policies that help level the academic playing field for
underrepresented students in California.
Figure 3. California’s K-12 to college pipeline, 2010. CA = California, res = resident, UC = University of California, URM = underrepresented minority.
Academic Preparation Programs
The UC operates three primary SAPEP programs at the system-wide level: Early Academic
Outreach Program (EAOP), the largest of the three programs, which served more than 37,000
students in 2013–2014; Math, Engineering, and Science Achievement (MESA), which served
slightly more than 17,000 students in 2013–2014, and Puente, which served a little more than
5,000 students in the same year. Combined, the programs served a little more than 59,000
students in 2013–2014.
An important limitation regarding the discussion of EAOP, MESA, and Puente below is the
general paucity (with limited exceptions, e.g., Grumbach & Chen, 2006; Quigley 2003b) of
available studies adopting quasi-experimental designs or other robust matching techniques so
that participants and nonparticipants (at the individual and school level) are truly comparable
with regard to background characteristics (which would support causal inferences about
program efficacy). Since many academic and out-of-school factors affect academic

Evaluating UC’s Race-Neutral Effects 7
performance and students often experience more than one intervention, such research is
extremely complicated and very expensive to conduct; it is rare that funders are willing to
support such studies, especially in the face of inadequate funds to deliver the program.
Early Academic Outreach Program
EAOP was established in 1976 to help underrepresented students navigate the college-going
process and better prepare for postsecondary education; it has a presence at all of the 10 UC
campuses and currently partners with 194 schools, approximately half middle schools and half
high schools. EAOP focuses on four broad program areas—academic advising, academic
enrichment (e.g., tutoring, summer classes), college entrance exams (e.g., orientation and
preparation programs), and college knowledge (e.g., informational workshops and programs
geared to parents). All campuses provide academic advising and most campuses provide some
form of the other three program areas, though the nature and content of these programs varies
by campus. Given that California has one of the highest K-12 student to counselor ratios in the
nation—approximately one counselor for every 800 students (Frey, 2012)—and that too few
of these counselors actually have any knowledge of college counseling (McDonough, 2005;
Oakes et al., 2006), this advising function fills a critical void in the schools that are served.
Nonetheless, no more than 8% of the high schools in the state are touched by EAOP and that
number is declining. Over the 5 years from 2007–2008 to 2011–2012, the number of EAOP
partner schools statewide decreased by over 40%, and the number of students served
decreased by nearly 30%, from 43,000 to about 30,000 (Caspary, Bland, Aladjem, Miller, &
Biscocho, 2013), although the university reported an increase in students served in 2013–
2014, to 35,000, as the state’s economy began to pick up (UCOP, Institutional Research and
Academic Planning, 2015). Nonetheless, EAOP has had to cut back on the suite of services
provided and the amount of time that staff have to work with students.
EAOP recruits students somewhat differently at each campus, but overall the emphasis is on
recruiting students who are on track to be eligible for admission to the UC. Most of these
students will not ultimately enroll at a UC campus, but most students in the program will be
performing well (average of 3.2 GPA) in school (UCOP, Institutional Research and Academic
Planning, 2015). The program has shied away from taking on students who are performing at
levels that would not qualify them for 4-year college admission in an attempt to focus its
limited resources on those students who are most likely to become eligible. Thus, EAOP
students are different from the average California high school graduate.
The most recent external evaluation of EAOP shows that the program is meeting most of its
goals and may have an impact on completion of college preparatory courses, college-entrance
exam taking, and most importantly matriculation in college compared to non-EAOP students
with similar grades and students statewide (Caspary et al., 2013). While this study attempted
to match EAOP students with non-EAOP students in the same schools that had similar 9th-
grade course-taking patterns and grades overall and in college preparatory courses, and also

8 Evaluating UC’s Race-Neutral Effects
matched to similar students at non-EAOP schools (see the appendix), there are limits to these
approaches because the groups can potentially be dissimilar in unmeasured characteristics
such as motivation (see also Quigley, 2003a). Because students that are selected for the
program tend to be the neediest and can differ in important ways from all students, the
evaluation was not able to determine with certainty what the specific impact of EAOP was on
its participants. However, EAOP has experienced a modest increase in its success in getting
students to enroll in postsecondary institutions since its baseline year 2004–2005 when 67%
of participants matriculated to college. In 2014, 69% of EAOP students entered a state 2- or 4-
year college after graduating high school (UCOP, Institutional Research and Academic
Planning, 2015). Of course, it is important to note that most EAOP students are selected on the
basis of meeting fairly high standards of academic achievement prior to being enrolled in the
program. Current estimated per-student costs of the EAOP program are $197 (UCOP,
Institutional Research and Academic Planning, 2015).
Mathematics, Engineering, Science Achievement (MESA)
MESA, like EAOP, seeks to help students prepare to go to college, but with a special emphasis in
math/science. MESA first began in California but has expanded to separately run MESA
programs in eight states, mostly in the west (Contreras, 2011). MESA has seen a significant
decline in the students it is able to serve, from more than 20,000 in 2012 to just over 17,000 in
2013–2014 (UCOP, Institutional Research and Academic Planning, 2015). Five UC campuses
currently participate in MESA and the UC Office of the President hosts the statewide MESA
office. The numbers of students served and the types of services provided vary widely across
the school programs, but in order to be selected for the program, MESA students should show
an aptitude and interest in science and mathematics. One third of its participants are not
underrepresented students, and participants tend to come from a wider range of schools than
EAOP, including some high performing schools with lower percentages of underrepresented
students UCOP (2013). There has been no recent external evaluation of the MESA program, so
outcomes for MESA are limited to a tracking of the goals that the program has set out for itself
in coordination with the SAPEP framework and UC’s reporting to the California legislature.
In collaboration with industry partners, MESA provides rigorous academic development that
includes mathematics and science curriculum based on the California mathematics and science
standards as well as individualized academic planning, study-skills training, career
exploration, parent involvement, and professional development for mathematics and science
teachers. It sponsors statewide competitions and closely monitors students’ course taking and
preparation for college. MESA, too, has experienced budget cuts over the last decade but has
continued to meet most of its goals and reports strong program outcomes. For example, while
the program has a goal that 67% of 10th graders in the program will have successfully
completed Algebra 1, in 2014, 92% had completed this course. Similarly, the baseline (at
2004–2005) percentage of 12th grade completers among MESA students with all required
college preparatory courses was 54% but by 2014 that percentage had risen to 77% (UCOP,

Evaluating UC’s Race-Neutral Effects 9
Institutional Research and Academic Planning, 2015). MESA students have a level of
completion of the required courses for university admission twice the statewide average for all
students (California Department of Education, 2014), but it must be kept in mind that
participants are carefully selected to be on track for science technology, engineering, and
mathematics (STEM) enrollment in college and outcomes are reported for those students who
are still in the program in Grade 12. That is, students who have fallen by the wayside are not
counted in these numbers.
MESA reports that 72% of its participants in 2013–2014 went directly to college after high
school graduation, and it has the highest percentage of students in all the SAPEP who
matriculate into the UC, about 23% (UCOP, 2015, Figure 10).6 Of MESA high school graduates,
53% chose STEM college majors in 2012, the last year for which we have these data.7 The UC
Office of the President has calculated the per-student cost of MESA to be $141 (UCOP,
Institutional Research and Academic Planning, 2015).
MESA also operates a relatively small community college program, which operates in 34
community colleges and targets STEM majors and helps them to transfer to 4-year colleges and
universities. Of the more than 4,300 students served by the program, 726 transferred to a 4-
year college or university in 2012, almost half (45%) to the UC (and 46% to Cal State) and
virtually all transferred as math/science/engineering majors.
Puente
Puente actually operates two programs: the high school program serves 34 high schools and
about 5,000 students in California and the community college program serves 62 community
colleges (more than half of the state’s 112 community colleges) and almost 8,000 students. The
program, first established in 1981 at the community college level expanded to high schools in
1983, using the same basic model. Puente focuses on English language arts skills, particularly
reading comprehension and writing—two skills that were identified by its creators as key to
college success, but often underdeveloped in Latino students. It also incorporates a strong
counseling component. Puente originally targeted Latino students but with the passage of Prop
209 in California was required to open the program to all students. Still upwards of 80% of the
enrollees are Latinos as the program also focuses on Latino literature and local cultural
resources in its curriculum. Puente also assigns a specific counselor to its cohorts of students,
and the counseling component is equally important as the classroom instruction. Puente
consciously selects its participants from a broad range of achievement levels, operating on the
philosophy that the weaker students will be brought up by the stronger ones. It only asks that
counselors select students who demonstrate a real desire to go college. Of course, since
students are selected independently at each individual site, it is difficult to know how
stringently the criteria for acceptance are adhered to.

10 Evaluating UC’s Race-Neutral Effects
The high school Puente program was evaluated between 1994 and 1998 in an attempt to
ascertain if the community college model was, in fact, transferrable to the high school setting
and if Puente students would outperform similar students who had not been enrolled in the
program with respect to college going. This study found that Puente effectively doubled the
college going rate for its participants compared to a matched group of students from the same
schools; however, potential sampling bias and small sample size also limit the firm conclusions
that can be drawn from this study (Gándara, 2002).8
In 2014 Puente reported that 69% of its approximately 1,000 high school graduates went on to
a 4-year college. (Approximately 25% to CSU, 10% to UC, and nearly 30% to the community
colleges. The balance went to private/out of state colleges (UCOP, 2015.) Puente also met all its
target goals with respect to ensuring students took the necessary college preparatory courses
and entrance exams. The enrollment rates to UC for Puente high school participants have been
generally consistent in the years since 2005 (10–12%). For community college students,
Puente argues that it strengthens notoriously low persistence rates in community college, with
83% of Puente students continuing after 1 year in the program, compared to 71% who were
nonparticipants, as reported by the state’s community college system. In 2012, 418 Puente
students transferred to 4-year colleges.9 State officials were unable to provide any information
on the race of these students. The Office of the UC President puts the annual cost of Puente at
about $157 per student (Blumenstyk, 2015).
Other Student Academic Preparation and Education Partnership Programs (SAPEP)10
There are several other smaller programs that operate under the auspices of the UC and that it
considers in its SAPEP family. Declining state general funds for SAPEP programs means that
the ensemble of smaller programs receiving funding has evolved considerably over the last
decade or so.11 Fifteen programs are listed under SAPEP, and these programs provide various
services but do not directly assist high school or community college students in matriculating
to the UC. These additional programs also include Student Initiated Programs (SIP) in which
UC students work with K-12 students in a variety of ways, including academic workshops,
campus tours, and tutoring; online courses; after-school programs; and school partnership
activities. About $6 million is spent annually on SIP across the 10 UC campuses. In sum, all of
the SAPEP programs endeavor to help students prepare for postsecondary or graduate
education, but it is impossible to know how many of those students ever find their way into the
UC, or if the program played any significant role in the cases where students did successfully
matriculate into a UC school. It is also worth noting that trying to disentangle the particular
effects of any of the SAPEP programs on student outcomes is especially challenging. Because of
the way the programs are structured, random assignment of students is rarely possible or
desirable, and it is difficult if not impossible to determine what other influences or
interventions the nonparticipant control students may have experienced.

Evaluating UC’s Race-Neutral Effects 11
Issues in Assessing Costs and Benefits of Student Academic Preparation and Educational Partnerships (SAPEP)
A persistent problem with data collection on intervention programs nationally—and UC
programs are not an exception—is the lack of consistent data on dosage, or how much of the
program any individual student SAPEP receives (Gándara & Bial, 2001). Thus, numbers of
students reported as served do not tell us just how much of the intervention the students were
exposed to or how much staff time or other resources were dedicated to each of the
participants or how much intervention is optimal within a range of program and fiscal
constraints (i.e., the dose response curve). Likewise, per-student costs of programs that are
calculated with the total number of participants as the denominator may actually
underestimate real costs if some portion of those students does not actually utilize many of the
resources or does so for a very short period of time. Additionally, many programs rely on in-
kind and other partner resources, such as contributions from the schools and colleges that are
served by these programs and federal grants that are not calculated into the program costs.
Thus, per-student cost figures cited should be considered to be a lower bound.
It is also notable that with the decline in resources over the years, the per-student costs have
also declined, reflecting a declining dosage of the interventions. While the college-going yield
has remained relatively stable over this period of resource decline, it is not known in what
ways the contraction of resources has affected the longer term outcomes for students, the
selection of participants, or the viability of programs. Getting any definitive answers to these
questions would involve huge experiments carried out over years and controlling many other
aspects of student experiences. No institution has the resources or the desire to run such
programs as experiments, giving them to some randomly and denying them to many others
who are otherwise similar. What we see is a combination of practical judgment and the
realities of university budgets and state policies.
Because the UC is not allowed by Prop 209 to target underrepresented students through its
SAPEP programs, it must cast a wider net. There is, of course, a certain irony in the fact that the
programs were developed primarily to increase the diversity of the university, but it is not
allowed to target the most underrepresented students.12 Nonetheless, research over time has
shown that by targeting the lowest performing schools in the state, due to segregation patterns
and clustering of disadvantage, one is to some extent able to capture students
disproportionately from the most underrepresented groups. But these are rarely the schools
that serve the students of color most likely to succeed at, or go to, UC. And there are particular
challenges surrounding the use of race-neutral targeting factors for Native American students
for reasons related to their geographic dispersion.13 In the EAOP, MESA and Puente programs
combined, during 2011–2012 only 0.59% of students served were Native American, slightly
below the proportion of Native Americans among public high school graduates in California
(UCOP, Budget and Capital Resources, 2013). As the Court noted in Fisher, a consideration with
evaluating race-neutral alternatives is whether such means can be implemented at a “tolerable
12 Evaluating UC’s Race-Neutral Effects
administrative expense” (Wygant v. Jackson Bd. of Ed., 1986, as quoted by Fisher v. University of
Texas at Austin, 2013, p. 11). From the perspective of evaluating race-neutral alternatives in
terms of efficacy in increasing the share of students of color enrollment and bang for the buck,
SAPAEP programs are not an efficient enough way to increase African American, Latino, and
Native American student representation notwithstanding the fact that these programs’ goals
are valuable for their own sake.
Because the university cannot directly target students but only schools, many of the students
who find their way into the programs are not underrepresented minorities, though this varies
greatly by program and UC campus. For example, nearly one third of participants in the MESA
program statewide are not underrepresented students, and only half of the nearly 2,400
students in UC Berkeley’s EAOP program are underrepresented (personal communication,
UCOP, August 2013). For EAOP, almost one fourth (23%) of participants are not URM; Puente
has the highest representation of URM students, with 87% in 2013–2014. Still, some 12% are
not URM students (UCOP, 2015). Moreover, most students served by the university through its
SAPEP programs will not apply to or enroll in the UC (enrollment rates to UC in 2011–2012
ranged from 10% to 23% for Puente, EAOP, and MESA and it is not known what percentage of
these were URM students). In fact, most students served by the university’s SAPEP will attend
California community colleges where studies have shown that they are significantly less likely
to obtain a BA degree (Gándara et al., 2012). Targeting segregated and impoverished schools
that offer more limited opportunities on many dimensions means targeting students who are
most likely to need intensive academic and financial support and least likely to be prepared for
the challenges and costs at UC.
By implication, even though there is decent evidence that SAPEP programs are effective, it is
also the case that SAPEP programs do not represent a satisfactory race-neutral alternative to
affirmative action. Best estimates are that they touch less than 10% of the students who need
or could profit from the programs and that the race-neutral selection mechanisms have
required that programs serve many students who, for a variety of reasons, are not candidates
for UC. Changing the mammoth scale of the higher education pipeline predicament in
California—with the Golden State ranking 48th or 49th among the states in the proportion of
high school graduates who enroll as freshmen at 4-year colleges and universities—would
require massive efforts (M. Brown et al., 2006; Geiser & Atkinson, 2013). Such efforts are
clearly beyond the scope of any single institution.
The big three SAPEP programs—EAOP, MESA, and Puente—track specific numbers of
students who enroll in postsecondary education directly from their high schools and the
percentage of these that enroll in the UC system. EAOP estimates that about 1,050, or 17%, of
graduating seniors who participated in EAOP in 2012 enrolled in a UC school; MESA estimates
that 418, or 23%, of its graduating seniors found a place at a UC campus, and Puente reports
that 95, or about 10%, of their graduating seniors entered a UC school in 2012. That is about
1,560 entering freshmen, and it includes some unknown number of non-URM students.
Evaluating UC’s Race-Neutral Effects 13
Moreover, some undetermined subset of these students presumably still would have enrolled
at UC without SAPEP.14 These are extremely modest totals relative to the almost 39,000
freshmen who enrolled in UC schools in 2012 (see UCOP, Institutional Research and Academic
Planning, 2015).
Many students who participate in these programs testify to the programs’ powerful impact,
and there is little doubt that they play a very important role in the lives of many students.
However, the impact of these programs on the diversity of the freshman class across the UC
system is harshly limited by larger realities in California’s educational pipeline. Without these
programs, the situation in the state’s selective campuses would no doubt be even worse.
One of the tendencies in race-neutral programs, unsurprisingly, is a greatly diminished focus
on race because it cannot be considered in admission. Increasing shares of students, mostly
White, simply refuse to state their race in official papers, and the programs do not tend to
report, or sometimes even to keep track of, their impacts by race. Ultimately such trends could
mean that programs designed to use race-neutral means to achieve the goal of racial diversity
become so unfocused that it will be difficult or impossible to know their impact or to improve
what is already an inefficient, complex, and costly way to pursue that goal. Ultimately a
program created to be a nonracial way to achieve diversity is undermined by the view that
considering race in any way is illegitimate and can simply become a program in which no one
keeps track of race. To some extent, this appears to be the case in the UC, as no one appears to
be keeping track of the race or ethnicity of SAPEP participants who go on to college. It is simply
not known if the programs are disproportionately sending students onto UC who are from
non-URM backgrounds, thus further advantaging the advantaged. It is hard to have a nonracial
solution to a racial problem that starts with the policy that it is illegal to consider race as part
of the process in selecting students. The many programs the UC has operated clearly have had
this as the original goal, but the focus and accountability for attaining that goal have evidently
diminished over time.
Applications Have Soared After an Initial Collapse Among Underrepresented Minority (URM) Students
The research literature tends to find, though not unequivocally, that affirmative action bans
decrease application patterns of underrepresented minorities. Two studies focusing on UC in
the years immediately after Prop 209 reached divergent conclusions, with Long (2004) finding
there was a decline in application rates while Card and Krueger (2005) finding application
patterns among high-credential URM students to be unchanged. Those two studies, while in
respected journals, may be limited by reliance upon proxy data (data on where SAT scores
were sent) instead of actual applications. The UC Outreach Task Force commissioned focus
group research on college-bound high school seniors shortly after the UC regents’ 1995 SP-1
resolution banning affirmative action and found that some URM students did not apply to UC
because they perceived the ban as a signal they were no longer welcome at the university

14 Evaluating UC’s Race-Neutral Effects
(Gándara, 2012; Geiser et al., 2000). Two other studies found that affirmative action bans
depressed URM students’ applications in Texas (Dickson, 2006) and in Washington (S. K.
Brown & Hirschman, 2006). Consistent with earlier scholarship in the late-1990s about chilling
effects (i.e., dampening of students’ motivation to apply to institutions such as UC; Finnel, 1998;
Karabel, 1998; Orfield, 1998), immediately after the bans were enacted but had not taken
effect between 1995 and 1997 freshman applications to the UC system declined for African
Americans (-7%), American Indians (-22%), Chicanos (-6%), and other Latinos (-5%) at the
same time there were application increases for Whites (+13%) and Asian Americans (+11%;
UCOP, 2014). At six of the eight UC campuses (including UC Berkeley and UCLA), there were
what one might term anticipatory chilling effects in terms of relative freshmen application
declines for underrepresented minorities in 1997 compared to a baseline of 1995.
Across this 17-year span (Figure 4), the first years after Prop 209 took effect (1998 and 1999)
brought the nadir in terms of African Americans’ proportion of the freshman applicants across
the UC system. At UC applicant proportions of African American students returned to 1995
(pre-209 and SP-1) levels. We believe these findings for African Americans are consistent with
the chilling effect phenomenon documented in several studies. Chang and Rose (2010) have
emphasized that URM applications to UC grew faster than non-URM applications in the decade
after Prop 209; however, this is more likely a product of the surging proportion of Latino high
school graduates and the declining proportion of White high school graduates in California
(Marin & Yun, 2011).
Figure 4. Proportion of African Americans: California public high school graduates and freshmen applicants (California residents) the University of California (UC) system, University of California Berkeley (USB), and University of California Los Angles (UCLA), 1995 to 2014.

Evaluating UC’s Race-Neutral Effects 15
Since the mid-1990s, all UC campuses have had rather dramatic increases in freshmen
applications (see the appendix for trends on each UC campus between 1995 and 2012). A
portion of these increases are attributable to the fact that UC applications per resident have
increased in part due to the ease of the online application. It is now very easy to apply to
multiple campuses. UCLA currently receives more freshmen applications than any college or
university in America. UC Riverside was described only a few years ago as nonselective and a
safety net school (Chacón, 2008, p. 1227), yet because of the rise in applications and selectivity,
by 2012 UC Riverside denied freshmen admission to approximately 10,800 California
residents, close to the number rejected at the most selective campus, UC Berkeley, back in
1995 (11,700) on the eve of the affirmative action ban.15 The rising California population and
the failure to build more UC campuses16 or to expand enrollment substantially has created
enormous admissions competition.
A Widening Gap in Admissions Rates
Across 16 years, for the UC system as a whole, the nadir (3.2%) in terms of African Americans’
proportion of the freshman offered admission came in the first years of the ban. At UC Berkeley
and UCLA there were dramatic declines of 55% in admission offers to African Americans
between the pre-209 baseline of 1995 and 1998 when Prop 209 was implemented (Gándara,
2012; Grodsky & Kurlaender, 2010). The low point for UC Berkeley was 2004 (2.8%)—the
earlier chart also shows African American applications dipped in 2004, too—which may have
been partly related to chilling effects stemming from the then-UC regents chairman’s intense
public criticism of UC Berkeley’s admissions policy (Kidder, Serrano, & Ancheta, 2004).
For UCLA, the post-209 low point was reached in 2006, when the campus actually had the
fewest African American incoming freshmen of any year since the early 1970s (Marin & Yun,
2011, p. 133; UC Study Group on University Diversity, 2007, p. 35).
As a consequence of its discouraging outcomes in admissions, in 2007 UCLA adopted a more
holistic approach to comprehensive review, that is, the admissions process began to take into
account the greater context in which students were prepared—or not—for the university.
The fact that UC Berkeley (which already employed holistic review) had slightly better
African American admission numbers than UCLA for 8 years (1999 to 2006) and that UCLA
and UC Berkeley then had near-identical results in the years since 2007 (see Figure 5)
provides natural experiment evidence that holistic review can make a modest positive
contribution to diversity relative to other options that rely on a more formulaic use of test
scores, grades, and other factors. This is not the same, however, as concluding that holistic
admissions is a sufficient race-neutral alternative. Indeed, the data show that even all these
years later and despite many robust efforts, at UC Berkeley and UCLA the proportion of
California resident African Americans given freshmen offers of admission in 2011 was still
46% lower than 1995 levels.

16 Evaluating UC’s Race-Neutral Effects
Figure 5. Proportion of African American students: California public high school graduates and freshmen admits (California residents) to the University of California (UC) system, University of California Berkeley (USB), and University of California Los Angles (UCLA), 1995 to 2014.17
The results for Latinos reveal some commonalities and some differences as compared to the
patterns for African Americans. Figure 6 displays the percentage of Latinos among California
public high school graduates and among freshmen admits to the UC system, UC Berkeley, and
UCLA. The first year under Prop 209, 1998, marked the low point in Latino freshmen
admission offers to the UC system (12.9%), UC Berkeley (8.5%), and UCLA (10.9%). Compared
to the pre-209 baseline of 1995, by 1998 Latino admissions dropped 54% at UC Berkeley and
by 46% at UCLA. Moreover, over the decade-and-a-half since Prop 209 Latino freshmen
admission chances at UC Berkeley and UCLA were still below 1995 levels and only eclipsed
1995 levels in 2014.
For the UC system as a whole the decline in Latino admissions between 1995 and 1998 was
more modest (an 18% drop) and Latino representation returned to 1995 levels a decade later
(2004). However, this gradual rise in Latino freshmen admissions on several UC campuses
must be evaluated against the backdrop of California’s distinctive and rapidly changing
demography. While advocates of affirmative action bans have used Latino numbers as proof of
the efficacy of race-neutral alternatives,18 such conclusions are spurious once one properly
accounts for the profound growth in California’s pool of Latino high school graduates as the
demography of the state rapidly changed (Gándara, 2012; Kidder, 2013a). Actually, the
magnitude of the gap between Latinos’ proportion of public high school graduates and UC
freshmen admission offers in 1995 was -14.2 points (30.0% versus 15.8%) and widened to -
23.9 points (48.3% versus 24.4%) by 2014, including nonresident enrollees—an increasing

Evaluating UC’s Race-Neutral Effects 17
phenomenon at the most competitive campuses. In fact, the gap has become a chasm. In a brief
submitted by the university’s leaders in 2013, the officials noted that
. . . from 1995 to 2012, the percentage of public high school graduates who were Latino
jumped from 30.0 to 46.2%. In other words, the growth in the number of Latino
students, while substantial, is still far lower than one would expect based on the
number of Latino high school graduates in California (Brief of University of California
President and Chancellors, 2013, p. 22).
This, of course, is more true than ever in 2015.
Figure 6. Proportion of Latinos: California public high school graduates and freshman admits (California residents) to the University of California (UC) system, University of
California Berkeley (USB), and University of California Los Angles (UCLA), 1995 to 2011.19
Have Enrollment Outcomes Recovered?20
Figure 7 provides incoming freshmen enrollment proportions for African Americans, American
Indians, and Latinos for each of the UC general campuses at intervals between 1995 and 2012.
The data we present are descriptive statistics, not a causal model extracting the impact of Prop
209 from other concomitant trends at UC and nationwide. A couple of introductory points are
worthy of mention prior to analysis of the UC campus enrollment outcomes.
First, the gradual rise in Latino freshmen admissions and enrollments evident on several UC
campuses must be understood in the context of robust growth in California’s pool of Latino
high school graduates, increasing from 31% of graduates in 1998 when Prop 209 first took
effect to over 48% by 2014 (Gándara, 2012; Kidder, 2013a). California has now reached a

18 Evaluating UC’s Race-Neutral Effects
watershed moment: Within the next few years Latinos are expected to comprise the majority
of graduates coming out of California public high schools. Access must be judged in
relationship to the state’s changing population.
Figure 7. Underrepresented minority freshman enrollment at eight University of
California (UC) campuses, 1995 to 2012 (note scale differences between UC campuses). Data from UCOP (n.d., 2013).

Evaluating UC’s Race-Neutral Effects 19
Second, there is a very recent (and relatively substantial) rise in the enrollment of
international freshmen (and transfer students) on most UC campuses, which is particularly
evident in the 2014 data. For example, in 2014 freshmen applications to UC from international
students increased 62% from 2 years prior, which is part of a larger trend in American higher
education that has both demand-side and supply-side dimensions (Choudaha & Chang, 2012).
University officials acknowledge that while this shift has potential educational benefits in
bringing more diverse international perspectives into the classroom environment, the primary
driver of this phenomenon is the nonresident tuition paid by international students’ families
who pay much higher tuition. Domestic out-of-state students pay the same nonresident tuition
at UC as international students, and there is an upward trend line on most UC campuses with
domestic out-of-state students too (such students tend to be more affluent and less racially
diverse than California resident students enrolling at UC) because of the same underlying
financial dynamic (see e.g., Gordon, 2015).
In 2012 (the last year displayed in our charts below), it is estimated that about 25,000 (nearly
one in 10) of the California residents enrolled at UC were unfunded, meaning that the State of
California was not providing enrollment funding for such students (University of California
[UC] Budget Office, 2012). This is a problem common across the United States. Faced with
long-term disinvestment by the State of California, UC leaders have looked to enhanced
enrollment of international undergraduates and domestic out-of-state students as a revenue
strategy that is viewed as a more attractive path—at least compared to other bad options such
as significantly tapering UC’s institutional financial aid commitment to low-income California
residents or seriously degrading its academic quality. Or by lowering the costs and quality of
undergraduate instruction through other means such as fewer classes taught by ladder rank
faculty, larger classes and discussion sections, or fewer faculty hired. While UC leaders have
pledged to maintain enrollment commitments to funded state resident students, several
campuses have decreased their unfunded California resident enrollment in recent years and
swapped out these students with more international and domestic out-of-state students. This
is, in essence, affirmative action for non-California students who pay much more and are
ineligible for state aid. This dynamic has indirect and long-term implications for domestic
racial diversity. Among all enrolled UC freshmen in 2014, underrepresented minorities
represented 34% of California residents but only 6.3% of out-of-state students (UCOP,
Institutional Research and Academic Planning, 2015). This shift to increasing the number of
out-of-state students is driven by the state’s much reduced share of per-student costs. Given
the unequal distribution of income and wealth by race, these changes have significant negative
impacts on overall racial and ethnic diversity. In fact, by taking into account the numbers of
out-of-state and international students enrolled at UC in 2014 the percentage of URM students
in the freshman class is reduced from approximately 34% to just 28.9%. This must be viewed
in the context of a state in which more than 55% of its high schools graduates were URM in the
same year (California Department of Education, 2014).

20 Evaluating UC’s Race-Neutral Effects
The most selective UC campuses are key examples of the importance of what the Supreme Court
in Grutter described as the “path to leadership” (539 U.S. at 332) in American society. The most
selective UC campuses are national leaders in producing the most BS/BA graduates who later
earn science and engineering doctorates, including UC Berkeley (first in the nation), UCLA
(10th), UC Davis (11th), and UC San Diego (13th; Burrelli, Rapoport, & Lehming, 2008, Table 3).
UCLA and UC Berkeley are among the top handful of universities in the country producing the
most applicants to U.S. law schools (between 2008 and 2012 these two campuses together
produced more law school applicants than the next four UC campuses—Irvine, Santa Barbara,
San Diego, and Davis—combined; Law School Admission Council, 2013). Thus, for African
American, Latino, and Native American students, the strong weight of social science evidence
corroborates that access to America’s most selective public research universities carries a host
of long-term benefits including higher graduation rates, better labor market success (earnings),
increased likelihood of progressing to graduate or professional school and leadership service.21
A large body of educational research shows that affirmative action has a positive role in
boosting African American and Latino college graduation by keeping open access to the most
elite schools. (For a summary of this literature including UC graduation rates, see e.g., Alon &
Tienda, 2005; Bowen & Bok, 1998; Kidder & Lempert, 2015; Kidder & Onwuachi-Willig, 2014;
Kurlaender & Grodsky, 2013).
The most negative impact of Prop 209 was at UC Berkeley and UCLA. At UC Berkeley and UCLA,
the proportion of URM freshmen dropped by half in the wake of the passage of Prop 209. At
Berkeley, it went from about 23% in 1995 to 11% in 1998—and even in 2012 the proportion
of URM freshmen (16%) was still well below pre-209 levels. At UCLA, the proportion of URM
freshmen went from about 28% in 1995 to 14% in 1998—and in 2012 UCLA’s proportion of
URM freshmen (22%) was still well below pre-209 levels. At UCLA, 2006 marked the lowest
point regarding African American freshmen enrollment since the 1970s (in absolute numbers,
not simply in the proportion of the entering class). Under such conditions, there is a
heightened risk of racial isolation, tokenism, and negative stereotyping (e.g., in 2006 over
half—17 of 35—of the African American male freshmen on the UCLA campus were scholarship
athletes, National Collegiate Athletics Association, 2014). Before Prop 209, UC Berkeley, UCLA,
and UC Davis enrolled the most American Indian students, and American Indian enrollments
have never recovered in the many years since Prop 209 (see further discussion below
regarding BA degrees for the UC system).
African American freshman enrollment levels at several UC campuses were already quite low
before Prop 209 and have stayed low (or in some cases marginally improved) in the years
since Prop 209—this pattern characterizes UC San Diego, UC Davis, UC Santa Barbara, and UC
Santa Cruz. With respect to African American undergraduate enrollment levels, UC campuses
are generally well below their peers in the Association of American Universities (AAU).22
These AAU campuses (see the appendix) have received the most attention in the affirmative
action debate because of the key role they play in educating American leaders and the intense

Evaluating UC’s Race-Neutral Effects 21
competition for admissions. UC San Diego (1.5%) is below 53 of 54 in African American
enrollment among non-UC members of the AAU (Caltech, a unique institution at the extreme
edge of selectivity with very demanding science related requirements, is the only exception).
UC Berkeley (2.7%) is below 50 of 56 AAU peers and UCLA is below 46 of the 54 non-UC
members of the AAU. Because many other states have significantly larger proportions of
African Americans than California,23 one should not overinterpret these comparisons. But it is
true that UC Berkeley and UCLA met or exceeded the AAU’s enrollment averages for African
Americans before the ban. With the very small shares of African Americans on most UC
campuses, students of other races have little opportunity for contact with African American
students and their views in classes and dorms—key educational gains from diversity.
Our freshman enrollment charts above do indicate Latino gains on several UC campuses (e.g.,
UC Santa Cruz, UC Irvine, UC Santa Barbara), and more so in recent years (2009–2012) than in
the years right after Prop 209. But the critical driver behind this upward trend is that in
California in a few years Latinos will represent half of all public high school graduates so even
a declining chance for Latino students can produce a rising number on campus since so many
more are graduating high school over time (Gándara, 2012). This is similar to Texas (Long &
Tienda, 2008), another Sunbelt state with similarly unequal access to higher education. These
two states have by far the largest Latino enrollments.
Because California is the most populous state and the Golden State also includes the largest
American Indian population of any state (U.S. Census Bureau, 2012, Table 2), how American
Indians fared at UC after Prop 209 is an important and usually ignored question for
policymakers evaluating race-neutral alternatives (Reynoso & Kidder, 2008).24 The data in our
charts above are consistent with national admission findings (Hinrichs, 2012) 25 regarding the
negative impact of affirmative action ban on American Indian freshman enrollment at selective
universities. Perhaps the most troubling bottom line statistic for policymakers is that for pre-209
graduating classes in 1996–1999 the UC campuses combined to award 282 bachelor’s degrees
annually to American Indians (California Postsecondary Education Commission [CPEC], 2012).26
A decade after Prop 209 (2007–2010) the UC system annually awarded an average of only 233
bachelor’s degrees to American Indians, and that was despite the fact that the total number of
UC’s BA graduates grew by 43% from 1996 to the 2007–2010 period (CPEC, 2012). In summary,
American Indians as a percentage of all UC students earning BA degrees declined by more than
two fifths to one half of 1% of graduates over that span. One of the great dilemmas that
universities face in i finding these students is that most live off-reservation but not in segregated
areas where recruitment efforts can focus. As a result too often, they are forgotten.
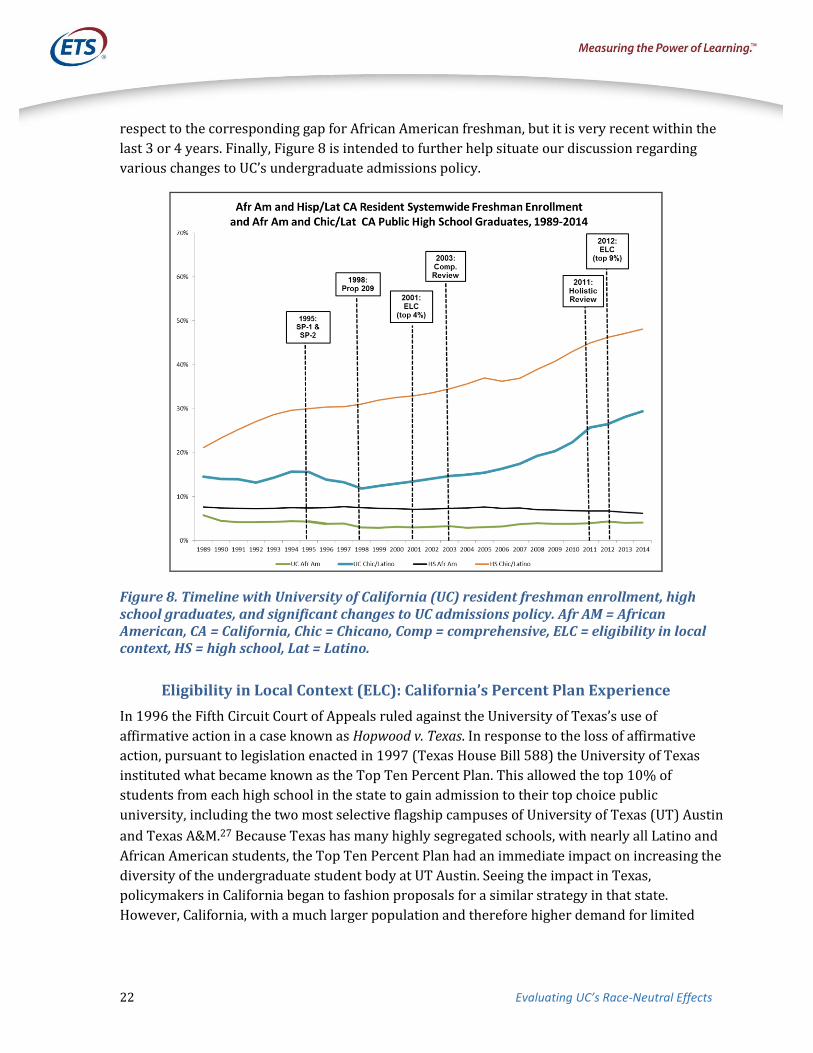
Finally, Figure 8 provides a timeline since the 1990s with UC systemwide freshman enrollment
(and high school graduate) proportions for African Americans and Latinos. As displayed in Figure
8, in 2014 there was an 18-point gap between Latinos’ proportion of California public high school
graduates versus the proportion of UC freshmen, and the size of this gap has been fairly constant in
the post-209 era even as Latino enrollments have climbed. There has been some progress with
22 Evaluating UC’s Race-Neutral Effects
respect to the corresponding gap for African American freshman, but it is very recent within the
last 3 or 4 years. Finally, Figure 8 is intended to further help situate our discussion regarding
various changes to UC’s undergraduate admissions policy.
Figure 8. Timeline with University of California (UC) resident freshman enrollment, high school graduates, and significant changes to UC admissions policy. Afr AM = African American, CA = California, Chic = Chicano, Comp = comprehensive, ELC = eligibility in local context, HS = high school, Lat = Latino.
Eligibility in Local Context (ELC): California’s Percent Plan Experience
In 1996 the Fifth Circuit Court of Appeals ruled against the University of Texas’s use of
affirmative action in a case known as Hopwood v. Texas. In response to the loss of affirmative
action, pursuant to legislation enacted in 1997 (Texas House Bill 588) the University of Texas
instituted what became known as the Top Ten Percent Plan. This allowed the top 10% of
students from each high school in the state to gain admission to their top choice public
university, including the two most selective flagship campuses of University of Texas (UT) Austin
and Texas A&M.27 Because Texas has many highly segregated schools, with nearly all Latino and
African American students, the Top Ten Percent Plan had an immediate impact on increasing the
diversity of the undergraduate student body at UT Austin. Seeing the impact in Texas,
policymakers in California began to fashion proposals for a similar strategy in that state.
However, California, with a much larger population and therefore higher demand for limited

Evaluating UC’s Race-Neutral Effects 23
seats, did not have the capacity to increase its enrollments to meet a 10% benchmark, and with a
charge of admitting the top 12.5% across the state (a more rigorous standard than UT Austin) it
could not reconcile admitting the top 10% of every school. Ultimately a compromise 4% plan
was initiated, granting the top 4% of all high schools admission to a UC campus, though not
necessarily the campus of their choice. Thus, while the university contends that the Four Percent
Plan has increased applications from schools that traditionally sent few students to the UC, it did
not increase diversity by any discernible amount. Most students in the top 4% of their
graduating classes were already eligible to attend UC, and the Plan did not increase their chances
of gaining access to their first choice campus.
Following on the anemic outcomes for the Four Percent Plan, the university instituted in 2012
the Nine Percent Plan (to the UC system, not necessarily to the student’s first-choice campus),
which became the 9-by-9 plan (the top 9% of each school and the top 9% of all students in the
state). This was calculated to yield an automatic acceptance rate of 10-12% overall because
these two criteria exhibit considerable overlap).28 However, the 9 X 9 Plan does not appear to
have been much more successful than the Four Percent Plan. See Figure 8. Only 35% of the
eligibility in local context (ELC; top 9%) applicants for the 2012 entering class were
underrepresented minorities compared to 37% of the overall pool of applicants (UC Office of
Institutional Research, 2012). Analyses are not yet available as to why the Nine Percent Plan
has had so little effect on diversity, but many of the schools from which UC would hope to draw
a more diverse pool of students neither prepare nor encourage their students to apply to the
university, and most of these students have never known anyone who has attended UC.
Finally, UC’s initial calculation that the 9-by-9 plan would result in admitting a tenth of
California high school graduates proved to be an underestimate, and the results from the initial
2012 cohort indicated that the 9-by-9 plan admitted about 12.1% of California’s high school
graduates (University of California Board of Admissions and Relations With Schools [UC
BOARS], 2014). Because the 9-by-9 plan admitted too many students, there is a proposal under
development by the faculty to scale it back to a 7-by-7 plan (UC BOARS, 2014, pp. 1-2). This
will likely further weaken the already-modest diversity benefits of ELC.
Comprehensive Review: Holistic Review of Applications
Comprehensive review was instituted at UC Berkeley in 199829 following on the admission of
the first class under Prop 209. However, that process has evolved over time, from a separate
comprehensive score attached to the regular review of the application, which was meant to
include additional information about a student’s personal circumstances, to the practice
followed today that results in a single holistic score, which incorporates the whole of a
student’s record in one number. UCLA adopted the comprehensive (reviewing the whole
record) and holistic (assigning a single score) review of its freshmen applicants in 2007. Since
2012 all UC campuses have gone to comprehensive/holistic review in large part, though their
procedures vary somewhat. Two detailed studies have been commissioned to validate the

24 Evaluating UC’s Race-Neutral Effects
process and outcomes of comprehensive and holistic review. One was conducted at Berkeley
(Hout, 2005) and another released at UCLA (Mare, 2012), based on two cohorts of freshman
admissions—2007 and 2008. Thus there is now considerable knowledge about the process
and outcomes at the two most highly selective campuses of the UC.
Comprehensive review has been motivated by the knowledge that test scores and (to a
somewhat lesser extent) GPA are highly correlated with socio-economic status and social
advantage (Alon & Tienda, 2007; Atkinson & Geiser, 2009; Rothstein, 2004) and have limited
predictive power (Geiser, 2014) and thus any system of admissions that relies solely or
overwhelmingly on those quantifiable characteristics will inevitably select the already
educationally advantaged over the disadvantaged, regardless of inherent ability or potential.
And given that access to the state’s most prestigious public universities confers many further
advantages, including the highest likelihood of actually completing a degree and going on to
graduate or professional school, a purely quantitative selection process reifies advantage over
a lifetime. Yet, it seems that such quantifiable information as GPA and test scores are
exceedingly difficult to overlook within the context of highly selective admissions, even with a
comprehensive review. This is evident in the fact that the average GPA of the incoming
freshman class at UCLA and UC Berkeley was about 4.25 on a 4 point scale in 2013 (University
of California Admissions, 2013).30 It is exceedingly difficult for students from low performing
schools to compete in this environment (Martin et al., 2005). As noted by Mare in his 2012
report on comprehensive and holistic review at UCLA:
Academic performance in high school, as indicated most strongly by GPA percentile,
passing AP tests, and taking college preparatory courses, have a very strong impact on
holistic ranking. Likewise, readers also place considerable weight on standardized
tests, summarized as UC Scores in my analysis. Other personal characteristics that are
markers of academic promise also have small beneficial effects on holistic ranking.
There is little direct evidence that readers place much weight on limits to achievement
and hardships in holistic scoring . . . (pp. 63–64).
Both the UC Berkeley and UCLA studies of comprehensive review report no significant ethnic
bias in the procedures or outcomes, though the process does operate as it is intended in the
sense that low income students and those from low performing schools and with significant
hardships are more likely to be referred to a supplemental review where their personal and
educational circumstances are taken into greater consideration. Thus approximately 85% of
students admitted at UCLA are admitted through regular review and this group is
overrepresented by White and North Asian students, whereas the students granted admission
through supplemental31 review are somewhat over represented by African American and
Latino students (by comparison to White and Asian students referred to this review), as would
be expected given the differences in personal and educational circumstances (Mare, 2012).

Evaluating UC’s Race-Neutral Effects 25
The proof in the pudding, so to speak, is in the profiles of the freshman classes. At UCLA the
2013 freshman class was composed of 43% Asian American, 26% White, 21% Chicano/Latino,
and 4.2% African American. At UC Berkeley the 2013 entering class was 45% Asian American,
32% White, 14% Chicano/Latino and 3.5% African American. By contrast, the high school
graduating class of 2013 in California was approximately 10% Asian, 30% White, 47%
Chicano/Latino, and 6.7% African American. In other words, the total underrepresented
minorities in the high school graduation class was approximately 55%,32 while the average
percentage of underrepresented minorities at UCLA and UC Berkeley was 22%.
While the proportional underrepresentation of Chicano/Latino students is as great as that of
African Americans, the small numbers of African American students at the most selective
campuses raises alarm because of the extreme isolation that these students experience,
creating a decreasing likelihood that URM students will want to attend those campuses in the
future. (This point is reinforced in our discussion of freshman enrollment above and campus
climate further below). As the UC faculty admissions committee, the Board of Admissions and
Relations With Schools (BOARS) concluded in a 2012 report:
African-American admit and yield numbers have not grown significantly over the past
decade. BOARS should reconsider earlier studies and look at mechanisms to consider
the impact that bimodal educational environments33 [emphasis added] have on
educational opportunity. (UC BOARS, 2012, p. 5)
In sum, comprehensive and holistic review adds a patina of greater fairness to the admissions
process, and no doubt increases the representation of underrepresented students at the
margins, but it by no means equalizes access or even makes a significant difference for those
groups that are traditionally excluded from access to the university because of what the
BOARS report characterized as bimodal educational environments (UC BOARS, 2014).
Researchers describe this as families and neighborhoods with fewer educational resources and
schools with unequal teachers, courses, and peer groups.
Changes in Standardized Test Requirements
For several decades the UC has required that all applicants to UC take SAT I and SAT II tests,34
although those tests have carried different weight and served different purposes over time.
The SAT II subject matter tests requirement was first initiated at a time when the university
was enrolling a considerably higher percentage of high school graduates than its 12.5% goal.
While students were required to take the subject tests, scores were not computed in the
eligibility index unless applicants failed to meet other admission criteria. The fact of having to
take these tests, however, had the effect of reducing the size of the eligibility pool to be more in
line with the California Master Plan for Higher Education. Unfortunately, those students who
failed to take the additional SAT II tests were disproportionately underrepresented minority
students (M. T. Brown, Rashid, & Stern, 2010) who either did not realize they needed to take

26 Evaluating UC’s Race-Neutral Effects
them because of lack of adequate counseling, or because the tests presented an additional
cost.35 Acknowledging this, the university dropped the requirement to take SAT II exams in
2012. It is not clear at this time if the reduction in the test requirements has had an
appreciable effect on the applicant pool or if it has affected the percentage of
underrepresented students actually admitted to the university. However, it is clear that the
diversity of the university continues to falter and the data represented in Figure 8 makes clear
that this has not had a major impact on improving diversity.
Community College Transfers: An Elusive Diversity Payoff?
A significant portion of the university’s undergraduate diversity comes through the transfer of
students from community colleges in the junior year. California sends more of its
undergraduates to 2- year colleges than any other state, and the high ratio of enrollment in 2-
year versus 4-year institutions is one of the principal reasons California’s baccalaureate degree
attainment rate ranks among the worst in the nation (i.e., the transfer rates and completion
rates coming out of California community colleges are notoriously low). (M. Brown et al., 2006;
Geiser & Atkinson, 2013) More broadly, the concentration of Latino students in the community
colleges tends to work against their ultimate higher education attainment levels and,
conversely, too many Latino students are undermatched by not attending highly selective 4-
year colleges and universities (Bowen, Chingos, & McPherson, 2009; Gándara et al., 2012;
Melguizo, 2009). Best estimates are that about 17% of URM students who intend to transfer
actually do so within 6 years of matriculating at a community college in California, and
underrepresented minority students tend to be more clustered at those California Community
Colleges with lower transfer rates to UC (Gándara et al., 2012; UC President’s Transfer Action
Team, 2014). Nonetheless, since URM students disproportionately attend community colleges,
they are potentially a rich source of these diverse students. As such, the UC operates transfer
programs at 112 California community colleges to help prepare students to make the transfer
to UC. In 2011–2012 UC community college transfer programs served almost 19,000 students.
As with the other SAPEP programs, the vast majority of these students do not go on to attend
UC, and since 2005 with declines in funding, there has been a significant decrease, from 52% to
just 35% of program participants transferring to any 4-year college.
In sum, apart from the fact that community college transfer students cannot contribute to the
diversity of the student body during the critical first 2 years of college when most students
who are going to drop out do so, URM students also make up a disproportionately smaller
percentage of the students who transfer into the UC. Just over $4 million were spent on these
programs by the university in 2012–2013, and while they almost certainly make important
differences in the lives of the students they touch, and make a significant contribution to the
overall welfare of the state, their ability to contribute to the diversity of the undergraduate
population at UC is seriously limited. UC’s 2013 Accountability Report concludes that “entering
freshmen are more diverse than entering transfer students” (UC Accountability Report 2013, p.
Evaluating UC’s Race-Neutral Effects 27
86) and former UC President Yudof made a similar statement at the July 2013 regents meeting
when this report was presented (UC Board of Regents, 2013).
University of California’s Need-Based Financial Aid Compared to Peer Universities
Admissions and financial aid in higher education are fundamentally mission-driven (Coleman
& Palmer, 2006; Guinier, 2003), and it is therefore not surprising that universities vary in their
appetite to cross-subsidize socioeconomic diversity through financial aid and other policies.
(Bowen, Kurzweil, Tobin, & Pichler, 2005) For example, the level of commitment in
California—where UC returns about one-third of tuition to need-based financial aid and where
the State contributes substantially to need-based aid through Cal Grants—contrasts with
priorities in several other states, such as the HOPE Scholarships in Georgia that in effect
displaces need-based aid with merit-based scholarships that disproportionately assist White
students (Heller & Marin, 2004; Marin & Flores, 2008). Because the California aid system is
much more need-based and extensive than those of many other states, the financial barriers
elsewhere might well be even more serious after the end of affirmative action admissions
packages.
One consideration the Court noted in Fisher I is whether race-neutral alternative can be
achieved with “tolerable administrative expense.” (133 S. Ct. at 2420) The vast majority of
highly selective American universities and state lawmakers do not have the stomach to
financially tolerate the UC’s level of institutional commitment to low-income students. Among
the 60 elite U.S. institutions in the Association of American Universities (AAU) there are six UC
campuses (UC Berkeley, UCLA, UC San Diego, UC Davis, UC Irvine, UC Santa Barbara). When
ranking all 60 AAUs based on the proportion of undergraduates who are Pell Grant recipients
in 2013 (i.e., low-income), the UC campuses rank 1st, 2nd, 3rd, 4th, 5th, and 8th (Institute of
Education Sciences, 2015). Among the public universities in the AAU, only Arizona and
Michigan have per capita institutional gift aid on par with UC campuses.36 Moreover, state gift
aid is another important component, and students at the UC campuses in the AAU receive
several times more per capita state gift aid as do the students at the other 28 public AAU
universities. At UT Austin, for example, the combination of state aid and institutional gift aid
per freshmen ($4,139) is above the average for AAU public universities, but it is less than half
of what is provided on a per capita basis to freshmen in the UC system ($9,623; UCOP, 2015).
In light of all of the above factors in combination, UC effectively represents an upper-bound
limit on commitment to class-based alternatives to affirmative action at highly selective
American universities (Kidder, 2013a).

28 Evaluating UC’s Race-Neutral Effects
University of California Financial Support, Price Sensitivity, and Recruitment of Underrepresented Minority (URM) Students
In 2001, not too long after Prop 209 took effect, among those offered admission at UC
campuses, the UC averaged an overall net price advantage over non-UC schools (where the
same students were also offered admission) of $5,200 for White admits and $5,600 for Asian
American admits, compared to a lesser price advantage of $4,300 for African American admits,
$2,100 for Chicano admits and $2,800 for other Latino admits. (UCOP, Student Services, 2001
p. 15). Part of the reason for that price advantage was the underappreciated (and unusual) fact
that UC’s in-state resident undergraduate tuition actually dropped from $3,100 in the 4 years
before Prop 209 (1994–1997) to $2,900 in 1998 and then to $2,700 in 1999–2001 (UC Budget
Office, 2015). Relevant to questions around the efficacy of race-neutral alternatives, even with
UC’s price advantage of several thousand dollars in 2001, at that time underrepresented
minorities were (especially in the top third of the admit pool) less likely than White and Asian
American students to accept admission offers to UC (Geiser & Caspary, 2005, pp. 408–410;
Kidder, 2012). Rather, top African American and Latino freshman offered admission at UC
were proportionally more likely to accept offers from private selective institutions like
Stanford, USC, and Ivy League schools (which could use race-conscious affirmative action;
Geiser & Caspary, 2005; Kidder, 2012)
Reviewing the same 2001 financial competitiveness data, the UC Undergraduate Work Team of
the Study Group on University Diversity (2007, p. 47) concluded:
UC is at a triple disadvantage in offering competitive financial aid packages to
underrepresented minority students. These students may be more price-sensitive than
other students (viz. sticker shock). The financial need analysis leaves needy
underrepresented minority families with too great a burden. Finally, with certain other
institutions targeting aid at underrepresented minority students, UC’s overall net cost
advantage is at its narrowest margin for these students.
Unfortunately, a similar price analysis survey has not been completed by UC in the years
since, but other data suggest that UC’s price advantage for talented underrepresented
minority admits has eroded further in recent years for reasons related to declining state
support (see earlier chart, p. 5 ) and concomitant increases in student tuition and fees (from
$2,896 for in-state tuition the first year Prop 209 took effect, 1998, to $15,500 for 2015, not
including mandatory health fees of $2,100 or books, transportation or living expenses—not
inflation adjusted). Our findings are consistent with prior research outside the UC context,
indicating that African American and Latino students are more sensitive to financial aid as a
determinant of enrollment choice and persistence (De La Rosa, 2006; St. John, Paulsen, &
Carter, 2005).

Evaluating UC’s Race-Neutral Effects 29
Critical Mass and Comparative Racial Climate
As some of the campuses re-segregated after the affirmative action ban, particularly in terms
of African American students, the process began to feed upon itself. Smaller groups generate
more isolation and less opportunity to have a major on-campus impact and more feelings that
students of color are not welcome on campus. Enrollment numbers—at UC, UT-Austin, and
other colleges and universities—are not simply abstract data points. Rather, low
representation of URM students in the student body (i.e., lack of critical mass) matters because
it can threaten the educational benefits of diversity and exacerbate the harms of racial
isolation. There is survey evidence showing such patterns. Research shows that on large-
sample undergraduate surveys in 2008-2012, at the seven UC campuses (UCB, UCD, UCI, UCLA,
UCSB, UCSD, UCSC) where African Americans are approximately 4% or less of the student body
only 59% of African Americans either strongly agree, agree, or even somewhat agree that
students of their race are respected on campus (Kidder & Onwuachi-Willig, 2014, p. 930; see
also Kidder, 2012; Brief of Civil Rights Project, 2013). On campuses like UT Austin, UC
Riverside and other leading public and private universities where there are a higher
proportion of African Americans in the student body (5–10%) the same surveys show that
80% of African Americans feel respected (Kidder & Onwuachi-Willig, 2014, p. 930). Comparing
these same lower diversity UC campuses versus UT Austin and some other leading universities
shows a similar pattern in the different levels of Latinos feeling respected (78% versus
92%).37 These data lend support to the concept of critical mass at research universities,
although we do not mean to imply there is a simple mechanical formula for critical mass in U.S.
higher education. These recent survey findings are consistent with Hurtado’s study of a
broader group of 31 U.S. colleges and universities, finding that African Americans and Latinos
are less likely to experience exclusion on campuses with higher levels of student body
diversity (Hurtado & Guillermo-Wann, 2013).38 Campuses with affirmative action bans and the
perception of being unwelcome can face a downward spiral recruitment dilemma. At UC
campuses African Americans and Latinos in the top third of the campus admit pools (defined
by grades and test scores) consistently had higher average yield rates (percentage of students
accepting admissions offers) in the 4 years before Prop 209 (1994–1997) compared to the
many years since (1998–2011; Kidder, 2012, pp. 24–25). The most pronounced case was
UCLA, where the African American freshman yield rate in the top portion of UCLA’s admit pool
dropped by two‐thirds after Prop. 209, from 24% to 8% (Kidder, 2012, p. 25). Breaking this
cycle without any consideration of race of applicants is an enormous challenge.
The Negative Impact at University of California Professional Schools
Most attention has focused on undergraduate admissions but, of course, highly selective
research universities have a decisively important role in graduate and professional school
programs that train many of the leading members of key professions. As noted at the outset of
this paper, in Grutter the Court declared, “In order to cultivate a set of leaders with legitimacy

30 Evaluating UC’s Race-Neutral Effects
in the eyes of the citizenry, it is necessary that the path to leadership be visibly open to
talented and qualified individuals of every race and ethnicity” (539 U.S. at 332). The negative
impact of Prop 209 and other state affirmative action bans has been documented with respect
to graduate school programs (Garces, 2013) as well as professional school programs like law
and business (Kidder, 2013a). For example, in Schuette v. BAMN (2014), the president and
chancellors of the UC filed a brief stating, “UC’s business schools, which play a crucial role in
educating California’s economic leaders, are consistently unable to enroll racially and
ethnically diverse classes” (Brief of University of California President and Chancellors, 2013).
African American, Latino, and American Indian students combined were only 5.3% of MBA
students at UC in 2014, less than half of the national average at comparable U.S. business
schools (Brief of University of California President and Chancellors, 2013).
The Supreme Court in Grutter recognized that leading institutions like the University of
Michigan Law School “represent the training ground for a large number of our Nation's
leaders,” and that “the pattern is even more striking when it comes to highly selective law
schools” (Grutter, 539 U.S. at 332). In the area of medicine there is an additional policy concern
that ending affirmative action threatens the diversity of the physician workforce and thus the
health of medically underserved communities (U.S. Dept. of Health and Human Services, 2006).
In the years prior to Prop 209, UC Berkeley law and UCLA law schools were routinely well
above the national average in enrollment of African American law students—indeed, these two
UC law schools were national leaders in awarding (combined) approximately 600 law degrees
to African Americans and 800 to Latinos in the decade before Prop 209 (Lawrence, 2001, p.
930). In the 1985–1996 period, 9.8% of the entering students at UCLA Law and 8.5% at UC
Berkeley Law were African American. Since the affirmative action ban (1997 to 2011) African
American enrollments at UCLA law declined by over three fifths (3.6% average) and at UC
Berkeley Law there was a decline by nearly half (4.5% average), though with upward trend
lines (more so at UC Berkeley). As the state was becoming predominantly non-White, these key
institutions for training leaders in law and political life were doing much less (American Bar
Association, 2013; Kidder, 2013a; Karabel, 1999; Law School Admissions Council, n.d.; UCOP,
2011).
In the decades prior to Prop 209, the UC San Francisco Medical School (frequently ranked as
America’s top public medical school) had one of the best records of enrolling
underrepresented minority students in the nation (Grumbach & Mendoza, 2008). A 2008 study
estimated that there were only 2,000 African American and 2,500-3,200 Latino physicians in
active patient care in the state of California, representing a severe shortage relative to the
needs of California’s diverse population (Grumbach et al., 2008). In terms of health policy and
UC’s mission to produce long-term benefits to society, these statistics signal a major concern
because African American and Latino physicians in California are more likely (net of other
characteristics) to practice in medically underserved areas and in areas with shortages of
primary care physicians (Walker, Moreno, & Grumbach, 2012). In short, affirmative action

Evaluating UC’s Race-Neutral Effects 31
bans like Prop 209 worsen an already very difficult physician supply policy challenge that
disproportionately threatens the long-term medical care of communities of color in the United
States (Garces & Mickey-Pabello, 2015; Saha & Shipman, 2008).39
Figure 9 attempts to succinctly capture the overall trend in first-time professional degrees
(law, medicine, pharmacy, business, public policy, architecture, etc.) awarded to African
Americans and Latinos at all UC campuses combined since the late-1990s. African Americans
and Latinos comprised nearly 20% of the degrees granted at UC professional schools in the
pre-209 graduating class of 1997, compared to only 10% of UC’s professional school graduates
in 2010. The proportion of African American graduates has hovered around 3% during the
decade that post-209 cohorts were graduating, a decline of approximately half compared to the
late-1990s. These figures obtained despite many robust good faith efforts by these UC
professional schools to use race-neutral alternatives and despite the fact that in the national
pipeline the number of bachelor’s degrees earned by African American and Latinos in the
United States grew by 53% and 87% between 1999 and 2009 (significantly outpacing other
groups and the overall nationwide 33% increase in BA degrees awarded; National Center for
Education Statistics, 2012, p. 112).
Figure 9. African Americans and Latinos as percentages of all UC professional school degrees awarded, 1996 to 2010.40 By 2000, most graduates were from post-209 cohorts, and virtually all were by 2001. Data from CPEC (2012).
The descriptive statistics we review above, documenting the long-term impact at highly
selective UC law and medical schools, are consistent with the social science research using
more refined difference-in-difference comparisons that support the inference of a causal
relationship between affirmative action bans in several states and underrepresented minority
enrollment declines in medical schools (Garces & Mickey-Pabello, 2015) and in graduate fields
of study (Garces, 2012, 2013).

32 Evaluating UC’s Race-Neutral Effects
How Lack of Faculty Affirmative Action Narrows the Pipeline to the Professoriate
Campus climate and the quality of participation in classroom discussions as it affects URM
students is related to the presence of URM faculty (Milem, 2003; Umbach, 2006)—and URM
faculty, especially at highly selective institutions, influence the capacity of those institutions to
prepare and graduate URM students from their graduate schools. Keep in mind that the
benefits work in the other direction too, as research shows that faculty who observe there to
be a positive campus racial climate on their campus exhibit higher job satisfaction and
retention levels than their faculty peers who do not (Jayakumar, Howard, Allen, & Han, 2009;
Victorino, Nylund-Gibson, & Conley, 2013). The UC has long been the single most important
source of Latino graduates of graduate school programs in the nation (Chapa, 2006). Among all
Ph.D. degrees granted during the last quarter of the 20th century (1975–1999) UCLA and UC
Berkeley ranked second and third in the nation, respectively, in producing the highest number
of Latino doctorates, with five other UC campuses (Santa Barbara, Davis, San Diego, Riverside,
and Irvine) also making the top 50 list of universities producing Latino doctorates (Thurgood,
Golladay, & Hill, 2006, p. 112). While UC campuses have maintained a roughly similar profile in
doctoral production of Latinos in 2008–201241 (however, increasingly underrepresenting the
actual population numbers), for African Americans UC Berkeley was a top 15 institution
awarding doctorates in 1975–1999 and UCLA was ranked 22nd (UCLA was in the top 20 for
1995–1999 specifically). NSF data for in 2008–2012 indicate that there are no longer any UC
campuses in the top 20 doctoral degree-granting institutions in the United States for African
Americans.
Clearly, the pipeline of UC undergraduates to graduate school and on to faculty positions in the
nation’s most selective colleges and universities is of critical importance to the country as a
whole and to the ability of campuses nationwide to be able to provide a welcoming
environment for diversity to thrive. Yet, that pipeline is extraordinarily leaky and in need of
urgent repair (e.g., Chapa, 2006). In 2012 only 2.6% of all UC faculty, across all disciplines,
were African American, and only 5.7% of all faculty were Latino (UCOP, 2013). Percentages of
untenured URM faculty—those professors, usually in the earlier stages of their career, were
almost identical, suggesting that an increase in the numbers is not to be expected any time
soon. In 2013, Whites and Latinos each represented 39% of the state’s population, yet Whites
comprised 76% of the UC’s faculty, and Latinos less than 6%.42 Both Latino and African
American students (and students from other backgrounds) are very unlikely to encounter a
URM faculty member in many of their classes, and the low production of URM UC graduates is
a factor in this dearth. In the absence of affirmative action in California’s selective campuses
the state’s supply of future leaders has been badly damaged and, because of the extraordinary
role these institutions play nationally, the national training of diverse future faculty and
leaders in many key professions has been diminished in spite of all the efforts the university
has made over two decades to find other ways to attain the educational values of diversity.

Evaluating UC’s Race-Neutral Effects 33
Why Class-Based Approaches Are Not Enough
The California experience is consistent with a long line of social science research over the past
15 years finding that class-based admission and financial aid policies are not a sufficient
substitute for race-conscious policies (Bowen et al., 2005; Holzer & Neumark, 2006; Kane,
1998; Krueger, Rothstein, & Turner, 2006; Long, 2007). Our findings are in accord with
Carnevale and Strohl (2013), who using national data concluded, “While politically attractive,
the direct substitution of class for race-based preferences does not yield the same numbers of
African-American and Hispanic candidates as a more direct reliance on race-based admissions”
(p. 37). There are several reasons for this. Low-income status is fluid and imperfectly defined.
For example, many people who qualify for this category may only temporarily be low income
as they transition, for example, through divorce or immigrant status, even though their
education level and long-term earnings potential would otherwise qualify them as middle
class. California’s college applicants include an unusually large number of high scoring low
income students. On the UC campuses students in the bottom and top quartiles of the income
distribution tend to have gaps in 6-year freshmen graduation rates that are half as large as
those at other AAUs (6 points versus 13 points).43 This suggests that the pipeline of talented
low-income students may reflect the state’s concentration of children of relatively well-
educated immigrants who nonetheless meet the federal/state low-income threshold due to the
nature of immigrant transitions (see Hernandez, Denton, & Macartney, 2009). A diversity
strategy combining poverty and California’s high academic standards may sweep in many
immigrants from educated families that are only temporarily poor and fewer African
Americans and Latinos living in long-term disadvantage with poorly educated parents. The net
effect then fails to achieve diversity among underrepresented students. That there may be less
bang for the buck with enrollment of low-income students outside of California parallels the
studies concluding that race-conscious affirmative action programs are often more efficient
means of enrolling high-achieving underrepresented minority students compared to a range of
nominally race-neutral proxy measures (Chan & Eyster, 2003; Fryer, Loury, & Yuret, 2008;
Long, 2015; Long & Tienda, 2008).
Conclusion
California’s experience shows that race-neutral alternatives are costly, inefficient, and do not
work at highly selective campuses. When colleges attempt to achieve a level of diversity
reasonably likely to produce compelling educational benefits by using means that do not
consider race they are, in their nature, going to be less efficient and more expensive than a
more direct method. Virtually all alternatives involve additional kinds of outreach and support,
and any truly nonracial policy is going to devote a substantial part of the effort to producing
students who do not add to racial diversity. A college can target areas with substantial
numbers of Latino students only to find that the top students in this largely Latino area are, for
example, new immigrants from Asia whose parents are temporarily low income while their
34 Evaluating UC’s Race-Neutral Effects
highly educated parents get their credentials and connect with skilled jobs. Since such students
are already well represented in the university they do not add to its diversity.
Depending on the strategy, it may cost several times more to recruit a student indirectly using
a race-neutral alternative and that student may be far less prepared for the university. We
have shown that with the major efforts made by the UC over the last two decades, and the
enormous costs involved, the great majority of students touched by the SAPEP programs do not
ever enroll in the university. Many fail to come because they are not competitive for admission,
in spite of sometimes years of academic interventions, many others do not come because they
cannot afford to. Needless to say, if a state does not have a strong need-based financial aid
policy, nothing will succeed in bringing substantial numbers of students from poor families to
college and keeping them there. Although California has a robust program, most states do not,
and even California’s program leaves gaps that many low-income families cannot close. One
recent estimate for fall 2016 is that the cost after all tuition and grant aid is subtracted will be
$13,700 per year at UCLA and $16,600 at UC Berkeley (CollegeCalc, 2015). Since African
American and Latino families, on average have less than a tenth of the wealth of White families,
this gap is often a fatal barrier. Being able to better target financial aid to these diversity
candidates would help close that gap.
As the Court acknowledged in Fisher, in evaluating race-neutral alternatives the courts should
consider whether such means can be implemented at a “tolerable administrative expense”
(133 S. Ct. at 2420; quoting Wygant, 476 U.S. at 280 n.6.). An alternative is actually realistic
only if the expense is tolerable, and any solution that requires a level of resources in general
financial aid, for example, that none of the 50 states has been able to provide, is not tolerable.
Nor is it tolerable if a university must invest tens of millions of dollars to attract a fraction of
1% of its freshman class that represents increased diversity. California has made a long,
expensive, creative, and multidimensional effort to make up for the losses in diversity caused
by the affirmative action ban nearly two decades ago. It has tried all of the major alternatives
and even actively encouraged private philanthropy to reach out directly to students of color.
Given the cost and the unusually positive financial aid system, and the strong support from
many system leaders for these alternatives, it is unlikely that any state will be able to do more.
Yet the effort has fallen far short, the level of access for African Americans, American Indians,
and Latinos who meet all the UC requirements has declined relative to Whites and Asians. The
lessons from the California experiment with alternatives to affirmative action are clear: billions
of dollars spent in programs and practices to help diversify the university have no doubt
benefited some students, but overwhelmingly, those students do not go on to attend the UC,
and so they do not increase the diversity of the university.
We have also shown that the lack of adequate diversity in the university comes at a high price:
the opportunity to make significant inroads to increasing the degree completion of
underrepresented minorities, who now comprise the majority of young people entering the
labor market is foregone. This will have a significantly negative impact on the state, as

Evaluating UC’s Race-Neutral Effects 35
estimates are that within the decade California will be one million BA degrees short of those
needed to meet labor market demands (Johnson & Sengupta, 2009). Those billions of dollars
could have been spent targeting the students most likely to gain admission and attend the
university, adding to its diversity, increasing the tax base of the state and helping California to
become a successful multiracial society.

36 Evaluating UC’s Race-Neutral Effects
References
Allen, W. R., Bonous-Hammarth, M., & Teranishi, R. (2002). Stony the road we trod... The Black struggle for higher education in California. Retrieved from ERIC database. (ED468748)
Alon, S., & Tienda, M. (2005). Assessing the “mismatch” hypothesis: Differences in college graduation rates by institutional selectivity. Sociology of Education, 78(4), 294–315.
Alon, S., & Tienda, M. (2007). Diversity, opportunity, and the shifting meritocracy in higher education. American Sociological Review, 72(4), 487–511.
American Bar Association. (2013). African American J. D. enrollment, 1971–2010 [Dataset]. Retrieved from http://www.americanbar.org/content/dam/aba/migrated/legaled/statistics/charts/stats_13.authcheckdam.pdf
eAntonovics, K. L., & Sander, R. H. (2013). Affirmative action bans and the “chilling effect.” American Law and Economics Review, 15(1), 252–299. http://dx.doi.org/10.1093/aler/ahs020
Association of American Universities. (n.d.). Member institutions and years of admission. Retrieved from http://www.aau.edu/about/article.aspx?id=5476
Atkinson, R. C., & Geiser, S. (2009). Reflections on a century of college admissions
tests. Educational Researcher, 38(9), 665–676.
Blumenstyk, G. (2015, April 17). State spending on higher education shows ‘sizable’ increase. Chronicle of Higher Education, p. A12.
Bonous-Hammarth, M. (2012). Practicing what we preach: Racial and ethnic school
composition, educational practice, and student achievement in California. Advances in
Education in Diverse Communities: Research, Policy and Praxis, 7, 433–447.
Bowen, W.G., & Bok, D. (1998). The shape of the river: The long-term consequences of considering race in college and university admissions. Princeton NJ: Princeton University Press.
Bowen, W. G., Chingos, M. M., & McPherson, M. S. (2009). Crossing the finish line: Completing college at America’s public universities. Princeton, NJ: Princeton University Press.
Bowen, W. G., Kurzweil, M. A., Tobin, E. M., & Pichler, S. C. (2005). Equity and excellence in American higher education. Charlottesville, VA: University of Virginia Press.
Brief for Petitioner at Schuette v. BAMN (November 2012) ( .
Brief of Association of American Medical Colleges et al. as Amici Curiae Supporting Respondents, Fisher v. University of Texas at Austin (August 13, 2013) (No. 01-1015).
Evaluating UC’s Race-Neutral Effects 37
Brief of Civil Rights Project/Proyecto Derechos Civiles as Amicus Curiae Supporting Respondents, Schuette v. BAMN (September 30, 2013) (No. 12-682).
Brief of University of California President and Chancellors as Amicus Curiae Supporting Respondents, Schuette v. BAMN (September 30, 2013).
Brown, M., Edley, C., Gándara, P., Hayashi, P., Kidder, W., Ledesma, M., … Stoddart, T. (2006). California at the crossroads: Confronting the looming threat to achievement, access, and equity at the University of California and beyond. Retrieved from http://www.berkeley.edu/news/berkeleyan/2006/11/images/Brown_Edley.pdf
Brown, M. T., Rashid, M., & Stern, D. (2010). The quest for excellence and diversity in UC
freshman admissions. In E. Grodsky & M. Kurlaender (Eds.), Equal opportunity in higher education: The past and future of California's Proposition 209 (pp. 129–154).Cambridge, MA: Harvard Education Press.
Brown, S. K., & Hirschman, C. (2006). The end of affirmative action in Washington State and its
impact on the transition from high school to college. Sociology of Education, 79(2), 106–130.
Burrelli, J., Rapoport, A., & Lehming, R. (2008). Baccalaureate origins of S&E doctorate recipients (NSF Information Brief No. 08-311). Retrieved from http://www.nsf.gov/statistics/infbrief/nsf08311/nsf08311.pdf
California Department of Education. (2014). Selected statewide data for the year 2013–2014 [dataset]. Retrieved from the Dataquest database: http://dq.cde.ca.gov/dataquest/Cbeds1.asp?Grads=on&Uccsu=on&cChoice=StatProf1&cYear=2013-14&cLevel=State&cTopic=Profile&myTimeFrame=S&submit1=Submit
California Postsecondary Education Commission. (2012). Bachelor’s degrees awarded: Native American as a percent of total, 1996–2010 [Dataset]. Retrieved from http://www.cpec.ca.gov/StudentData/EthSnapshotGraph.asp
California Postsecondary Education Commission. (1992). Eligibility of the state's 1990 high school graduates for admission to the state's public universities (Report No. 92-14). Sacramento, CA: Author.
Card, D., & Krueger, A. B. (2005). Would the elimination of affirmative action affect highly qualified minority applicants? Evidence from California and Texas. Industrial & Labor
Relations Review, 58(3), 416–434.
Carnevale, A., & Strohl, J. (2013). Separate and unequal. How higher education reinforces the intergenerational reproduction of White racial privilege. Washington, DC: Georgetown Public Policy Institute.

38 Evaluating UC’s Race-Neutral Effects
Caspary, K., Bland, J., Aladjem, D., Miller, F., & Biscocho, F. (2013). Promoting access to college in an era of fiscal constraints: The University of California’s Early Academic Outreach Program. Menlo Park, CA: SRI International.
Chacón, J. M. (2008). Race as a diagnostic tool: Latinas/os and higher education in California,
post-209. California Law Review, 96(5), 1215–1257. http://dx.doi.org/doi:10.15779/Z38V71Q
Chan, J., & Eyster, E. (2003). Does banning affirmative action lower college student quality? The American Economic Review, 93, 858–872.
Chang, T., & Rose, H. (2010). A portrait of underrepresented minorities at the University of California, 1994–2008. In E. Grodsky & M. Kurlaender (Eds.), Equal opportunity in higher education: the past and future of California’s Proposition 209 (pp. 88–89). Cambridge, MA: Harvard Education Press.
Chapa, J. (2006). The educational pipeline and the future professoriate: Who will teach
California's and the nation’s Latino and African American college students? In P. Gándara, G. Orfield, & C. Horn (Eds.), Expanding opportunity in higher education: Leveraging promise (pp. 243–264). Albany, NY: SUNY Press.
Choudaha, R., & Chang, L. (2012). Trends in international student mobility. World Education News & Reviews, 25(2). Retrieved from http://ssrn.com/abstract=2184988
Coleman, A. L., & Palmer, S. R. (2006). Admissions and diversity after Michigan: The next generation of legal and policy issues. New York, NY: The College Board.
CollegeCalc. (2015). College costs in California [Dataset]. Retrieved from http://www.collegecalc.org/colleges/california/?view=all
Contreras, F. (2011). Strengthening the bridge to higher education for academically promising
underrepresented students. Journal of Advanced Academics, 22(3), 500–526.
De La Rosa, M. L. (2006). Is opportunity knocking? Low-income students’ perceptions of
college and financial aid. American Behavioral Scientist, 49(12), 1670–1686.
Dickson, L. M. (2006). Does ending affirmative action in college admissions lower the percent of minority students applying to college? Economics of Education Review, 25, 109–119.
Finnel, S. (1998). The Hopwood chill: How the Court derailed diversity efforts at Texas A&M. In G. Orfield & E. Miller (Eds.), Chilling admissions: The affirmative action crisis and the search for alternatives (pp. 77–82). Cambridge, MA: Harvard Education Press.
Fisher v. University of Texas at Austin, 570 U.S __ (2013).

Evaluating UC’s Race-Neutral Effects 39
Frey, S. (2012, December 21). California near bottom in number of school counselors. EdSource. Retrieved from http://edsource.org/2012/california-near-bottom-in-numbers-of-school-counselors/24557
Fryer, R. G., Loury, G. C., & Yuret, T. (2008). An economic analysis of color-blind affirmative
action. Journal of Law, Economics, and Organization, 24(2), 319–355.
Gándara, P. (2002). A study of high school Puente: What we have learned about preparing
Latino youth for postsecondary education. Educational Policy, 16(4), 474–495.
Gándara, P. (2005). Addressing educational inequities for Latino students: The politics of
“forgetting.” Journal of Hispanic Higher Education, 4(3), 295–313.
Gándara, P. (2012). California: A case study in the loss of affirmative action (Policy Brief). Los Angeles, CA: Civil Rights Project/Proyecto Derechos Civiles.
Gándara, P., Alvarado, E., Driscoll, A., & Orfield, G., (2012). Building pathways to transfer: Community colleges that break the chain of failure for students of color. Los Angeles, CA: Civil Rights Project/Proyecto Derechos Civiles.
Gándara, P., & Bial, D. (2001). Paving the way to postsecondary education: K-12 interventions for underrepresented youth. Washington DC: National Center for Education Statistics.
Garces, L. M. (2012). Racial diversity, legitimacy, and the citizenry: The impact of affirmative
action bans on graduate school enrollment. The Review of Higher Education, 36(1), 93–132.
Garces, L. M. (2013). Understanding the impact of affirmative action bans in different graduate
fields of study. American Educational Research Journal, 50(2), 251–284.
Garces, L. M., & Mickey-Pabello, D. (2015). Racial diversity in the medical profession: The impact of affirmative action bans on underrepresented students of color matriculation
in medical schools. The Journal of Higher Education, 86(2), 264–294.
Geiser. S. (2014). BACK TO THE FUTURE: Freshman admissions at the University of California, 1994 to the present and beyond (Research & Occasional Paper Series No. CSHE 4.14). Retrieved from http://www.cshe.berkeley.edu/sites/default/files/shared/publications/docs/ROPS.CSHE_.4.14.Geiser.BacktotheFuture.4.24.2014-1.pdf
Geiser, S., & Atkinson, R. C. (2013). Beyond the master plan: the case for restructuring
Baccalaureate education in California. California Journal of Politics and Policy, 5(1), 67–123.
Geiser, S., & Caspary, K. (2005). “No show” enroll, 1997-2002. Educational Policy, 19(2), 396–417.
40 Evaluating UC’s Race-Neutral Effects
Geiser, S., Ferri, C., & Kowarsky, J. (2000). Admissions briefing paper: Underrepresented minority admissions at UC after SP-1 and Proposition 209: Trends, issues and options (Admissions Briefing Paper). Oakland, CA: University of California Office of the President, Student Academic Services.
Goldberg, C. (2002). American Indians and “preferential” treatment. UCLA Law Review, 49, 943–989.
Gordon, L. (2015, March 3). UC to freeze California enrollment, cap UCLA, Berkeley non-residents. Los Angeles Times. Retrieved from http://www.latimes.com/local/education/la-me-ln-uc-enrollment-20150303-story.html
Gratz v. Bollinger, 539 U.S. 244 (2003).
Grodsky, E., & Kurlaender, M. (2010). The demography of higher education in the wake of affirmative action. In E. Grodsky & M. Kurlaender (Eds.), Equal opportunity in higher Grumbach education: The past and future of California's Proposition 209 (pp. 33–58). Harvard Education Press.
Grumbach, K., & Chen, E. (2006). Effectiveness of University of California postbaccalaureate premedical programs in increasing medical school matriculation for minority and
disadvantaged students. JAMA, 296(9), 1079–1085.
Grumbach, K., & Mendoza, R. (2008). Disparities in human resources: Addressing the lack of
diversity in the health professions. Health Affairs, 27(2), 413–422.
Grumbach, K., Odom, K., Moreno, G., Chen, E., Vercammen-Grandjean, C., & Mertz, E. (2008). Physician diversity in California: New findings from the California Medical Board Survey. Retrieved from http://www.futurehealth.ucsf.edu/Content/29/2008-03_MD_Diversity_in_CA_New_Findings_from_the_CA_Med_Board_Survey.pdf
Grutter v. Bollinger, 539 U.S. 306 (2003).
Guinier, L. (2003). Admissions rituals as political acts: Guardians at the gates of our democratic ideals. Harvard Law Review, 117, 113–224.
Heller, D. E., & Marin, P. (Eds.). (2004). State merit scholarship programs and racial
inequality. Cambridge, MA: The Civil Rights Project at Harvard University.
Hernandez, D., Denton, N., & Macartney, S. (2009). School-age children in immigrant families:
Challenges and opportunities for America's schools. The Teachers College
Record, 111(3), 616–658.
Herzog, S. (2010). Gauging the effect of compositional and curricular diversity on freshman success. New Directions for Institutional Research, 2010(145), 73–97.

Evaluating UC’s Race-Neutral Effects 41
Hinrichs, P. (2012). The effects of affirmative action bans on college enrollment, educational attainment, and the demographic composition of universities. Review of Economics and
Statistics, 94(3), 712–722.
Holzer, H. J., & Neumark, D. (2006). Affirmative action: What do we know? Journal of Policy Analysis and Management, 25(2), 463–490.
Hopwood v. Texas, 78 F.3d 932 (5th Cir. 1996), abrogated by Grutter v. Bollinger, 539 U.S. 306 (2003).
Hout, M. (2005). Berkeley’s comprehensive review method for making freshman admissions decisions: An assessment. A Report to the Committee on Admissions, Enrollment, and Preparatory Education (AAPE) and the Associate Vice Chancellor for Admissions & Enrollment, UC Berkeley. Retrieved from http://academic-senate.berkeley.edu/sites/default/files/committees/aepe/hout_report_0.pdf
Hurtado, S., & Guillermo-Wann, C. (2013). Diverse learning environments: Assessing and creating conditions for student success—Final report to the Ford Foundation. Los Angeles, CA: University of California, Los Angeles, Higher Education Research Institute.
Institute of Education Sciences. (2015). Integrated postsecondary education data system [Dataset]. Retrieved from http://nces.ed.gov/ipeds/datacenter/Ranking.aspx
Jayakumar, U. M., Howard, T. C., Allen, W. R., & Han, J. C. (2009). Racial privilege in the
professoriate: An exploration of campus climate, retention, and satisfaction. The Journal of Higher Education, 80(5), 538–563.
Johnson, H., & Sengupta, R. (2009). Closing the gap: Meeting California’s need for college graduates. San Francisco, CA: Public Policy Institute of California.
Kahlenberg, R. D., with Potter, H. (2012). A better affirmative action: State universities that created alternatives to racial preferences. Retrieved from https://www.tcf.org/assets/downloads/tcf-abaa.pdf
Kane, T. J. (1998). Misconceptions in the debate over affirmative action in college admissions. In G. Orfield & E. Miller (Eds.), Chilling admissions: The affirmative action crisis and the search for alternatives (pp. 17–31). Cambridge, MA: Harvard Education
Karabel, J. (1998). No alternative: The effects of color-blind admissions in California. In G. Orfield & E. Miller (Eds.), Chilling admissions: The affirmative action crisis and the search for alternatives (pp. 33–50). Cambridge, MA: Harvard Education Press.
Karabel, J. (1999). The rise and fall of affirmative action at the University of California. Unpublished manuscript, UC Berkeley Institute for the Study of Social Change.

42 Evaluating UC’s Race-Neutral Effects
Kidder, W. C. (2012). The salience of racial isolation: African Americans’ and Latinos’ perceptions of climate and enrollment choices with and without Prop 209. Los Angeles, CA: Civil Rights Project/Proyecto Derechos Civiles.
Kidder, W. C. (2013a). Misshaping the river: Proposition 209 and lessons for the Fisher Case. Journal of College & University Law, 39(1), 53–126. http://dx.doi.org/10.2139/ssrn.2123653
Kidder, W. C. (2013b, October 13). Michigan’s mangled empirical claims in the Schuette case [Blog post]. Retrieved from the ACSblog website: http://www.acslaw.org/acsblog/michigan%E2%80%99s-mangled-empirical-claims-in-the-schuette-affirmative-action-case
Kidder, W. C., & Lempert, R. O. (2015). The mismatch myth in U.S. higher education. In U. M. Jayakumar & L. M. Garces (Eds.), Affirmative action and racial equity: Considering the Fisher Case to forge the path ahead (pp. 105–129). New York, NY: Routledge.
Kidder, W. C., & Onwuachi-Willig, A. (2014). Still hazy after all these years: The data and theory behind “mismatch.” Texas Law Review, 92, 895–941.
Kidder, W., Serrano, S. K., & A. N. Ancheta. (2004, May 21). In California, a misguided battle over race. Chronicle of Higher Education, B16.
Krueger, A., Rothstein, J., & Turner, S. (2006). Race, income, and college in 25 years: Evaluating Justice O’Connor’s conjecture. American Law and Economics Review, 8(2), 282–311.
Kurlaender, M., &, Grodsky, E. (2013). Mismatch and the paternalistic justification for selective college admissions. Sociology of Education, 86(4) 294–310.
Law School Admission Council. (2013). Top 240 ABA applicant feeder schools for fall applicants. Retrieved from http://www.lsac.org/docs/default-source/data-(lsac-resources)-docs/top-240-feeder-schools.pdf
Lawrence III, C. R. (2001). Two views of the river: A critique of the liberal defense of affirmative action. Columbia Law Review, 101, 928–976.
Law School Admissions Council. (n.d.). The 2006–2015 archives: Official guide to ABA-approved law schools. Retrieved from http://www.lsac.org/lsacresources/publications/official-guide-archives
Long, M. C. (2004). College applications and the effect of affirmative action. Journal of Econometrics, 121(1), 319–342.
Long, M. C. (2007). Affirmative action and its alternatives in public universities: What do we know? Public Administration Review, 67(2), 315–330.
Long, M. C. (2015). Is there a “workable” race‐neutral alternative to affirmative action in college admissions? Journal of Policy Analysis and Management, 34(1), 162–183.

Evaluating UC’s Race-Neutral Effects 43
Long, M. C., & Tienda, M. (2008). Winners and losers: Changes in Texas university admissions post-Hopwood. Educational Evaluation and Policy Analysis, 30, 255–280.
Lupton, K., Vercammen-Grandjean, C., Forkin, J., Wilson, E., & Grumbach, K. (2012). Specialty choice and practice location of physician alumni of University of California premedical postbaccalaureate programs. Academic Medicine, 87(1), 115–120.
Mare, R. D. (2012). Holistic review in freshman admissions at the University of California—Los Angeles. Retrieved from http://www.senate.ucla.edu/committees/cuars/documents/UCLAReportonHolisticReviewinFreshmanAdmissions.pdf
Marin, P., & Flores, S. M. (2008). Bakke and state policy: Exercising institutional autonomy to
maintain a diverse student body. In P. Marin & C. L. Horn (Eds.), Realizing Bakke’s legacy: Affirmative action, equal opportunity, and access to higher education (pp. 219–239). Sterling, VA: Stylus Publishing.
Marin, P., & Yun, J. T. (2011). After Proposition 209: Post-affirmative action college access policy in California. In D. E. Heller (Ed.), The states and public higher education policy: Affordability, access, and accountability (2nd ed.; pp. 127–147). Baltimore, MD: The Johns Hopkins University Press.
Martin, I., Karabel, J., & Jaquez, S. W. (2005). High school segregation and access to the University of California. Educational Policy, 19(2), 308–330.
McDonough, P. M. (2005). Counseling matters: Knowledge, assistance, and organizational commitment in college preparation. In W. G. Tierney, Z. B. Corwin, & J. E. Colyar (Eds.), Preparing for college: Nine elements of effective outreach (pp. 69–87). Albany, NY: SUNY Press.
Melguizo, T. (2009). Are community colleges an alternative path for Hispanic students to attain a bachelor's degree? Teachers College Record, 111(1), 90–123.
Milem, J. F. (2003). The educational benefits of diversity: Evidence from multiple sectors. In J. Mitchell, M. J. Chang, D. Witt, J. Jones, & K. Hakuta, (Eds.), Compelling interest: Examining the evidence on racial dynamics in higher education (pp. 126–169). Redwood City, CA: Stanford University Press.
National Collegiate Athletics Association. (2014). Federal graduation rates for the 2006-07 Cohort [Dataset]. Retrieved from http://www.ncaa.org/about/resources/research/federal-graduation-rates-search
National Center for Education Statistics. (2012). The condition of education 2012: Postsecondary education. Retrieved from http://nces.ed.gov/pubs2012/2012045_4.pdf

44 Evaluating UC’s Race-Neutral Effects
Oakes, J., Rogers, J., Silver, D., Valladares, S., Terriquez, V., McDonough, P. … Lipton, M. (2006). Removing the roadblocks: Fair college opportunities for all California students. Retrieved from http://idea.gseis.ucla.edu/publications/eor-06/RemovingRoadblocks.pdf/view
Orfield, G. (1998). Campus resegregation and its alternatives. In G. Orfield & E. Miller (Eds.), Chilling admissions: The affirmative action crisis and the search for alternatives (pp. 1–16). Cambridge, MA: Harvard Education Press.
Orfield, G., & Ee, J. (2014). Segregating California’s future: Inequality and its alternative 60 years after Brown v. Board of Education. Los Angeles, CA: Civil Rights Project/Proyecto Derechos Civiles.
Orfield, G., Kucsera, J., & Siegel-Hawley, G. (2012). E pluribus... separation: Deepening double segregation for more students. Los Angeles, CA: Civil Rights Project/Proyecto Derechos Civiles.
Organic Act, California Assembly Bill 583 (1868).
Quigley, D. D. (2003a). Using multivariate matched sampling that incorporates the propensity score to establish a comparison group (CSE Technical Report No. 596). UCLA Center for the Study of Evaluation, National Center for Research on Evaluation, Standards, and Student Testing.
Quigley, D. D. (2003b). The early academic outreach program (EAOP) and its impact on high school students' completion of the University of California’s preparatory coursework (CSE Technical Report No. 589). UCLA Center for the Study of Evaluation, National Center for Research on Evaluation, Standards, and Student Testing.
Reynoso, C., & Kidder, W. C. (2008). Tribal membership and state law affirmative action bans: Can membership in a federally recognized American Indian tribe be a plus factor in
admissions at public universities in California and Washington. Chicano-Latino Law
Review, 27, 29–58.
Rolnick, A. C. (2011). Promise of Mancari: Indian political rights as racial remedy. New York University Law Review, 86, 958–1045.
Rothstein, J. M. (2004). College performance predictions and the SAT. Journal of
Econometrics, 121(1), 297–317.
Saha, S., & Shipman, S. A. (2008). Race-neutral versus race-conscious workforce policy to
improve access to care. Health Affairs, 27(1), 234–245.
Schuette v. Coalition to Defend Affirmative Action, Integration and Immigration Rights and Fight for Equality By Any Means Necessary (BAMN), 572 ____ (2014).

Evaluating UC’s Race-Neutral Effects 45
Solorzano, D., Allen, W. R., & Carroll, G. (2002). Keeping race in place: Racial microaggressions and campus racial climate at the University of California, Berkeley. Chicano-Latino Law
Review, 23, 15–111.
St. John, E. P., Paulsen, M. B., & Carter, D. F. (2005). Diversity, college costs, and postsecondary opportunity: An examination of the financial nexus between college choice and
persistence for African Americans and Whites. The Journal of Higher Education, 76(5), 545–569.
Thurgood, L., Golladay, M. J., & Hill, S. T. (2006). U.S. doctorates in the 20th century (NSF 06-319). Arlington, VA: National Science Foundation, Division of Science Resources Statistics.
University of California Admissions. (2013). Freshman class profiles [Dataset]. Retrieved from http://admission.universityofcalifornia.edu/counselors/freshman/profiles/index.html
University of California Board of Admissions and Relations With Schools. (2003). use of
admissions tests Retrieved from
http://senate.universityofcalifornia.edu/committees/boars/admissionstests.pdf
University of California Board of Admissions and Relations With Schools. (2014). Annual report for 2013–14. Retrieved from http://senate.universityofcalifornia.edu/committees/boars/BOARS2013-14AnnualReport.pdf
University of California Board of Regents. (1988). Regents policy No. 2102: Policy on undergraduate admissions (1988). Retrieved from http://regents.universityofcalifornia.edu/governance/policies/2102.html
University of California Board of Regents. (2013). Minutes of the Committee on Finance meeting on July 17, 2013. Retrieved from http://regents.universityofcalifornia.edu/minutes/2013/fin7.pdf
University of California Board of Regents. (2014, November 19). Action Item L3: Approval of long-term stability plan for tuition and financial aid. Retrieved from http://regents.universityofcalifornia.edu/regmeet/nov14/l3.pdf
University of California Budget Office. (2012). Budget for current operations: Summary and detail. 2013-14. Retrieved from http://www.ucop.edu/operating-budget/_files/rbudget/2013-14-budget.pdf
46 Evaluating UC’s Race-Neutral Effects
University of California Budget Office. (2015). UC historical fee levels, 1975 to the present. Retrieved from http://ucop.edu/operating-budget/_files/fees/201415/documents/Historical_Fee_Levels.pdf
University of California Latino Eligibility Task Force. (1997). Latino student eligibility and participation in the University of California. Ya Basta! (Report Number No. 5). Santa Cruz: University of California.
University of California Office of the General Counsel. (2007). Guidelines for addressing race and gender equity in academic programs in compliance with Proposition 209. Retrieved from http://www.ucop.edu/general-counsel/guidance/enhancing-diversity-at-uc.html
University of California Office of Institutional Research. (2012, fall). Unpublished internal analysis.
University of California Office of the President (n.d.). Statistical summary and data on UC students, faculty, and staff [Dataset]. Retrieved from http://legacy-its.ucop.edu/uwnews/stat/
University of California Office of the President. (2011). Annual accountability report. Retrieved from http://accountability.universityofcalifornia.edu/documents/accountabilityreport11.pdf
University of California Office of the President. (2012). Application, admissions and enrollment of California resident freshmen for fall 1989 through 2012. Retrieved from http://www.ucop.edu/news/factsheets/2012/flow-frosh-ca-12.pdf
University of California Office of the President. (2013). Accountability report 2013: Indicator 8.1.2. Retrieved from http://accountability.universityofcalifornia.edu/2013/index/8.1.2
University of California Office of the President. (2014). Application, admissions and enrollment of California resident freshmen for fall 1986 through 2014. Retrieved from http://www.ucop.edu/institutional-research-academic-planning/_files/factsheets/2014/flow-frosh-ca-14.pdf
University of California Office of the President. (2015). Accountability report 2015: Indicator 2.3.1. Retrieved from http://accountability.universityofcalifornia.edu/2015/chapters/chapter-2.html#2.3.1
University of California Office of the President, Budget and Capital Resources. (2011). Report on Student Academic Preparation and Educational Partnerships (SAPEP) for the 2009-10 academic year: Legislative report. Retrieved from http://ucop.edu/operating-budget/_files/legreports/1011/sapep-funds-outcomes.pdf
University of California Office of the President, Budget and Capital Resources. (2013). 2011–12 Student Academic Preparation and Educational Partnerships (SAPEP) funds and
Evaluating UC’s Race-Neutral Effects 47
outcomes: Legislative report. Retrieved from http://www.ucop.edu/education-partnerships/_files/sapep-funds-outcomes.pdf
University of California Office of the President, Diversity and Engagement. (2015). Student academic preparation and educational partnerships (SAPEP): 2013-14 outcomes. Retrieved from http://ucop.edu/diversity-engagement/_files/sapep-full-report-rscpsb.pdf
University of California Office of the President, Institutional Research and Academic Planning. (2015). University of California admission by residency and ethnicity. Retrieved from http://www.universityofcalifornia.edu/infocenter/admissions-residency-and-ethnicity
University of California Office of the President, Student Services. (2001). Report on findings from the 2001 Undergraduate Student Support Survey. Retrieved from http://ucop.edu/student-affairs/_files/undergradsupport_surveyrpt2001.pdf
University of California Outreach Task Force. (1997). New directions for outreach: Report of the University of California Outreach Task Force. Retrieved from http://www.ucop.edu/education-partnerships/_files/outreachrpt.pdf
University of California President’s Transfer Action Team. (2014). Preparing California for its future: Enhancing community college student transfer to UC. Retrieved from http://ucop.edu/transfer-action-team/transfer-action-team-report-2014.pdf
University of California Undergraduate Work Team of the Study Group on University Diversity. (2007, September). Recommendations and observations. Retrieved from http://www.ucop.edu/student-affairs/_files/07-diversity_report.pdf
Umbach, P. D. (2006). The contribution of faculty of color to undergraduate education. Research in Higher Education, 47(3), 317–345.
U.S. Census Bureau. (2012). The American Indian and Alaska Native population: 2010 (2010 Census Briefs). Retrieved from http://www.census.gov/prod/cen2010/briefs/c2010br-10.pdf
U.S. Department of Health and Human Services. (2006). The rationale for diversity in the health professions: A review of the evidence. Retrieved from http://bhpr.hrsa.gov/healthworkforce/reports/diversityreviewevidence.pdf
Victorino, C. A., Nylund-Gibson, K., & Conley, S. (2013). Campus racial climate: A litmus test for faculty satisfaction at four-year colleges and universities. The Journal of Higher
Education, 84(6), 769–805.
Walker, K. O., Moreno, G., & Grumbach, K. (2012). The association among specialty, race, ethnicity, and practice location among California physicians in diverse
specialties. Journal of the National Medical Association, 104(1–2), 46–52.

48 Evaluating UC’s Race-Neutral Effects
Western Interstate Commission for Higher Education. (2012). Knocking at the college door: Projections of high school graduates (8th ed. and supplements). Retrieved from http://www.wiche.edu/pub/knocking-8th-and-supplements
Wygant v. Jackson Bd. of Ed., 476 U.S. 267 (1986).

Evaluating UC’s Race-Neutral Effects 49
Appendix
Table A1. California High School Graduates by Race/Ethnicity and Gender, Including Percentage
Completing A–G Courses Required for University of California/California State University Entry,
2012–2013
Graduate race/ethnicity
Female Male Total
American Indian # of graduates 1,558 1,441 2,999 % A–G courses 30.7% 21.4% 26.2%
African American # of graduates 13,968 13,104 27,072 % A–G courses 33.9% 24.2% 29.2%
Asian American # of graduates 20,513 21,384 41,897 % A–G courses 72.9% 62.7% 67.7%
Pacific Islander # of graduates 1,333 1,251 2,584 % A–G courses 40.5 % 28.7 % 34.8 %
Filipino # of graduates 6,384 6,802 13,186 % A–G courses 62.0% 47.3% 54.4%
Latino # of graduates 102,678 96,355 199,033 % A–G courses 33.8 % 24.2 % 29.1 %
White # of graduates 62,540 62,959 125,499 % A–G courses 52.2% 42.0% 47.1%
Two or more races # of graduates 4,077 3,854 7,931 % A–G courses 51.7% 41.6% 46.8%
Total a # of graduates 214,013 208,164 422,177 % A–G courses 44.1% 34.6% 39.4%
Note. Data from California Department of Education (2014). a The grand totals at the bottom also include fewer than 2,000 race/ethnicity not reported graduates.
Figure A1. Freshmen application trends to University of California (UC) campuses since 1995.
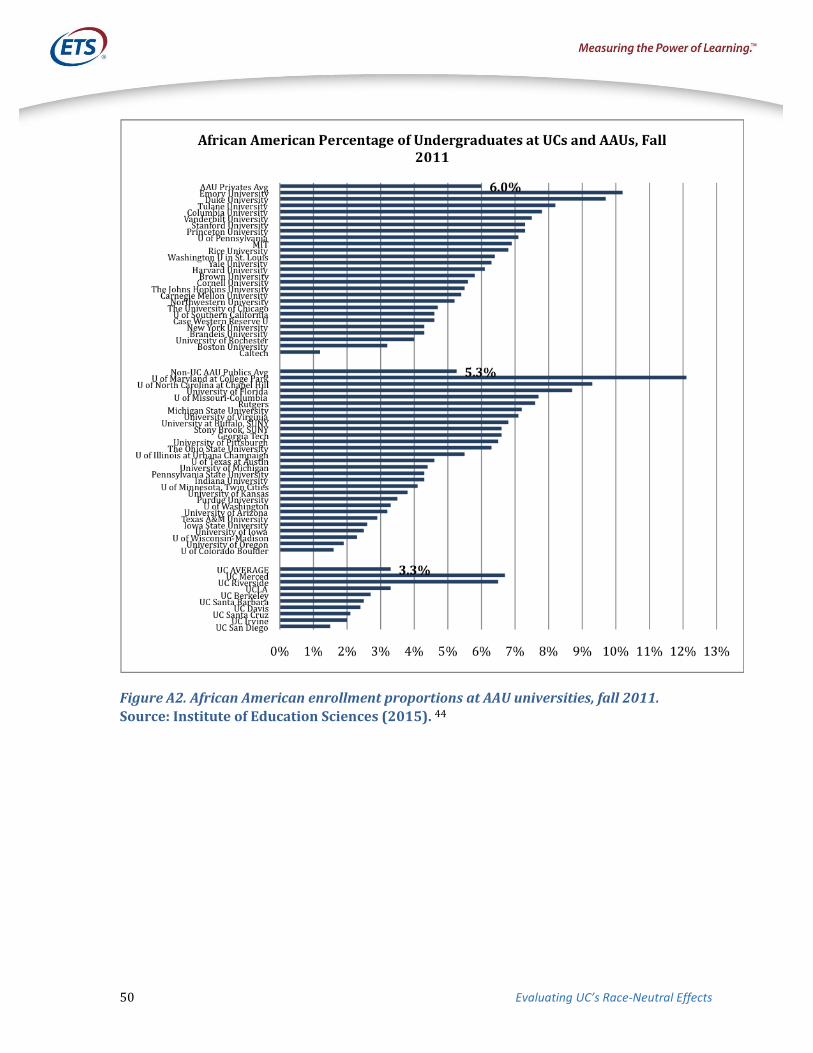
50 Evaluating UC’s Race-Neutral Effects
Figure A2. African American enrollment proportions at AAU universities, fall 2011.
Source: Institute of Education Sciences (2015). 44

Evaluating UC’s Race-Neutral Effects 51
Notes
1 The regents went on to rescind SP-1 in 2001; however, by that time it was state law and so this action was largely symbolic.
2 The regents’ ban took effect at UC graduate and professional schools a year earlier, in 1997.
3 The Organic Act (1868) was later superseded by state constitutional amendments in 1879 and 1918, though some of the original language was retained and it is still looked to as the charter document for UC.
4 More than a century after the Organic Act (1868), in 1974, the California Assembly passed a resolution that while not constitutionally binding on UC, stated, “Each segment of California public higher education shall strive to approximate… the general ethnic, sexual and economic composition of the recent high school graduates” (UCOP Outreach Task Force, 1997, p. 6).
5 Even after several years of recovery from the Great Recession, per-student state funding nationally was down 19% in constant value dollars and only three states were spending more per student (Blumenstyk, 2015, p. A12).
6 This report notes that there is more unevenness in the MESA college destination data due to their information systems prior to 2009–2010.
7 Unfortunately, these students are not tracked after they enroll in college so it is not possible to know to what extent they continue in STEM majors in college.
8 This study was accompanied by other qualitative studies of Puente in the same journal issue.
9 Race/ethnicity was not reported for the 418 Puente students who transferred to 4-year colleges, however the Puente program, while open to all students, is very heavily Latino given that its focus is on this group.
10 The 15 SAPEP programs include: ArtsBridge (to increase education professionals), Community College Transfer (to increase transfer from the community colleges), Community College Articulation (maintain 2- and 4-year articulation agreements), Community College Assist (track articulation), EAOP, Graduate and Professional School Programs (increase graduate enrollment), K-20 Intersegmental Alliances (increase capacity of schools to offer college preparatory curricula), MESA Community College, MESA Schools program, Puente High School, Puente Community College, Student Initiated Programs (university student-based outreach to schools), UC Scout (online college preparatory curricula), UC Links (university students help prepare K-12 students in college preparatory courses and information on graduate education), and University-Community Engagement (information and support for high school college preparatory course completion and passage of exit exams). Full explanation of the programs and numbers of students served are found in UCOP (2013).
11 Most SAPEP programs have modest per-pupil costs. An exception was the Preuss Charter School at UCSD (enrolling up to 800 students, about two thirds of whom were Latino), which received $1 million annually in state/UC funds in the 2000s, but its SAPEP funding was eliminated in 2011 and it now relies on other funding sources.
12 We note the following nuances in a guideline document prepared by UC’s Office of General Counsel (2007):
Outreach. Proposition 209 prohibits outreach programs that are targeted exclusively to or available exclusively for one gender or one or more particular racial group, when such efforts provide informational or other advantages to candidates who have access to them. Nevertheless, the University may, as part of a comprehensive program of outreach, target or increase specific efforts within that program to reach particular groups where the program’s benefits are available

52 Evaluating UC’s Race-Neutral Effects
broadly to other groups, and the special efforts are necessary to reach the targeted group’s members effectively and therefore to “level the informational playing field.”
Programs of Particular Interest to Particular Groups. The University may lawfully sponsor programs, such as outreach programs and informational events that may, because of their content, be of particular interest to members of particular racial groups or one gender.
13 In California, Native Americans tend to be widely dispersed in mostly urban areas so that there are few clusters of these students that can be targeted by school or community.
14 When a high school student in a SAPEP program ends up enrolling at a CU campus or community college and otherwise would not have progressed to higher education, we are not dismissive of the important social good at play in such circumstances. Rather, we simply mean to emphasize in this paper that such important matters/questions are beyond the scope of our inquiry into UC and race-neutral alternatives.
15 Selectivity has several dimensions and this figure is not intended to suggest that selectivity at UC Riverside has now reached the same level as UC Berkeley in the mid-1990s.
16 UC Merced was opened in 2005, though as of 2014 it has enrolled only 5,900 undergraduate students.
17 Data for the UC system, UC Berkeley, and UCLA are from UCOP (2012). Data on California public high school graduates are from the California Department of Finance’s estimates (provided via UCOP). High school graduate numbers for 2010 and 2011 are estimated.
18 A key example is the Schuette merit brief by Michigan’s Attorney Bill Schuette (Brief for Petitioner at Schuette v. BAMN, 2012). As noted earlier, this brief was strongly criticized in Justice Sotomayor’s dissenting opinion (Schuette v. BAMN, 2014 [Sotomayor, J., dissenting]; see also Brief of Civil Rights Project/Proyecto Derechos Civiles, 2013; Kidder, 2013b).
19 See footnote immediately above regarding data sources.
20 Between the admissions stage and the enrollment stage is the important issue of yield rates—the proportion of students who choose to accept an admission offer. Yield rates represent a rather complex topic (Long, 2007, p. 318 [reporting that initial studies of affirmative action bans showed a mixture of declines and increases in yield rates at selective universities]). One of us has written elsewhere about the negative impact of Prop 209 on URM yield rates (Kidder, 2012; Kidder & Onwuachi-Willig, 2014). In an earlier peer-reviewed study Geiser and Caspary (2005) likewise found that Prop 209 was associated with a drop in UC yield rates for the most competitive URM candidates. There is one study by Antonovics and Sander (2013) claiming that Prop 209 resulted in a warming effect on URM yield rates. However, this claim has been criticized as resulting from several methodological confounders, including a once-in-a-lifetime drop in UC tuition costs that occurred in 1998 and 1999 when Prop 209 coincidentally took effect (see Kidder, 2012; Kidder & Onwuachi-Willig, 2014).
21 For amici briefs reviewing this literature, see Brief for Civil Rights Project/Proyecto Derechos Civiles (2013) and Brief for Association of American Medical Colleges et al. (2013).
22 The AAU represents 60 of the most prestigious research universities in the United States, split between 34 publics and 26 privates (AAU, n.d.). The AAU also includes two Canadian universities not included in the comparisons in this paper.
23 California’s population of African American public high school graduates (7.0%) is lower than the national average (14.9%) and is projected to stay that way (Western Interstate Commission for Higher Education, 2012).
24 Though beyond the scope of our present paper, affirmative action programs for Native American communities can have different conceptual and historical moorings, including that programs initiated on the basis of the political classification of membership in a federally recognized tribe is potentially legally

Evaluating UC’s Race-Neutral Effects 53
distinct from programs based on racial and ethnic categories (see Goldberg, 2002; Reynoso & Kidder, 2008; Rolnick, 2011).
25 Too often, the umbrella underrepresented minority category is the primary means by which American Indian students are discussed in the social science literature about affirmative action and race-neutral alternatives; for multiple reasons including small sample sizes at individual campuses American Indians are not always analyzed separately in the literature. An exception is Hinrichs (2012, Tables 4–5), who conducted disaggregated analyses and found that American Indian access would decline substantially for American Indian freshmen at U.S. News top 50 universities (especially top 50 publics) under race-blind admission simulations.
26 The last year these data were available from CPEC is 2012. The CPEC was closed down by the governor, and this is an estimate about when these data were last updated.
27 One notable difference is that UT Austin and Texas A&M are among the largest public institutions in the U.S. with combined current undergraduate enrollment of 84,051, whereas UC Berkeley and UCLA (the two most selective publics in California) have combined undergraduate enrollment of 54,625. This fact, combined with California having a much larger base of high school graduates, helps to explain why there was never the carrying capacity in California to allow students ranked in the top 10% to be guaranteed admission to the UC campus of their choice.
28 Somewhat different from the Texas Top Ten Percent Plan, under ELC students still must complete at least 15 UC-approved college preparatory classes (called A-G courses) by the time they graduate from high school. A student with a high class rank but insufficient A-G courses will not be eligible for ELC.
29 The regents instituted policy regarding comprehensive review in 2001 after what was viewed as a successful experiment by the UC Berkeley campus, which began in 1998.
30 Additional grade points are awarded for AP and honors courses, classes that are often less (or not) available in low performing schools. See University of California Admissions (n.d.). It should be noted, however, that the individual campuses post somewhat different, and higher, freshman admit GPAs than the systemwide website.
31 Approximately 6% of applicants were referred to supplemental review.
32 We add 0.8% Native American, which we did not routinely include in analyses because of small numbers.
33 BOARS defines bimodal educational environments as “those where there are two populations in a school whose populations have different opportunities, typically because of the differences between feeder schools” (UC BOARS, 2014, p. 34).
34 Applicants could also take the ACT exam with writing in substitute for the SAT exams, but a very small percentage of applicants opted for the ACT exam.
35 Further discussion of the use of standardized tests to manipulate eligibility pools can found at UC BOARS (2003) and CPEC (1992).
36 And this is a charitable comparison, as the gulf between, for example, UCLA enrolling 36% Pell Grant students versus Michigan enrolling 16% suggests major differences also in the proportion of institutional gift aid that is earmarked for low-income students.
37 At the institutions in this study the number of Latinos reporting feeling respected was likely higher across the board because Latinos were less likely than African Americans to encounter acute racial isolation, but these findings are skewed toward sunbelt universities and should not be presumed to generalize to other parts of the country where a college campus might have a larger African American population and a smaller Latino population.

54 Evaluating UC’s Race-Neutral Effects
38 These results are also consistent with an earlier qualitative study of racial climate at UC Berkeley by Solorzano, Allen, and Carroll (2002), who found that underrepresented minority students at UC Berkeley shortly after the implementation of Prop 209 felt marginalized, with harmful consequences in the classroom (e.g., URM students keeping silent in class discussions).
39 To close the loop on our earlier discussion of SAPEP (academic preparation) programs, UC’s post-baccalaureate premedical programs have been subject to significant budget cuts in the last decade notwithstanding the finding that these premed programs are effective in both boosting enrollment of diverse students in medical school and yielding physicians more likely to practice in high-Latino and high-African American communities. (Grumbach & Chen, 2006; Lupton, Vercammen-Grandjean, Forkin, Wilson, & Grumbach, 2012; UCOP, Budget and Capital Resources, 2011).
40 The latest year available from CPEC was 2010. American Indians are not displayed in this chart due to low sample numbers and high fluctuations from year to year, but overall American Indian UC professional school graduates declined from 0.99% of the degree recipients in 1996–1999 to 0.69% in 2000–2010.
41 These comparisons are imprecise because current NSF data track the top 20 (not top 50) institutions and for multiple other reasons.
42 We are not suggesting that faculty should mirror state demographics, since UC campuses compete for faculty from across the country and indeed the world. Our point relates to the students’ perspective and the world they encounter in the classroom versus the broader society.
43 Compare Bowen et al. (2009) with the essay “UC as an Engine of Social Mobility: Successes, Challenges and Concerns” in UCOP (2011).
44 Many of the institutions with similarly low African American enrollment are in states with low African American populations (Colorado, Iowa, Oregon) or are at institutions without race-conscious affirmative action (Texas A&M, University of Washington, and a ban at the University of Arizona that partly influenced 2011 figures).