twin-plate ice nucleation assay (tina) with infrared
TRANSCRIPT

Atmos. Meas. Tech., 11, 6327–6337, 2018https://doi.org/10.5194/amt-11-6327-2018© Author(s) 2018. This work is distributed underthe Creative Commons Attribution 4.0 License.
Twin-plate Ice Nucleation Assay (TINA) with infrared detection forhigh-throughput droplet freezing experiments with biological icenuclei in laboratory and field samplesAnna T. Kunert1, Mark Lamneck2, Frank Helleis2, Ulrich Pöschl1, Mira L. Pöhlker1, and Janine Fröhlich-Nowoisky1
1Multiphase Chemistry Department, Max Planck Institute for Chemistry, 55128 Mainz, Germany2Instrument Development and Electronics, Max Planck Institute for Chemistry, 55128 Mainz, Germany
Correspondence: Janine Fröhlich-Nowoisky ([email protected]) and Mira L. Pöhlker ([email protected])
Received: 11 July 2018 – Discussion started: 24 July 2018Revised: 7 November 2018 – Accepted: 11 November 2018 – Published: 23 November 2018
Abstract. For efficient analysis and characterization of bio-logical ice nuclei under immersion freezing conditions, wedeveloped the Twin-plate Ice Nucleation Assay (TINA) forhigh-throughput droplet freezing experiments, in which thetemperature profile and freezing of each droplet is tracked byan infrared detector. In the fully automated setup, a coupleof independently cooled aluminum blocks carrying two 96-well plates and two 384-well plates, respectively, are avail-able to study ice nucleation and freezing events simultane-ously in hundreds of microliter-range droplets (0.1–40 µL). Acooling system with two refrigerant circulation loops is usedfor high-precision temperature control (uncertainty< 0.2 K),enabling measurements over a wide range of temperatures(∼ 272–233 K) at variable cooling rates (up to 10 K min−1).
The TINA instrument was tested and characterized in ex-periments with bacterial and fungal ice nuclei (IN) fromPseudomonas syringae (Snomax®) and Mortierella alpina,exhibiting freezing curves in good agreement with literaturedata. Moreover, TINA was applied to investigate the influ-ence of chemical processing on the activity of biological IN,in particular the effects of oxidation and nitration reactions.Upon exposure of Snomax® to O3 and NO2, the cumulativenumber of IN active at 270–266 K decreased by more than1 order of magnitude. Furthermore, TINA was used to studyaqueous extracts of atmospheric aerosols, simultaneously in-vestigating a multitude of samples that were pre-treated indifferent ways to distinguish different kinds of IN. For ex-ample, heat treatment and filtration indicated that most bi-ological IN were larger than 5 µm. The results confirm thatTINA is suitable for high-throughput experiments and effi-
cient analysis of biological IN in laboratory and field sam-ples.
1 Introduction
Clouds and aerosols still contribute the largest uncertaintyto the evaluation of the Earth’s changing energy budget(Boucher et al., 2013). Thus, the understanding of the contri-bution of atmospheric aerosols in cloud processes is of fun-damental importance. Atmospheric ice nucleation is essentialfor cloud glaciation and precipitation, thereby influencing thehydrological cycle and climate. Ice can be formed via homo-geneous nucleation in liquid water droplets or heterogeneousnucleation triggered by particles serving as atmospheric icenuclei (IN) (Pruppacher and Klett, 1997).
A wide range of droplet freezing assays and instrumentshave been developed and applied for the analysis of IN in im-mersion freezing experiments (e.g., Budke and Koop, 2015;Fröhlich-Nowoisky et al., 2015; Häusler et al., 2018; Mur-ray et al., 2010; O’Sullivan et al., 2014; Stopelli et al., 2014;Tobo, 2016; Vali, 1971b; Whale et al., 2015; Wright and Pet-ters, 2013; Zaragotas et al., 2016). Most of the available as-says and instruments, however, are limited to the investiga-tion of small droplet numbers and use optical detection sys-tems in the UV–Vis wavelength range.
Infrared (IR) detectors enable efficient detection of dropletfreezing (Harrison et al., 2018; Zaragotas et al., 2016). Uponthe phase change of water from liquid to solid, latent heatis released resulting in a sudden temperature change of the
Published by Copernicus Publications on behalf of the European Geosciences Union.
6328 A. T. Kunert et al.: Twin-plate Ice Nucleation Assay (TINA)
droplet, which can be detected by IR video thermography.In 1995, Ceccardi et al. (1995) used IR video thermographyas a new technique to non-destructively study ice formationon plants by visualizing the changes in surface temperature.Wisniewski et al. (1997) evaluated the IR video thermog-raphy under controlled conditions and determined it as anexcellent method for directly observing ice nucleation andpropagation in plants. Since then, IR video thermographyhas been used in a range of studies investigating freezing inplants (e.g., Ball et al., 2002; Carter et al., 1999; Charrier etal., 2017; Fuller and Wisniewski, 1998; Hacker and Neuner,2007; Pearce and Fuller, 2001; Sekozawa et al., 2004; Stier etal., 2003; Wisniewski et al., 2008; Workmaster, 1999). Fur-ther applications of IR video thermography are investigationsof cold thermal stress in insects (Gallego et al., 2016), mon-itoring of freeze-drying processes (Emteborg et al., 2014),as well as detection of ice in wind turbine blades (GómezMuñoz et al., 2016) and helicopter rotor blades (Hansmanand Dershowitz, 1994). Freezing of single water droplets inan acoustic levitator has also been successfully observed byIR video thermography (Bauerecker et al., 2008).
Here, we introduce the Twin-plate Ice Nucleation Assay(TINA) for high-throughput droplet freezing experiments, inwhich the temperature profile and freezing of each droplet istracked by an infrared detector. In the fully automated setup,a couple of independently cooled aluminum blocks are avail-able to study ice nucleation and freezing events in nearly1000 microliter-range droplets simultaneously. The instru-ment was developed in the course of the INUIT project overthe last three years, in which it has been presented and dis-cussed at several conferences and workshops (Kunert et al.,2016a,b, 2017a,b, 2018). We use the bacterial IN Snomax®
and the IN-active fungus Mortierella alpina as biologicaltest substances to investigate heterogeneous ice nucleation.Moreover, TINA is applied to investigate the effect of O3and NO2 exposure on the IN activity of Snomax®. Further-more, aqueous extracts of atmospheric aerosols are treated indifferent ways and are analyzed for different kinds of IN.
2 Experimental setup
2.1 Technical details
The core of TINA is composed of two independently cooled,customized sample holder aluminum blocks, which havebeen shaped for multiwell plates with 96 and 384 wells, re-spectively. In each cooling block, two multiwell plates can beanalyzed simultaneously. The maximal droplet volume in the96-well block is 250 µL, and the minimal droplet volume is0.1 µL, which is the limit of our liquid handling station (ep-Motion ep5073, Eppendorf, Hamburg, Germany). For eachexperiment, new sterile multiwell plates are used (96-well:Axon Labortechnik, Kaiserslautern, Germany, 384-well: Ep-pendorf, Hamburg, Germany). As shown in Fig. 1, the design
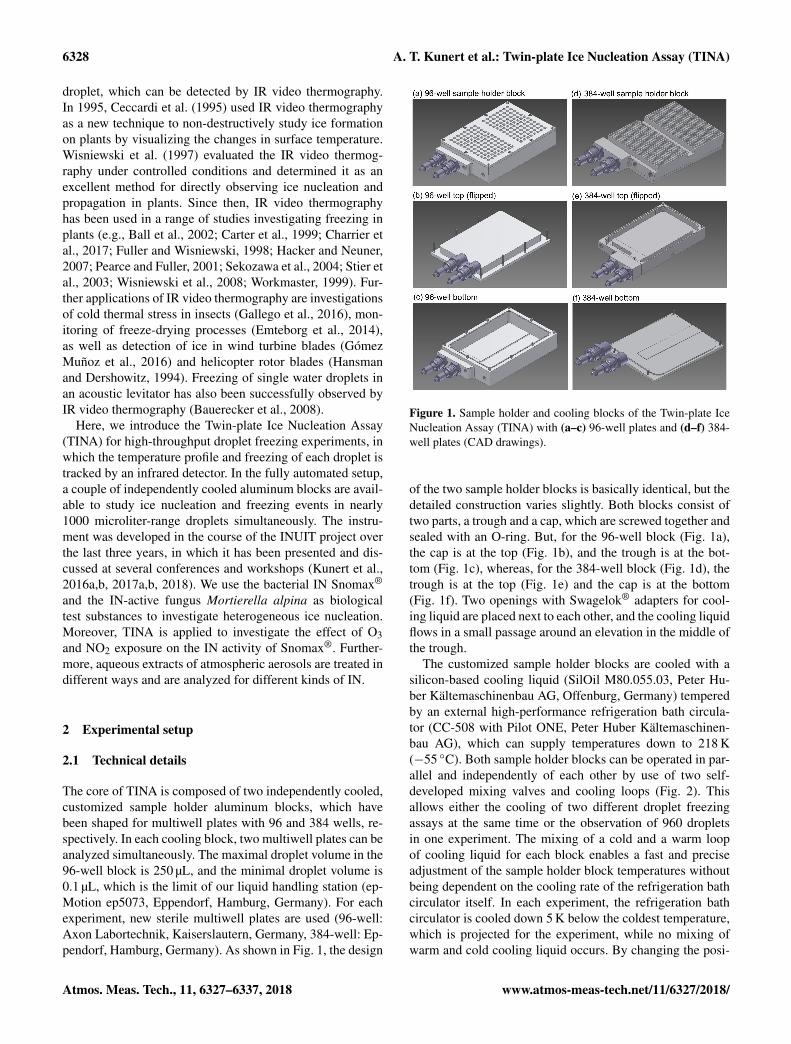
Figure 1. Sample holder and cooling blocks of the Twin-plate IceNucleation Assay (TINA) with (a–c) 96-well plates and (d–f) 384-well plates (CAD drawings).
of the two sample holder blocks is basically identical, but thedetailed construction varies slightly. Both blocks consist oftwo parts, a trough and a cap, which are screwed together andsealed with an O-ring. But, for the 96-well block (Fig. 1a),the cap is at the top (Fig. 1b), and the trough is at the bot-tom (Fig. 1c), whereas, for the 384-well block (Fig. 1d), thetrough is at the top (Fig. 1e) and the cap is at the bottom(Fig. 1f). Two openings with Swagelok® adapters for cool-ing liquid are placed next to each other, and the cooling liquidflows in a small passage around an elevation in the middle ofthe trough.
The customized sample holder blocks are cooled with asilicon-based cooling liquid (SilOil M80.055.03, Peter Hu-ber Kältemaschinenbau AG, Offenburg, Germany) temperedby an external high-performance refrigeration bath circula-tor (CC-508 with Pilot ONE, Peter Huber Kältemaschinen-bau AG), which can supply temperatures down to 218 K(−55 ◦C). Both sample holder blocks can be operated in par-allel and independently of each other by use of two self-developed mixing valves and cooling loops (Fig. 2). Thisallows either the cooling of two different droplet freezingassays at the same time or the observation of 960 dropletsin one experiment. The mixing of a cold and a warm loopof cooling liquid for each block enables a fast and preciseadjustment of the sample holder block temperatures withoutbeing dependent on the cooling rate of the refrigeration bathcirculator itself. In each experiment, the refrigeration bathcirculator is cooled down 5 K below the coldest temperature,which is projected for the experiment, while no mixing ofwarm and cold cooling liquid occurs. By changing the posi-
Atmos. Meas. Tech., 11, 6327–6337, 2018 www.atmos-meas-tech.net/11/6327/2018/

A. T. Kunert et al.: Twin-plate Ice Nucleation Assay (TINA) 6329
Figure 2. Cooling system layout and operating principle of theTwin-plate Ice Nucleation Assay (TINA). (a) Cooling liquid ispumped in warm cooling loop of sample holder block 1 withoutconnection to colder cooling liquid provided by refrigeration bathcirculator. (b) Mixing valve is opened for both warm cooling liq-uid of warm cooling loop and cold cooling liquid of refrigerationbath circulator. Position of mixing valve defines temperature withinsample holder block 1. (c) Sample holder block 1 is cooled furtherdown, while cooling liquid is pumped in warm cooling loop of sam-ple holder block 2. (d) Sample holder block 2 can be run in parallelindependently of the temperature in sample holder block 1.
Figure 3. Schematic illustration of the overall setup: sample holderblocks, sample holders with droplets, IR cameras, cooling systemwith refrigeration bath circulator, pumps and mixing valves, com-puter control.
tion of the mixing valves for a defined period of time, coldand warm cooling liquids are mixed together so that the de-sired temperatures within the two blocks are reached. Twopumps (VPP-655 PWM Single Version, Alphacool Interna-tional GmbH, Braunschweig, Germany) ensure the contin-uous circulation of cooling liquid through each block inde-pendently of the position of the mixing valves. Figure 3 is aschematic illustration of the overall setup of TINA.
2.2 Temperature control and calibration
Within each sample holder block, the temperature is mea-sured with two temperature sensors, an NTC thermis-tor in the cooling liquid stream (TH-44033, resistance:2255�/298 K, interchangeability:±0.1 K, Omega Engineer-ing GmbH, Deckenpfronn, Germany) and a customizedsensor with an NTC thermistor (10K3MRBD1, resistance:10000�/298 K, interchangeability: ±0.2 K, TE Connectiv-ity Company, Galway, Ireland) and a thermocouple (K type,0.08 mm diameter, Omega), which were glued together ina 1/8 in. Swagelok® pipe, placed inside the elevated cen-tral part of the block. With further thermocouples con-nected to this reference, this offers the possibility of mea-suring temperature differences between the NTC thermistorand arbitrary points simultaneously. Another NTC thermis-tor (10K3MRBD1, resistance: 10000�/298 K, interchange-ability: ±0.2 K, TE Connectivity Company) monitors thetemperature behind each mixing valve. Temperature con-trol within the entire system is achieved by a self-developedmicrocontroller-based electronic system. The analog inputunit is equipped with a low-noise, 24 bit ADC (ADS1256,Texas Instruments Incorporated, Dallas, TX, USA), whichassures the required accuracy to process the resolution of theused thermistors. All thermistors had been calibrated with areference thermometer (2180A, Fluke Deutschland GmbH,Glottertal, Germany; 0.01 K resolution, system uncertaintyδFluke: ±0.08 K at 223 K and ±0.07 K at 273 K). Therefore,all thermistors were bound together with a PT100 sensor ofthe reference thermometer, and the bundle was placed insidea brass cylinder filled with cooling liquid. The cylinder wasplaced inside the cooling bath of the refrigeration bath circu-lator. The temperature within the bath was cooled down from303.2 to 218.2 K (30.0 to −55.0 ◦C) in 5 K steps, warmed to220.7 K (−52.5 ◦C), and raised again from 220.7 to 300.7 K(−52.5 to 27.5 ◦C) in 5 K steps. Each step was kept for30 min to equilibrate the temperature, while the resistanceof all thermistors and the temperature measured by the ref-erence thermometer were monitored. For the conversion ofthe measured resistance of the thermistors into tempera-ture, cubic spline interpolation was used (δIpol < 0.01 K).We obtained the thermistor calibration uncertainty δThermistor< 0.09 K (δThermistor = δFluke+ δIpol).
To determine a potential temperature gradient of the sam-ple holder blocks, two thermocouples (K type, 0.08 mm di-ameter, Omega) were positioned in various wells of multi-well plates (Fig. S1a and b in the Supplement), each filledwith 30 µL pure water (see Sect. 3.1). These thermocoupleswere connected to the thermocouple in the elevation of eachsample holder block, and the temperature offset betweensample holder block and wells was measured for a contin-uous cooling rate of 1 K min−1 (Fig. S1c). Below −2 ◦C, thetemperature offset between sample holder block and wells isnearly constant, in this example ∼ 0.16 and ∼ 0.19 K. Themeasurement was performed in duplicate for all observed
www.atmos-meas-tech.net/11/6327/2018/ Atmos. Meas. Tech., 11, 6327–6337, 2018
6330 A. T. Kunert et al.: Twin-plate Ice Nucleation Assay (TINA)
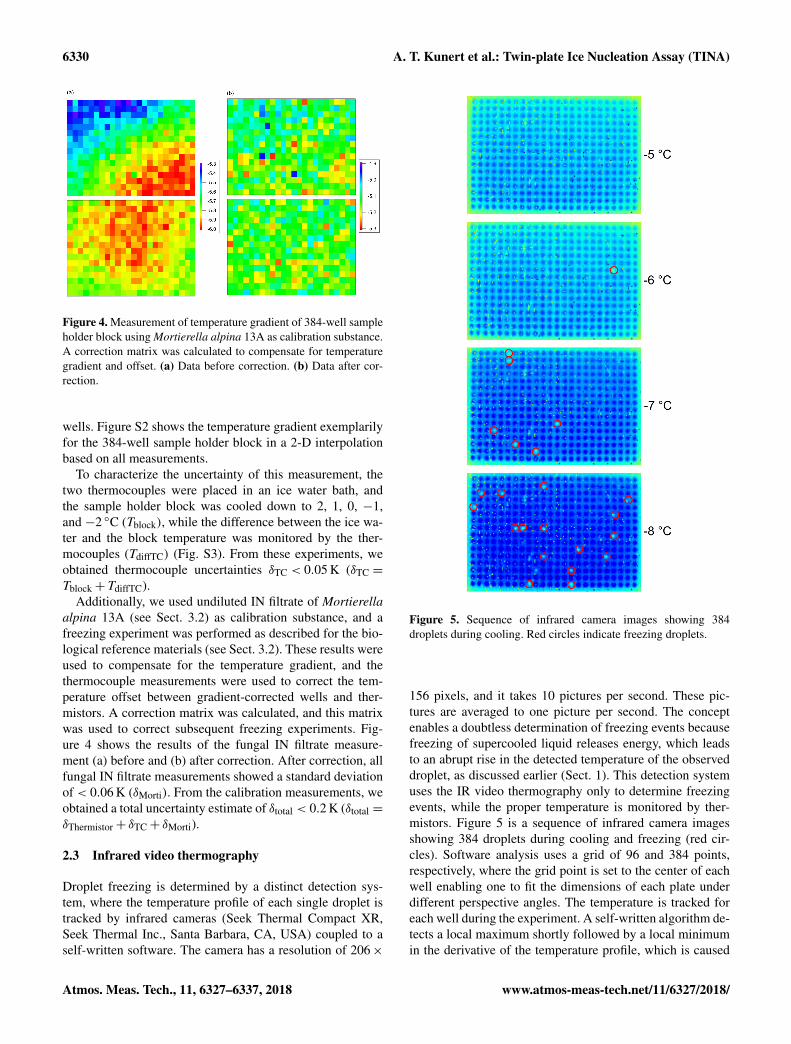
Figure 4. Measurement of temperature gradient of 384-well sampleholder block using Mortierella alpina 13A as calibration substance.A correction matrix was calculated to compensate for temperaturegradient and offset. (a) Data before correction. (b) Data after cor-rection.
wells. Figure S2 shows the temperature gradient exemplarilyfor the 384-well sample holder block in a 2-D interpolationbased on all measurements.
To characterize the uncertainty of this measurement, thetwo thermocouples were placed in an ice water bath, andthe sample holder block was cooled down to 2, 1, 0, −1,and −2 ◦C (Tblock), while the difference between the ice wa-ter and the block temperature was monitored by the ther-mocouples (TdiffTC) (Fig. S3). From these experiments, weobtained thermocouple uncertainties δTC < 0.05 K (δTC =
Tblock+ TdiffTC).Additionally, we used undiluted IN filtrate of Mortierella
alpina 13A (see Sect. 3.2) as calibration substance, and afreezing experiment was performed as described for the bio-logical reference materials (see Sect. 3.2). These results wereused to compensate for the temperature gradient, and thethermocouple measurements were used to correct the tem-perature offset between gradient-corrected wells and ther-mistors. A correction matrix was calculated, and this matrixwas used to correct subsequent freezing experiments. Fig-ure 4 shows the results of the fungal IN filtrate measure-ment (a) before and (b) after correction. After correction, allfungal IN filtrate measurements showed a standard deviationof < 0.06 K (δMorti). From the calibration measurements, weobtained a total uncertainty estimate of δtotal < 0.2 K (δtotal =
δThermistor+ δTC+ δMorti).
2.3 Infrared video thermography
Droplet freezing is determined by a distinct detection sys-tem, where the temperature profile of each single droplet istracked by infrared cameras (Seek Thermal Compact XR,Seek Thermal Inc., Santa Barbara, CA, USA) coupled to aself-written software. The camera has a resolution of 206×
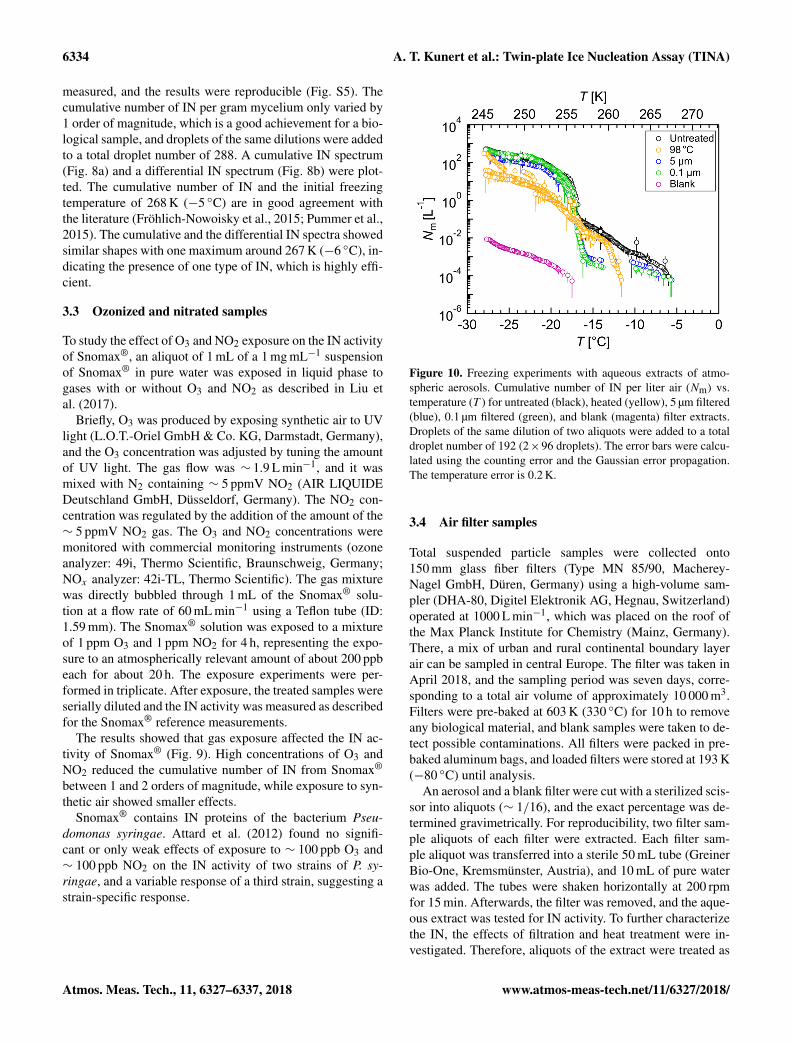
Figure 5. Sequence of infrared camera images showing 384droplets during cooling. Red circles indicate freezing droplets.
156 pixels, and it takes 10 pictures per second. These pic-tures are averaged to one picture per second. The conceptenables a doubtless determination of freezing events becausefreezing of supercooled liquid releases energy, which leadsto an abrupt rise in the detected temperature of the observeddroplet, as discussed earlier (Sect. 1). This detection systemuses the IR video thermography only to determine freezingevents, while the proper temperature is monitored by ther-mistors. Figure 5 is a sequence of infrared camera imagesshowing 384 droplets during cooling and freezing (red cir-cles). Software analysis uses a grid of 96 and 384 points,respectively, where the grid point is set to the center of eachwell enabling one to fit the dimensions of each plate underdifferent perspective angles. The temperature is tracked foreach well during the experiment. A self-written algorithm de-tects a local maximum shortly followed by a local minimumin the derivative of the temperature profile, which is caused
Atmos. Meas. Tech., 11, 6327–6337, 2018 www.atmos-meas-tech.net/11/6327/2018/

A. T. Kunert et al.: Twin-plate Ice Nucleation Assay (TINA) 6331
by the release of latent heat during freezing. The softwareexports the data for each droplet in CSV format.
2.4 Data analysis
Assuming ice nucleation as a time-independent (singular)process, the number concentration of IN (1Nm
1T) active at a
certain temperature (T ) per unit mass of material is given byEq. (1) (Vali, 1971a).
1Nm
1T(T )=− ln
(1−
s
a−∑j
i=0s
)·c
1T;0≤ j ≤ a (1)
with c =Vwash
Vdrop·d
m, (2)
where s is the number of freezing events in 0.1 K bins (1T ),a is the number of all droplets, m is the mass of the particlesin the initial suspension, Vwash is the volume of the initialsuspension, Vdrop is the droplet volume, and d is the dilutionfactor of the droplets relative to m. The measurement uncer-tainty (δ1Nm
1T(T )) was calculated using the counting error of
s plus one digit and the Gaussian error propagation (Eq. 3).
δ1Nm
1T(T )=
√√√√√ 1
1− s
a−∑ji=0s
·c
1T·
√s+ 1
a−∑j
i=0s
2
+
11− s
a−∑ji=0s
·c
1T·
s ·
√∑j
i=0s+ 1(a−
∑j
i=0s)2
2
(3)
The cumulative IN number concentration (Nm(T )) is givenby Eq. (4).
Nm (T )=− ln
(1−
∑j
i=0s
a
)· c ;0≤ j ≤ a (4)
The error of the cumulative IN number concentration(δNm(T )) was calculated using Eq. (5).
δNm(T )=
√√√√√√ c
1−∑ji=0s
a
·
√∑j
i=0s+ 1
a
2
(5)
According to the above equations, the uncertainty is propor-tional to the number of frozen droplets per temperature bin.In the freezing experiments described below, the lowest num-ber of freezing events and largest uncertainties were obtainedat the lower and higher end of each dilution series (Poissondistribution). Data points with uncertainties ≥ 100 % wereexcluded (overall less than 6 % of the measurement data).
3 Freezing experiments
The fully automated TINA setup was tested and character-ized for immersion freezing experiments with pure-water
droplets, as well as Snomax® and IN filtrate of the fungusMortierella alpina as biological reference substances. More-over, TINA was used to study the effect of O3 and NO2 ex-posure on the IN activity of Snomax®. Furthermore, TINAwas applied to atmospheric aerosol samples.
3.1 Pure water
Pure water was obtained from a Barnstead™ GenPure™
xCAD Plus water purification system (Thermo Scientific,Braunschweig, Germany). The water was autoclaved at394 K (121 ◦C) for 20 min, filtered three times through a ster-ile 0.1 µm pore diameter sterile polyethersulfone (PES) vac-uum filter unit (VWR International, Radnor, PA, USA), andautoclaved again.
For background measurements, 3 µL aliquots of auto-claved and filtered pure water were pipetted into new ster-ile multiwell plates by a liquid handling station. Therefore,four (96-well plate) and eight (384-well plate) different wa-ter samples were pipetted column-wise distributed into theplates. In total, six columns per sample were apportionedover the two twin plates, i.e., 48 droplets per sample in 96-well plates, and 96 droplets per sample in 384-well plates.The plates were placed in the sample holder blocks and werecooled down quickly to 273 K (0 ◦C) and, as soon as the tem-perature was stable for 1 min, in a continuous cooling rate of1 K min−1 further down to 238 K (−35 ◦C).
As the phase transition from liquid water to ice is kineti-cally hindered, supercooled water can stay liquid at temper-atures down to 235 K (−38 ◦C), where homogeneous ice nu-cleation takes place. This is only true for nanometer-sizeddroplets because the freezing temperature is dependent ondroplet volume and cooling rate, and the classical nucle-ation theory predicts a homogeneous freezing temperature ofabout 240 K (−33 ◦C) for microliter-volume droplets usinga cooling rate of 1 K min−1 (Fornea et al., 2009; Murray etal., 2010; Pruppacher and Klett, 1997; Tobo, 2016). How-ever, several studies reported average freezing temperaturesfor microliter-volume droplets of pure water at significantlyhigher temperatures because of possible artifacts (e.g., Conenet al., 2011; Fröhlich-Nowoisky et al., 2015; Hill et al., 2016;Whale et al., 2015). To our knowledge, only two studiesreported an average homogeneous freezing temperature of240 K (−33 ◦C) for microliter-volume droplets and a coolingrate of 1 K min−1, using hydrophobic surfaces as a contactarea for the droplets (Fornea et al., 2009; Tobo, 2016). Pro-viding microliter droplets free of suspended IN and surfacesfree of contaminants is difficult, so the temperature limit be-low which freezing cannot be traced back to heterogeneousIN needs to be determined individually for each setup.
Our results showed that most pure-water droplets frozearound 248 K (−25 ◦C) in 96-well plates (Fig. 6a) and around245 K (−28 ◦C) in 384-well plates (Fig. 6b). The 96-wellplates were obtained from a different manufacturer than the384-well plates. All in all, these freezing temperatures are
www.atmos-meas-tech.net/11/6327/2018/ Atmos. Meas. Tech., 11, 6327–6337, 2018

6332 A. T. Kunert et al.: Twin-plate Ice Nucleation Assay (TINA)
Figure 6. Freezing experiments with pure-water droplets. Fraction of frozen droplets (fice) vs. temperature (T ) obtained with a continuouscooling rate of 1 K min−1 and a droplet volume of 3 µL. (a) Four different samples with 48 droplets each apportioned over two 96-well plates.(b) Eight different samples with 96 droplets each apportioned over two 384-well plates. The error bars were calculated using the countingerror and the Gaussian error propagation. The temperature error is 0.2 K.
Figure 7. Measurements of dilution series of bacterial IN (Snomax®). (a) Cumulative number of IN (Nm) and (b) differential number of IN(1Nm/1T ) per unit mass of Snomax® vs. temperature (T ). Droplets of the same dilution of three independent measurements were addedto a total droplet number of 288 (3× 96 droplets). Symbol colors indicate different dilutions; symbol size indicates the number of frozendroplets per 0.1 K bin (s). The error bars were calculated using the counting error and the Gaussian error propagation. The temperature erroris 0.2 K.
substantially above the expected temperatures for homoge-neous nucleation of microliter droplets, but they are in accordwith the results of Whale et al. (2015).
3.2 Biological reference materials
The performance of TINA was further assessed usingSnomax® as a bacterial IN-active reference substance (e.g.,Budke and Koop, 2015; Hartmann et al., 2013; Möhler etal., 2008; Turner et al., 1990; Ward and DeMott, 1989) andIN filtrate of the well-studied IN fungus Mortierella alpina(Fröhlich-Nowoisky et al., 2015; Pummer et al., 2015).
Snomax® was obtained from SMI Snow Makers AG(Thun, Switzerland), and a stock solution was prepared inpure water with an initial mass concentration of 1 mg mL−1.This suspension was then serially diluted 10-fold with purewater by the liquid handling station. The resulting Snomax®
concentrations varied between 1 mg mL−1 and 0.1 ng mL−1,equivalent to a total mass of Snomax® between 3 µg and0.3 pg, respectively, per 3 µL droplet.
Each dilution was pipetted column-wise distributed overthe twin plates as described before in 96 droplets into 384-well plates by the liquid handling station. Two plates at a timewere placed inside the 384-well sample holder block, andthe plates were cooled down quickly to 273 K (0 ◦C) and, as
Atmos. Meas. Tech., 11, 6327–6337, 2018 www.atmos-meas-tech.net/11/6327/2018/

A. T. Kunert et al.: Twin-plate Ice Nucleation Assay (TINA) 6333
Figure 8. Measurements of dilution series of fungal IN (Mortierella alpina 13A). (a) Cumulative number of IN (Nm) and (b) differentialnumber of IN (1Nm/1T ) per unit mass of mycelium vs. temperature (T ). Droplets of the same dilution of three independent measurementswere added to a total droplet number of 288 (3×96 droplets). Symbol colors indicate different dilutions; symbol size indicates the number offrozen droplets per 0.1 K bin (s). The error bars were calculated using the counting error and the Gaussian error propagation. The temperatureerror is 0.2 K.
soon as the temperature was stable for 1 min, in a continuouscooling rate of 1 K min−1 further down to 253 K (−20 ◦C).
Three independent experiments with Snomax® showed re-producible results (Fig. S4), and, therefore, droplets of thesame dilution were added to a total droplet number of 288.The obtained results were plotted in a cumulative and adifferential IN spectrum (Fig. 7). The cumulative IN num-ber concentration represents the total number of IN activeabove a certain temperature. The cumulative IN spectrumshowed two strong increases: around 270 K (−3 ◦C) andaround 265 K (−8 ◦C). These findings are in good agree-ment with the results of Budke and Koop (2015). The dif-ferential IN number concentration was calculated accordingto Vali (1971a), and it represents the number of IN active in aparticular temperature interval. The differential IN spectrumshowed a similar shape as the cumulative IN spectrum with adistinct plateau between 268 and 266 K (−5 and −7 ◦C) andtwo slight maxima, around 269 K (−4 ◦C) and around 264 K(−9 ◦C). This indicates the presence of highly efficient IN,active at a temperature of approximately 269 K (−4 ◦C), andless-efficient IN, active around 264 K (−9 ◦C). The fact thatthe less-efficient IN appeared in higher dilutions implies thatthey occur in higher concentrations than the highly efficientIN. The presence of further IN with lower freezing tempera-tures and low concentrations cannot be excluded.
The analysis of different IN active within a wide tempera-ture range was only possible with the measurement of a dilu-tion series. TINA enables the simultaneous measurement ofsuch a dilution series with high statistics in a short period oftime.
Mortierella alpina 13A was grown on full-strength PDA(VWR International GmbH, Darmstadt, Germany) at 277 K(4 ◦C) for 7 months. Fungal IN filtrate was prepared as de-
Figure 9. Freezing experiments with ozonized and nitrated bacterialIN. Cumulative number of IN (Nm) per unit mass of Snomax® vs.temperature (T ). Droplets of the same dilution of three independentmeasurements were added to a total droplet number of 288 (3× 96droplets). Symbol colors indicate different exposure conditions. Theerror bars were calculated using the counting error and the Gaussianerror propagation. The temperature error is 0.2 K.
scribed previously (Fröhlich-Nowoisky et al., 2015; Pummeret al., 2015) and contained IN from spores and mycelial sur-faces. It was serially diluted 10-fold with pure water by theliquid handling station. The experiment was performed as de-scribed above.
For test measurements with fungal IN, IN filtrate of threedifferent culture plates from Mortierella alpina 13A was
www.atmos-meas-tech.net/11/6327/2018/ Atmos. Meas. Tech., 11, 6327–6337, 2018
6334 A. T. Kunert et al.: Twin-plate Ice Nucleation Assay (TINA)
measured, and the results were reproducible (Fig. S5). Thecumulative number of IN per gram mycelium only varied by1 order of magnitude, which is a good achievement for a bio-logical sample, and droplets of the same dilutions were addedto a total droplet number of 288. A cumulative IN spectrum(Fig. 8a) and a differential IN spectrum (Fig. 8b) were plot-ted. The cumulative number of IN and the initial freezingtemperature of 268 K (−5 ◦C) are in good agreement withthe literature (Fröhlich-Nowoisky et al., 2015; Pummer et al.,2015). The cumulative and the differential IN spectra showedsimilar shapes with one maximum around 267 K (−6 ◦C), in-dicating the presence of one type of IN, which is highly effi-cient.
3.3 Ozonized and nitrated samples
To study the effect of O3 and NO2 exposure on the IN activityof Snomax®, an aliquot of 1 mL of a 1 mg mL−1 suspensionof Snomax® in pure water was exposed in liquid phase togases with or without O3 and NO2 as described in Liu etal. (2017).
Briefly, O3 was produced by exposing synthetic air to UVlight (L.O.T.-Oriel GmbH & Co. KG, Darmstadt, Germany),and the O3 concentration was adjusted by tuning the amountof UV light. The gas flow was ∼ 1.9 L min−1, and it wasmixed with N2 containing ∼ 5 ppmV NO2 (AIR LIQUIDEDeutschland GmbH, Düsseldorf, Germany). The NO2 con-centration was regulated by the addition of the amount of the∼ 5 ppmV NO2 gas. The O3 and NO2 concentrations weremonitored with commercial monitoring instruments (ozoneanalyzer: 49i, Thermo Scientific, Braunschweig, Germany;NOx analyzer: 42i-TL, Thermo Scientific). The gas mixturewas directly bubbled through 1 mL of the Snomax® solu-tion at a flow rate of 60 mL min−1 using a Teflon tube (ID:1.59 mm). The Snomax® solution was exposed to a mixtureof 1 ppm O3 and 1 ppm NO2 for 4 h, representing the expo-sure to an atmospherically relevant amount of about 200 ppbeach for about 20 h. The exposure experiments were per-formed in triplicate. After exposure, the treated samples wereserially diluted and the IN activity was measured as describedfor the Snomax® reference measurements.
The results showed that gas exposure affected the IN ac-tivity of Snomax® (Fig. 9). High concentrations of O3 andNO2 reduced the cumulative number of IN from Snomax®
between 1 and 2 orders of magnitude, while exposure to syn-thetic air showed smaller effects.
Snomax® contains IN proteins of the bacterium Pseu-domonas syringae. Attard et al. (2012) found no signifi-cant or only weak effects of exposure to ∼ 100 ppb O3 and∼ 100 ppb NO2 on the IN activity of two strains of P. sy-ringae, and a variable response of a third strain, suggesting astrain-specific response.
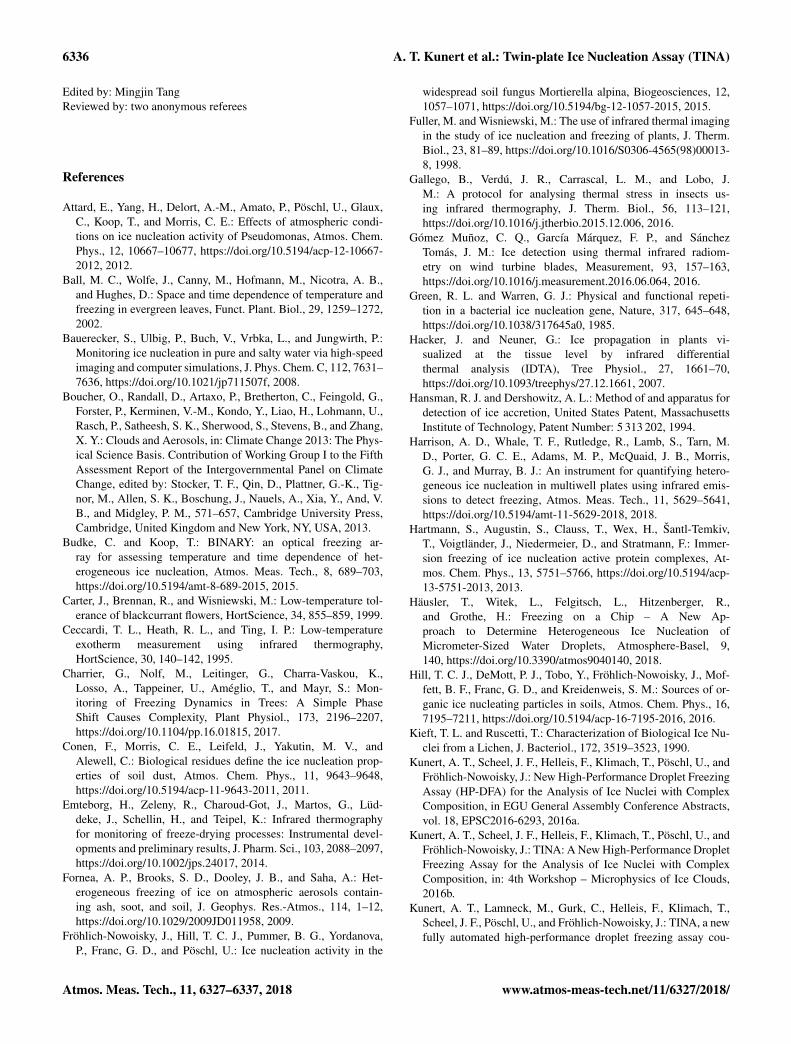
Figure 10. Freezing experiments with aqueous extracts of atmo-spheric aerosols. Cumulative number of IN per liter air (Nm) vs.temperature (T ) for untreated (black), heated (yellow), 5 µm filtered(blue), 0.1 µm filtered (green), and blank (magenta) filter extracts.Droplets of the same dilution of two aliquots were added to a totaldroplet number of 192 (2×96 droplets). The error bars were calcu-lated using the counting error and the Gaussian error propagation.The temperature error is 0.2 K.
3.4 Air filter samples
Total suspended particle samples were collected onto150 mm glass fiber filters (Type MN 85/90, Macherey-Nagel GmbH, Düren, Germany) using a high-volume sam-pler (DHA-80, Digitel Elektronik AG, Hegnau, Switzerland)operated at 1000 L min−1, which was placed on the roof ofthe Max Planck Institute for Chemistry (Mainz, Germany).There, a mix of urban and rural continental boundary layerair can be sampled in central Europe. The filter was taken inApril 2018, and the sampling period was seven days, corre-sponding to a total air volume of approximately 10 000 m3.Filters were pre-baked at 603 K (330 ◦C) for 10 h to removeany biological material, and blank samples were taken to de-tect possible contaminations. All filters were packed in pre-baked aluminum bags, and loaded filters were stored at 193 K(−80 ◦C) until analysis.
An aerosol and a blank filter were cut with a sterilized scis-sor into aliquots (∼ 1/16), and the exact percentage was de-termined gravimetrically. For reproducibility, two filter sam-ple aliquots of each filter were extracted. Each filter sam-ple aliquot was transferred into a sterile 50 mL tube (GreinerBio-One, Kremsmünster, Austria), and 10 mL of pure waterwas added. The tubes were shaken horizontally at 200 rpmfor 15 min. Afterwards, the filter was removed, and the aque-ous extract was tested for IN activity. To further characterizethe IN, the effects of filtration and heat treatment were in-vestigated. Therefore, aliquots of the extract were treated as
Atmos. Meas. Tech., 11, 6327–6337, 2018 www.atmos-meas-tech.net/11/6327/2018/

A. T. Kunert et al.: Twin-plate Ice Nucleation Assay (TINA) 6335
follows: (i) 1 h at 371 K (98 ◦C), (ii) filtration through a 5 µmpore diameter filter (Acrodisc®, PES, Pall GmbH, Dreieich,Germany), (iii) filtration through a 5 and a 0.1 µm pore diam-eter filter (Acrodisc®).
Each solution (96 aliquots of 3 µL) was pipetted column-wise into 384-well plates by the liquid handling station. Theplates were cooled down quickly to 273 K (0 ◦C) and, as soonas the temperature was stable for 1 min, at a continuous cool-ing rate of 1 K min−1 further down to 243 K (−30 ◦C).
Each solution of the two aliquots of each filter was mea-sured separately, and droplets of the same solution wereadded to a total droplet number of 192 (2× 96 droplets)(Figs. 10 and S6). All IN concentrations were calculated perliter air.
The untreated filter extract showed IN activity at rela-tively high temperatures with an initial freezing temperatureof 267 K (−6 ◦C). The concentration of IN active at temper-atures above 263 K (−10 ◦C) was about 0.001 L−1, but heattreatment led to a loss of IN activity above 263 K (−10 ◦C).Because the activity of known biological IN results from pro-teins or proteinaceous compounds (Green and Warren, 1985;Kieft and Ruscetti, 1990; Pouleur et al., 1992; Tsumuki andKonno, 1994) and proteins are known to be heat-sensitive,the results suggest the presence of biological IN. The concen-tration of IN between 263 K (−10 ◦C) and 257 K (−16 ◦C)increased about 2 orders of magnitude and in a sudden in-crease another 2 orders between 257 K (−16 ◦C) and 256 K(−17 ◦C). The IN concentration below 256 K (−17 ◦C) in-creased continuously up to about 500 L−1, but heat treatmentreduced the IN concentration of up to 1 order of magnitudebelow 256 K (−17 ◦C). Filtration experiments did not affectthe initial freezing temperature, but the concentration of bi-ological IN decreased significantly. The results suggest thepresence of many biological IN or agglomerates larger than5 µm and of a few biological IN smaller than 0.1 µm. The cu-mulative number of IN active between 263 K (−10 ◦C) and257 K (−16 ◦C) decreased up to 2 orders of magnitude uponfiltration, but the IN concentration below 256 K (−17 ◦C)was not affected. The findings show that many IN active be-tween 263 K (−10 ◦C) and 257 K (−16 ◦C) were larger than5 µm, whereas IN active below 256 K (−17 ◦C) were smallerthan 0.1 µm.
4 Conclusions
The new high-throughput droplet freezing assay TINAwas introduced to study heterogeneous ice nucleation ofmicroliter-range droplets in the immersion mode. TINA pro-vides the analysis of 960 droplets simultaneously or 192 and768 droplets in two independent experiments at the sametime, enabling the analysis of many samples with high statis-tics in a short period of time. Moreover, an infrared camera-based detection system allows the reliable determination ofdroplet freezing. The setup was tested with Snomax® as bac-
terial IN and IN filtrate of Mortierella alpina as fungal IN.For these reference materials, both the initial freezing tem-perature and the cumulative number of IN per gram unit masswere in good agreement with the literature, which demon-strates the functionality of the new setup.
TINA was applied to study the effect of O3 and NO2 ex-posure on the IN activity of Snomax®, where high concen-trations of O3 and NO2 reduced the IN activity significantly.Atmospheric aerosol samples from Mainz (Germany) wereanalyzed for IN activity to show the applicability of TINA forfield samples. Here, the results suggest that most of the bio-logical IN were larger than 5 µm. Moreover, many IN activebetween 263 K (−10 ◦C) and 257 K (−16 ◦C) were largerthan 5 µm, whereas IN active below 256 K (−17 ◦C) weresmaller than 0.1 µm. The results confirm that TINA is suit-able for high-throughput experiments and efficient analysisof biological IN in laboratory and field samples.
Data availability. All data are available from the corresponding au-thors upon request.
Supplement. The supplement related to this article is availableonline at: https://doi.org/10.5194/amt-11-6327-2018-supplement.
Author contributions. ATK, ML, and FH developed the instrument.ATK, UP, JFN conceived and designed the experiments. ATK per-formed the experiments. MLP wrote the code to process the dataand did the error calculation. All authors discussed the data andcontributed to the writing of the manuscript.
Competing interests. The authors declare that they have no conflictof interest.
Special issue statement. This article is part of the special issue “Re-sults from the ice nucleation research unit (INUIT) (ACP/AMTinter-journal SI)”. It is not associated with a conference.
Acknowledgements. The authors thank Christian Gurk, ThomasKlimach, Florian Rubach, Frank Kunz, and the workshop teamfor supporting the experimental setup, Nina-Maria Kropf, CarolaSophie Krevert, Isabel Maurus, Gila Maren Kopper, and Petya Yor-danova for technical support, and Hinrich Grothe, Thomas Koop,Thomas Berkemeier, Alex Huffman, Daniel Andrew Pickersgill,Naama Lang-Yona, and Jan Frederik Scheel for helpful discussions.The Max Planck Society (MPG) and the Ice Nuclei Research Unitof the Deutsche Forschungsgemeinschaft (DFG FR 3641/1-2, FOR1525 INUIT) are acknowledged for financial support.
The article processing charges for this open-accesspublication were covered by the Max Planck Society.
www.atmos-meas-tech.net/11/6327/2018/ Atmos. Meas. Tech., 11, 6327–6337, 2018
6336 A. T. Kunert et al.: Twin-plate Ice Nucleation Assay (TINA)
Edited by: Mingjin TangReviewed by: two anonymous referees
References
Attard, E., Yang, H., Delort, A.-M., Amato, P., Pöschl, U., Glaux,C., Koop, T., and Morris, C. E.: Effects of atmospheric condi-tions on ice nucleation activity of Pseudomonas, Atmos. Chem.Phys., 12, 10667–10677, https://doi.org/10.5194/acp-12-10667-2012, 2012.
Ball, M. C., Wolfe, J., Canny, M., Hofmann, M., Nicotra, A. B.,and Hughes, D.: Space and time dependence of temperature andfreezing in evergreen leaves, Funct. Plant. Biol., 29, 1259–1272,2002.
Bauerecker, S., Ulbig, P., Buch, V., Vrbka, L., and Jungwirth, P.:Monitoring ice nucleation in pure and salty water via high-speedimaging and computer simulations, J. Phys. Chem. C, 112, 7631–7636, https://doi.org/10.1021/jp711507f, 2008.
Boucher, O., Randall, D., Artaxo, P., Bretherton, C., Feingold, G.,Forster, P., Kerminen, V.-M., Kondo, Y., Liao, H., Lohmann, U.,Rasch, P., Satheesh, S. K., Sherwood, S., Stevens, B., and Zhang,X. Y.: Clouds and Aerosols, in: Climate Change 2013: The Phys-ical Science Basis. Contribution of Working Group I to the FifthAssessment Report of the Intergovernmental Panel on ClimateChange, edited by: Stocker, T. F., Qin, D., Plattner, G.-K., Tig-nor, M., Allen, S. K., Boschung, J., Nauels, A., Xia, Y., And, V.B., and Midgley, P. M., 571–657, Cambridge University Press,Cambridge, United Kingdom and New York, NY, USA, 2013.
Budke, C. and Koop, T.: BINARY: an optical freezing ar-ray for assessing temperature and time dependence of het-erogeneous ice nucleation, Atmos. Meas. Tech., 8, 689–703,https://doi.org/10.5194/amt-8-689-2015, 2015.
Carter, J., Brennan, R., and Wisniewski, M.: Low-temperature tol-erance of blackcurrant flowers, HortScience, 34, 855–859, 1999.
Ceccardi, T. L., Heath, R. L., and Ting, I. P.: Low-temperatureexotherm measurement using infrared thermography,HortScience, 30, 140–142, 1995.
Charrier, G., Nolf, M., Leitinger, G., Charra-Vaskou, K.,Losso, A., Tappeiner, U., Améglio, T., and Mayr, S.: Mon-itoring of Freezing Dynamics in Trees: A Simple PhaseShift Causes Complexity, Plant Physiol., 173, 2196–2207,https://doi.org/10.1104/pp.16.01815, 2017.
Conen, F., Morris, C. E., Leifeld, J., Yakutin, M. V., andAlewell, C.: Biological residues define the ice nucleation prop-erties of soil dust, Atmos. Chem. Phys., 11, 9643–9648,https://doi.org/10.5194/acp-11-9643-2011, 2011.
Emteborg, H., Zeleny, R., Charoud-Got, J., Martos, G., Lüd-deke, J., Schellin, H., and Teipel, K.: Infrared thermographyfor monitoring of freeze-drying processes: Instrumental devel-opments and preliminary results, J. Pharm. Sci., 103, 2088–2097,https://doi.org/10.1002/jps.24017, 2014.
Fornea, A. P., Brooks, S. D., Dooley, J. B., and Saha, A.: Het-erogeneous freezing of ice on atmospheric aerosols contain-ing ash, soot, and soil, J. Geophys. Res.-Atmos., 114, 1–12,https://doi.org/10.1029/2009JD011958, 2009.
Fröhlich-Nowoisky, J., Hill, T. C. J., Pummer, B. G., Yordanova,P., Franc, G. D., and Pöschl, U.: Ice nucleation activity in the
widespread soil fungus Mortierella alpina, Biogeosciences, 12,1057–1071, https://doi.org/10.5194/bg-12-1057-2015, 2015.
Fuller, M. and Wisniewski, M.: The use of infrared thermal imagingin the study of ice nucleation and freezing of plants, J. Therm.Biol., 23, 81–89, https://doi.org/10.1016/S0306-4565(98)00013-8, 1998.
Gallego, B., Verdú, J. R., Carrascal, L. M., and Lobo, J.M.: A protocol for analysing thermal stress in insects us-ing infrared thermography, J. Therm. Biol., 56, 113–121,https://doi.org/10.1016/j.jtherbio.2015.12.006, 2016.
Gómez Muñoz, C. Q., García Márquez, F. P., and SánchezTomás, J. M.: Ice detection using thermal infrared radiom-etry on wind turbine blades, Measurement, 93, 157–163,https://doi.org/10.1016/j.measurement.2016.06.064, 2016.
Green, R. L. and Warren, G. J.: Physical and functional repeti-tion in a bacterial ice nucleation gene, Nature, 317, 645–648,https://doi.org/10.1038/317645a0, 1985.
Hacker, J. and Neuner, G.: Ice propagation in plants vi-sualized at the tissue level by infrared differentialthermal analysis (IDTA), Tree Physiol., 27, 1661–70,https://doi.org/10.1093/treephys/27.12.1661, 2007.
Hansman, R. J. and Dershowitz, A. L.: Method of and apparatus fordetection of ice accretion, United States Patent, MassachusettsInstitute of Technology, Patent Number: 5 313 202, 1994.
Harrison, A. D., Whale, T. F., Rutledge, R., Lamb, S., Tarn, M.D., Porter, G. C. E., Adams, M. P., McQuaid, J. B., Morris,G. J., and Murray, B. J.: An instrument for quantifying hetero-geneous ice nucleation in multiwell plates using infrared emis-sions to detect freezing, Atmos. Meas. Tech., 11, 5629–5641,https://doi.org/10.5194/amt-11-5629-2018, 2018.
Hartmann, S., Augustin, S., Clauss, T., Wex, H., Šantl-Temkiv,T., Voigtländer, J., Niedermeier, D., and Stratmann, F.: Immer-sion freezing of ice nucleation active protein complexes, At-mos. Chem. Phys., 13, 5751–5766, https://doi.org/10.5194/acp-13-5751-2013, 2013.
Häusler, T., Witek, L., Felgitsch, L., Hitzenberger, R.,and Grothe, H.: Freezing on a Chip – A New Ap-proach to Determine Heterogeneous Ice Nucleation ofMicrometer-Sized Water Droplets, Atmosphere-Basel, 9,140, https://doi.org/10.3390/atmos9040140, 2018.
Hill, T. C. J., DeMott, P. J., Tobo, Y., Fröhlich-Nowoisky, J., Mof-fett, B. F., Franc, G. D., and Kreidenweis, S. M.: Sources of or-ganic ice nucleating particles in soils, Atmos. Chem. Phys., 16,7195–7211, https://doi.org/10.5194/acp-16-7195-2016, 2016.
Kieft, T. L. and Ruscetti, T.: Characterization of Biological Ice Nu-clei from a Lichen, J. Bacteriol., 172, 3519–3523, 1990.
Kunert, A. T., Scheel, J. F., Helleis, F., Klimach, T., Pöschl, U., andFröhlich-Nowoisky, J.: New High-Performance Droplet FreezingAssay (HP-DFA) for the Analysis of Ice Nuclei with ComplexComposition, in EGU General Assembly Conference Abstracts,vol. 18, EPSC2016-6293, 2016a.
Kunert, A. T., Scheel, J. F., Helleis, F., Klimach, T., Pöschl, U., andFröhlich-Nowoisky, J.: TINA: A New High-Performance DropletFreezing Assay for the Analysis of Ice Nuclei with ComplexComposition, in: 4th Workshop – Microphysics of Ice Clouds,2016b.
Kunert, A. T., Lamneck, M., Gurk, C., Helleis, F., Klimach, T.,Scheel, J. F., Pöschl, U., and Fröhlich-Nowoisky, J.: TINA, a newfully automated high-performance droplet freezing assay cou-
Atmos. Meas. Tech., 11, 6327–6337, 2018 www.atmos-meas-tech.net/11/6327/2018/
A. T. Kunert et al.: Twin-plate Ice Nucleation Assay (TINA) 6337
pled to a customized infrared detection system, in: EGU GeneralAssembly Conference Abstracts, vol. 19, p. 13571, 2017a.
Kunert, A. T., Lamneck, M., Gurk, C., Helleis, F., Klimach, T.,Scheel, J. F., Pöschl, U., and Fröhlich-Nowoisky, J.: TINA, a newfully automated high-performance droplet freezing assay cou-pled to a customized infrared detection system, in: 5th Workshop– Microphysics of Ice Clouds, 2017b.
Kunert, A. T., Lamneck, M., Helleis, F., Scheel, J. F., Pöschl, U.,and Fröhlich-Nowoisky, J.: TINA: Twin-plate ice nucleation as-say with infrared detection for high-throughput droplet freezingexperiments, in: INUIT Final Conference and 2nd AtmosphericIce Nucleation Conference, 2018.
Liu, F., Lakey, P., Berkemeier, T., Tong, H., Kunert, A. T.,Meusel, H., Su, H., Cheng, Y., Fröhlich-Nowoisky, J., Lai,S., Weller, M. G., Shiraiwa, M., Pöschl, U., and Kampf, C.J.: Atmospheric protein chemistry influenced by anthropogenicair pollutants: nitration and oligomerization upon exposure toozone and nitrogen dioxide, Faraday Discuss., 200, 413–427,https://doi.org/10.1039/C7FD00005G, 2017.
Möhler, O., Georgakopoulos, D. G., Morris, C. E., Benz, S., Ebert,V., Hunsmann, S., Saathoff, H., Schnaiter, M., and Wagner, R.:Heterogeneous ice nucleation activity of bacteria: new labora-tory experiments at simulated cloud conditions, Biogeosciences,5, 1425–1435, https://doi.org/10.5194/bg-5-1425-2008, 2008.
Murray, B. J., Broadley, S. L., Wilson, T. W., Bull, S. J., Wills, R.H., Christenson, H. K., and Murray, E. J.: Kinetics of the homo-geneous freezing of water, Phys. Chem. Chem. Phys., 12, 10380–10387, https://doi.org/10.1039/c003297b, 2010.
O’Sullivan, D., Murray, B. J., Malkin, T. L., Whale, T. F., Umo,N. S., Atkinson, J. D., Price, H. C., Baustian, K. J., Browse,J., and Webb, M. E.: Ice nucleation by fertile soil dusts: rel-ative importance of mineral and biogenic components, Atmos.Chem. Phys., 14, 1853–1867, https://doi.org/10.5194/acp-14-1853-2014, 2014.
Pearce, R. S. and Fuller, M. P.: Freezing of Barley Studied by In-frared Video Thermography, Plant Physiol., 125, 227–240, 2001.
Pouleur, S., Richard, C., Martin, J. G., and Antoun, H.: Ice Nu-cleation Activity in Fusarium acuminatum and Fusarium ave-naceum, Appl. Environ. Microbiol., 58, 2960–2964, 1992.
Pruppacher, H. R. and Klett, J. D.: Microphysics of Clouds and Pre-cipitation, 2nd edn., Springer Netherlands, Dordrecht, 1997.
Pummer, B. G., Budke, C., Augustin-Bauditz, S., Niedermeier,D., Felgitsch, L., Kampf, C. J., Huber, R. G., Liedl, K.R., Loerting, T., Moschen, T., Schauperl, M., Tollinger, M.,Morris, C. E., Wex, H., Grothe, H., Pöschl, U., Koop,T., and Fröhlich-Nowoisky, J.: Ice nucleation by water-soluble macromolecules, Atmos. Chem. Phys., 15, 4077–4091,https://doi.org/10.5194/acp-15-4077-2015, 2015.
Sekozawa, Y., Sugaya, S., and Gemma, H.: Observations of IceNucleation and Propagation in Flowers of Japanese Pear (Pyruspyrifolia Nakai) using Infrared Video Thermography, J. Japan.Soc. Hort. Sci., 73, 1–6, https://doi.org/10.1248/cpb.37.3229,2004.
Stier, J. C., Filiault, D. L., Wisniewski, M., and Palta, J. P.: Visual-ization of freezing progression in turfgrasses using infrared videothermography, Crop. Sci., 43, 415–420, 2003.
Stopelli, E., Conen, F., Zimmermann, L., Alewell, C., and Morris,C. E.: Freezing nucleation apparatus puts new slant on study ofbiological ice nucleators in precipitation, Atmos. Meas. Tech., 7,129–134, https://doi.org/10.5194/amt-7-129-2014, 2014.
Tobo, Y.: An improved approach for measuring immersion freez-ing in large droplets over a wide temperature range, Sci. Rep., 6,32930, https://doi.org/10.1038/srep32930, 2016.
Tsumuki, H. and Konno, H.: Ice Nuclei Produced by Fusarium sp.Isolated from the Gut of the Rice Stem Borer, Chilo suppressalisWalker (Lepidoptera: Pyralidae), Biosci. Biotechnol. Biochem.,58, 578–579, 1994.
Turner, M. A., Arellano, F., and Kozloff, L. M.: Three separateclasses of bacterial ice nucleation structures, J. Bacteriol., 172,2521–2526, 1990.
Vali, G.: Quantitative Evaluation of Experimental Results anthe Heterogeneous Freezing Nucleation of Supercooled Liq-uids, J. Atmos. Sci., 28, 402–409, https://doi.org/10.1175/1520-0469(1971)028<0402:QEOERA>2.0.CO;2, 1971a.
Vali, G.: Supercooling of Water and Nucleationof Ice (Drop Freezer), Am. J. Phys., 39, 1125,https://doi.org/10.1119/1.1976585, 1971b.
Ward, P. J. and DeMott, P. J.: Preliminary experimental evaluationof Snomax snow inducer, Pseudomonas syringae, as an artificialice nucleus for weather modification, J. Weather Modif., 21, 9–13, 1989.
Whale, T. F., Murray, B. J., O’Sullivan, D., Wilson, T. W., Umo, N.S., Baustian, K. J., Atkinson, J. D., Workneh, D. A., and Morris,G. J.: A technique for quantifying heterogeneous ice nucleationin microlitre supercooled water droplets, Atmos. Meas. Tech., 8,2437–2447, https://doi.org/10.5194/amt-8-2437-2015, 2015.
Wisniewski, M., Lindow, S. E., and Ashworth, E. N.: Observationsof Ice Nucleation and Propagation in Plants Using Infrared VideoThermography, Plant Physiol., 113, 327–334, 1997.
Wisniewski, M., Glenn, D. M., Gusta, L., and Fuller, M. P.:Using Infrared Thermography to Study Freezing in Plants,HortScience, 43, 1648–1651, 2008.
Workmaster, B.: Ice nucleation and propagation in cranberry up-rights and fruit using infrared video thermography, J. Amer. Soc.Hort. Sci., 124, 619–625, 1999.
Wright, T. P. and Petters, M. D.: The role of time in heterogeneousfreezing nucleation, J. Geophys. Res.-Atmos., 118, 3731–3743,https://doi.org/10.1002/jgrd.50365, 2013.
Zaragotas, D., Liolios, N. T., and Anastassopoulos, E.: Su-percooling, ice nucleation and crystal growth: A system-atic study in plant samples, Cryobiology, 72, 239–243,https://doi.org/10.1016/j.cryobiol.2016.03.012, 2016.
www.atmos-meas-tech.net/11/6327/2018/ Atmos. Meas. Tech., 11, 6327–6337, 2018