twin creek wind farm · vol 6157 fol 823 . allotment 118 filed plan 174416 . in the area named...
TRANSCRIPT

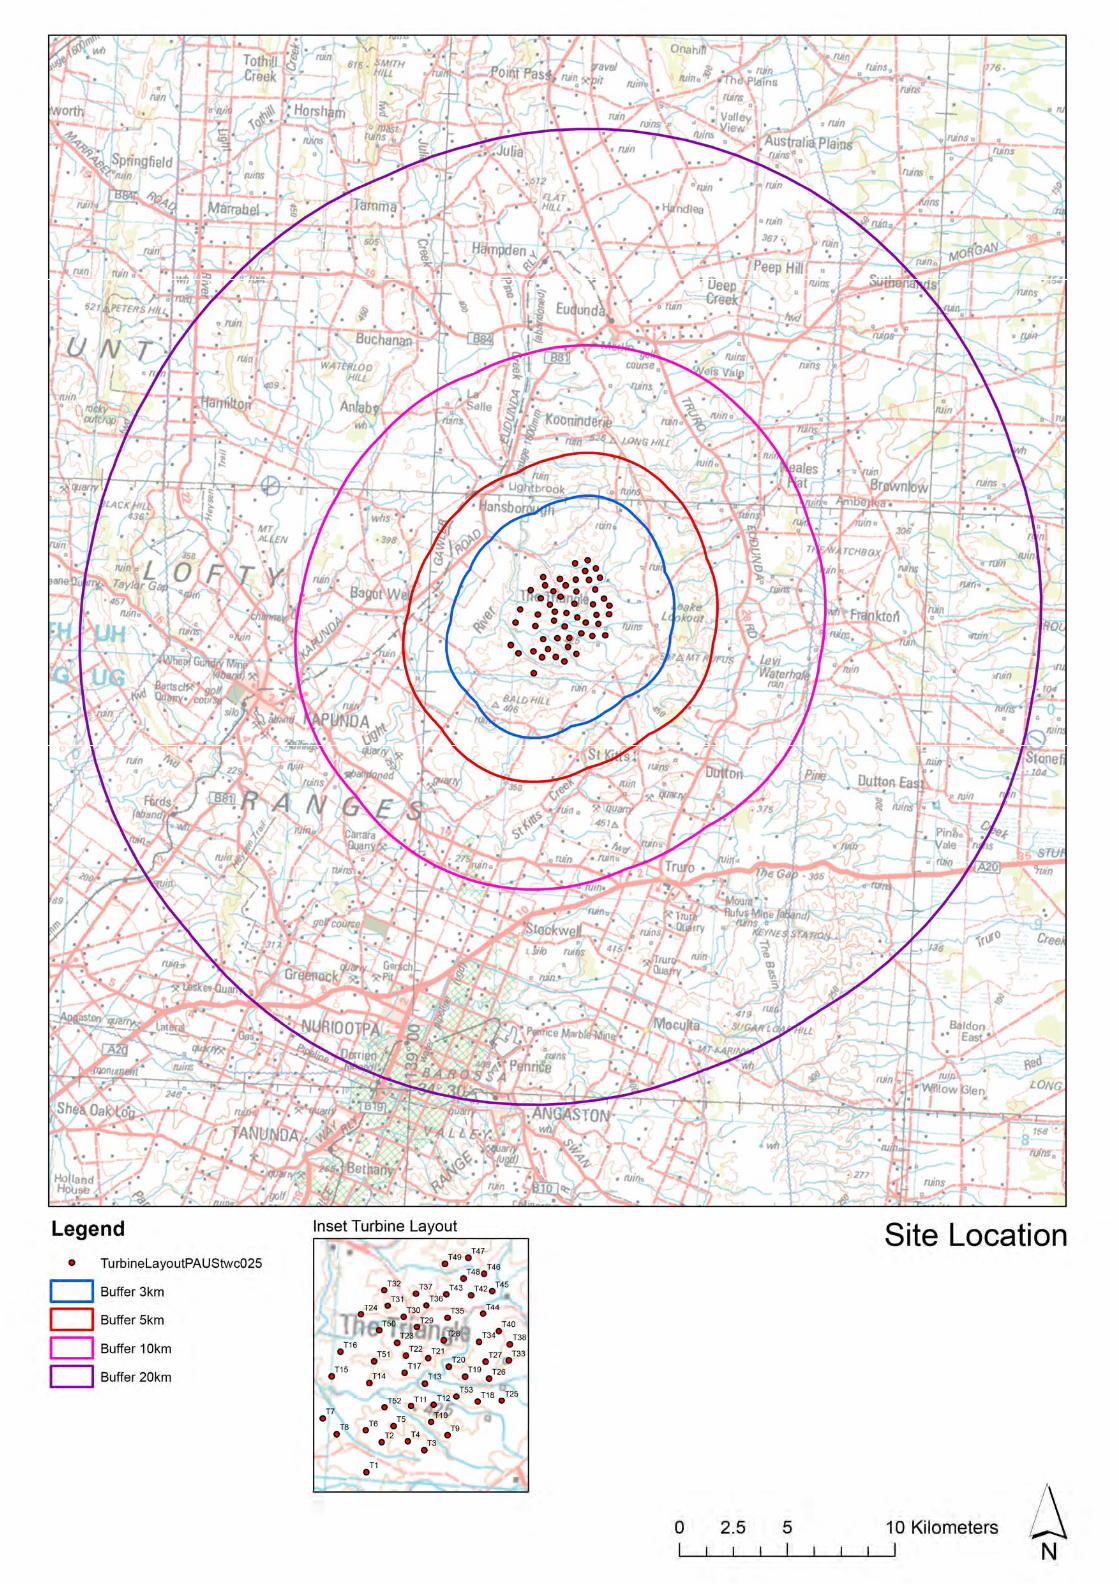
TWIN CREEK WIND FARM Development Application for Development Plan Consent
January 2018
ADDENDUM

TWIN CREEK WIND FARM
DEVELOPMENT APPLICATION FOR
DEVELOPMENT PLAN CONSENT
Development Application Number: 422/E003/17
ADDENDUM
RES AUSTRALIA PTY LTD
January 2018
PLEASE NOTE: THIS DOCUMENT MUST BE READ IN CONJUNCTION WITH THE TWIN CREEK WIND FARM DEVELOPMENT APPLICATION FOR
DEVELOPMENT PLAN CONSENT - VOLUMES 1, 2, 3 AND 4
Prepared by
MasterPlan SA Pty Ltd
ABN 30 007 755 277, ISO 9001:2015 Certified
33 Carrington Street, Adelaide SA 5000
Telephone: 8193 5600, masterplan.com.au

1
NOTICE
This addendum provides additional information in support of, and must be read in association with, the Twin Creek Wind Farm Development Application for Development Plan Consent (dated August 2017), comprising:
• Volume 1 – Project Summary;
• Volume 2 – Technical Reports;
• Volume 3 – Drawings, Maps and Figures; and
• Volume 4 – Draft Construction Environmental Management Plan.
The information provided in this addendum should be considered to support or replace (as detailed below) the information previously submitted in the Twin Creek Wind Farm Development Application:
Addendum Sections Replace or Supplement Reason
Volume 1 Statement of
Commitments page
128.
Replace Volume 1 page
128.
Correcting a typographical error in
the wind farm name in the
Complaints Management section.
Section 1.4 - Legal
Description of the Site
of the Development.
Replace Section 1.4 –
Table 2 – Grid Connection
– Land Parcel and
Infrastructure
Information.
Addition of Allotment 500, Filed
Plan 16260, in the Area Named St
Kitts, Hundred of Belvidere,
Certificate of Title Volume 5485
Folio 289.
Volume 2 Part 1 Volume 2 Part 1, Flora
and Fauna
Assessment.
Supplementary report by
EBS Ecology –
“Addendum to Main Flora
and Fauna Report for Twin
Creek Wind Farm -
G40902 EBS Ecology
2018”.
EBS Ecology Spring 2017 survey
results.

2
Addendum Sections Replace or Supplement Reason
Volume 2 Part 1,
Landscape Character
and Probable Visual
Effect Assessment.
Replace Landscape
Character and Probable
Visual Effect Assessment
in Volume 2 Part 1.
The revised Wax Design report
considers a wind turbine with a tip
height of 180 metres and rotor
diameter of 136 metres.
Volume 3 Figures 1, 3, 4, 5, 6, 7, 8
and 9.
Replace RES Figures 1, 3,
4, 5, 6, 7, 8 and 9.
The overhead transmission line
alignment has been revised to
avoid impacts to native
vegetation. The drawings have
been updated to show the revised
alignment.
Figure 10. Replace RES Figure 10. The revised micrositing drawing
removes micrositing areas on
Crown and Paper Roads.
Figure 11a. Replace RES Figure 11a. The revised Construction,
Operations, Maintenance and
Substation Areas Drawing includes
a correction to the drawing legend
on the Proposed Wind Farm
Construction Compound and
Laydown Area.
Photomontages Replace all
photomontages
The revised photomontages
consider a wind turbine with a tip
height of 180 metres and rotor
diameter of 136 metres.

Volume 1
Chapter 8 –Statement of Commitments
Replacement of Page 128

128
Issue Commitment Timing
The developer will provide noise and vibration elements into the community consultation process. The aim of consultation will be to ensure adequate community awareness and notice of expected construction noise.
Consultation will include: - regular community information newsletters
providing details of the construction plan and duration;
- a site notice board in a community location(s) providing copies of the newsletters, updated construction programme details, contact details of the project team members, and an ability to register for email updates of the newsletter;
- a feedback mechanism for the community to submit questions to the construction team and for the construction team to respond;
- regular updates on the construction activities to local authorities to assist in complaint management if necessary; and
- contact details of the project manager and/or site ’environmental representative’.
Complaints management Prior to construction commencing, RES will ensure the following is available:
- a postal and email address to which written complaints can be sent; and
- a 24 hour telephone contact line.
RES will keep record of a Complaints Register for a period of at least four years after the complaint was made. This will include:
- the date and time of the complaint; - whether the complaint was via mail, email or
telephone; - any personal details provided (if any) or a note if
no details were provided; - the nature of the complaint; - any action(s) taken by RES in relation to the
complaint, including follow-up; and - if no action was taken in relation to the
complaint, the reason(s) why.
The Complaints Register will be made available for inspection upon request of the planning authority or other relevant government agency.
Prior to construction commencing
Additional consultation requirements communications
Additional consultation for the communication aspects of the project, as recommended by DNV GL in its EMI Assessment Report and the Ambidji Aviation Assessment report.
Prior to construction commencing

Volume 1 - Section 1.4 – Legal Description of the Site of the Development
Table 2 - Grid Connection – Land Parcel and Infrastructure Information
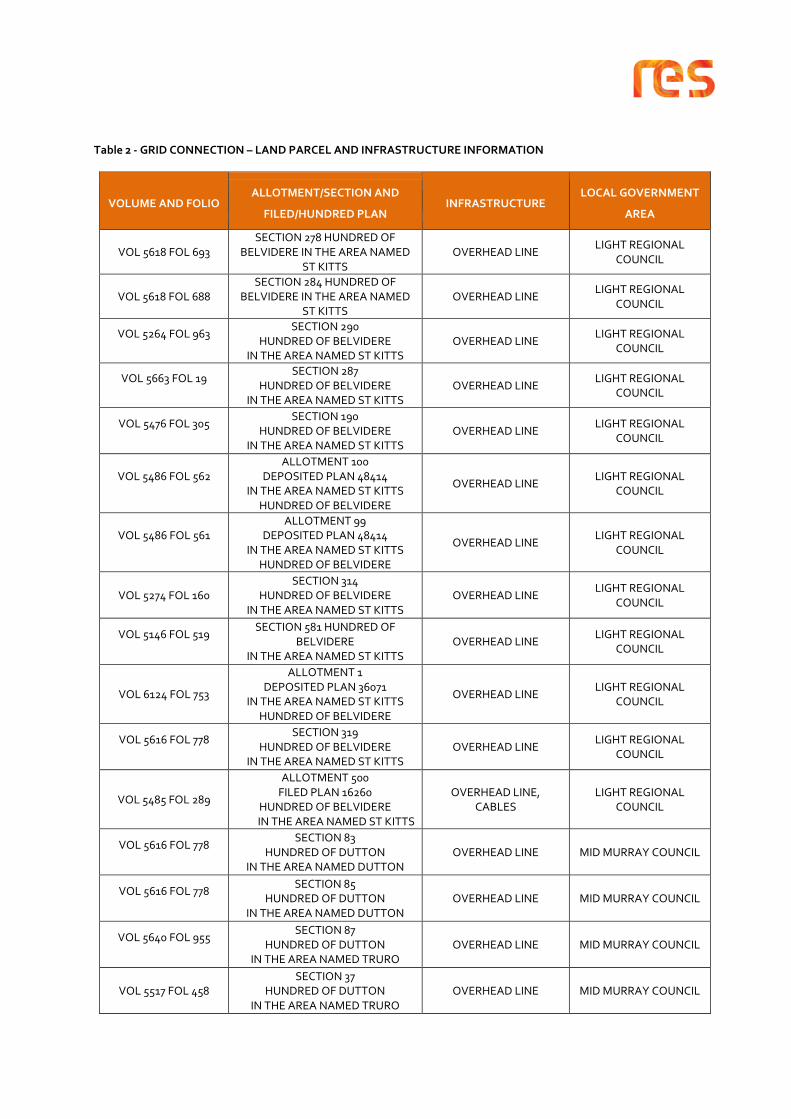
Table 2 - GRID CONNECTION – LAND PARCEL AND INFRASTRUCTURE INFORMATION
VOLUME AND FOLIO ALLOTMENT/SECTION AND
FILED/HUNDRED PLAN INFRASTRUCTURE
LOCAL GOVERNMENT
AREA
VOL 5618 FOL 693 SECTION 278 HUNDRED OF
BELVIDERE IN THE AREA NAMED ST KITTS
OVERHEAD LINE LIGHT REGIONAL
COUNCIL
VOL 5618 FOL 688 SECTION 284 HUNDRED OF
BELVIDERE IN THE AREA NAMED ST KITTS
OVERHEAD LINE LIGHT REGIONAL
COUNCIL
VOL 5264 FOL 963
SECTION 290 HUNDRED OF BELVIDERE
IN THE AREA NAMED ST KITTS OVERHEAD LINE
LIGHT REGIONAL COUNCIL
VOL 5663 FOL 19
SECTION 287 HUNDRED OF BELVIDERE
IN THE AREA NAMED ST KITTS OVERHEAD LINE
LIGHT REGIONAL COUNCIL
VOL 5476 FOL 305
SECTION 190 HUNDRED OF BELVIDERE
IN THE AREA NAMED ST KITTS OVERHEAD LINE
LIGHT REGIONAL COUNCIL
VOL 5486 FOL 562
ALLOTMENT 100 DEPOSITED PLAN 48414
IN THE AREA NAMED ST KITTS HUNDRED OF BELVIDERE
OVERHEAD LINE LIGHT REGIONAL
COUNCIL
VOL 5486 FOL 561
ALLOTMENT 99 DEPOSITED PLAN 48414
IN THE AREA NAMED ST KITTS HUNDRED OF BELVIDERE
OVERHEAD LINE LIGHT REGIONAL
COUNCIL
VOL 5274 FOL 160 SECTION 314
HUNDRED OF BELVIDERE IN THE AREA NAMED ST KITTS
OVERHEAD LINE LIGHT REGIONAL
COUNCIL
VOL 5146 FOL 519
SECTION 581 HUNDRED OF BELVIDERE
IN THE AREA NAMED ST KITTS OVERHEAD LINE
LIGHT REGIONAL COUNCIL
VOL 6124 FOL 753
ALLOTMENT 1 DEPOSITED PLAN 36071
IN THE AREA NAMED ST KITTS HUNDRED OF BELVIDERE
OVERHEAD LINE LIGHT REGIONAL
COUNCIL
VOL 5616 FOL 778
SECTION 319 HUNDRED OF BELVIDERE
IN THE AREA NAMED ST KITTS OVERHEAD LINE
LIGHT REGIONAL COUNCIL
VOL 5485 FOL 289
ALLOTMENT 500 FILED PLAN 16260
HUNDRED OF BELVIDERE IN THE AREA NAMED ST KITTS
OVERHEAD LINE, CABLES
LIGHT REGIONAL COUNCIL
VOL 5616 FOL 778
SECTION 83 HUNDRED OF DUTTON
IN THE AREA NAMED DUTTON OVERHEAD LINE MID MURRAY COUNCIL
VOL 5616 FOL 778
SECTION 85 HUNDRED OF DUTTON
IN THE AREA NAMED DUTTON OVERHEAD LINE MID MURRAY COUNCIL
VOL 5640 FOL 955
SECTION 87 HUNDRED OF DUTTON
IN THE AREA NAMED TRURO OVERHEAD LINE MID MURRAY COUNCIL
VOL 5517 FOL 458 SECTION 37
HUNDRED OF DUTTON IN THE AREA NAMED TRURO
OVERHEAD LINE MID MURRAY COUNCIL

VOLUME AND FOLIO ALLOTMENT/SECTION AND
FILED/HUNDRED PLAN INFRASTRUCTURE
LOCAL GOVERNMENT
AREA
VOL 5485 FOL 579
SECTION 38 HUNDRED OF DUTTON
IN THE AREA NAMED TRURO OVERHEAD LINE MID MURRAY COUNCIL
VOL 5485 FOL 733 SECTION 36
HUNDRED OF DUTTON IN THE AREA NAMED TRURO
OVERHEAD LINE MID MURRAY COUNCIL
VOL 5503 FOL 860
SECTION 34 HUNDRED OF DUTTON
IN THE AREA NAMED TRURO OVERHEAD LINE MID MURRAY COUNCIL
VOL 5322 FOL 638
ALLOTMENT 1 DEPOSITED PLAN 44123
IN THE AREA NAMED TRURO HUNDRED OF DUTTON
OVERHEAD LINE MID MURRAY COUNCIL
VOL 5812 FOL 749 SECTION 51
HUNDRED OF DUTTON IN THE AREA NAMED TRURO
OVERHEAD LINE MID MURRAY COUNCIL
VOL 5810 FOL 208
ALLOTMENT 682 FILED PLAN 209058
IN THE AREA NAMED TRURO HUNDRED OF JELLICOE
OVERHEAD LINE MID MURRAY COUNCIL
VOL 5315 FOL 264 SECTION 221
HUNDRED OF JELLICOE IN THE AREA NAMED TRURO
OVERHEAD LINE MID MURRAY COUNCIL
VOL 5652 FOL 492
ALLOTMENT 1 DEPOSITED PLAN 48415
IN THE AREA NAMED TRURO HUNDRED OF JELLICOE
OVERHEAD LINE MID MURRAY COUNCIL
VOL 5950 FOL 567
SECTION 218 HUNDRED OF JELLICOE
IN THE AREA NAMED TRURO OVERHEAD LINE MID MURRAY COUNCIL
VOL 5950 FOL 564
ALLOTMENT 106 DEPOSITED PLAN 65817
IN THE AREA NAMED TRURO HUNDRED OF JELLICOE
OVERHEAD LINE MID MURRAY COUNCIL
VOL 5947 FOL 941
ALLOTMENT 110 DEPOSITED PLAN 65818
IN THE AREA NAMED TRURO HUNDRED OF JELLICOE
OVERHEAD LINE MID MURRAY COUNCIL
VOL 5304 FOL 717
ALLOTMENT 94 FILED PLAN 163638
IN THE AREA NAMED TRURO HUNDRED OF JELLICOE
OVERHEAD LINE MID MURRAY COUNCIL
VOL 5360 FOL 970
ALLOTMENT 101 FILED PLAN 174415
IN THE AREA NAMED TRURO HUNDRED OF JELLICOE
OVERHEAD LINE MID MURRAY COUNCIL
VOL 6157 FOL 823
ALLOTMENT 118 FILED PLAN 174416
IN THE AREA NAMED TRURO HUNDRED OF JELLICOE
OVERHEAD LINE MID MURRAY COUNCIL

VOLUME AND FOLIO ALLOTMENT/SECTION AND
FILED/HUNDRED PLAN INFRASTRUCTURE
LOCAL GOVERNMENT
AREA
VOL 5506 FOL 92
ALLOTMENT 91 FILED PLAN 163637
IN THE AREA NAMED TRURO HUNDRED OF JELLICOE
OVERHEAD LINE, TERMINAL SUBSTATION,
ACCESS TRACK, VEGETATIVE
SCREENING, ELECTRICAL INFRASTRUCTURE.
MID MURRAY COUNCIL

Volume 2 Part 1 - EBS Ecology - Flora and Fauna Assessment - Supplementary Report
Addendum to Main Flora and Fauna Report for Twin Creek Wind Farm - G40902 EBS Ecology 2018

3/119 Hayward Avenue Torrensville SA 5031
T: (08) 7127 5607 F: (08) 8354 2403
W: www.ebservices.com.au E: [email protected]
1
ADDENDUM TO MAIN FLORA AND FAUNA REPORT FOR TWIN CREEK WIND FARM
G40902 EBS ECOLOGY 2018
17 January 2018
Background
The proposed Twin Creek Wind Farm (TCWF) has been subject to detailed Flora and Fauna surveys between
2015 and 2017, with full details provided in the main reports:
Twin Creek Wind Farm Flora & Fauna Report (EBS Ecology, 2017);
Twin Creek WF SEB Report (EBS Ecology, 2017);
Twin Creek Wind Farm SEB Proposal Summary (EBS Ecology, 2017);
Twin Creek Wind Farm Addendum: Lomandra Grassland and Peppermint Box Woodland (EBS
Ecology, 2017).
In January 2018, an amendment was made to the previously approved Grid Route to lower the impact to
Eucalyptus odorata (Peppermint Box) woodland along Biele Road and due to other issues with the previous
proposed route footprint. This addendum summarises only those findings related to the amended grid route
following an additional survey undertaken on 15 January 2018.
The Twin Creek Wind Farm Clearance proposal was approved by the Native Vegetation Council (NVC) on
Friday 15 December 2017 and the original reports (above) have not been updated. However, this addendum
details the changed impact of the grid route amendment compared with the original proposal. Maps in
previous reports that indicate the previous grid route alignment between Mosey Road and Tableland Road are
now superseded by the maps provided in this addendum. Comparisons of impact (in hectares) based on the
two grid alignments are also provided in this addendum.
Impact areas and offset calculations have been calculated based on a worst case scenario and are likely to
provide an over estimate of the impact area. Following micro-siting and construction plans being finalised, the
final impact footprint and resulting offset requirements will be calculated and provided to the NVC.
Method
Field Survey
Vegetation within the amended grid route was surveyed on foot and by vehicle on January 15 by EBS Ecologists
Emma Eichler and Ilona Weir, using the network of existing vehicle tracks and traversing across cleared

2
paddocks where required. Vegetation was mapped into communities using the 11 vegetation associations
previously surveyed for the TCWF and all native and exotic flora species observed were recorded. However,
this addendum includes dominant and new species only. Full species lists for the 11 Vegetation Associations
(VA) are provided in Appendix 1 of the main flora and fauna report (EBS Ecology, 2017).
Vegetation condition was determined using criteria adopted by the Native Vegetation Council (NVC) to calculate
significant environmental benefit (SEB) offset requirements for native vegetation clearance (Table 6 main
report). Using these criteria, vegetation was assigned an SEB condition ratio based on the percentage of native
and exotic species in the understorey, disturbance, and intactness of vegetation stratum.
Isolated trees or small clumps of trees with a very low percentage of native understorey are considered scattered
trees by definition of the NVC. These often include trees in crops, exotic grasslands, or on degraded roadsides.
Such trees were assessed using the appropriate methodology which includes recording tree attributes such as
species, height, girth, tree health and habitat value and using them to calculate a tree score using the NVC point
scoring system.
Any threatened ecosystems were recorded and if relevant assessed against criteria for listing. This was relevant
for an area of roadside vegetation (on Tableland Road) classified as Peppermint Box Woodland of South
Australia (see Peppermint Box Addendum for definition and criteria), following criteria outlined in the EPBC Act
Policy Statement 3.7: Peppermint Box (Eucalyptus odorata) Grassy Woodland of South Australia (Table 1).
Listing depends on species composition and diversity, particularly of herbaceous species.
Table 1. Condition classes for Peppermint Box (Eucalyptus odorata) Grassy Woodland of South Australia.
Condition Class Minimum Size Diversity of Native Species1
No. of Broad-leaved Herbaceous Species1 in addition to identified disturbance resistant species2
No. of Perennial Grass Species1 Listed ecological community
A 0.1 ha > 30 +10 5 B 1 ha > 15 +3 2 Degraded patches amenable to rehabilitation
C > 5 No minimum 1 1
As measured in a 50 m X 50 m quadrat; 2
The following species are identified as disturbance resistant species: Ptilotus spathulatus forma spathulatus; Sida corrugata; Oxalis perennans; Convolvulus erubescens; Euphorbia drummondii; and, Maireana enchylaenoides.
Impact calculation
The impact change was calculated by re-mapping vegetation within the amended grid route and comparing
the impact change in hectares for each vegetation association. The impact footprint was based on
specifications provided by RES in June 2017 as follows:
‘The transmission line would be constructed with steel or spun concrete monopoles up to 32 meters high and
spaced approximately 275 – 375 meters apart (or wider should terrain enable). Impact areas for poles will be
approx. 3m x 3m for the monopole tower locations.
In open areas (grasslands), the clearance footprint was calculated using an estimate of maximum pole
numbers (at 275m) for each vegetation association. In woodland or heavily treed areas, a 50m wide footprint

3
was used in the first instance to allow for clearance required near power lines. Both sets of figures are over
estimates to determine the ‘worst case scenario’ because poles are likely to be further than 275m apart at
times and clearance of woodland for safety is expected to be less than 50m.’
Results
Field Survey
Of the 11 VA’s observed previously at the TCWF site, five occurred in the new Grid Route footprint (17 ha in
total), including two containing no native vegetation, VA6 Cropping (16 ha) and VA8 Exotic Grassland (0.02
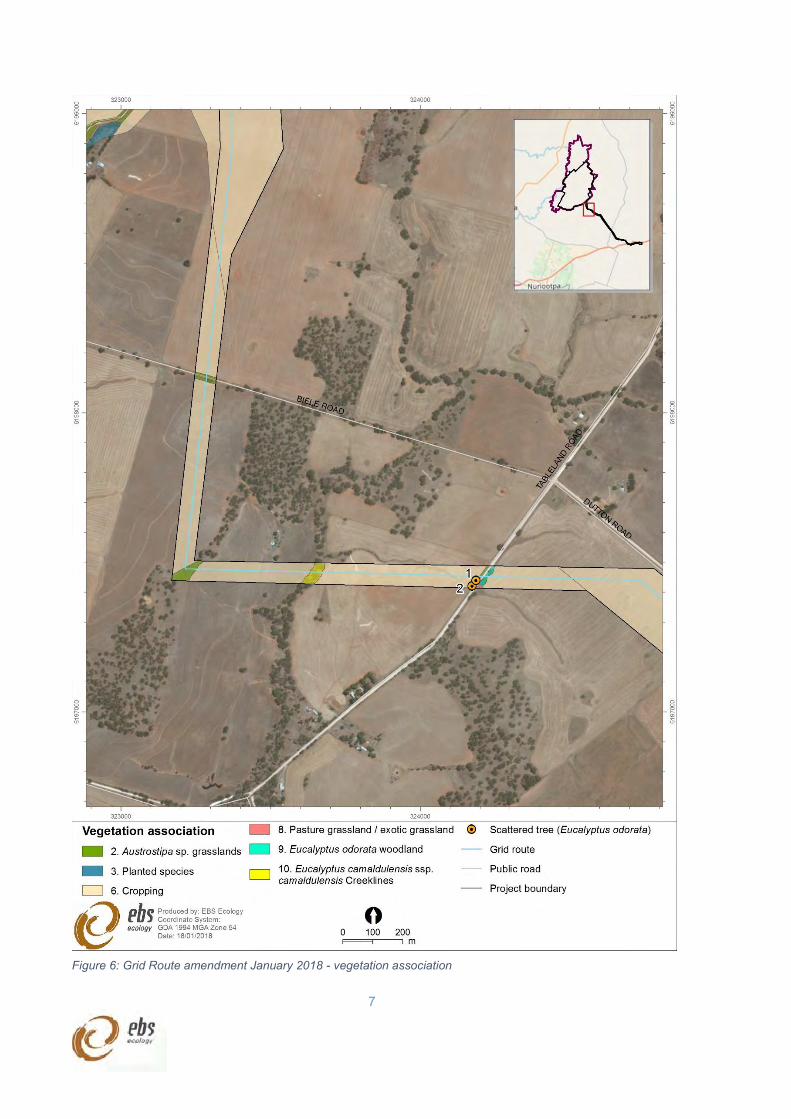
ha) (Figure 6 and Figure 7). This addendum provides descriptions for native VA within the amended Grid
Route footprint. Full descriptions are provided in the Flora and Fauna report (EBS Ecology 2017).
Vegetation Association 2: Austrostipa spp. (Spear Grasses) Grassland
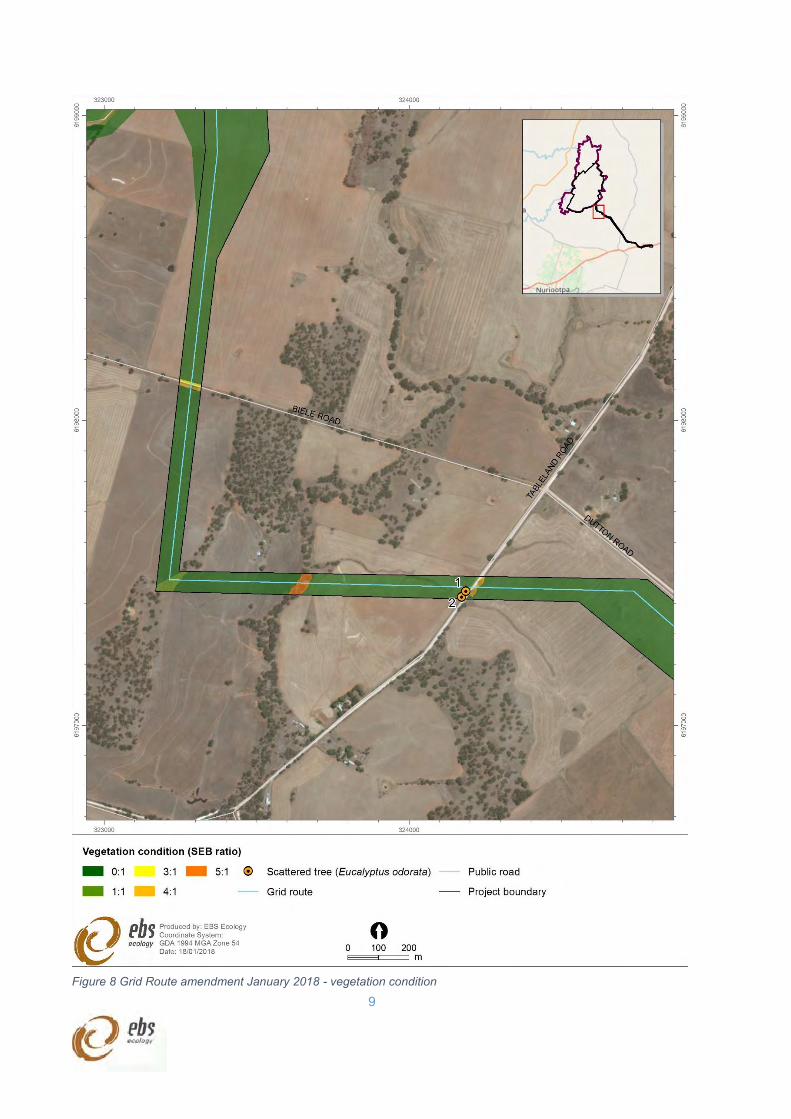
VA2 was observed across 0.51 ha (previous alignment 0.54 ha) ranging in condition from 1:1 (fence corner,
Grid Route corner and Tableland Road, to 4:1 along Biele Road (Figure 1) where there was an increased
cover of native grass and scattered Eucalyptus odorata (Peppermint Box) (Figure 8 and Figure 9). Dominant
species included Austrostipa sp. (Spear Grass), Enneapogon nigricans (Black-Heads), Aristida behriana
(Brush-wire Grass) and scattered Lomandra multiflora ssp. dura (Many-flowered Lomandra) and Vittadinia
gracilis (Woolly New Holland Daisy) (Figure 1 and Figure 2). A new species for the TCWF was observed in
the grassland along Biele Road Leiocarpa tomentosa (Woolly Plover Daisy) which is rated ‘Near Threatened’
for the Northern and Yorke Natural Resource Management (NY NRM) Region (Figure 3). Dominant weeds
included *Avena barbata (Wild Oats) and *Scabiosa atropurpurea (Pin-Cushion).
Figure 1: Austrostipa grassland Tableland Road 1:1 (left), Biele Road 4:1 (right)

4
Figure 2 Austrostipa Grassland with L. tomentosa (3:1)
Vegetation Association 9: Eucalyptus odorata (Peppermint Box) / Eucalyptus porosa (Mallee Box)
Woodland
VA9 was observed across 0.1 ha (previous alignment 1 ha) on the eastern side of Tableland Road and rated
4:1 (Figure 8 and Figure 9). The overstorey comprised E. odorata and Eucalyptus leucoxylon ssp. pruinosa
(SA Blue Gum) with understorey comprising Austrostipa spp. and regenerating Eucalypts (Figure 3).
Dominant weeds were Wild Oats, Pincushion and Declared Plant for South Australia (DP) *Rosa canina (Dog
Rose). VA9 on Tableland Road was assessed against Environment Protection and Biodiversity Conservation
(EPBC) Act, 1999 criteria (Table 1) to determine if it was listed under the EPBC Act. VA9 at this location did
not qualify for listing due to the small size of the woodland and the lack of diversity. However E. odorata +/- E.
leucoxylon Grassy Woodland on Loamy soils of low hills is categorised as endangered, based on the
provisional list of threatened ecosystems for South Australia (DEH, 2009). Regional listings are not
recognised under legislation but clearance should be avoided where possible.
Figure 3: Peppermint Box Woodland Table land Road (4:1)

5
Vegetation Association 10: Eucalyptus camaldulensis ssp. camaldulensis (River Red Gum) Tall
Woodland (Creek Lines)
VA10 was observed across 0.3 ha (previous alignment 0.24 ha) in the creek line that runs through the
cropping paddocks (Figure 8 and Figure 9). VA10 comprised large old trees with hollows (Figure 4). Although
the understorey was weed dominated, VA10 was allocated an SEB ratio of 5:1 (Figure 8) to account for the
large River Red Gum trees proposed for clearance. Other native species included Allocasuarina verticillata
(Drooping Sheoak), Bursaria spinosa (Sweet Bursaria), Austrostipa spp. and E. odorata. Understorey was
dominated by weed species including Wild Oats, *Vulpia sp. (Vulpia) and *Bromus sp. (Brome).
Figure 4 River Red Gum Tall Woodland 5:1
Scattered Trees
Two scattered trees were observed along the western side of Biele Road (Figure 7). It was determined that
the two Eucalyptus odorata specimens (Figure 5) had less than 5% native understorey and therefore required
assessment using the scattered tree methodology. Their attributes are shown in Table 2.
Figure 5: Scattered trees 1 (left) and 2 (right) Eucalyptus odorata (Peppermint Box)

6
Table 2: Scattered Tree attributes amended grid route
Tree Height (m) Spread (m) Multi/Single stem Butt diameter (m) Dieback (%) Hollows
1 11 M 0.8 15 -
2 6 8 M 0.35 10 -
7
Figure 6: Grid Route amendment January 2018 - vegetation association

8
Figure 7: Grid Route amendment January 2018 - vegetation association (Tableland Road)
9
Figure 8 Grid Route amendment January 2018 - vegetation condition

10
Figure 9 Grid Route amendment January 2018 – Tableland Road

11
Impact
The total impact of the amended grid route equates to 0.3 hectares of native vegetation including potential
clearance of 36m² for the poles (in Austrostipa sp. grassland) and 0.3 ha for the woodland areas (Table 3).
This is a reduction compared with the previous alignment, which required clearance of 1 ha of native
vegetation including 0.72 ha of woodland. It is highly likely that the impact for poles would be less than the
already negligible figure (36m²), as poles could be located in cropping areas instead of Austrostipa
grasslands, but the calculation is based on worst case scenario.
Table 3 Impact comparisons between previous and amended grid route
VA Veg description SEB ratio No poles Native Impact*
m² Ha
2 Austrostipa sp. grasslands 3:1 1 9 0.0009
6 Cropping 0:1 11 0 0
9 Eucalyptus odorata (Peppermint Box) woodland 4:1 7795 0.78
10 Eucalyptus camaldulensis ssp. camaldulensis tall woodland 6:1 2270 0.23
Total grid route original footprint 12 10074
1 ha
2 Austrostipa sp. grasslands 1:1 2 18 0.0018
2 Austrostipa sp. grasslands 3:1 1 9 0.009
2 Austrostipa sp. grasslands 4:1 1 9 0.009
6 Cropping 0:1 10 0 0
9 Eucalyptus odorata (Peppermint Box) woodland 4:1 749 0.07
10 Eucalyptus camaldulensis ssp. camaldulensis tall woodland 5:1 2084 0.21
Total grid route impact amended footprint 14 2869
0.3 ha
*Figures represent only the amended component of the grid route. Impact figures for the entire Grid Route are provided in the SEB
Report (EBS Ecology 2017)

12
Discussion
The overall impact on native vegetation due to the grid route realignment has reduced from one hectare to 0.3
ha which includes 50m wide clearance in woodland areas (for power line clearance) and possible pole
installation (based on 3m x 3m impact area at a minimum of 275m spacing). The amendment results in a
slight (negligible) increase in the impact on Austrostipa sp. grassland and a decrease in the footprint of the
threatened ecosystem E. odorata (DEH provisional ratings, 2009). The impact on Eucalyptus camaldulensis
ssp. camaldulensis tall woodland (creek lines) is almost the same as the previous alignment, but the condition
has dropped from 6:1 to 5:1 due to a considerable reduction in native understorey.
Table 4; Summary of impact change on vegetation associations
VA Description Impact previous Impact amended
2 Austrostipa sp. grassland 0.001 0.02
9 Eucalyptus odorata (Peppermint Box) woodland 0.8 0.1
10 Eucalyptus camaldulensis ssp. camaldulensis tall woodland 0.2 0.2
Total 1 ha 0.3 ha
Overall the impact of the amended grid route is reduced when compared with the previous alignment (which
was approved by the NVC) and appears to provide a preferable alignment with respect to native vegetation.
However, a number of trees remain impacted in the creekline and along Tableland Road (Figure 6).
Eucalyptus odorata (Peppermint Box Woodland) observed within the amended footprint on Tableland Road is
not listed under the EPBC Act due to the limited extent and low diversity. However, it is still considered
threatened for South Australia (DEH, 2009) and clearance should be minimised where feasible and in
conjunction with powerline vegetation clearance zones required in the Act (Electricity Regulations (Principles
of Vegetation Clearance) 2010. Based on the previous approved alignment, the NVC agreed that impact had
been sufficiently minimised in line with the requirements of Native Vegetation Act, 1991: Regulation 5(1)(d)
Building or Provision of Infrastructure, including infrastructure in the public interest. Given that the impact has
been further reduced with the grid realignment it seems reasonable that all options for minimising impact have
been explored, the amended grid realignment may provide the best outcome.
A new species was observed along Biele Road in the proposed grid route amendment Leiocarpa tomentosa
(Woolly Plover Daisy) which is rated ‘near threatened’ for the NY NRM Region. Although not officially
categorised as threatened (regionally or under any legislation), the species appears fairly uncommon in the
area and has not been observed elsewhere on the TCWF. The plant was observed in a patch within the
amended footprint on Biele Road, but did not occur either side of the footprint. Given its isolation, it would be
preferable if this species were not cleared. Clearance at this location is restricted to possible pole installation
and clearance of understorey vegetation can potentially be avoided if poles are located in other areas. Given
the plant is a small daisy less than one metre high (Figure 2), it is likely that this can be achieved without
moving the grid alignment.

Volume 2 Part 1 – WAX Design
Landscape Character and Probable Visual Effect Assessment - 19 January 2018; and
Landscape Character and Probable Visual Effect Assessment Appendices - 19 January 2018

Landscape Character Assessment (Stage 1) and Preliminary Discussion V01 1
Landscape Character and Probable Visual Effect Assessment
Twin Creek Wind Farm Project RES Australia Pty Ltd
19 January 2018
WAX DESIGN Ltd Pty ACN 117 346 264
Suite 3 241 Pirie Street Adelaide 5000 SA
T 8 8215 0144
Contact: Warwick Keates
© January 18
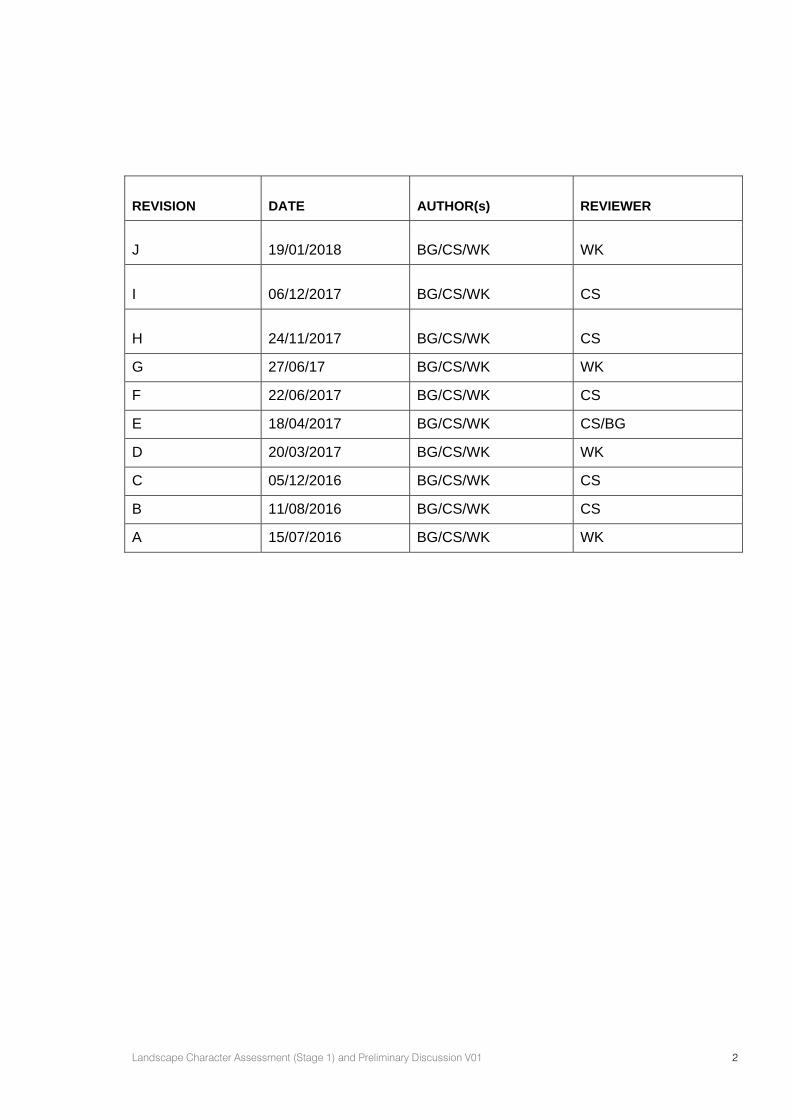
Landscape Character Assessment (Stage 1) and Preliminary Discussion V01 2
REVISION DATE AUTHOR(s) REVIEWER
J 19/01/2018 BG/CS/WK WK
I 06/12/2017 BG/CS/WK CS
H 24/11/2017 BG/CS/WK CS
G 27/06/17 BG/CS/WK WK
F 22/06/2017 BG/CS/WK CS
E 18/04/2017 BG/CS/WK CS/BG
D 20/03/2017 BG/CS/WK WK
C 05/12/2016 BG/CS/WK CS
B 11/08/2016 BG/CS/WK CS
A 15/07/2016 BG/CS/WK WK

Contents
Landscape Character Assessment (Stage 1) and Preliminary Discussion V01 3
1.0 Scope of Assessment .................................................................................................................... 7
1.1 Introduction ..................................................................................................................................... 7
1.2 Project Description ......................................................................................................................... 7
1.3 Site Locality .................................................................................................................................... 8
02 Introduction ..................................................................................................................................... 9
2.1 Visual Assessment Approach ........................................................................................................ 9
2.2 Guidance and Best Practice ........................................................................................................ 10
2.3 Methodology ................................................................................................................................. 10
03 Landscape Character Assessment ............................................................................................. 17
3.1 The Site Locality ........................................................................................................................... 17
3.2 Land Use and Land Cover ........................................................................................................... 20
3.3 Landform and Geomorphology ................................................................................................... 20
3.4 Landscape Character Units ......................................................................................................... 20
3.4.1 Northern Barossa Valley .............................................................................................................. 22
3.4.2 Western Pastoral Lands and Ridgelines .................................................................................... 23
3.4.3 Central Tablelands ....................................................................................................................... 24
3.4.4 Mount Rufus Ridgeline ................................................................................................................ 25
3.4.5 Western Murray River Plains ....................................................................................................... 27
04 Zone of Theoretical Visual Influence .......................................................................................... 28
4.1 Zone of Theoretical Visual Influence (ZTVI) ............................................................................... 28
05 Visual Impact Assessment .......................................................................................................... 31
5.1 Visual Assessment Scope ........................................................................................................... 31
5.2 Visual Impact Assessment .......................................................................................................... 31
5.2 Viewpoint 1: Kapunda-Truro Road, Ebenezer ........................................................................... 34
5.3 Viewpoint 2: Kaunda-Truro Road, Koonunga ............................................................................ 36
5.4 Viewpoint 3: Intersection of Bagot Well Road and Kapunda-Eudunda Road, Bagot Well ..... 38
5.5 Viewpoint 4: Tablelands Road, south of Eudunda ..................................................................... 40
5.6 Viewpoint 5: Von Reiben Road, east of Eudunda ...................................................................... 42
5.7 Viewpoint 6: Tablelands Road, south of Mount Rufus .............................................................. 44
5.8 Viewpoint 7:Sturt Highway, east of Truro ................................................................................... 47
5.9 Summary of Visual Impacts ......................................................................................................... 50
5.10 Design Review and Visual Management .................................................................................... 54
5.11 Substations and Transmission line Visual Effect Assessment ................................................. 55
5.12 Site Substation, Control Buildings and Operational Maintenance Compound ........................... 55
5.13 Transmission Line and Substation Connection to Existing 275kv ............................................... 56
5.14 Probable Visual Effect Discussion for Viewpoints 6, 7 and 9 ....................................................... 59
5.15 Access tracks ............................................................................................................................... 62
5.16 Underground cable routes ........................................................................................................... 62

Contents
Landscape Character Assessment (Stage 1) and Preliminary Discussion V01 4
06 Review of Development Plan (Desired Character Statements) ................................................ 63
6.1 Introduction ................................................................................................................................... 63
6.2 Primary Production Zone (GDP and LDP) and Rural Zone (MMDP) ....................................... 64
6.3 Renewable Energy Facilities: Wind Farms and Ancillary Development .................................. 65
6.4 Council Wide Provisions .............................................................................................................. 65
06 State Wide Landscape Scenic Quality Values ........................................................................... 68
6.1 Review of State Wide Landscape Scenic Quality Values ......................................................... 68
6.2 State Wide Landscape Scenic Quality Values ........................................................................... 68
07 Cumulative Visual Effect .............................................................................................................. 71
7.1 Description of Cumulative Visual Effect ...................................................................................... 71
7.2 Discussion of Cumulative Visual Effect ...................................................................................... 71
08 Viewer Sensitivity ......................................................................................................................... 72
09 Conclusion .................................................................................................................................... 73
Appendices (please refer to Appendices report)
Appendix A Assessment Mapping
Appendix B Photographic Methodology (produced by Convergen)
Appendix C Photomontages and Turbine Locations
Appendix D Supplementary Photomontages with Substations and Transmission Line
Appendix E GrimKe Assessment Matrix
Appendix F Glossary
Appendix G Relevant Experience
Appendix H Endnotes

Figures & Tables
180119_twin creeks lvia_j_16twf.docx 5
Figure 1: Detailed Visual Assessment Process .............................................................................................. 9
Figure 2: LVIA – Two Assessment Stages and Associated Tasks. .............................................................. 11
Figure 3: Viewpoint Locations ....................................................................................................................... 13
Figure 4: View of the land use and land forms typical for the locality .......................................................... 17
Figure 5: Proposed site location ................................................................................................................... 18
Figure 6: Topographic digital terrain model (10m contours) ....................................................................... 19
Figure 7: Landscape character units ............................................................................................................ 21
Figure 8: Views north from Wolf Blass winery along Kapunda-Truro Road ................................................. 22
Figure 9: Enclosed views in the township of Kapunda ................................................................................ 24
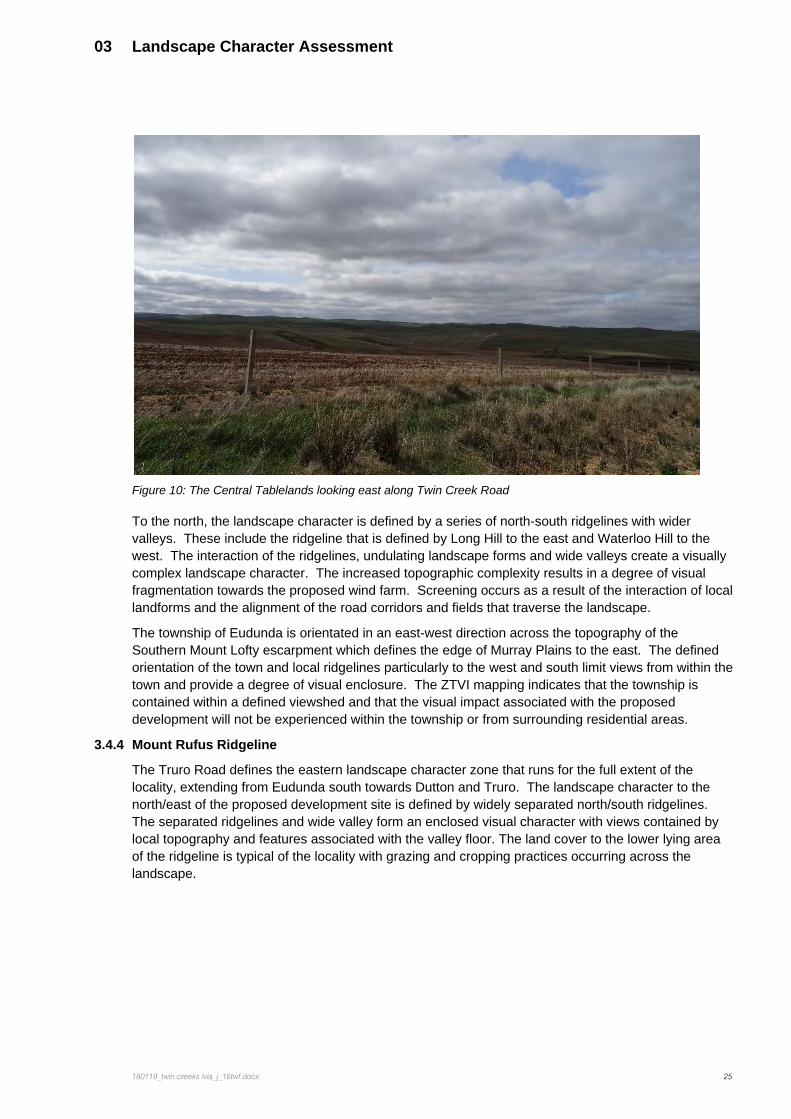
Figure 10: The Central Tablelands looking east along Twin Creek Road .................................................... 25
Figure 11: Views east to Mt Rufus ridgeline ................................................................................................. 26
Figure 12: Views east looking over the Murray Plains .................................................................................. 27
Figure 13: ZTVI map for the Twin Creek Wind Farm based on 180 metre turbine height ........................... 29
Figure 14: ZTVI map for the Twin Creek Wind Farm based on 112 metre turbine hub height .................... 30
Figure 15: Viewpoint locations and Wind Turbine numbers ......................................................................... 33
Figure 16: Viewpoint 1: Kapunda-Truro Road, Ebenezer ............................................................................. 34
Figure 17: Digital Overlay showing all Turbines: Viewpoint 1 ....................................................................... 34
Figure 18: Absorption Capacity Calculations: Viewpoint 1 .......................................................................... 34
Figure 19: Viewpoint 2; Kapunda-Truro Road, Koonunga ........................................................................... 36
Figure 20: Digital Overlay showing all Turbines: Viewpoint 2 ....................................................................... 36
Figure 21: Absorption Capacity Calculations: Viewpoint 2 .......................................................................... 37
Figure 22: Viewpoint 3; Intersection of Bagot Well Road and Kapunda-Eudunda Road, Bagot Well ........ 38
Figure 23: Digital Overlay showing all Turbines: Viewpoint 3 ....................................................................... 39
Figure 24: Absorption Capacity Calculations: Viewpoint 3 .......................................................................... 39
Figure 25: Viewpoint 4; Tablelands Road, south of Eudunda ...................................................................... 41
Figure 26: Digital Overlay showing all Turbines: Viewpoint 4 ....................................................................... 41
Figure 27: Absorption Capacity Calculations: Viewpoint 4 .......................................................................... 41
Figure 28: Viewpoint 5; Von Reiben Road, east of Eudunda ....................................................................... 43
Figure 29: Digital Overlay showing all Turbines: Viewpoint 5 ....................................................................... 43
Figure 30: Absorption Capacity Calculations: Viewpoint 5 .......................................................................... 43
Figure 31: Viewpoint 6; Tablelands Road, south of Mount Rufus ................................................................ 45
Figure 32: Digital Overlay showing all Turbines: Viewpoint 6 ....................................................................... 45
Figure 33: Absorption Capacity Calculations: Viewpoint 6 .......................................................................... 45
Figure 34: Viewpoint 7; Sturt Highway, east of Truro ................................................................................... 47
Figure 35: Digital Overlay showing all Turbines: Viewpoint 7 ....................................................................... 47
Figure 36: Absorption Capacity Calculations: Viewpoint 7 .......................................................................... 48
Figure 37: Summary of viewpoint visual effect ............................................................................................. 53
Figure 38: Substations and Transmission Line ............................................................................................ 58
Figures & Tables
180119_twin creeks lvia_j_16twf.docx 6
Figure 39: Viewpoint 6; Tablelands Road, south of Mount Rufus ................................................................ 59
Figure 40: Viewpoint 6 Photomontage.......................................................................................................... 59
Figure 41: Digital Overlay showing all Infrastructure and Turbines: Viewpoint 6 ......................................... 59
Figure 42: Viewpoint 7; Sturt Highway, east of Truro ................................................................................... 60
Figure 43: Viewpoint 7 Photomontage.......................................................................................................... 60
Figure 44: Digital Overlay showing all Infrastructure and Turbines: Viewpoint 7 ......................................... 60
Figure 45: Viewpoint 9; Sturt Highway, east of Truro ................................................................................... 61
Figure 46: Viewpoint 9 Photomontage.......................................................................................................... 61
Figure 47: Digital Overlay showing all Infrastructure and Turbines: Viewpoint 9 ......................................... 62
Figure 488: Digital illustration showing landscape screening after 10 years: Viewpoint 9 .......................... 62
Figure 49: Landscape Character Regions of South Australia (Lothian, 2000 with red dot indicating wind farm location)................................................................................................................................................. 69
Figure 50: Landscape Quality of South Australia (Lothian, 2000 with red dot indicating wind farm location) ....................................................................................................................................................................... 70
Table 1: Summary of Viewpoint location information ................................................................................... 32
Table 2: Summary of Visual Impacts ............................................................................................................ 50
Table 3: Classification of Visual Impacts ...................................................................................................... 51
01 Scope of Assessment
180119_twin creeks lvia_j_16twf.docx 7
1.0 Scope of Assessment
1.1 Introduction
This report has been prepared by Warwick Keates of WAX Design in association with Dr Brett Grimm of Brett Grimm Landscape Architect for RES Australia Pty Ltd (RES) to assess the potential visual impact of the proposed Twin Creek Wind Farm project (the Project). The aim of this report is to evaluate the existing landscape character, identify the potential viewpoints for the final visual impact assessment and provide a discussion around the degree of visual change that is likely to result from the introduction of the proposed wind farm and associated infrastructure into the existing landscape character of the locality.
The Landscape and Visual Impact Assessment (LVIA) comprises of two separate assessments, a landscape character assessment and a visual impact assessment; these are interrelated processes as described in the Guidelines for Landscape and Visual Impact Assessment1. The landscape character assessment described in this report considers the existing character of the landscape and the site locality. The site locality is considered as the areas around the Project from which the wind turbines and associated infrastructure are likely to be visible in the landscape as described in section 1.3 below. The visual impact assessment considers the likely effect of the proposed development on the physical landscape which may give rise to changes in its character and the resultant effects on visual amenity.
The potential visual impact will be assessed using the Grimke matrix methodology that involves on-site assessments, GIS modelling, consultation with relevant stakeholders and interested parties through RES, the preparation of photomontages and a detailed visual impact assessment to illustrate the predicted visual effect of the Project within the defined locality. The visual impact assessment forms the second stage of the LVIA process.
1.2 Project Description
RES Australia Pty Ltd (RES Australia) proposes to develop the Twin Creek Wind Farm within the Mid North area of South Australia. The site of the proposed wind farm is approximately 90km north east of Adelaide and northeast of Kapunda.
RES is one of the world's leading independent renewable energy companies, with the expertise to develop, engineer, construct, finance, and operate projects around the globe. RES Australia has been developing renewable energy projects in Australia since 2004.
The proposed wind farm will consist of the following components:
Up to 51 Wind Turbines Generators (WTG) Each WTG has a capacity up to 3.6 Megawatts (MW), with a total installed wind capacity up to
183MW Overall height of turbines would be up to 180 metres at the blade tip Associated hard standing areas and access roads Operations and maintenance building and compound with associated car parking Two electrical substations Battery energy storage Overhead and underground electrical cable reticulation 132kV overhead transmission line Meteorological Masts for measuring wind speed and other climatic conditions Temporary construction facilities including a borrow pit and concrete batching plant facilities.
1Swanwick, C. (2013). Guidelines for Landscape and Visual Impact Assessment. 3rd ed. United Kingdom: Landscape Institute and Institute of Environmental Management and Assessment.

01 Scope of Assessment
180119_twin creeks lvia_j_16twf.docx 8
1.3 Site Locality
A 20km site locality around the project has been defined for assessment purposes and is based on research and previous experience in defining thresholds for scale and identification of visual effect. Most notably the Thomas matrix2 and Bishop (2002)3 has provided guidance on this matter. Also, the extent of the site locality has been reviewed against the Zone of Theoretical Visual Influence (ZTVI) mapping. This mapping provides a reference of the extent to which the Project is likely to be visible in the landscape and defines the viewshed resulting from the local topography (excluding vegetation and built form screening).
The landscape character assessment of the proposed wind farm consists of written descriptions and photographic surveys of the surrounding locality to articulate the character of the existing landscape that surrounds the site in relation to the local (0-3km), sub-regional (3-10km) and regional (>10km) landscapes. This is followed by a discussion of the probable visual effect that is anticipated to occur across the regional landscape as well as within the infrastructure corridors associated with the proposed project. The landscape character and visual assessment provide the basis on which to measure the suitability of the development in relation to the visual impact within the regional area (20km) and in regards to the relevant provisions of the development plan.
Recognition of the potential visual impact of a layout design is implicit in the design process. This includes early reference to development plan provisions and relevant guidance reports.
.
2Sinclair, G. (2001). The Potential Visual Impact of Wind Turbines in relation to distance: An approach to the environmental assessment of planning proposals. E.I.Services
3 Bishop, I. (2003). Determination of thresholds of visual impact: the case of the wind turbines: Environment and Planning B: Planning and Design: 707-718
180m
136m
112m

02 Introduction
180119_twin creeks lvia_j_16twf.docx 9
02 Introduction
2.1 Visual Assessment Approach
The aim of the LVIA methodology is to provide an objective, reliable, credible, replicable and measurable analysis of the potential visual impact when considered against the existing landscape character.
The process for the visual assessment is based on the recommendations of John Ginivanand Planning SA (2002)4 and considers the visual assessment regarding the Primary Landscape Character Assessment and Detailed Visual Effect Assessment (excluding Qualitative Subjective Assessment).
Figure 1: Detailed Visual Assessment Process
4Planning South Australia (2002). Advisory Notice Planning- Draft for Consultation 21 Wind Farms. S.A Adelaide
Review the Project – Define its size, scale,
number of wind turbines, clustering and
location. Consider significance of local, sub-
regional and regional context
Preliminary Landscape Assessment
(Existing Landscape Character)
Define the potential view shed and describe the
landscape character and scenic quality. Identify
significant viewpoints for detailed assessment. Assess
landscape character, local, sub-regional, regional
zones considering specific criteria:
— Relief
— Vegetation Coverage
— Built form and Infrastructure
Assess and quantify degree of visual
modification likely to be caused at the key
Quantitative Objective
Assessment
Quantify Visual Effects of proposed
development considering specific
criteria:
— Visual Absorption
— Horizontal Visual Effect
Vertical Visual Effect
Qualitative Subjective
Assessment
Consider viewer sensitivity at key
viewpoints and determine importance
of viewpoint.
Detailed Visual Effect Assessment
(A t f Vi l I t)

02 Introduction
180119_twin creeks lvia_j_16twf.docx 10
2.2 Guidance and Best Practice
Currently, there is no formalised standard visual assessment methodology at local, state or federal government levels. While various guidelines and frameworks have been produced, they do not provide a definitive methodology or technique to be applied. For the visual assessment of the Twin Creek Wind Farm to follow a ‘best practice’ approach, the assessment methodology has been defined with reference to the following documents:
• Wind Farm Development Guidelines for Developers and Local Government Planners (2014), Central Local Government Region of South Australia5;
• Environment Protection and Heritage Council (2010) National Wind Farm Development Guidelines;
• Siting and Designing Wind Farms in the Landscape (version2)(2014) Scottish Natural Heritage;
• Guidelines for Landscape and Visual Impact Assessment (Third edition) (2013), Landscape Institute;
• Grimm, B (2009). Quantifying the Visual Effects of Wind Farms; A Theoretical Process in an Evolving Australian Visual Landscape. PhD Thesis Adelaide University;
• Australian Wind Energy Association and Australian Council of National Trusts (2007) Wind Farms and Landscape Values: National Assessment Framework;
• Visual Landscape Planning in Western Australia. (2007).A manual for evaluation, assessment, siting and design, Western Australian Planning Commission;
• Best Practice Guidelines for the Implementation of Wind Energy Projects in Australia (2006);
• Lothian, A. (2008). Scenic perceptions of the visual effects of wind farms on South Australian landscapes. Geographical Research, 46:2, 196 – 207;
• Swanwick, C. (2013). Guidelines for Landscape and Visual Impact Assessment. 3rd ed. United Kingdom: Landscape Institute and Institute of Environmental Management and Assessment;
• Policy and Planning Guidelines for Development of Wind Energy Facilities in Victoria (2002);
• South Australian Wind Farms Planning Bulletin (2002); and
• Lothian, A. (2000). Landscape Quality Assessment of South Australia. PhD Thesis Adelaide University.
2.3 Methodology
The approach used for the LVIA is based on two assessment stages with reference to the Guidelines for Landscape and Visual Impact Assessment, and set out in Figure 2.Stage 1; Landscape character assessment is concerned with identifying and assessing the importance of landscape characteristics and the existing landscape quality. Stage 2; The visual assessment aims to quantify the extent to which the development is visible as well as defining the degree of visual change and the associated visual impacts using the Grimke Matrix.
The completed landscape character assessment and visual impact assessment are used to draw a number of conclusions about the magnitude of the visual effects of the proposed development on the site locality.
The LVIA includes two assessment stages and associated tasks as seen in Figure 2. The following table outlines a detailed description of each process conducted within the methodology.
5 Source online (2015). http://www.lga.sa.gov.au/webdata/resources/files/2012.32%20-
%20Windfarm%20Development%20Guidelines%20-%20Final%20Report.pdf. [Accessed 08 September 2015].

02 Introduction
180119_twin creeks lvia_j_16twf.docx 11
Desktop Studies
The Landscape Character Assessment for the project includes reviews of the project documentation, the proposed development location and infrastructure associated with the proposed development. Analysis of GIS maps, landscape photography, aerial photographs and supporting literature were also reviewed to establish a broad comprehension of the scope of the proposed wind farm and the existing landscape character.
Figure 2: LVIA – Two Assessment Stages and Associated Tasks.
Landscape and Visual Impact Assessment (LVIA)
Desktop Studies
Viewpoint Selection
Zone of Theoretical Visual Influence
Site Visits
Assessment Stage 1: Landscape Character Assessment
Design Review and Visual Management
Assessment Stage 2: Visual Impact Assessment
Photomontage Production Viewpoint Assessment
Visual Effect Interpolation
Planning Review

02 Introduction
180119_twin creeks lvia_j_16twf.docx 12
Viewpoint Selection
Viewpoint selection was conducted by WAX Design and BGLA as part of an initial site visit on the 20th May 2016 and during subsequent desktop analysis. The selection of the viewpoints provides locations from which a detailed visual assessment of the potential visual effect can be made as part of the stage 2 assessment. The locations are also selected on the basis of being representative of the locality, public locations and viewpoints where a large proportion of the wind farm is visible.
A total of seven (7) viewpoints were selected surrounding the project during this site visit to provide an understanding of the likely visual effect.
Viewpoint locations were identified using a preliminary ZTVI map which illustrates the likely degree of visibility in accordance to topography. The site assessment certified the evaluation of the ZTVI with reference to vegetation screening and local landforms not depicted in the ZTVI.
Each viewpoint represents a typical location where the greatest probable degree of visual change that will be experienced as a result of the proposed development within the existing landscape. The seven viewpoints were confirmed by RES, relevant stakeholders and tested during the initial community consultation before the final stage of visual impact assessment.

02 Introduction
180119_twin creeks lvia_j_16twf.docx 13
Figure 3: Viewpoint Locations

02 Introduction
180119_twin creeks lvia_j_16twf.docx 14
Zone of Theoretical Visual Influence
In order to gain an appreciation of where the project will be visible from; Zone of Theoretical Visual Influence (ZTVI) maps have been produced. The mapping provides an illustrative depiction of where the development may be seen within the landscape. The maps quantify the extent to which the wind turbines are likely to be seen considering a maximum blade tip height of 180m and hub height of 112m.
The analysis uses a digital terrain model, and computer generated models of the turbines to illustrate how many individual turbines would be visible from any location around the wind farm. It should be noted that the ZTVI does not take into account the impact of local vegetation, buildings or localised landforms as it is based on a 10m contour data set. This means that theoretically, the visual impact of the wind turbines is evaluated within a landscape devoid of any screening vegetation or other features and as such represents a ‘worst case’ scenario.
Assessment Stage 1: Landscape Character Assessment
The assessment includes identification and description of landscape character units (areas of defined quality determined by topographic form, land use, vegetation association including patterning, colouration and textural relief). In addition, special landscape features are identified. Mapping and photographic surveys are undertaken in addition to written commentary to describe the locality and existing landscape character of the site locality.
As part of the landscape character assessment, the viewpoint selection was confirmed, and the base photography was taken for photomontage production.
The assessment was undertaken on the 20th May 2016to enable the project team to develop a good understanding of the existing landscape character. Weather conditions were predominately overcast and rainy, clearing intermittently.
Assessment Stage 2: Visual Impact Assessment
The assessment of the visual impact includes the production of photomontages to assist in the quantification and qualification of the potential visual effect. The viewpoints identified as part of the preliminary assessment stages were measured using a series of landscape and visual criteria. The assessment results were then mapped to demonstrate the likely visual impact of the project.
The Stage 2 assessment was undertaken on the 8th November 2016 with the site conditions clear with some cloud cover and the visibility was rated as good, extending over several kilometres, throughout the landscape character zone.
Assessment Stage 2: Photomontage Production
Photomontages of the proposed development from each viewpoint were produced by Convergen. The photomontages represent 120 degree horizontal field of view with a 50mm lens digital equivalent photo capture. This has been proven to best represent the human binocular field of view. Details of the methodology used to produce the photomontages are described in Appendix B and represents a best practice approach with reference to ‘Photography and photomontage in landscape and visual impact assessment’ (2011) Landscape Institute (advice note 01/11). For the purposes of the photomontage production, a neutral off white colour was used to represent the wind turbines. This colour selection was made to reflect the proposed colour of the turbines (RAL 7035, Light Grey) while allowing for variations in local light and environmental conditions.
WAX and BGLA validated the accuracy of the photomontages during a site visit on the 8th November 2016. The combination of a photomontage assessment and an on-site review ensures issues typically associated with photographic simulations such as image compression and distortion are mitigated by assessing and measuring the visual effect in-situ using GPS and a bearing compass. This enables the photomontages to be ground-truthed for positional correctness and scale. Any minor

02 Introduction
180119_twin creeks lvia_j_16twf.docx 15
distortion to the edge of the 120 degrees provided by the horizontal field extent and 2 dimensional image representations are reflected relatively in the simulated modelling overlay.
The photomontage images were used to inform the detailed viewpoint assessment.
Assessment Stage 2: Viewpoint Impact Assessment
The viewpoint assessment of the project uses a combination of visual assessment measurements and descriptive text. This comprises site observations with reference to prepared photomontages and a detailed assessment of the baseline landscape character and visual impact.
Initially, the baseline landscape character for each viewpoint was assessed regarding:
• Relief (the complexity of the land that exists as part of the underlying landscape character);
• Vegetation Cover (the extent to which vegetation is present and its potential to screen and filter views);
• Infrastructure and Built Form (the impact of development on landscape and visual character); and
• Cultural Sensitivity(existing cultural overlays, planning designations and any identified listing of heritage items and or local sensitivities to landscape such as scenic drives and viewpoints).
A value was generated for the existing landscape relative to each viewpoint. This value formed the baseline assessment value. It is this baseline value that is modified by the impact of the development on the landscape, which in turn informs the degree of visual effect.
Following the landscape character assessment, each viewpoint was then assessed on the following visual effects:
• Percent of landscape absorption (the landscape's ability to absorb and screen the development form);
• Horizontal visual effect (percentage spread of the development in the field of view);
• Vertical visual effect (vertical scale of the development as a percentage of the existing landscape scale within the field of view); and
• Distance of visual effect (distance between viewpoint and development).
The landscape character and visual effect measurements were combined to produce a quantified value for the degree of visual change that resulted from the project at each viewpoint (refer to Appendix E for detailed assessment criteria and matrix methodology).
Assessment Stage 2: Visual Effect Interpolation
The findings of the visual impact assessment for each viewpoint were used to provide a percentage value to the degree of visual change. Each viewpoint was cartographically mapped in GIS, and the values used in a distance weighted interpolation. The ZTVI was overlayed onto the visual effect interpolation map to define the extent of visibility. The combination of Visual Effect Interpolation and ZTVI provided a map of likely visual impact experienced in the site locality as a result of the project. This map provides relativity to the likely experience of visual effect within the regional locality.
Design Review and Visual Management
The evolution of the development proposal has seen iterations to the layout and scope of the project. The original proposal comprised of 60 wind turbines of which 16 have been removed resulting in a wind farm that consists of 51 wind turbines. In addition, several micro-siting changes were made as part of an iterative process due to stakeholder consultation and preliminary site investigations for flora and fauna.

02 Introduction
180119_twin creeks lvia_j_16twf.docx 16
During the Design Review and Visual Management stage an additional visual assessment was undertaken to understand the anticipated visual effect of the proposed infrastructure associated with the wind farm. This included an additional photomontage of viewpoint 6 and 7 to include the proposed infrastructure elements as well as the production of an additional viewpoint that shows the proposed transmission substation. The production of these additional photomontages made a number of assumptions in regards to the final design of the infrastructure elements. It is for this reason that the infrastructure elements of the development and there potential visual effect are assessed in this section and are not incorporated into sections 5.1 to 5.9.
Planning Review
A review of the landscape and visual impacts of the development from a planning context was also undertaken. The planning review included a review of the Light Regional Council Development Plan (Consolidated 8 December 2016), Goyder Council Development Plan (Consolidated 24 November 2016) and the Mid Murray Council Development Plan (24 November 2016 - Integrated Water Management Regional DPA not consolidated into 31 July 2014), the State Wide Landscape Scenic Quality Values report6 and a research study conducted by Dr Andrew Lothian in addition to research on the visual effects of wind turbines7.
These documents provided a range of recommendations that influenced the development assessment of the Project proposal. In particular, the potential visual impact of the development has been reviewed and discussed against the relevant desired character statements with specific reference to landscape and visual considerations resulting from the development of the Project.
6Lothian, A. (2000). Landscape Quality Assessment of South Australia. Department of Geographical & Environmental Studies. University of Adelaide. PhD
7Lothian, A. (2008). Scenic Perceptions of the Visual Effects of Wind Farms on South Australian Landscapes. Geographical Research, 46:2, June, 1996-207

03 Landscape Character Assessment
180119_twin creeks lvia_j_16twf.docx 17
03 Landscape Character Assessment
3.1 The Site Locality
The project (as shown in Figure 5) is located approximately 90 kilometres northeast of Adelaide. The subject land is located on the tablelands that form the wide ridgeline associated with Bald Hill and Long Hill situated within the Northern Mount Lofty Ranges. The site is located between the townships of Kapunda, Eudunda and Truro.
The locality can be defined by four distinct landscape character areas which largely follow the four cardinal directions (north, east, south and west). To the south of the subject land is the Northern Barossa Valley, which has a denser level of development and high quality agricultural landscape with a variety of visual interest created by the smaller lot sizes and a variety of land uses (grazing, vineyards, animal husbandry). The Western Pastoral Lands and Ridgelines stretch along the western edge of the subject locality and is defined by a more open agricultural landscape with rolling ridgelines. The subject locality itself and to the north are the Central Tablelands; these are characterised by rolling landforms and valleys associated with the Northern Mount Lofty Ranges and have a typically open grass grazing land use with minimal vegetation. To the east of the subject locality is Mount Rufus and associated north/south ridgelines which transition further west into the Western Murray River Plains, the ridgeline associated with Mount Rufus forms a distinct division between the subject locality and the Murray River Plains.
Figure 4: View of the land use and land forms typical for the locality

03 Landscape Character Assessment
180119_twin creeks lvia_j_16twf.docx 18
Figure 5: Proposed site location

03 Landscape Character Assessment
180119_twin creeks lvia_j_16twf.docx 19
Figure 6: Topographic digital terrain model (10m contours)

03 Landscape Character Assessment
180119_twin creeks lvia_j_16twf.docx 20
3.2 Land Use and Land Cover
The land cover associated with the locality of the development site reflects various agricultural land use including arable and pastoral practices and is consistent across the locality with little variation in scale or function. The landscape surrounding the site is dominated by grazing with open paddocks defined by fenced boundaries and occasional trees to fence lines and creek lines. The land use that occurs on the open valley floor between the local ridgelines and across the tablelands associated with Bald Hill is more diverse with areas of arable cropping and grazing.
This land cover creates a patchwork character to the landscape with changes in colour and texture as a result of the different agricultural practices. Typically, the land cover and associated vegetation are low lying with limited visual screening to the west, south and north. Areas to the east associated with the Mount Rufus ridgelines and the northern outskirts of Nuriootpa possess more extensive tree cover. Vineyards are a notable visual element creating a defined pattern to the northern outskirts of Nuriootpa emphasising the landscape qualities of the Barossa Valley.
3.3 Landform and Geomorphology
The landform of the area is defined by numerous ridgelines that run north-south through the site creating a series of parallel ridges, wide open valleys, tablelands and isolated topographic features. The progressive geological faulting and folding processes that have formed the Southern Flinders Ranges and Northern Mount Lofty Ranges dominate the area creating numerous undulating ridges and escarpments.
The site is dominated by the prominent geomorphology of the Light Ranges and northern extent of the Barossa Ranges that create north/south orientated ridgelines. Further south of the project site the ridgelines decrease in height and become more fragmented creating isolated hills and promontories, which produce an elevated undulating landscape.
East is an expansive low lying landscape associated with the Murray Plains. This open landscape character creates distant views east and south east from elevated locations such as Mount Rufus.
To the west are the ridges and valleys formed by the Nain Ranges, Greenock Ranges and Light Ranges which create overlapping north/south landforms of an approximate 100-200m vertical variance to the valleys in between which is typical of the area.
To the north, the geomorphology of the landscape increases in scale and complexity with larger and more widely spaced ridges and valleys, particularly in relation to the Tothill and Scrubby Ranges and the Belalie Plain. These landforms continue in a north/south direction before transitioning into the more dramatic topography of the Southern Flinders Ranges.
3.4 Landscape Character Units
To understand how and to what degree the Project will produce a visual effect in the existing landscape, an assessment to identify landscape character units has been undertaken as is shown in Figure 7. This assessment identified a number of landscape character areas within the site locality that contain similar landscape qualities in relation to land use, topography, vegetation, visual patterning, texture and scale.
The regional landscape context surrounding the project contains five (5) landscape character areas which are;
1. Northern Barossa Valley
2. Western Pastoral Lands and Ridgelines
3. Central Tablelands
4. Mount Rufus Ridgeline
5. Western Murray River Plains

03 Landscape Character Assessment
180119_twin creeks lvia_j_16twf.docx 21
Figure 7: Landscape character units

03 Landscape Character Assessment
180119_twin creeks lvia_j_16twf.docx 22
3.4.1 Northern Barossa Valley
The northern edge of the Barossa Valley forms a defined landscape character south of the proposed wind farm site and is defined by the townships of Nuriootpa, Stockwell and Greenock.
Nuriootpa, with the largest population, demonstrates the more urban nature of these townships which results in a number of commercial and industrial buildings to the outskirts of town and an increased density of residential development in and around the town.
The cadastral overlay of the landscape character reflects the historical 80 acre agricultural pattern creating a defined patchwork of paddocks, vegetated field boundaries and tree groups that cover the gently rolling landscape and topography of the area. The land use is predominantly agricultural including vineyards, grazing, cropping and various areas of animal husbandry interspersed with rural living properties and single story dwellings on large rural land parcels. This combination of topography, large belts of vegetation and land use creates an attractive rural landscape.
The low lying topography of this area creates an open visual character to the north that is framed by vegetation and distant ridgelines to the east and west associated with the Northern Mount Lofty Ranges and Southern Mount Lofty Ranges respectively. Localised embankments and residential development coupled with vegetation along field boundaries restrict the potential for long distance views towards the north.
The northern ridgeline associated with Bald Hill defines the northern edge of the Barossa Valley. The well vegetated landscape character and defined field boundaries of the Barossa is replaced with a rolling grazed landscape with isolated pockets of trees and an absence of fencing or agricultural buildings.
Between the township of Nuriootpa and Stockwell, along the Kapunda-Truro Road, is the Wolf Blass winery. This represents a tourist location and illustrates the visual landscape character of this locality. Views from this location are largely screened towards the project site and enclosed by belts of vegetation associated with the existing field patterns. The land cover is predominantly vineyards with rural living and single story development on large land parcels. The existing vegetation consists of large stands of eucalypts across the valley floor and results in a series of dense landscape screens
Figure 8: Views north from Wolf Blass winery along Kapunda-Truro Road
03 Landscape Character Assessment
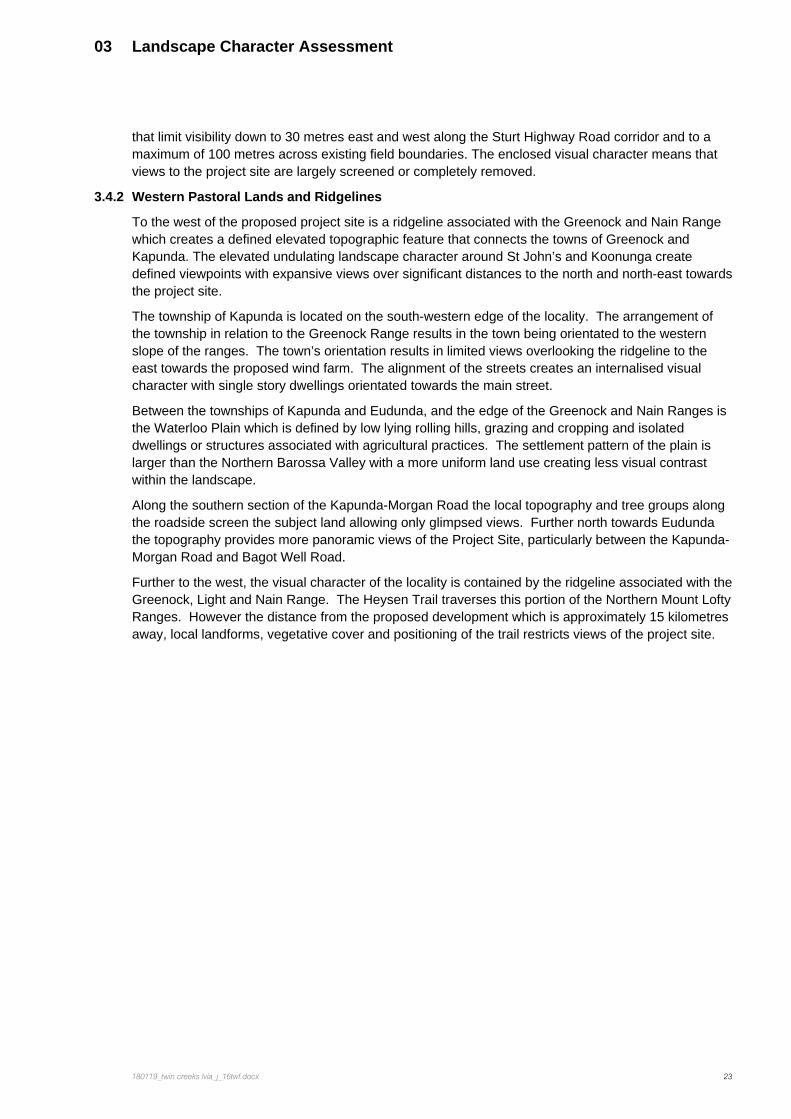
180119_twin creeks lvia_j_16twf.docx 23
that limit visibility down to 30 metres east and west along the Sturt Highway Road corridor and to a maximum of 100 metres across existing field boundaries. The enclosed visual character means that views to the project site are largely screened or completely removed.
3.4.2 Western Pastoral Lands and Ridgelines
To the west of the proposed project site is a ridgeline associated with the Greenock and Nain Range which creates a defined elevated topographic feature that connects the towns of Greenock and Kapunda. The elevated undulating landscape character around St John’s and Koonunga create defined viewpoints with expansive views over significant distances to the north and north-east towards the project site.
The township of Kapunda is located on the south-western edge of the locality. The arrangement of the township in relation to the Greenock Range results in the town being orientated to the western slope of the ranges. The town’s orientation results in limited views overlooking the ridgeline to the east towards the proposed wind farm. The alignment of the streets creates an internalised visual character with single story dwellings orientated towards the main street.
Between the townships of Kapunda and Eudunda, and the edge of the Greenock and Nain Ranges is the Waterloo Plain which is defined by low lying rolling hills, grazing and cropping and isolated dwellings or structures associated with agricultural practices. The settlement pattern of the plain is larger than the Northern Barossa Valley with a more uniform land use creating less visual contrast within the landscape.
Along the southern section of the Kapunda-Morgan Road the local topography and tree groups along the roadside screen the subject land allowing only glimpsed views. Further north towards Eudunda the topography provides more panoramic views of the Project Site, particularly between the Kapunda-Morgan Road and Bagot Well Road.
Further to the west, the visual character of the locality is contained by the ridgeline associated with the Greenock, Light and Nain Range. The Heysen Trail traverses this portion of the Northern Mount Lofty Ranges. However the distance from the proposed development which is approximately 15 kilometres away, local landforms, vegetative cover and positioning of the trail restricts views of the project site.

03 Landscape Character Assessment
180119_twin creeks lvia_j_16twf.docx 24
3.4.3 Central Tablelands
The landscape character associated with the locality immediately surrounding the proposed wind farm development is defined by numerous undulating landforms forming a broad raised tableland that extends between Bald Hill, at the northern edge of the Barossa Valley, north towards Eudunda. The undulating landforms rise approximately twenty to thirty metres in elevation above the underlying valley plain creating a visual complexity of prominent landforms and wide gullies. The land cover is defined by an open grazed field pattern which is almost completely devoid of vegetation except for isolated trees to some tree groups in parts of the landscape.
The elevated landforms have defined rolling escarpments that create topographic screens reducing views to other areas. This is particularly prevalent along Camel Road and from a number of properties located within the area.
Figure 9: Enclosed views in the township of Kapunda
03 Landscape Character Assessment
180119_twin creeks lvia_j_16twf.docx 25
To the north, the landscape character is defined by a series of north-south ridgelines with wider valleys. These include the ridgeline that is defined by Long Hill to the east and Waterloo Hill to the west. The interaction of the ridgelines, undulating landscape forms and wide valleys create a visually complex landscape character. The increased topographic complexity results in a degree of visual fragmentation towards the proposed wind farm. Screening occurs as a result of the interaction of local landforms and the alignment of the road corridors and fields that traverse the landscape.
The township of Eudunda is orientated in an east-west direction across the topography of the Southern Mount Lofty escarpment which defines the edge of Murray Plains to the east. The defined orientation of the town and local ridgelines particularly to the west and south limit views from within the town and provide a degree of visual enclosure. The ZTVI mapping indicates that the township is contained within a defined viewshed and that the visual impact associated with the proposed development will not be experienced within the township or from surrounding residential areas.
3.4.4 Mount Rufus Ridgeline
The Truro Road defines the eastern landscape character zone that runs for the full extent of the locality, extending from Eudunda south towards Dutton and Truro. The landscape character to the north/east of the proposed development site is defined by widely separated north/south ridgelines. The separated ridgelines and wide valley form an enclosed visual character with views contained by local topography and features associated with the valley floor. The land cover to the lower lying area of the ridgeline is typical of the locality with grazing and cropping practices occurring across the landscape.
Figure 10: The Central Tablelands looking east along Twin Creek Road

03 Landscape Character Assessment
180119_twin creeks lvia_j_16twf.docx 26
The prominent ridgeline formed by Long Hill and Mount Rufus is associated with the edge of the Murray Plains to the east. There are defined areas of vegetation associated with creek lines, field boundaries and remnant vegetation groups clustered around rocky outcrops that occur to the edge of the ridgelines. Dense vegetation occupies land surrounding Leake Lookout and Mt Rufus providing visual amenity and an enclosed landscape character.
The Federation Lavender Trail runs north/south between Truro and Eudunda; the trail is located predominately through farmland and away from the main roadways. The majority of the trail runs along the eastern side of the Mount Rufus ridgelines ensuring that the topography, local landforms and vegetative cover restrict the view of the proposed wind farm for most of the trail within the locality. The Leake lookout (not accessible by public road) is a stopping point along this trail, it has not been considered in this assessment, however the lookout and the Lavender trail is considered to be consistent with the relativity of visual experience depicted in the interpolation mapping.
The township of Truro is located to the south east along the Truro Road. The township is defined by the east-west orientation of the main street that runs through the centre of the town. The settlement pattern and built form creates a series of low rise buildings that face onto the road alignment. The topographic form on which the town is located creates a defined valley form with views to the surrounding areas contained by local ridgelines, belts of vegetation and isolated dwellings as well as rural buildings.
The underlying topography of the town is interrelated to the Mt Rufus Ridgeline and the Central Tablelands landscape providing a transitional landscape with localised rolling ridgelines limiting distant views. The visual containment of the town extends for several hundred metres north and south from the main street road corridor and for similar distances east-west along the corridor itself.
Figure 11: Views east to Mt Rufus ridgeline

03 Landscape Character Assessment
180119_twin creeks lvia_j_16twf.docx 27
3.4.5 Western Murray River Plains
Further to the east the topography of the landscape diminishes significantly and extends across the Murray Plains east towards the Murray River. The portion of the Murray Plains that is included as part of this landscape character unit is the western edge of the Murray Plains. The low lying landscape character of the Plains allows expansive views to the east over significant distances with limited variation in topography. The landscape is defined by the rural agricultural landscape typical of the area with small clusters of vegetation associated with field boundaries and creek lines within the landscape.
Figure 12: Views east looking over the Murray Plains
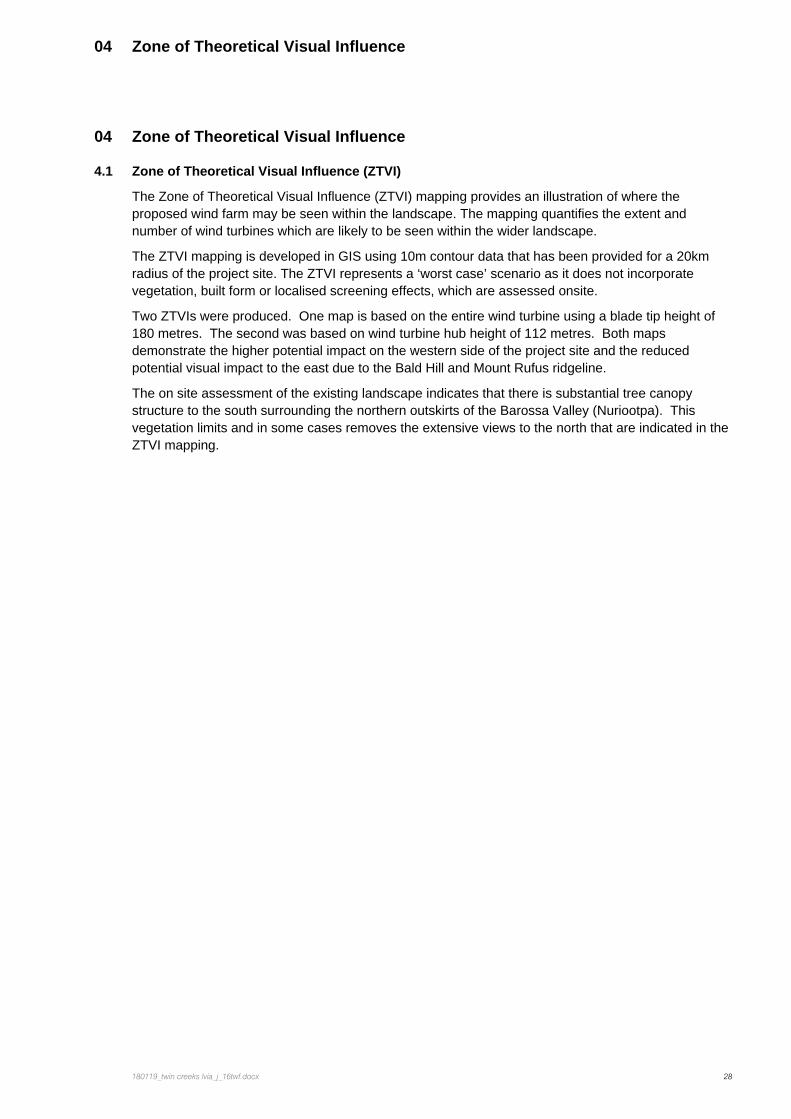
04 Zone of Theoretical Visual Influence
180119_twin creeks lvia_j_16twf.docx 28
04 Zone of Theoretical Visual Influence
4.1 Zone of Theoretical Visual Influence (ZTVI)
The Zone of Theoretical Visual Influence (ZTVI) mapping provides an illustration of where the proposed wind farm may be seen within the landscape. The mapping quantifies the extent and number of wind turbines which are likely to be seen within the wider landscape.
The ZTVI mapping is developed in GIS using 10m contour data that has been provided for a 20km radius of the project site. The ZTVI represents a ‘worst case’ scenario as it does not incorporate vegetation, built form or localised screening effects, which are assessed onsite.
Two ZTVIs were produced. One map is based on the entire wind turbine using a blade tip height of 180 metres. The second was based on wind turbine hub height of 112 metres. Both maps demonstrate the higher potential impact on the western side of the project site and the reduced potential visual impact to the east due to the Bald Hill and Mount Rufus ridgeline.
The on site assessment of the existing landscape indicates that there is substantial tree canopy structure to the south surrounding the northern outskirts of the Barossa Valley (Nuriootpa). This vegetation limits and in some cases removes the extensive views to the north that are indicated in the ZTVI mapping.

04 Zone of Theoretical Visual Influence
180119_twin creeks lvia_j_16twf.docx 29
Figure 13: ZTVI map for the Twin Creek Wind Farm based on 180 metre turbine height
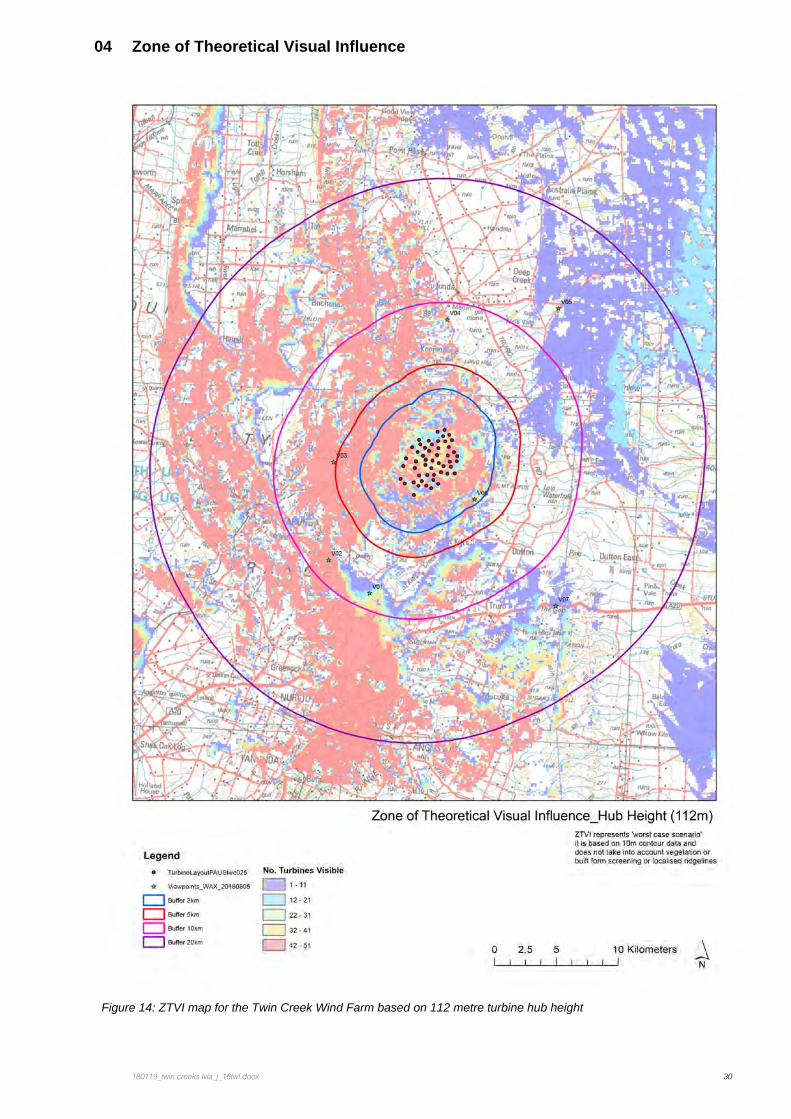
04 Zone of Theoretical Visual Influence
180119_twin creeks lvia_j_16twf.docx 30
Figure 14: ZTVI map for the Twin Creek Wind Farm based on 112 metre turbine hub height

05 Visual Impact Assessment
180119_twin creeks lvia_j_16twf.docx 31
05 Visual Impact Assessment
5.1 Visual Assessment Scope
The visual impact assessment was based on 51 wind turbines and the site locality as described in the landscape character assessment to a radius of 20km of the proposed development.
The visual impact assessment considered key aspects of the existing landscape such as relief, vegetation, built form and infrastructure; as well as cultural and scenic landscape values from each of the seven selected viewpoints. These key aspects from each viewpoint were scored out of 5 to produce an assessment value out of 20. This enabled a baseline landscape value to be calculated from which the visual impact was measured in relation to the degree of visual change likely to occur as a result of the introduction of the proposed development into the existing landscape character.
The visual effect was assessed using a set of criteria that considered factors such as the degree of landscape absorption, horizontal and vertical effects and distance to the development from each viewpoint.
The visual effect was then expressed as a coefficient and applied to the baseline landscape value to produce a measurement of the likely degree of visual change, that is to say, the extent to which the Project is predicted to alter the existing landscape.
5.2 Visual Impact Assessment
Using the visual assessment matrix as described in Appendix E, the potential degree of visual change and resulting visual impact of each viewpoint was measured and evaluated against the following criteria:
• Baseline Landscape Value is expressed as a value between 4 and 20;
• Visual Assessment Value is expressed as a value between 4 and 20;
• Coefficient of Visual Impact is calculated as decimal fraction of the visual assessment value;
• Relative Value of Visual Impact is calculated as the baseline landscape character multiplied by the coefficient; and
• Degree of Visual Change is expressed as the visual impact divided by the landscape character assessment range represented as a percentage.
The visual assessment also includes a description of the viewpoint context in relation the landscape character that surrounds the viewpoint and the potential visual impact. This assessment is supported by photomontages of the development and wireframe illustrations of the relative wind turbine positions.
For clarity and legibility of the report all reference images, maps and photomontages have been extracted to Appendix A, C and D and reproduced at A3 to enable them to be studied while reviewing the associated text for each viewpoint.

05 Visual Impact Assessment
180119_twin creeks lvia_j_16twf.docx 32
The viewpoints selected for the visual impact assessment as shown in Table 1 are:
VP01 Kapunda-Truro Road, Ebenezer (north - regional)
VP02 Kaunda-Truro Road, Koonunga (northeast - regional)
VP03 Intersection of Bagot Well Road and Kapunda-Eudunda Road, Bagot Well (east – sub-regional)
VP04 Tablelands Road, south of Eudunda (south – regional)
VP05 Von Reiben Road, east of Eudunda (southwest – regional)
VP06 Tablelands Road, south of Mount Rufus (west - regional)
VP07 Sturt Highway, east of Truro (northwest - regional)
Ref. Viewpoint Longitude Latitude Distance to
nearest WTG
View Direction
VP01 Kapunda-Truro Road, Ebenezer
317919 6192096 8.41km 25º
VP02 Kaunda-Truro Road, Koonunga
314453 6194570 8.62km 40º
VP03
Intersection of Bagot Well Road and Kapunda-Eudunda Road, Bagot Well
314383 6202506 5.22km 85º
VP04 Tablelands Road, south of Eudunda 322870 6214541 8.9km 180º
VP05 Von Reiben Road, east of Eudunda 331788 6215965 13.3km 220º
VP06 Tablelands Road, south of Mount Rufus 325931 6200154 2.64km 300º
VP07 Sturt Highway, east of Truro
332988 6191953 13.6km 310º
Table 1: Summary of Viewpoint location information
05 Visual Impact Assessment
180119_twin creeks lvia_j_16twf.docx 33
Figure 15: Viewpoint locations and Wind Turbine numbers

05 Visual Impact Assessment
180119_twin creeks lvia_j_16twf.docx 34
5.2 Viewpoint 1: Kapunda-Truro Road, Ebenezer
Viewpoint Context
Viewpoint 1 is located on the southern edge of the proposed wind farm along the east-west orientated Kapunda-Truro Road close to the intersection with Belvedere Road. This road corridor is the closest sealed and frequently travelled road south of the Project Site. Viewpoint 1 is located 1 kilometre away from the Yatara Farm which is State Heritage listed. The viewpoint is typical of the landscape character of the northern Barossa Valley and represents the probable visual effect that will be experienced within this locality.
The low-lying valley floor supports a mixture of arable practices, grazing and vineyards which are typical of this locality. This productive landscape includes a range of farms buildings and ancillary structures scattered through the landscape associated with the predominately agricultural land use. Extensive belts of vegetation provide localised landscape amenity, and the rising landform of the Greenhill Ranges provides a degree of visual enclosure within the locality. The ridgelines associated with Bald Hill and St Kitts form a visual envelope and viewshed to the north of the view point.
Figure 16: Viewpoint 1: Kapunda-Truro Road, Ebenezer
Figure 17: Digital Overlay showing all Turbines: Viewpoint 1
Figure 18: Absorption Capacity Calculations: Viewpoint 1
Viewpoint Assessment

05 Visual Impact Assessment
180119_twin creeks lvia_j_16twf.docx 35
Assessment Value Description
Relief 2 Negligible local foreground variation with limited to moderate subregional to
regional background topographic form
Vegetation Coverage 3 Sporadic foreground vegetation of mature scale that enhances the
landscape qualities
Infrastructure and Built Form 5 Limited development form, primarily a rural agricultural landscape
Cultural and Landscape Value 3 On the fringe of the northern Barossa Valley hence has an increased level
of association to the cultural vineyard landscapes.
Baseline Landscape 13
Landscape Absorption 2 The ridgeline and mature vegetation coverage to the north provide 65%
screening which is a moderate to substantial degree limiting the degree of
the development seen from this location
Horizontal 2 The extent of horizontal effect is recorded as 24 degrees which equate to
20 % of the field of view
Vertical 3 Moderate visual effect of 49% vertical effect. This is created by the
maximum tip of blade elevation 610m (Turbine 4) from this viewpoint with
landscape scale of 400m.
Distance 1 The closest turbine is turbine 1 which is 8.6km to the north
Visual Effect 8
Coefficient 0.4
Degree of Visual Change 26% 13x0.4= 5.2 Landscape visual effect
5.2/20= Degree of visual change
Description of potential visual impact
The local ridgelines associated with Bald Hill and St Kitts provide a visual screen behind which the proposed development is located. The majority of the turbines will be completely screened from the viewpoint as well as the wider locality reinforcing the visual separation that will be provided due to the landform and vegetation to the northern edge of the Barossa Valley.
The probable visual effect occurs due to the visibility of the blade rotation behind the ridgeline as well as the visual effect associated with a number of more elevated turbines particularly wind turbines 1, 2, 3, 4, 5 and 9 which result from the nacelle and hub being visible as well as the blades.
The wind turbines are collectively seen as a single visual element due to the densely clustered layout of the wind farm. The visual effect is limited due to the partial screen by the foreground to midground topography.
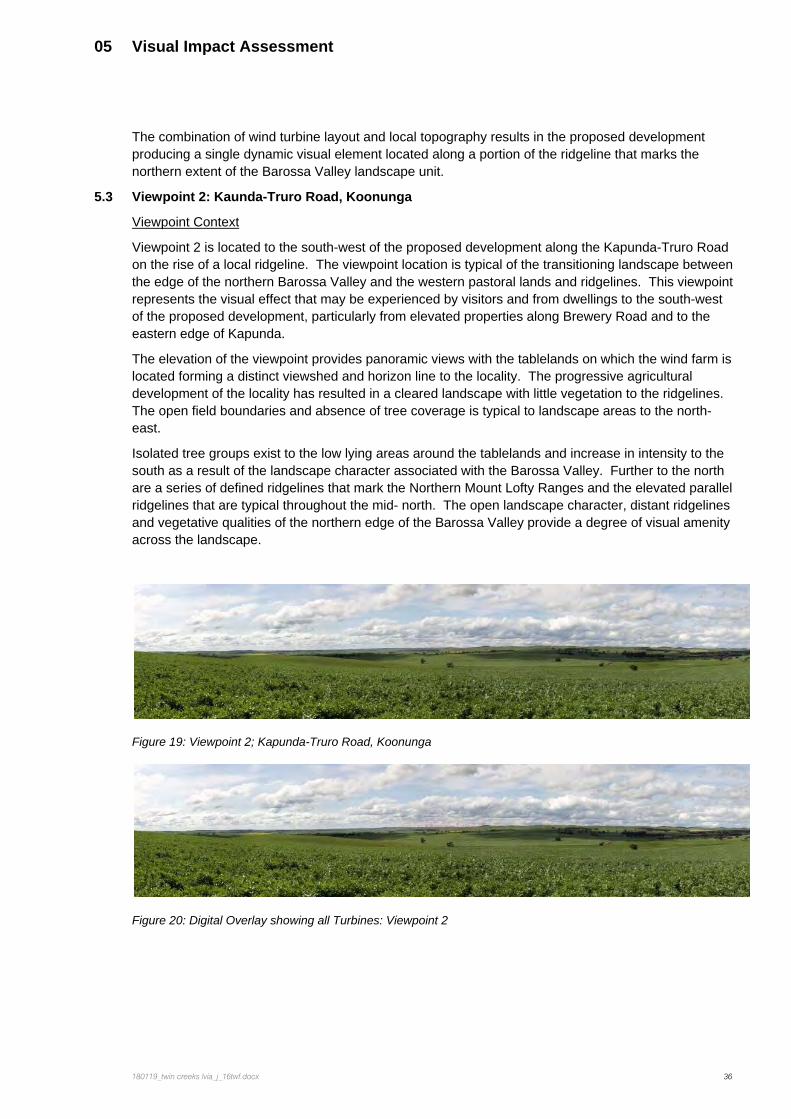
05 Visual Impact Assessment
180119_twin creeks lvia_j_16twf.docx 36
The combination of wind turbine layout and local topography results in the proposed development producing a single dynamic visual element located along a portion of the ridgeline that marks the northern extent of the Barossa Valley landscape unit.
5.3 Viewpoint 2: Kaunda-Truro Road, Koonunga
Viewpoint Context
Viewpoint 2 is located to the south-west of the proposed development along the Kapunda-Truro Road on the rise of a local ridgeline. The viewpoint location is typical of the transitioning landscape between the edge of the northern Barossa Valley and the western pastoral lands and ridgelines. This viewpoint represents the visual effect that may be experienced by visitors and from dwellings to the south-west of the proposed development, particularly from elevated properties along Brewery Road and to the eastern edge of Kapunda.
The elevation of the viewpoint provides panoramic views with the tablelands on which the wind farm is located forming a distinct viewshed and horizon line to the locality. The progressive agricultural development of the locality has resulted in a cleared landscape with little vegetation to the ridgelines. The open field boundaries and absence of tree coverage is typical to landscape areas to the north-east.
Isolated tree groups exist to the low lying areas around the tablelands and increase in intensity to the south as a result of the landscape character associated with the Barossa Valley. Further to the north are a series of defined ridgelines that mark the Northern Mount Lofty Ranges and the elevated parallel ridgelines that are typical throughout the mid- north. The open landscape character, distant ridgelines and vegetative qualities of the northern edge of the Barossa Valley provide a degree of visual amenity across the landscape.
Figure 19: Viewpoint 2; Kapunda-Truro Road, Koonunga
Figure 20: Digital Overlay showing all Turbines: Viewpoint 2

05 Visual Impact Assessment
180119_twin creeks lvia_j_16twf.docx 37
Figure 21: Absorption Capacity Calculations: Viewpoint 2
Viewpoint Assessment
Assessment Value Description
Relief 3 Limited local foreground variation with limited to moderate subregional to
regional background topographic form
Vegetation Coverage 2 More scattered vegetation surrounding properties. The view is comprised
largely by low lying crops
Infrastructure and Built Form 4 Visual presence of a borrowed pit (disused quarry) and man -made dams
within the landscape
Cultural and Landscape Value 2 Tablelands landscape character has local cultural values for its scenic
qualities
Baseline Landscape 11
Landscape Absorption 5 Limited landscape absorption due to the elevated viewpoint and limited
vegetation screening (19% absorption capacity)
Horizontal 1 The horizontal visual effect is created by turbines 25 and 24 which equates
to 18 degrees or 15% of the horizontal field of view.
Vertical 5 The vertical visual effect is considered substantial due to the scale of the
turbines being 98% increase in proportion to the existing landscape vertical
scale
Distance 1 Turbine 1 is the closest turbine at a distance of 8.7km
Visual Effect 12
Coefficient 0.6 12/20=
Degree of Visual Change 33% 11x0.6= 6.6 Landscape visual effect
6.6/20= Degree of visual change
Description of potential visual impact
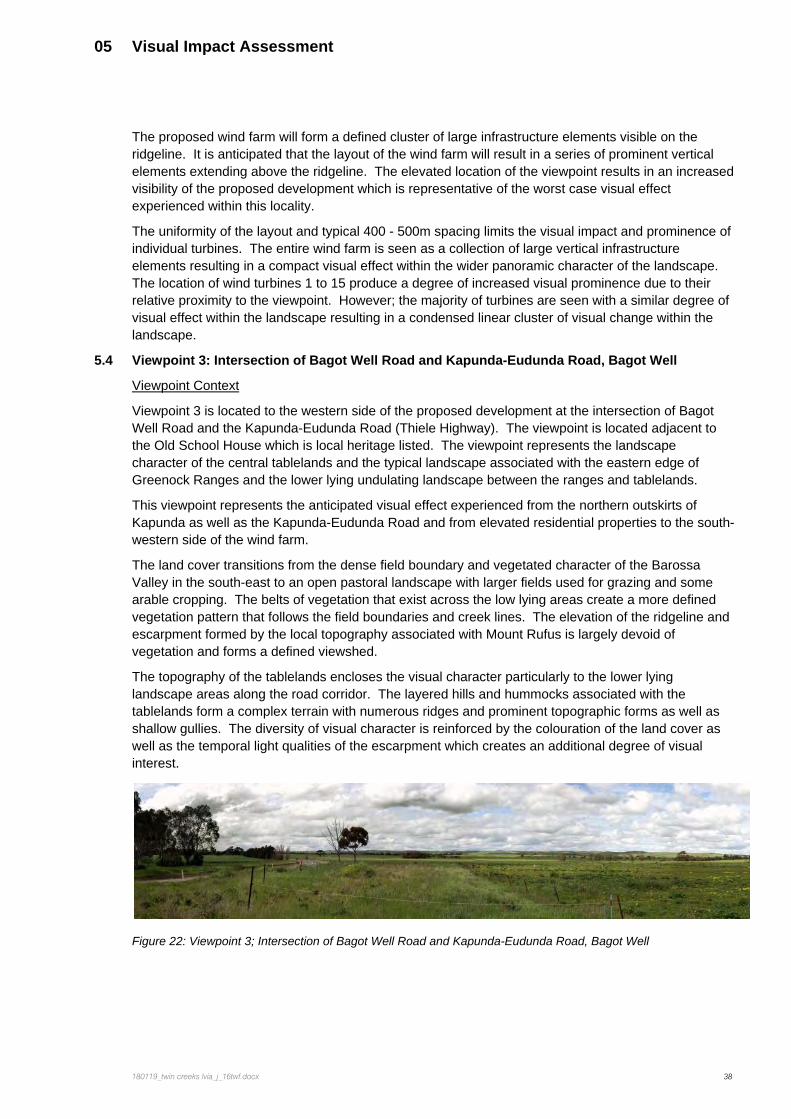
05 Visual Impact Assessment
180119_twin creeks lvia_j_16twf.docx 38
The proposed wind farm will form a defined cluster of large infrastructure elements visible on the ridgeline. It is anticipated that the layout of the wind farm will result in a series of prominent vertical elements extending above the ridgeline. The elevated location of the viewpoint results in an increased visibility of the proposed development which is representative of the worst case visual effect experienced within this locality.
The uniformity of the layout and typical 400 - 500m spacing limits the visual impact and prominence of individual turbines. The entire wind farm is seen as a collection of large vertical infrastructure elements resulting in a compact visual effect within the wider panoramic character of the landscape. The location of wind turbines 1 to 15 produce a degree of increased visual prominence due to their relative proximity to the viewpoint. However; the majority of turbines are seen with a similar degree of visual effect within the landscape resulting in a condensed linear cluster of visual change within the landscape.
5.4 Viewpoint 3: Intersection of Bagot Well Road and Kapunda-Eudunda Road, Bagot Well
Viewpoint Context
Viewpoint 3 is located to the western side of the proposed development at the intersection of Bagot Well Road and the Kapunda-Eudunda Road (Thiele Highway). The viewpoint is located adjacent to the Old School House which is local heritage listed. The viewpoint represents the landscape character of the central tablelands and the typical landscape associated with the eastern edge of Greenock Ranges and the lower lying undulating landscape between the ranges and tablelands.
This viewpoint represents the anticipated visual effect experienced from the northern outskirts of Kapunda as well as the Kapunda-Eudunda Road and from elevated residential properties to the south-western side of the wind farm.
The land cover transitions from the dense field boundary and vegetated character of the Barossa Valley in the south-east to an open pastoral landscape with larger fields used for grazing and some arable cropping. The belts of vegetation that exist across the low lying areas create a more defined vegetation pattern that follows the field boundaries and creek lines. The elevation of the ridgeline and escarpment formed by the local topography associated with Mount Rufus is largely devoid of vegetation and forms a defined viewshed.
The topography of the tablelands encloses the visual character particularly to the lower lying landscape areas along the road corridor. The layered hills and hummocks associated with the tablelands form a complex terrain with numerous ridges and prominent topographic forms as well as shallow gullies. The diversity of visual character is reinforced by the colouration of the land cover as well as the temporal light qualities of the escarpment which creates an additional degree of visual interest.
Figure 22: Viewpoint 3; Intersection of Bagot Well Road and Kapunda-Eudunda Road, Bagot Well

05 Visual Impact Assessment
180119_twin creeks lvia_j_16twf.docx 39
Figure 23: Digital Overlay showing all Turbines: Viewpoint 3
Figure 24: Absorption Capacity Calculations: Viewpoint 3
Viewpoint Assessment
Assessment Value Description
Relief 3 Negligible foreground topographic variation with moderate subregional to
regional background elevated punctuated forms
Vegetation Coverage 3 Sporadic mature vegetation following creek lines and cadastral boundaries
to the foreground which frames views
Infrastructure and Built Form 4 Scattered farm dwellings that are typically isolated from view by vegetation
and not of a scale to deter from the underlying agricultural land use.
Cultural and Landscape Value 2 Central Tablelands landscape with transient views along the Kapunda-
Truro Road which is a major arterial road between townships
Baseline Landscape 12
Landscape Absorption 5 The elevated location of the turbines on the leading edge of the sub-
regional ridgeline with limited foreground topography and vegetation means
that the landscape has limited capacity to absorb the visual effect from this
viewpoint
Horizontal 3 The horizontal visual effect is created by turbines 1 and 49 which equates
to 40 degrees or 33% of the horizontal field of view.
Vertical 5 The low lying nature of the existing landscape with limited to moderate
topographic scale to the ridgeline associated to Mt Rufus is
disproportionate to the visual scale of the turbines. The vertical scale of the

05 Visual Impact Assessment
180119_twin creeks lvia_j_16twf.docx 40
turbines increase the vertical scale by more than 100%
Distance 3 Turbine 7 is the closest turbine at a distance of 5.6km
Visual Effect 16
Coefficient 0.8 16/20=
Degree of Visual Change 48% 12x0.8= Landscape visual effect
9.6/20= Degree of visual change
Description of potential visual impact
The uniform layout will create a defined visual effect resulting in a continuous cluster of vertical infrastructure located within the landscape. The interrelationship of the local topography will create a degree of variation to the base height of the turbines which in turn varies the potential visual prominence of individual wind turbines.
The most prominent visual effects are produced by wind turbines 7, 8, 14, 15, and 16, and are reinforced by the clustering of turbines behind these leading visual elements.
The position of individual turbines in relation to the rising topography of Mount Rufus and the continued elevation of the ridgelines further to the east provide a small degree of back screening to the vertical elements of the turbines. However, the wind turbines will be seen as large vertical elements within the landscape and of a scale more significant to the existing topography.
To the outskirts of Kapunda, local ridgelines provide a visual screen particularly from the local road corridors and lower lying areas associated with the Kapunda-Eudunda and Kapunda-Truro Road intersection. The degree of visibility is likely to increase from elevated locations and particularly residential properties to the northern ridgeline of Kapunda. From these viewpoints the visual effect will be similar to that experienced at Viewpoint 2.
The layered positioning of the wind turbines and the dynamic rotation of the blades will increase the notability of the wind turbines and amplify the complexity of visual change.
5.5 Viewpoint 4: Tablelands Road, south of Eudunda
Viewpoint Context
Viewpoint 4 is located along Tablelands Road and represents the potential visual effect that will be experienced to the north of the wind farm, particularly around the southern outskirts of Eudunda. The viewpoint is typical of the undulating landscape character of the elevated central tablelands.
The landscape character surrounding the viewpoint is defined by an open agricultural landscape of grazing and cropping and a general absence of vegetation apart from a few isolated trees. Numerous hills and localised ridgelines create a defined undulating landscape character typical of the locality. From the viewpoint and other surrounding areas views extend south across local ridgelines with more expansive panoramic views to the east and west.
To the west, views extend as far as the north-south ridgeline of the Greenock Range, some forty kilometres away, and east towards the Southern Mt Lofty Ranges escarpment with the Murray Plains forming a distant landscape in the horizon.

05 Visual Impact Assessment
180119_twin creeks lvia_j_16twf.docx 41
Figure 25: Viewpoint 4; Tablelands Road, south of Eudunda
Figure 26: Digital Overlay showing all Turbines: Viewpoint 4
Figure 27: Absorption Capacity Calculations: Viewpoint 4
Viewpoint Assessment
Assessment Value Description
Relief 3 The elevated viewing area associated to the Mt Rufus ridgeline provides a
moderate local to sub regional variation in topography with limited regional
variation as it flattens into the Western Pastoral lands
Vegetation Coverage 1 Limited to grazing and crops
Infrastructure and Built Form 5 Limited presence of infrastructure within the field of view.
Cultural and Landscape Value 2 Elevated views that are present to the outskirts of Eudunda. Views would
be associated with the experience on walking trails within the area.
Baseline Landscape 11

05 Visual Impact Assessment
180119_twin creeks lvia_j_16twf.docx 42
Landscape Absorption 3 The undulating forms of the Mt Rufus ridgeline provide moderate to
substantial absorption screening of 49%
Horizontal 2 The horizontal visual effect is created by turbines 38 and 15 which equates
to 28 degrees or 23% of the horizontal field of view.
Vertical 3 The underlying localised ridgelines associated to Mt Rufus provide a scale
that is proportionate to the vertical scale of the turbines. The vertical scale
of the turbines increase the vertical scale by 46%
Distance 1 Turbine 47 is the closest turbine at a distance of 8.96km
Visual Effect 9
Coefficient 0.45 9/20=
Degree of Visual Change 23% 11x0.45= Landscape visual effect
4.95/20= Degree of visual change
Description of potential visual impact
The wind turbines form a distinct cluster of elements set just behind the ridgeline to the south. The uniform layout creates a dispersed visual effect along the horizon line. The wind turbines will appear layered in front and behind each other. Similar to other viewpoints, the layering of and rotation of the wind turbine blades will increase the complexity of the visual effect.
The setback of the wind farm in the landscape relative to other localised landforms provides a degree of visual mitigation in relation to the scale of the turbines from this viewpoint.
While the wind farm and associated turbines will be notable elements within the locality, the compact layout and screening provided by surrounding topography limits the visibility and potential visual effects. In this regard, the visual effect is notable but limited to a marrow field of view.
5.6 Viewpoint 5: Von Reiben Road, east of Eudunda
Viewpoint Context
Viewpoint 5 is located on Von Reiben Road some 16 kilometres north-east of the proposed development. The viewpoint represents the potential visual effect with a degree of visual change that will be experienced to the northeast and east of the proposed development in relation to regional locations across the Murray Plains.
The low lying character of the viewpoint is typical of the Murray Plains with extensive views across the rural landscape of the plains. The underlying land cover is typical of the area consisting of cropping and grazing with scattered belts of vegetation following field boundaries or creeks.
To the south-west is the elevated escarpment associated with Mount Rufus, Long Hill and the township of Eudunda. Prominent topographical features such as Mt Rufus are clearly visible along the horizon line. These landforms produce a defined undulating ridgeline in front of the proposed development.

05 Visual Impact Assessment
180119_twin creeks lvia_j_16twf.docx 43
Figure 28: Viewpoint 5; Von Reiben Road, east of Eudunda
Figure 29: Digital Overlay showing all Turbines: Viewpoint 5
Figure 30: Absorption Capacity Calculations: Viewpoint 5
Viewpoint Assessment
Assessment Value Description
Relief 3 There is limited foreground topographic variation with moderate
subregional to regional
Vegetation Coverage 2 Scattered copse planting of mature tree within paddocks and along creek
lines and cadastral boundaries
Infrastructure and Built Form 4 Unsealed road corridor provides a dominant element to the foreground
within the field of view.
Cultural and Landscape Value 2 The Murray River plain landscape is expansive with limited culturally
sensitive elements of significance present within the proximity of the
viewpoint. However, this particular viewpoint is located close to the
Eudunda Morgan Road which is an arterial road with greater frequency of
occupation and hence visitation and views.

05 Visual Impact Assessment
180119_twin creeks lvia_j_16twf.docx 44
Baseline Landscape 11
Landscape Absorption 1 The eastern edge of the Mt Rufus ridgeline provides substantial absorption
screening of 86%
Horizontal 1 The horizontal visual effect is created by turbines 32 and 25 which equates
to 14 degrees or 11% of the horizontal field of view.
Vertical 1 The eastern escarpment ridgeline associated to Mt Rufus provides a scale
proportionate to the vertical scale of the turbines. The vertical scale of the
turbines increase the vertical scale by only 8%
Distance 1 Turbine 47 is the closest turbine at a distance of 13.5km
Visual Effect 4
Coefficient 0.2 4/20=
Degree of Visual Change 11% 11x0.2= Landscape visual effect
2.2/20= Degree of visual change
Description of visual impact
The visual effect results from the partial visibility of the turbine blades as they rotate above the edge of the ridgeline. The majority of the turbines, turbine towers, hubs and nacelles will be screened by the local ridgeline which creates a defined visual enclosure around the proposed wind farm.
The potential for a slight visual effect is likely to be experienced from locations to the east of the proposed development. The visual effect is created by the flicking visibility of the turbine blades as they appear above and disappear behind the ridgeline. It is anticipated that with varying climatic conditions the degree of visibility will be further reduced and from other locations to the east of the development the wind farm maybe completely screened.
5.7 Viewpoint 6: Tablelands Road, south of Mount Rufus
Viewpoint Context
Viewpoint 6 is located on Tablelands Road, south of Mt Rufus, and represents the potential visual effect that will be experienced from locations to the eastern edge of the wind farm development site. The viewpoint is located on one of the many locally elevated hills that form the transitional landscape character between the central tablelands and the Mt. Rufus ridgeline.
The locality of the viewpoint represents the landscape amenity that is provided by the undulating rural landscape and the combination of extensive vegetation belts, isolated trees, open arable land, isolated farm dwellings and panoramic views to distant ridgelines. Further to the south are a number of local heritage properties that provide a degree of cultural significance to the landscape character and locality of the area. While the landscape represents a modified agricultural land use, the combination and arrangement of landscape and built form elements provide a degree of visual amenity and scenic value.

05 Visual Impact Assessment
180119_twin creeks lvia_j_16twf.docx 45
The elevation and isolated tree cover of the agricultural landscape results in panoramic views to the south-west and, to a lesser extent, the north. Views to the east are contained by local ridgelines associated with Mt Rufus and the southern extent of the ridgelines that continue towards the Barossa Valley. The rolling landscape contains belts of vegetation which increase in frequency and prominence towards the edge of the Barossa Valley further to the south. Further to the east are the distant ranges and topographic forms such as Bald Hill which define the horizon line and visual envelope of the locality.
Figure 31: Viewpoint 6; Tablelands Road, south of Mount Rufus
Figure 32: Digital Overlay showing all Turbines: Viewpoint 6
Figure 33: Absorption Capacity Calculations: Viewpoint 6
Viewpoint Assessment
Assessment Value Description
Relief 2 From this viewpoint, the landscape is perceived to have limited foreground
mid ground and background
Vegetation Coverage 2 Limited sporadic trees in linear bands associated with cadastral
boundaries and fence lines

05 Visual Impact Assessment
180119_twin creeks lvia_j_16twf.docx 46
Infrastructure and Built Form 4 Scattered farm dwellings are evident to the foreground to mid-ground
Cultural and Landscape Value 2 Views from this locality provide reference to typical intermittent views along
the Mt Rufus ridgeline which has the Lavender Trail traversing through the
landscape
Baseline Landscape 10
Landscape Absorption 5 The western edge of the Mt Rufus ridgeline provides limited/minor
absorption screening of 15% due to the tablelands landscape character
being relatively devoid of undulations.
Horizontal 3 The horizontal visual effect is created by turbines 1 and 45 which equates
to 60 degrees or 50% of the horizontal field of view.
Vertical 5 The low lying nature of the existing landscape with the limited topographic
scale to the foreground is disproportionate to the visual scale imposed by
the turbines. The vertical scale of the turbines increases the vertical scale
by more than 100% primarily due to the distance of effect with limited
foreground to background variation in landscape topography.
Distance 4 Turbine 25 is the closest turbine at a distance of 2.63km
Visual Effect 17
Coefficient 0.85 17/20=
Degree of Visual Change 43% 10x0.85= Landscape visual effect
8.5/20= Degree of visual change
Description of potential visual impact
From the viewpoint, the wind turbines form a distinct cluster of large visual elements within the landscape. The majority of the wind turbines are located on the ridgeline that defines the western edge of the field of view from this viewpoint. The visual effect is formed by the entire wind farm with the relative position of wind turbines 3, 4, 9, 10, 18, and 25 forming prominent visual elements within the cluster of wind turbines. The elevation and height of the wind turbines extend above the ridgelines and local landscape features.
While the visual effect of the wind turbines will be experienced as a distinct cluster, the location of the wind turbines on the ridgeline increase the resulting visual effect; disrupting distant views particularly to the east creating an additional degree of visual enclosure to the locality.
Overall the visual effect experienced at Viewpoint 6 is likely to have a greater magnitude due to the relative position of the viewpoint in relation to the wind turbine layout. The elevation of the wind turbines and limited screening provided by adjacent landscape features reinforces the vertical height of the wind turbines within the landscape.

05 Visual Impact Assessment
180119_twin creeks lvia_j_16twf.docx 47
As previously discussed further to the north and south the interrelationship of vegetation and local landforms provide isolated screens and a degree of visual enclosure which limits the degree of visibility of the wind turbines within the wider landscape.
A detailed discussion on the associated infrastructure for the wind farm and it’s probable visual effect for viewpoint 6 is included in section 5.11-5.15 of this report.
5.8 Viewpoint 7:Sturt Highway, east of Truro
Viewpoint Context
Viewpoint 7 is located 5 kilometres outside Truro along the Sturt Highway. The view point represents the anticipated visual effect that will be experienced to the south east of the wind farm. The Sturt Highway provides an entrance gateway into the township of Truro.
Vehicles travelling along this highway are typically travelling at speeds of between 70-80 kilometres per hour. The existing landscape character of the viewpoint is typical of the local area with rolling undulating landforms predominantly grazed defining the land use character.
The landscape is punctuated by isolated trees that produce notable visual landscape markers. There is little screening within the wider landscape.
The topography of Mount Rufus and the extension of the north-south ridgeline form the dominant landscape feature which defines the horizon line and contains the field of view.
Figure 34: Viewpoint 7; Sturt Highway, east of Truro
Figure 35: Digital Overlay showing all Turbines: Viewpoint 7

05 Visual Impact Assessment
180119_twin creeks lvia_j_16twf.docx 48
Figure 36: Absorption Capacity Calculations: Viewpoint 7
Viewpoint Assessment
Assessment Value Description
Relief 3 Limited foreground complexity in variation with moderate mid ground to
background
Vegetation Coverage 2 Limited sporadic copse or isolated planting of mature trees retained in
paddocks
Infrastructure and Built Form 4 Sturt Highway present to the foreground, but has limited impact on the
perspective view. Distant transmission line evident
Cultural and Landscape Value 3 Sturt Highway corridor and outskirts or Truro. Hence the frequency of views
would be greatest along this corridor as a transient experience of the
regional landscape
Baseline Landscape 12
Landscape Absorption 2 The south western ridgelines associated to Mt Rufus provide substantial
absorption screening of 75%
Horizontal 1 The horizontal visual effect is created by turbines 1 and 38 which equates
to 16 degrees or 15% of the horizontal field of view.
Vertical 1 The vertical visual effect of the turbines are proportionate to the landscape
scale hence the tip of blades are not seen to increase the scale. The scale
provides minor to negligible vertical effect.
Distance 1 Turbine 25 is the closest turbine at a distance of 13.42km
Visual Effect 5
Coefficient 0.25 5/20=
Degree of Visual Change 15% 12x0.25= Landscape visual effect
3/20= Degree of visual change

05 Visual Impact Assessment
180119_twin creeks lvia_j_16twf.docx 49
Description of potential visual impact
The turbines are seen as a distant cluster of elements located just below a series of ridgelines that define the complex topography of the local area. The undulating ridgelines modify the degree of visibility with the nacelle and blades on a number of wind turbines being visible, particularly the turbines along the eastern edge of the wind farm including wind turbines 3, 5, 9, 10 and 11. The blades of other turbines will be visible creating a minor visual effect along the ridgeline.
The Greenock Ridge is visible as a prominent landscape element and backdrop to the viewpoint. The topographic significance and visual character of this element is retained. The presence of existing remnant vegetation to the ridgeline and scattered trees provides an additional screening that will reduce the visual effect.
Due to the compact nature of the layout, distance from the viewpoint as well as the interrelationship of the undulating ridgelines and local topography result in a reduced visual effect that is characterised by glimpsed views of wind turbine blades and a limited number of nacelles.
Potential visual impacts on the surrounding landscape and Barossa Valley to the east remain limited due to the contained visual character that is formed by the local topography and isolated vegetation groups.
A detailed discussion on the associated infrastructure for the wind farm and it’s probable visual effect for viewpoint 7 is included in section 5.11-5.15 of this report.

05 Visual Impact Assessment
180119_twin creeks lvia_j_16twf.docx 50
5.9 Summary of Visual Impacts
The visual assessment of the seven viewpoints demonstrates that a variety of visual impacts will be experienced within the local, sub-regional and regional landscapes that surround the proposed wind farm development. Typically, the visual effect associated with the wind farm will occur within a modified agricultural landscape that is contained by defined topographic and landscape features to north, south, east and west. The resulting landscape character creates a defined locality in which a variety of visual effects are likely to occur.
The two tables below illustrate the degree of visual change recorded at each of the viewpoints and classification of the potential visual impacts. Of note are the key factors that will affect the visual impact which occurs at each viewpoint and in the wider landscape. They include:
Existing landscape character value and the presence or absence of significant vegetation or scenic value and or existing infrastructure;
• The degree of landscape absorption provided by the existing landscape;
• Degree of visual containment and resulting viewshed;
• Horizontal and vertical visual effects produced by the proposed; and
• Distance to the proposed development.
As shown in Table 2 below, there is a notable degree of variation in the measured visual impacts which ranges from slight to the northeast and southeast, moderate to the north and south and substantial to the east and west. The existing landscape character remains consistent with a measure value range of 10 to 13. This reflects the uniformity of the existing landscape character of the area with subtle variations. More significant is the screening and mitigation provided by the local topography and vegetation in relation to the degree of visual change throughout the site locality.
Viewpoints
Relief
Vegetation C
overage
Infrastructure
Cultural/Landsca
pe Value
Landscape Character
Landscape Absorption
Horizontal
Vertical
Distance
Visual A
ssessm
ent
Degree o
f Visual C
hange
Viewpoint 1 2 3 5 3 13 2 2 3 1 8 26%
Viewpoint 2 3 2 4 2 11 5 1 5 1 12 33%
Viewpoint 3 3 3 4 2 12 5 3 5 3 16 48%
Viewpoint 4 3 1 5 2 11 3 2 3 1 9 23%
Viewpoint 5 3 2 4 2 11 1 1 1 1 4 11%
Viewpoint 6 2 2 4 2 10 5 3 5 4 17 43%
Viewpoint 7 3 2 4 3 12 2 1 1 1 5 15%
Table 2: Summary of Visual Impacts

05 Visual Impact Assessment
180119_twin creeks lvia_j_16twf.docx 51
The following Table 3 is a summary of the classifications described in the GrimKe matrix which provides additional information on the potential visual impact used to describe each viewpoint.
Percentage of
Visual Change
Descriptive of
Visual Impact
Descriptors –
appearance in central
vision field
Comments
80-100% Extreme Commanding,
controlling the view
Extreme change in view: change very prominent involving
total obstruction of existing view or change in character and
composition of the landscape and view through loss of key
elements or addition of new or uncharacteristic elements
which significantly alter underlying landscape visual
character and amenity. The sensitivity of the underlying
landscape character to change is unable to accommodate or
mitigate the introduction of development, and the visual
effect is highly adverse.
60-80% Severe Standing out, striking,
sharp, unmistakable,
easily seen
Severe change in view involving the obstruction of existing
views or alteration to underlying landscape visual character
through the introduction of new elements. Change may be
different in scale and character from the surroundings and
the wider setting or a severe change in the context of the
existing landscape character. Resulting in a perceived
adverse visual effect and an increase in proportional change
to the underlying landscape visual character.
40-60% Substantial Noticeable, distinct,
catching the eye or
attention, clearly visible,
well defined
Substantial change in view: which may involve partial
obstruction of existing view or alteration of underlying
landscape visual character and composition through the
introduction of new elements. Composition of the view will
alter however the sensitivity of the underlying landscape
character to change low, and it provides opportunities for
mitigation, management and absorptions of the visual effect.
View character may be partially changed through the
introduction of features.
20-40% Moderate Visible, evident, obvious Moderate change in view: change will be distinguishable
from the surroundings while composition, and underlying
landscape visual character will be retained. The sensitivity
of the existing landscape to change is low.
0-20% Slight Lacking sharpness of
definition, not obvious,
indistinct, not clear,
obscure, blurred,
indefinite
Very slight change in view: change barely distinguishable
from the surroundings. Composition and character of view
substantially unaltered.
Table 3: Classification of Visual Impacts

05 Visual Impact Assessment
180119_twin creeks lvia_j_16twf.docx 52
The landscape assessment and ZTVI highlight the enclosed visual character of the landscape. Ridgelines associated with Nain Ranges, Greenock Ranges and Light Ranges and northern extent of the Barossa Ranges form a defined visual envelope to the west which extends north and combines with the topography of the Tothill Ranges to limit the visibility around the wind farm. To the east, the ridge associated with Mount Rufus produces a degree of visual enclosure, and to the south, local landforms and extensive belt of vegetation associated with the northern edge of the Barossa Valley provide extensive visual screening. Within this visually contained existing landscape character, the layout of the Twin Creek Wind Farm forms a single cluster of 51 wind turbines.
The landscape and visual impact assessment, with reference to ZTVI mapping, demonstrates that the degree of visibility will be experienced within a contained viewshed. The layout of the proposed wind turbines will result in a single cluster of large infrastructure elements that form a concentrated visual effect in the rural landscape. Travelling through the landscape, the underlying topography of the surrounding ranges modifies views towards the proposed wind farm. The visibility of the proposed development changes due to the screening effects provided by the adjacent hills and ridgelines or areas of existing vegetation.
The visual assessment undertaken from the seven selected viewpoints demonstrates that a variety of visual impacts will be experienced within the local (0-3km), sub-regional (3-10km) and regional (>10km) landscapes that surround the proposed wind farm site. To the north and south and from distance of greater than five kilometres the visual effect associated with the proposed development will result in wind turbines being seen behind local ridgelines and landforms. In these locations, the potential visual effect will result from visible sections of the hub and blades above the local topography and vegetation.
The potential visual effect reduces over distance with the visual assessment recording the visual effect as slight at a distance more than ten kilometres, particularly to the northeast. This reflects the different landscape characters around the proposed development site and the significant landscape absorption and screening of the ridgelines and vegetation created by the local topography of the areas.
To the south, the distance between the proposed wind farm and the Barossa Valley provides significant management of the visual effect limiting the potential impact that the proposed wind farm may have on the Barossa Valley Character Preservation Zone and the associated areas of higher landscape amenity and cultural value.
Viewed from the east and west the proposed wind turbines will be seen situated on the elevated topography of the Central Tablelands. The scale of the proposed development in relation to the vertical scale of the underlined landscape is prominent due to number of visible wind turbines and the prominence of the tower, nacelle and blades in the landscape. Within five kilometres of the proposed wind farm, the screening provided by local ridgelines and vegetation belts is limited, and the majority of the wind farm is experienced as a visually prominent element in the rural landscape producing a degree of visual change in the order of 43% to 48% which is described as substantial. This substantial visual effect alters the underlying visual character and composition of the landscape through the introduction of new elements. Views will be altered but the sensitivity of the underlying landscape character to change is considered low.

05 Visual Impact Assessment
180119_twin creeks lvia_j_16twf.docx 53
Figure 37: Summary of viewpoint visual effect
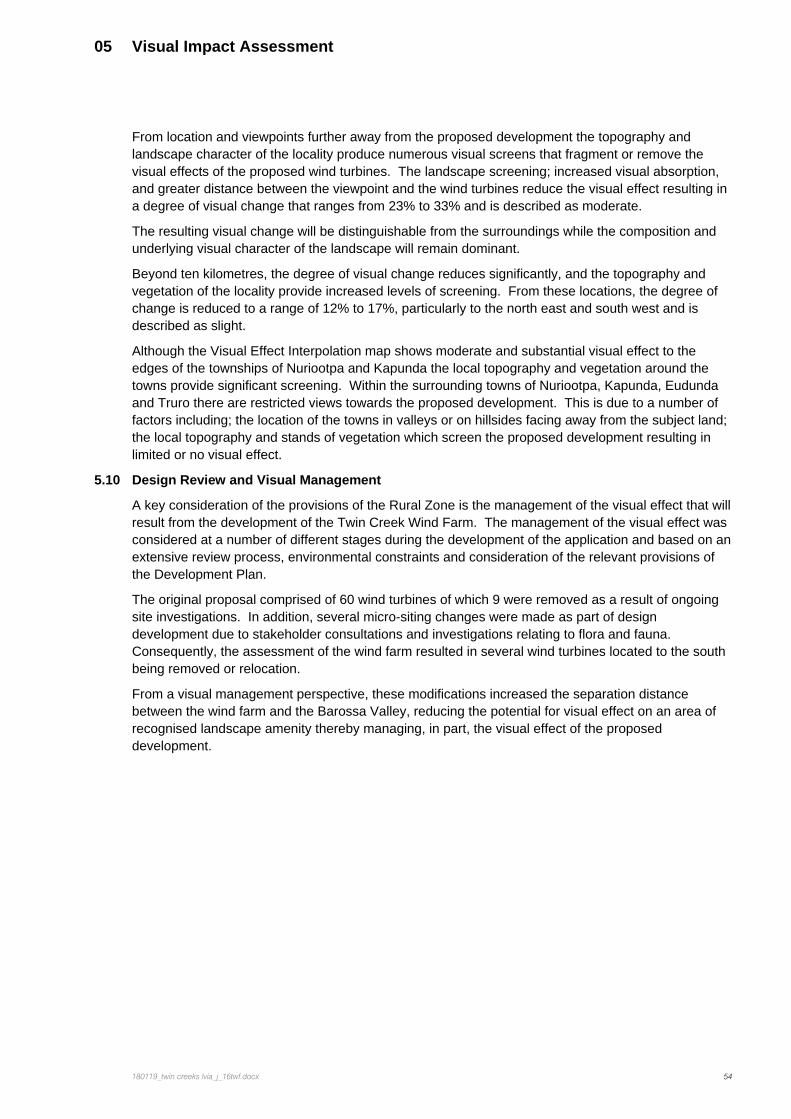
05 Visual Impact Assessment
180119_twin creeks lvia_j_16twf.docx 54
From location and viewpoints further away from the proposed development the topography and landscape character of the locality produce numerous visual screens that fragment or remove the visual effects of the proposed wind turbines. The landscape screening; increased visual absorption, and greater distance between the viewpoint and the wind turbines reduce the visual effect resulting in a degree of visual change that ranges from 23% to 33% and is described as moderate.
The resulting visual change will be distinguishable from the surroundings while the composition and underlying visual character of the landscape will remain dominant.
Beyond ten kilometres, the degree of visual change reduces significantly, and the topography and vegetation of the locality provide increased levels of screening. From these locations, the degree of change is reduced to a range of 12% to 17%, particularly to the north east and south west and is described as slight.
Although the Visual Effect Interpolation map shows moderate and substantial visual effect to the edges of the townships of Nuriootpa and Kapunda the local topography and vegetation around the towns provide significant screening. Within the surrounding towns of Nuriootpa, Kapunda, Eudunda and Truro there are restricted views towards the proposed development. This is due to a number of factors including; the location of the towns in valleys or on hillsides facing away from the subject land; the local topography and stands of vegetation which screen the proposed development resulting in limited or no visual effect.
5.10 Design Review and Visual Management
A key consideration of the provisions of the Rural Zone is the management of the visual effect that will result from the development of the Twin Creek Wind Farm. The management of the visual effect was considered at a number of different stages during the development of the application and based on an extensive review process, environmental constraints and consideration of the relevant provisions of the Development Plan.
The original proposal comprised of 60 wind turbines of which 9 were removed as a result of ongoing site investigations. In addition, several micro-siting changes were made as part of design development due to stakeholder consultations and investigations relating to flora and fauna. Consequently, the assessment of the wind farm resulted in several wind turbines located to the south being removed or relocation.
From a visual management perspective, these modifications increased the separation distance between the wind farm and the Barossa Valley, reducing the potential for visual effect on an area of recognised landscape amenity thereby managing, in part, the visual effect of the proposed development.
05 Visual Impact Assessment
180119_twin creeks lvia_j_16twf.docx 55
5.11 Substations and Transmission line Visual Effect Assessment
In addition to the wind turbine visual effect an assessment was undertaken to understand the anticipated visual effect of the proposed substations and transmission line alignment. This included supplementary illustrative imagery of viewpoints 6 and 7 as well as the production of an additional viewpoint 9 that shows the proposed transmission substation. The production of these additional illustrative imagery made a number of assumptions in regards to the final design of the infrastructure elements including:
• The proposed transmission poles constructed from steel or spun concrete monopoles up to 35 metres high and spaced approximately 275 – 375 metres apart (exact locations of poles to be confirmed)
• The transmission substation is based on elevations provided, and
• The finished floor level (FFL) of the substation is based on a midpoint of the surrounding topography (this may be more or less based on final design development).
Furthermore the photomontages for viewpoint 6, 7 and 9 are modelled using 10m contour terrain data. This limitation in data may result in some local landforms or topographical changes less than 10m which could further enhance localised screening. Variances in topographic scale of >10 metres could proportionally provide up to 45% landscape absorption which is considerable for the scale of the proposed substation and transmission.
It is for these reasons that the infrastructure elements of the development and there potential visual effect are assessed in this section and are not incorporated into sections 5.1 to 5.9.
For clarity and legibility of the report all reference images, maps and photomontages have been extracted to Appendix A, C and D and reproduced at A3 to enable them to be studied while reviewing the associated text for each viewpoint.
5.12 Site Substation, Control Buildings and Operational Maintenance Compound
The proposed wind farm will require one on site substation including switching yards, associated electrical infrastructure, control buildings, battery storage, staff facilities and car park.
The sub-station/switching yard will be locatedon the south eastern edge of the site in the vicinity of wind turbine 9. The sub-station has been located to provide a short distance to the grid connection thus reducing the extent of landscape impacted by ancillary infrastructure components. This will however increase the proportional visual effects surrounding viewpoint 6 as the transmission line will extend the visual cluster of infrastructural form to the south to south west. The site compound and substation will be partially visible from viewpoint 6. The scale of the on-site substation will be considerably less conspicuous than the turbines as it is proposed to be positioned in a lower lying area adjacent to turbine 9 at an approximate distance of 2.7km from viewpoint 6, with local landforms screening the majority of the development.
The substation/switching yard compound will comprise of the following;
• One permanent 132kV grid connection
• One control building
• Operations and maintenance building and compound with associated car parking
• Concrete batching plant within compound (during construction)
• Battery energy storage
• Construction compound and material lay down area (during construction)

05 Visual Impact Assessment
180119_twin creeks lvia_j_16twf.docx 56
The substation will be located 2.5 kilometres west of Tablelands Road and will be accessed from Mosey Road. From Tablelands Road and other local track, the substation will create a visual contrast to the rural character of the landscape reinforcing the perceived land use changes that will occur with the introduction of the proposed wind farm.
The vertical scale of the substation gantry (approximately 20m) is likely to produce an increased degree of visibility within the locality of the substation. The change in elevation between viewpoint 6 and the substation location is 60m which in terms of scale of the proposed gantry (20m) will limit the degree of visual effect. In addition the gantry and towers are proposed to be lattice partially reducing the visual mass and form of the structure.
While the visual effect of the substation in relation to the overall effect of the wind farm is limited, from local viewpoints around Tablelands Road, the degree of visual change within the rural landscape will slightly increase, and the substation will be a noticeable development form.
To mitigate the potential visual effect of the substation and operational maintenance compound, it is proposed that landscape treatments are provided to the perimeter of the substation compound. The landscape treatment would be a combination of local provenance screening tree groups and shrubs suitable for the conditions in which the infrastructure associated with the wind development is located. Any screening will need to be undertaken in line with electrical code best practice. Planting should be considered in copse form rather than linear to provide correlation to the natural vegetation patterns in the area of larger stands of copse plantings surrounded by grazed paddocks. Additional tree plantings within the south west of the infrastructure corridor closer to the surrounding edges should be considered to create a layered depth of planting so that the vegetation is not seen as a dominant visual element that juxtaposes the underlying land forms. In essence the planting should create a veil that enables filtered views through the landscape rather than defining the field of view.
Tree species could include Allocasuarina verticillata, Pittosporum angustifolium, Melaleuca lanceolata, and Santalum acuminatum or other to be determined. These trees will provide elevated canopies of 6 to 10m which would be proportionate to the ancillary infrastructure depending on the distance of view and proximity of planting. The shrub species could include Acacia paradoxa, Acacia euthycarpa and Cassiniauncata or other to be determined. Planted in a double row at 0.5 to 1m centres of the shrubs would create a 2 to 3m screen to the boundary of the substation, providing screening to the local area.
From more distant views of the lattice tower, gantry will become recessive, limiting the visual presence and effect of the substation infrastructure. While the lattice construction of the gantry will not remove the visual effect completely, this visually permeable form of construction will mitigate to a certain degree the potential visual impact of the infrastructure associated with the substation.
5.13 Transmission Line and Substation Connection to Existing 275kv
As part of the infrastructure provision of the Twin Creek Wind Farm, an overhead transmission line will be required to link the site substation with the existing ElectraNet transmission corridor. The proposed 132kV transmission line is aligned to traverse the south west tablelands towards the Murray Plains landscape character zone. The alignment is to the south of the Mt Rufus character area and north east of the Barrossa zone. Visual effects are mitigated from key culturally sensitive areas and townships of Nurioopta and Truro.
The landscape assessment undertaken in section 5 indicates that the existing landscape character is formed by a number of distinct landscape and topographic areas. These differing character landscape areas will produce various visual contexts in which the transmission line is proposed to be located.
The infrastructure corridor will travel south east of the site for approximately 15.5kilometres. The proposed transmission line is anticipated to be supported by spun concrete poles up to 35 metres high and spaced approximately 250 – 300 metres, this will produce a fragmented visual effect across the existing rural landscape.

05 Visual Impact Assessment
180119_twin creeks lvia_j_16twf.docx 57
It is only from locations adjacent to the proposed transmission line and over relatively short distances (less than 300 to 400m) that the visual effect increases. While the poles produce individual visual effects, the uniformity and repetitive pattern of the entire development ensures that the transmission line is seen within the context of the wider agricultural landscape. As a result, the proposed transmission will be seen as ‘another piece’ of infrastructure, no more significant than the existing stobie poles, and transmission infrastructure within the landscape.
The substation connecting the transmission line to the existing 275kv line is proposed to be located adjacent the Sturt Highway approximately15km south east of the proposed wind farm development and approximately 6 km east of Truro. This piece of infrastructure will comprise of a benched level pad, lattice tower gantries and electrical wiring all contained within a site compound surrounded by palisade fencing. Further detailed design will be required to appreciate how this compound will be positioned on the landscape as to the potential cut and fill to create a benched level pad for construction, drainage and maintenance access within the site. The following figure (38) illustrates the substation locations and transmission line alignment.

05 Visual Impact Assessment
180119_twin creeks lvia_j_16twf.docx 58
Figure 38: Substations and Transmission Line

05 Visual Impact Assessment
180119_twin creeks lvia_j_16twf.docx 59
5.14 Probable Visual Effect Discussion for Viewpoints 6, 7 and 9
The following discussion provides reference to the likely visual effects created by the substations and transmission line relating to the assessed viewpoints that are likely to experience visual change. In addition viewpoint 9 has been recorded to illustrate the potential visual effect surrounding this particular locality of the proposed development.
Viewpoint 6: Tablelands Road, south of Mount Rufus
Partial views of onsite substation and the transmission line east of the turbine cluster are likely to be experienced from this viewpoint. The location of the substation relative to the local topography provides a degree of screening with only a portion of this piece of infrastructure likely to be visible from this viewpoint. The transmission line due to its monopole design, relative scale and positioning within the landscape and topography creates a fragmented visual effect within the landscape. The visual impact will only slightly increase due to the substation and transmission line presence.
Figure 39: Viewpoint 6; Tablelands Road, south of Mount Rufus
Figure 40: Viewpoint 6 Photomontage
Figure 41: Digital Overlay showing all Infrastructure and Turbines: Viewpoint 6

05 Visual Impact Assessment
180119_twin creeks lvia_j_16twf.docx 60
Viewpoint 7: Sturt Highway, east of Truro
Viewpoint 7 will experience an increased visual effect. The 132kV transmission line will create an infrastructure corridor connecting the wind farm to the existing ElectraNet transmission line. The transmission line will be seen within the Sturt Highway corridor on the southern side of the road within proximity to the viewpoint. The proposed transmission line is anticipated to be supported by spun concrete monopoles up to 35m high which will produce a fragmented visual effect across the existing rural landscape. The scale of the poles will be relatively large in the foreground however they will be dispersed some distance apart which limits the degree of visual mass and effect of turbines and transmission in the same field of view. A local ridge to the north west of the view will screen a proportion of the transmission line as it crosses the road corridor.
There is an increased visual effect experienced of the transmission line from this location due to the close adjacency of this viewpoint to the proposed transmission corridor. It is only from locations adjacent to the proposed transmission line and over relatively short distances (less than 300 to 400m) that the visual effect increases. In other locations along this road corridor and within the locality the visual effect is decreased due to distance and the presence of the existing transmission corridor which is of a similar scale and appearance.
Figure 42: Viewpoint 7; Sturt Highway, east of Truro
Figure 43: Viewpoint 7 Photomontage
Figure 44: Digital Overlay showing all Infrastructure and Turbines: Viewpoint 7

05 Visual Impact Assessment
180119_twin creeks lvia_j_16twf.docx 61
Viewpoint 9: Sturt Highway, east of Transmission Substation
Viewpoint 9 is located east of the transmission substation along the Sturt Highway. Due to its close proximity to viewpoint 7 the viewpoint landscape character can be described in similar terms (refer to section 5.8). From viewpoint 9 the proposed wind farm will not be visible due to the local ridgelines, limiting the connectivity of the development form and extension of visual impact.
The intersection of the 132kV transmission line to the 275kV ElectraNet corridor is located south of the Sturt Highway, to which transmission substation terminal is proposed. When viewed from close proximity the transmission substation will be a dominant visual element in the locality. There will be an increase in the concentration of infrastructure elements experienced within the landscape due to its connection to two transmission lines.
The visual effect of the substation is increased due to its close proximity to the Sturt Highway. However due to the road alignment which curves both before and after this location, local ridges and stands of vegetation along the road corridor the substation will only be visible when travelling along a limited section of the Highway.
Further to the south approximately 900m of the proposed substation terminal is a small existing quarry providing a scale of development to the locality. This is also combined with the existing 275kv transmission line which traverses across the field of view in a north south orientation.
To mitigate the potential visual effect of the substation along the road corridor it is proposed that landscape treatments are provided to the perimeter of the substation in line with the considerations described in section 5.11. Any screening will need to be undertaken in line with electrical code best practice to avoid potential disruption of supply.
Additional landscape treatments along the road corridor, such as an increase of roadside trees would further fragment and partially screen the substation. Further refining the benching level of the development during the detailed design phase could allow the development to sit lower in the landscape and increase the effectiveness of landscape screening treatments.
Figure 45: Viewpoint 9; Sturt Highway, east of Truro
Figure 46: Viewpoint 9 Photomontage

05 Visual Impact Assessment
180119_twin creeks lvia_j_16twf.docx 62
Figure 47: Digital Overlay showing all Infrastructure and Turbines: Viewpoint 9
Figure 488: Digital illustration showing landscape screening after 10 years: Viewpoint 9
5.15 Access tracks
As part of the proposed development, a series compacted gravel tracks will be required to access the turbine locations off public access roads. The tracks developed across private land areas will typically be 10 m during the construction period and reduced 5 m after implementation. Public road access tracks will be limited to 5-6 m width.
Wherever possible the proposal will utilise existing access track and road connections. In addition, the form, materiality and colour of the new tracks will be in keeping with other tracks and roads in the area. While the proposed tracks will appear as new development, post construction they will not appear out of character within the wider rural landscape. The track surface will be crushed rock sourced either on site or from a local supplier. Overtime, the track material is likely to weather and will be subject the revegetation to the track edges which will further reduce the associated visual effect.
Finally, the visibility of the tracks needs to be assessed relative to the other development forms associated with the wind farm proposal. The proportional effect of the tracks will always be a secondary or partial visual element when considered against the degree of visual change produced by wind turbines. In this regard, the visual effect of the track is described as negligible and will progressively diminish over time.
5.16 Underground cable routes
The undergrounding of cable as part of the proposal limits visual impact. Trenching will be typically 0.45 m wide by 1 m deep. All trenches will be backfilled to meet existing surface levels limiting associated visual impacts and should be considered in context with the access tracks and overall visual effect of the entire development. Cable trenches will predominantly be located immediately adjacent to access tracks thereby avoiding additional site and visual impacts associated with separate trenching.
The absence of significant vegetation areas of vegetation within the anticipated cable routes means that the potential vegetation clearance will be limited, and the resulting visual effect will be negligible.

06 Review of Development Plan (Desired Character Statements)
180119_twin creeks lvia_j_16twf.docx 63
06 Review of Development Plan (Desired Character Statements)
6.1 Introduction
The following section details the various development plan provisions, zones and policy areas that have been considered in relation to the potential visual effect of the Twin Creek Wind Farm and associated infrastructure. The proposed development is situated across three council areas:
• Light Regional Council Development Plan (Consolidated 8 December 2016)
• Goyder Council Development Plan (Consolidated 24 November 2016)
• Mid Murray Council Development Plan (Consolidated 14 June 2017).
The proposed wind farm development has been considered and assessed as a whole so although the transmission line and transmission substation is the only piece of infrastructure located within the Mid Murray Council area it has still been assessed as part of the whole wind farm development.
As the following discussion will make reference to all three relevant development plans the following abbreviations will be used to remain concise:
• Mid Murray Council Development Plan - MMDP
• Goyder Council Development Plan – GDP
• Light Regional Council Development Plan – LDP
The intent of the review is to provide clarity as to the relevance and consistency with particular provisions in relation to the development of wind farms and associated infrastructure, visual impacts, and the effects on the landscape character and amenity.
Having reviewed the Development Plan consideration has been given to the following provisions as they deal directly with wind farms, the specific form of development associated with wind turbines and the associated infrastructure;
• Primary Production and Rural Zone Desired Character Statement, Objectives and Principles of Development Control (PDCs);
• Council Wide Renewable Energy Facilities: Wind Farms and Ancillary Development, Objectives and PDCs.
These desired character statements, objectives and principles of development control specifically refer to wind farms and ancillary development and whether they are an appropriate form of development within the Primary Production and Rural Zones.
The Council Wide objectives and provisions for Renewable Energy (Wind Farms and Ancillary Development) specifically discuss the visual impact of wind farms and ancillary development.
These provisions envisage this form of development and anticipate the implementation of wind farms within the council areas and identify that wind farms are part of the desired character of the Zones.
At the same time, due to the nature and scale of the wind farm, it is acknowledged that there is likely to be a degree of conflict within the Development Plan between provisions which envisage wind farms and other provisions which discuss development, buildings and structures in a broader manner.
It is acknowledged that under the Development Act 1993 a wind farm or wind turbine can be defined as development, building or structure. However, the Development Plan provisions which relate to development, buildings, and structures may or may not apply to the proposed development. To understand whether a provision is applicable to the proposed form of development the following considerations have been applied:
• The context in which the provision applies, or the intent behind the provision, including what form of development the provision refers to and in what situation it would apply.

06 Review of Development Plan (Desired Character Statements)
180119_twin creeks lvia_j_16twf.docx 64
• Whether the provision is relevant to a wind farm development, and whether said provision appears to have been written with wind farms in mind.
• Whether the provision is a realistic expectation in relation to a wind farm development (e.g. where provisions make reference to walls or windows consideration has not be given to the associated provision.
The visual assessment report contained in Section 5 concludes that the visual effect of the proposed wind farm on the existing rural landscape character will create a range of visual effects from slight to substantial (on a scale of slight, moderate, substantial, severe and extreme). The visual effect associated with the wind farm is described as being distinguishable from the surroundings while the composition and underlying landscape visual character was retained, and the sensitivity of the existing landscape character to change was low. That is to say; the modified rural landscape can accommodate the wind farm and the potential degree of visual change without significantly altering the agricultural character of the landscape.
6.2 Primary Production Zone (GDP and LDP) and Rural Zone (MMDP)
The desired character statements for the Primary Protection and Rural Zones recognise the rural and productive landscape character including large farming properties, horticulture and agriculture. It also aims to preserve the resources of the zone including mineral and fresh water supplies.
All three desired character statements place a value on the protection of scenic qualities of rural landscape within these zones (Primary Production Zone Objective 4 LDP and Objective 3 GDP; Rural Zone PDC 4 MMDP). The desired characters statements of these zones also acknowledges that wind farms are envisaged in the zones and that their presence will result in visual impacts on the landscape, particularly in relation to valuable scenic areas.
Stating that:
These facilities will need to be located in areas where they can take advantage of the natural resource upon which they rely and, as a consequence, components (particularly turbines) may need to be:
• Located in visually prominent locations such as ridgelines;
• Visible from scenic routes and valuable scenic and environmental areas; and
• Located closer to roads than envisaged by generic setback policy.
This, coupled with the large scale of these facilities (in terms of both height and spread of components), renders it difficult to mitigate the visual impacts of wind farms to the degree expected of other types of development. Subject to implementation of management techniques set out by general/council wide policy regarding renewable energy facilities, these visual impacts are to be accepted in pursuit of benefits derived from increased generation of renewable energy.
Further the objectives for each zone aim to:
Accommodation of wind farms and ancillary development (Primary Production Zone Objective 5 LDP, Objective 4 GDP)
Accommodation of wind farms and ancillary development outside of the Barossa Valley Character Preservation District as defined by Character Preservation legislation (Rural Zone Objective 2 MMDP)
The proposed development does not fall within the Barossa Valley and McLaren Vale – Revised – Protection Districts Development Plan Amendment (2013).
The principles of development control within all three zones also state that: Development should not be undertaken unless it is consistent with the desired character and acceptable forms of development for the zone and the relevant policy area (Rural Zone PDC 1 MMDP)
Development should not be undertaken unless it is consistent with the desired character for the zone (Primary Production PDC 9 LDP, PDC 10 GDP)
06 Review of Development Plan (Desired Character Statements)
180119_twin creeks lvia_j_16twf.docx 65
In summary, wind farms and their associated infrastructure are an anticipated form of development in the Primary Production Zone (GDP and LDP) and Rural Zone (MMDP), as is the potential for visual impact that is associated with them acknowledged as a consequence of this form of development.
6.3 Renewable Energy Facilities: Wind Farms and Ancillary Development
In preparing discussions relating to the potential for visual impact associated with the relevant zones, consideration has also been given to the provisions which relate specifically to the visual impact of wind farms and their associated development. In particular, Renewable Engergy PDC 2 (LDP and GDP) and Council wide PDC 396 (MMDP) which seek to manage visual impact of wind farms and ancillary development (such as substations, maintenance sheds, access roads and wind monitoring masts) by applying the following measures:
The visual impacts of wind farms and ancillary development (such as substations, maintenance sheds, access roads and wind monitoring masts) should be managed through:
(a) wind turbine generators being:
(i) setback at least 1000 metres from non-associated (non stakeholder) dwellings and tourist accommodation;
(ii) setback at least 2000 metres from defined and zoned township, settlement or
urban areas (including deferred urban areas);
(iii) regularly spaced;
(iv) uniform in colour, size and shape and blade rotation direction;
(v) mounted on tubular towers (as opposed to lattice towers);
(b) provision of vegetated buffers around substations, maintenance sheds and other ancillary structures.
The separation from dwelling and townships, the spacing of individual turbines and the configuration of the wind farm meets the principles set by PDCs. The layout of the turbines into a single cluster manages the extent to which the entire wind farm is visible in the landscape with the topography and vegetation in the locality providing screening and additional mitigation of the visual effect.
While the overall size of an individual wind turbine is large when compared with other infrastructure in the area, the spacing and clustering of the turbines mean that the underlying rural character of the landscape remains. That is to say when viewing the wind farm from the surrounding regional landscape, the rural and pastoral qualities of the landscape are still seen and experienced in and around the wind turbines.
Also, the wind turbine uses a tubular tower design, will be uniform in size and shape with consistent blade rotation. The selection of a neutral off-white colour (RAL 7035) ensures that the potential for colour contrasts between the wind turbines and any climatic, diurnal and seasonal variations is minimised and the potential visual effect is managed.
The location of the individual turbines within the cluster have also managed to achieve a setback of at least 2000 metre from the nearest non-associated (non stakeholder) dwelling, there is no tourist accommodation within close proximity to the site.
6.4 Council Wide Provisions
A number of Council Wide Objectives and PDC relate to impacts on the existing landscape character, the design and form of development and associated visual effects with Council Wide sections discussing Natural Resources, Siting and Visibility, Landscaping, Fencing and Walls considering the effects of development on the existing landscape. Of the objectives and PDCs contained within these sections this assessment has given consideration to those that are relevant and realistic to wind farm developments.
06 Review of Development Plan (Desired Character Statements)
180119_twin creeks lvia_j_16twf.docx 66
In addition to the Primary Production and Rural Zone objectives on the preservation of scenic value a number of council wide provision also discuss the protection of scenic value more broadly across the council area including:
LDP - Natural Resources Objective 13, PDC 1; Siting and Visibility Objective 1, PDC 1
GDP - Natural Resources Objective 12, PDC 1; Siting and Visibility Objective 1, PDC 1
MMDP - Council Wide Objectives 54 and 58, PDC 164
In relation to maintaining the rural character of the landscape, the proposed wind farm will produce a single defined development footprint in the rural landscape. In this regard, the physical impact of the wind farm on the rural landscape is limited, and the productive qualities and characteristics of the landscape will remain.
The separation of the wind turbines and turbines clusters ensure that the visual effect of the proposed wind farm is fragmented and views of the rural landscape between wind turbines are maintained. The agricultural landscape is retained while the visual character is changed to a moderate degree.
The Sturt Highway is identified as a scenic route (MAP MiMu1 (overlay 2) MMDP). The localised visual effect of the substation is increased due to its location adjacent to the Sturt Highway. However the visual effect to the whole of the scenic route could be described as limited. This is due to the road alignment; which curves both before and after this location, local ridges and stands of vegetation along the road corridor the substation will only be visible when travelling along a limited section of the Highway.
A number of Council Wide provisions discuss the modification of the natural landform both in relation to access tracks as well as development ground works. These provisions seek the minimisation of impacts or the protection and conservation of natural landscape assets contributing to the retention of scenic value.
LDP - Natural Resources Objective 10; Siting and Visibility PDC 8; Sloping Land Objective 1, PDCs 1 and 2
GDP - Natural Resources Objective 9; Siting and Visibility PDC 7; Sloping Land Objective 1, PDCs 1 and 2
MMDP – Rural Zone Policy Area 14 PDC 4; Council Wide Objective 54, PDCs 171, 194, 380, 381
The wind farm will require a degree of modification to natural landforms, typically requiring a series of 10m wide gravel tracks to provide access to each wind turbine locations during construction and an area approximately 90m x 45m for the footings and crane hardstand area. The location and grading of these access tracks are determined by the functional requirements of the development.
The resulting disturbance is considered minimal and needs to be considered against the context of the wider agricultural landscape. The form, materiality and colour of the tracks and hardstand areas are in keeping with other tracks, lay down areas and roads in the area. Over time, these tracks, through limited use by the wind farm operator, will become overgrown by herbaceous species, particularly to the edges, reducing the visual effect.
In addition, the visibility of the tracks is part of an envisaged form of development. The proportional visual effect of the tracks will be minimal and secondary when considered against the degree of visual change produced by wind turbines.
The modification of the landform for both substations could be refined during the detailed design phase and may allow the development to sit lower in the landscape, retain the natural character of the landforms and increase the effectiveness of landscape screening treatments.
The development plan discuss requirement for screening developments using landscaping to provide visual screening when viewed from adjoining properties and public roads.

06 Review of Development Plan (Desired Character Statements)
180119_twin creeks lvia_j_16twf.docx 67
LDP - Siting and Visibility PDC 9
GDP - Siting and Visibility PDC 8
MMDP – Rural Zone Policy Area 14 PDC 3; Council Wide PDC 171
While landscape screening is not realistic to achieve in regards to the turbines due to scale and operational requirements there is potential to screen or partially screen some of the associated infrastructure. With regards to other requirements such as access and electricity supply landscaping could contribute to the reduction of visual effect for some pieces of associated infrastructure as discussed in section 5.11 to 5.14 of this report.
Again, there is are tensions between the Primary Production and Rural Zone desired future character and the general requirements of the Council Wide PDCs, particularly relating to Siting and Design, Conservation and Water Resources. The turbine layout for Twin Creek wind farm is a compact cluster which minimises both the duration that the wind farm is viewed along road ways but also reduces the proportion of the view which is changed. The siting for Twin Creek within a defined visual envelope as discussed within section 5.9 of this report aids in minimising the visual impact on the existing landscape character, natural areas, areas of scenic value and tourist routes, accepting that wind farms are an anticipated form of development in the Zone and that wind turbines will be visually prominent in the landscape.

06 Review of Development Plan (Desired Character Statements)
180119_twin creeks lvia_j_16twf.docx 68
06 State Wide Landscape Scenic Quality Values
6.1 Review of State Wide Landscape Scenic Quality Values
To present a wider understanding of the landscape value associated with the existing landscape and impact of the proposed development, a review has been undertaken of a research study conducted by Dr Andrew Lothian in relation to landscape character, landscape value and the potential visual change created by wind farms.
6.2 State Wide Landscape Scenic Quality Values
Referring to Lothian (2000)8, the biophysical landscape character of the Southern Flinders Ranges, Mid North Plains and surrounding region has been classified as agricultural plains, low ranges/ hills and main ranges, Figure 49.
The assessment process conducted by Lothian (2000) measured public scenic beauty perception values of South Australian Landscapes. Scenes were rated out of 10.
The mean ratings for scenes within the Southern Agricultural Province were;
• Main High Ranges 6
• Agricultural Hills and low ranges 5
• Plain (Coastal) 4
In addition, scenes were assessed with regards to land use and physical characteristics such as vegetation type and coverage, topographic variance, the presence of water. Crops and pastures occupy the majority of the southern agricultural province. The mean of these scenes was 4.36. To be more specific, scenes of crops and pastures with ridgelines had a mean of 4.53 whereas flat terrain recorded a mean 3.97 and coastal areas had a median range of 6-6.99.
The agricultural landscape of the Northern Mount Lofty Ranges received a moderate ranking in terms of the scenic quality. Figure 50 illustrates the landscape quality variance of South Australia and the proposed location of the Twin Creek Wind Farm and represents landscape quality values of 5 to 6.
A subsequent study was conducted by Lothian (2008)9, the objective of which was to measure the scenic perceptions and visual effects of wind farms in the landscape. Using the South Australian landscape quality assessment as a baseline reference, the potential sensitivity of wind farms in particular geographic localities was interpolated in the study.
The findings of the 2008 study reported that scenes with a scenic quality of less than 5.1 would be improved by the presence of a wind farm. The trend correlation between existing landscape quality and visual sensitivity to wind farm developments is derived by an existing landscape quality rating of 5.1 at which point a lower valued landscape will not be devalued by the presence of a wind farm. In fact, the development has the potential to add qualities such as scale, form and/or a dynamic visual element within a modified and often denuded landscape.
In the case of the Project, the existing landscape quality is extremely diverse with areas of scenic values and well areas that are impacted significantly by industrial infrastructure. Consequently, the visual effect of the proposed wind farm may potentially be improved by the presence of a wind farm, while other locations may be impacted. As such, the findings of Lothian are provided for information purposes only.
8Lothian, A. (2000) Landscape Quality Assessment of South Australia. Department of Geographical & Environmental Studies. University of Adelaide. PhD
9Lothian, A.(2008). Visual Impact Assessment of Wind Farms in South Australia. Geographical Research, 46/2, 196 - 207
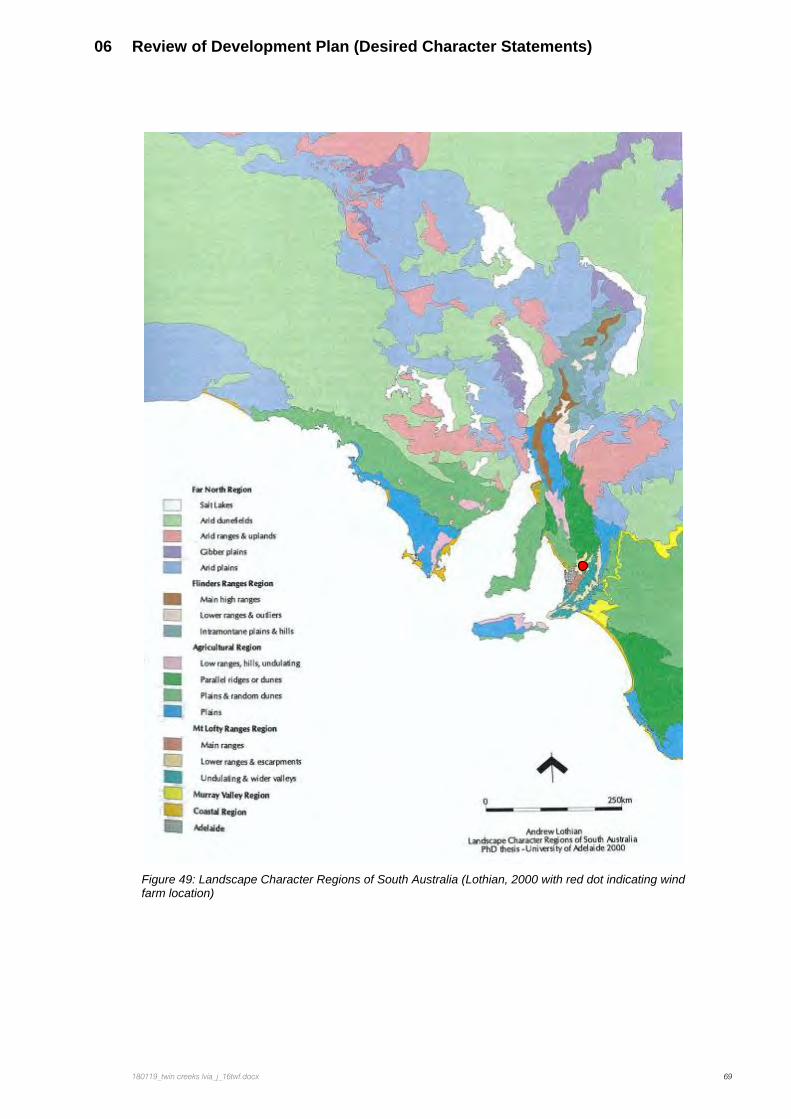
06 Review of Development Plan (Desired Character Statements)
180119_twin creeks lvia_j_16twf.docx 69
Figure 49: Landscape Character Regions of South Australia (Lothian, 2000 with red dot indicating wind farm location)

06 Review of Development Plan (Desired Character Statements)
180119_twin creeks lvia_j_16twf.docx 70
Figure 50: Landscape Quality of South Australia (Lothian, 2000 with red dot indicating wind farm location)
07 Cumulative Visual Effect
180119_twin creeks lvia_j_16twf.docx 71
07 Cumulative Visual Effect
7.1 Description of Cumulative Visual Effect
Cumulative visual effects can be defined as the additional changes caused by a proposed development in conjunction with other similar developments10 in the landscape or site locality or as the combined effect of a set of developments, taken together. The following assessment has considered the cumulative effects of other existing and potential development in the regional locality of the Twin Creek Wind Farm.
To understand the degree of cumulative visual effect the following descriptions have been provided to depict the different types of cumulative visual effects
Combined Visibility: When a proposed wind farm is located within a visible distance to existing developments, the observer from a particular viewpoint may be able to see more than the one form of development.
Succession: When the observer has to turn to see the various developments from the same viewpoint. The developments cannot be seen at the same time; they are in a different arc of view. However, the cumulative visual impact will have a degree of perceptive value.
Sequential Effects: When the observer has to move or travel through the landscape to view the various developments within the same field of view. Sequential effects should be assessed for travel along regularly used routes (major roads). Different degrees of sequential effect will be evident
Frequent Effects: Frequent sequential effects occur when the developments appear within the same field of view regularly with short time periods in between. The speed of travel and distance between large scale infrastructure developments will be determinants of the significance of the effect.
7.2 Discussion of Cumulative Visual Effect
Throughout the wider regional landscape context of the Northern Mount Lofty Ranges and Mid North, wind farms exist or are proposed as clustered developments increasing and decreasing in visual prominence as a result of each wind farm’s layout and location rather than as a combined cumulative visual effect. The absence of visual presence of existing or proposed wind farms in the regional locality around the Twin Creek Wind Farm means that any cumulative visual effect would be described as sequential. At the time of the assessment the consultant team are aware of the closest development being the Waterloo Wind Farm.
The distance between the Twin Creek Wind Farm and the expanded Waterloo Wind Farm is 28 kilometres at its nearest point. At this distance, the visual effect is negligible, and the ability to view both wind farms in the same view is limited if possible at all particularly due to the underlying topography and vegetation of the locality. Furthermore, the Zone of Theoretical Visual Influence (ZTVI) illustrates the enclosed nature of the Twin Creek locality which limits the perceived sequential visual experience of the Twin Creek Wind Farm and other wind farms in the area.
The potential sequential cumulative visual effect is negligible and will not impact on the underlying character of the landscape or elevate the visual effect of the Twin Creek proposal.
4
http://www.snh.org.uk/pdfs/strategy/cumulativeeffectsonwindfarms.pdf [Accessed 01 September 2015]

08 Viewer Sensitivity
180119_twin creeks lvia_j_16twf.docx 72
08 Viewer Sensitivity
The preceding assessment considers the visual effect of the wind farm from various locations having regard to the existing landscape quality and the degree of visual change on the existing environment. It does not measure the extent to which a viewer’s response or sensitivity to landscape changes and how this influences the perception of visual effect.
The Wind Farms Planning Bulletin Planning SA (2002) identifies potential viewers and the possible sensitivity that may be experienced by the public, ranging from the eco-tourist, who may experience a devaluing of the landscape, to members of the local community, who might stand to benefit from the development. However, the Planning Bulletin also concedes that "Given the potential impact on the visual amenity of an area, a diverse range of public response can be expected".
Fundamental to the viewer’s sensitivity is the degree to which visual change is perceived or experienced and whether this is seen as a positive or negative visual effect. Therefore, it is likely that local residents, who are most familiar with the landscape, will experience a greater degree of change than occasional visitors to the area. However, whether the change is perceived as positive or negative will depend on the viewer’s opinions. It is evident that many people like the look of turbines considering them sculptural and majestic or positive signs of climate change action, while some view them as an industrial blight.
By contrast, the majority of tourists may perceive no change and see the wind farm as part of the existing visual environment.
The truth may be that within all user groups, be they locals, tourists, walkers or weekenders, a spectrum of opinions can be expected based on differing views on the receiving landscape, the visual appeal of turbines and renewable energy itself. The final level of viewer sensitivity becomes the personal preference of the viewer as to whether the visual change is positive or negative, as an assessment of social or demographic groups can only be subjective, it does not form part of this discussion.
09 Conclusion
180119_twin creeks lvia_j_16twf.docx 73
09 Conclusion
The landscape assessment and ZTVI illustrate that the Twin Creek Wind Farm will be developed in a modified rural landscape with defined visual character. The topography of the Nain Ranges, Greenock Ranges, Light Ranges, Barossa Ranges and Mount Rufus create a visual envelope to the west and north of the proposed development farm. To the south, local landforms and existing belt of vegetation associated with Barossa Valley limit the visibility of the proposed wind farm.
Throughout the regional locality around the proposed wind farm, the existing land use is agricultural with small woodland pockets of vegetation. Within this visually contained rural landscape, the proposed layout of the Twin Creek Wind Farm forms a compact cluster of 51 wind turbines.
The potential visual effect is most notable from the east and west with the proposed wind turbines situated on the ridges of the Central Tablelands. The scale of the proposed development in relation to the vertical scale of the underlined topography is prominent to visibility if individual wind turbines. From local and sub-regional locations within five kilometres of the proposed wind farm, the screening provided by local ridgelines and vegetation belts is limited, and the majority of the wind farm is visible. The resulting visual effect produces a degree of visual change in the order of 43% to 48% which is described as substantial with the visual character of the locality being altered. However, the sensitivity of the underlying landscape to change is low due to the agricultural character.
Further away from the proposed development local ridgelines and tree belts create visual screens that fragment or remove the visual effects of the proposed wind turbines. The combination of topography and vegetation increases the screening reducing the degree of visual change that ranges from 23% to 33% and is describe as moderate.
At distances of over ten kilometres, the degree of visual changes reduces significantly, and the degree of change is reduced to a range of 12% to 17%, particularly to the north east and south west and is describe as slight.
The associated infrastructure; substations and transmission line, will provide localised impacts to their immediate site localities. These visual effects will be limited to shorter distances (contained viewsheds) to the east and south east or Truro. There will be no visual effect from the township of Truro. Transient experiences will be witnessed along local roads within the south east of the regional site with a small section of the Sturt Highway being impacted by the substation terminal connection to the existing 275kv line. Depending on the viewpoint, local landforms will provide visual screening. Furthermore the reduced vertical scale of the gantries and transmission pylons in contrast to the turbines, meaning the associated infrastructure will only slightly contribute to the overall level of visual change in the regional landscape.

09 Conclusion
180119_twin creeks lvia_j_16twf.docx 74
The visual assessment and visual effect interpolation mapping illustrated the relationship between distance and visual effect and the significance of local of ridgelines in reducing the visibility of the proposed wind farm in the wider locality. The visual effect is represented as bands of visual change radiating from the proposed wind farm. The consistency of the existing landscape character means that distance and visual absorption are the dominant variables in mitigating the visual effect.
Although, the visual effect is likely to be moderate to substantial within the local to subregional area, the containment of the effect can be attributed to the visual character of the landscape coupled with uniformity of the agricultural character, meaning that the proposed Twin Creek Wind Farm can be accommodated without significantly altering the underlying landscape character
Warwick Keates BA (Hons), Grad Dip LA, CMLI, AAILA, Registered Landscape Architect
Dr Brett Grimm PhD, BLarch, BDest, AILA Registered Landscape Architect

Landscape Character and Probable Visual Effect Assessment: Appendices Twin Creek Wind Farm Project RES Australia Pty Ltd
19 January 2018
WAX DESIGN Ltd Pty ACN 117 346 264 Suite 3 241 Pirie Street Adelaide 5000 SA T 8 8215 0144 E [email protected] Contact: Warwick Keates
© December 17

REVISION DATE AUTHOR REVIEWER
J 19/11/2018 BG/CS/WK WK
I 06/12/2017 CS
H 24/11/2017 BG/CS/WK CS
V05 27/06/2017 BG/CS/WK WK
V04 23/06/2017 BG/CS/WK CS
V03 18/04/2017 BG/CS/WK CS
V02 15/04/2017 BG/CS/WK CS
V01 20/03/2017 BG/CS/WK CS

Appendix A Assessment Mapping