twenty-third annual report to congress · 23rd annual report to congress i-2 figure i-1 percentage...
TRANSCRIPT

I. RESULTS
High School Graduation Among Students with Disabilities
Participation and Performance of Students with Disabilitiesin State Assessment Systems
Challenges To Providing Secondary Education and TransitionServices for Youth with Disabilities
Outcomes for Students with Problem Behaviors in School:Issues, Predictors, and Practices
Results Experienced by Children and Families Entering EarlyIntervention

I-1
High School Graduation Among Students withDisabilities
he Office of Special Education Programs (OSEP) establishes goals, objectives,and performance indicators in accordance with the Government Performance
and Results Act (GPRA) to measure progress in improving results for students withdisabilities. One of the objectives included in the U.S. Department of Education’s2001 Annual Plan is that secondary students with disabilities will receive the supportthey need to complete high school prepared for postsecondary education oremployment (U.S. Department of Education, 2000). The percentages of studentswith disabilities who graduate from high school with a standard diploma and whodrop out of high school are important indicators of progress toward this objective.Accordingly, this module reports graduation and dropout information for studentswith disabilities for the 1998-99 school year and examines trends in graduation anddropout rates over the past few years. In addition, the module discusses graduationand dropout rates by disability category and by race/ethnicity.
Graduation and Dropout Rates for Students with Disabilities
According to the National Center for Education Statistics (NCES, 2000), high schoolgraduation, completion, and dropout rates may be calculated in a number of differentways. OSEP is particularly interested in the rate at which students with disabilitiesgraduate from high school with a standard diploma.
One method of calculating graduation rates is to divide the number of students age14 and older who graduated with a standard diploma by the number of students 14and older who are known to have left school (i.e., graduated with a standard diploma,received a certificate of completion, reached the maximum age for services, died, ordropped out). This is the formula OSEP uses to establish performance indicatorsunder GPRA.
Graduation rates for students with disabilities age 14 and older have climbed steadilysince 1993-94, as illustrated in figure I-1. At the same time, the dropout rate amongthese students has declined.
In 1993-94, the dropout rate was 34.5 percent. By 1998-99, that rate had reached a 6-year low of 28.9 percent. This rate was somewhat better than OSEP’s target dropoutrate of 31 percent (U.S. Department of Education, 2000). Dropout rates arepresented in figure I-2.
T

23rd Annual Report to Congress
I-2
Figure I-1Percentage of Students Age 14 and Older Graduating with a Standard
Diploma, 1993-94 to 1998-99
51.9
52.452.6
53.5
55.4
57.4
49
50
51
52
53
54
55
56
57
58
1993-94 1994-95 1995-96 1996-97 1997-98 1998-99
Year
Per
cen
tage
Note: Graduation rates were calculated by dividing the number of students 14 and older whograduated with a diploma by the number of students 14 and older who graduated with adiploma, received a certificate, reached the maximum age for services, died, and droppedout.
Source: U.S. Department of Education, Office of Special Education Programs, Data AnalysisSystem (DANS).
Graduation and Dropout Rates by Disability
Graduation rates for students age 14 and older with disabilities varied by disabilitycategory. Students with visual impairments graduated at the highest rate (75.1percent), followed by students with traumatic brain injury (70.3 percent) and studentswith hearing impairments (69.4 percent).
Students in five disability categories graduated at rates lower than the 57.4 percentobserved for all students with disabilities. Graduation was least likely among students14 and older who had mental retardation (41.7 percent) and emotional disturbance(41.9 percent). Table I-1 presents graduation rates for students age 14 and older in all12 disability categories.

High School Graduation Among Students with Disabilities
I-3
Figure I-2Special Education Dropout Rates, 1993-94 to 1998-99
34.534.1 34.1
32.7
28.9
31.0
26
27
28
29
30
31
32
33
34
35
1993-94 1994-95 1995-96 1996-97 1997-98 1998-99
Year
Per
cen
tage
Note: Dropout rates were calculated by dividing the number of students 14 and older whodropped out by the number of students 14 and older who graduated with a diploma,received a certificate, reached the maximum age for services, and dropped out.
Source: U.S. Department of Education, Office of Special Education Programs, Data AnalysisSystem (DANS).
Dropout rates for students age 14 and older also varied by disability category.Dropout rates were lowest for students with autism (9.5 percent), deaf-blindness(11.5 percent), and visual impairments (11.8 percent). The highest dropout rateoccurred among students with emotional disturbance: half of the students in thatdisability category dropped out of school in 1998-99. Dropout rates for the differentdisability categories are presented in table I-1.
Graduation and Dropout Rates by Race/Ethnicity
The Twenty-second Annual Report to Congress included, for the first time, data on theracial/ethnic composition of the special education population. This section of themodule looks at graduation rates by race/ethnicity. Because the race/ethnicity datacollection is so new, the data reported here should be interpreted cautiously. Analysisin the next 2 to 3 years will present a clearer picture of this variable.

23rd Annual Report to Congress
I-4
Table I-1Number and Percentage of Students Age 14 and Older with Disabilities
Graduating with a Standard Diploma or Dropping Out, 1998-99
Graduated with a StandardDiploma Dropped Out
Disability Category Number Percentage Number PercentageSpecific learning disabilities 100,738 63.3 43,156 27.1Speech/language impairments 4,260 64.8 1,644 25.0Mental retardation 16,086 41.7 9,628 24.9Emotional disturbance 13,735 41.9 16,583 50.6Multiple disabilities 2,075 47.0 788 17.8Hearing impairments 2,610 69.4 533 14.2Orthopedic impairments 1,830 63.4 421 14.6Other health impairments 5,706 66.8 1,940 22.7Visual impairments 1,172 75.1 184 11.8Autism 418 47.1 84 9.5Deaf-blindness 52 54.2 11 11.5Traumatic brain injury 790 70.3 169 15.0All disabilities 149,472 57.4 75,141 28.9
Note: The percentages in this table were calculated by dividing the number of students age 14 andolder who graduated with a standard diploma or dropped out by the number of students age14 and older who are known to have left school (i.e., graduated with a standard diploma,received a certificate of completion, reached the maximum age for services, died, ordropped out.)
Source: U.S. Department of Education, Office of Special Education Programs, Data AnalysisSystem (DANS).
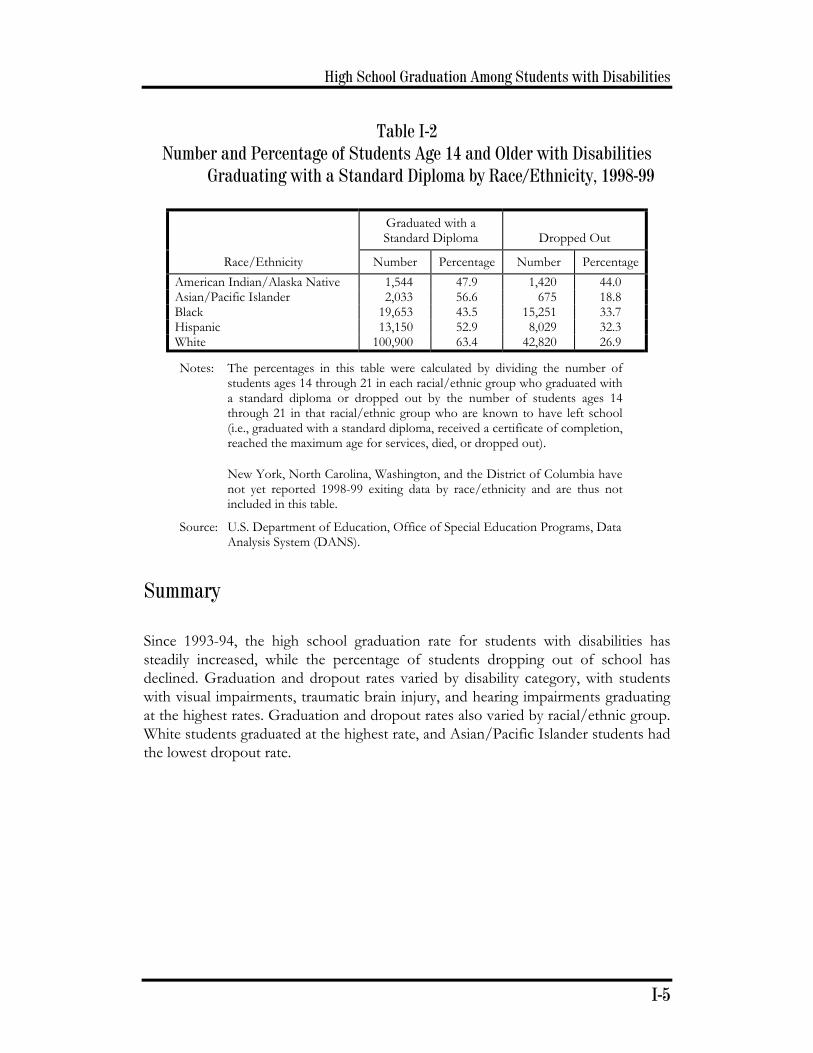
Graduation rates for students with disabilities ages 14 through 21 varied byracial/ethnic group, ranging from 63.4 percent among white students to 43.5 percentamong black students. Graduation rates for each racial/ethnic group are reported intable I-2. Dropout rates also varied by racial/ethnic group. Asian/Pacific Islanderstudents had the lowest dropout rate, with a figure of 18.8 percent. They werefollowed by white students, with a dropout rate of 26.9 percent, Hispanic students,with a dropout rate of 32.3 percent, and black students, with a dropout rate of 33.7percent. The highest dropout rate occurred among American Indian/Alaska Nativestudents, at 44.0 percent.
High School Graduation Among Students with Disabilities
I-5
Table I-2Number and Percentage of Students Age 14 and Older with Disabilities
Graduating with a Standard Diploma by Race/Ethnicity, 1998-99
Graduated with aStandard Diploma Dropped Out
Race/Ethnicity Number Percentage Number PercentageAmerican Indian/Alaska Native 1,544 47.9 1,420 44.0Asian/Pacific Islander 2,033 56.6 675 18.8Black 19,653 43.5 15,251 33.7Hispanic 13,150 52.9 8,029 32.3White 100,900 63.4 42,820 26.9
Notes: The percentages in this table were calculated by dividing the number ofstudents ages 14 through 21 in each racial/ethnic group who graduated witha standard diploma or dropped out by the number of students ages 14through 21 in that racial/ethnic group who are known to have left school(i.e., graduated with a standard diploma, received a certificate of completion,reached the maximum age for services, died, or dropped out).
New York, North Carolina, Washington, and the District of Columbia havenot yet reported 1998-99 exiting data by race/ethnicity and are thus notincluded in this table.
Source: U.S. Department of Education, Office of Special Education Programs, DataAnalysis System (DANS).
Summary
Since 1993-94, the high school graduation rate for students with disabilities hassteadily increased, while the percentage of students dropping out of school hasdeclined. Graduation and dropout rates varied by disability category, with studentswith visual impairments, traumatic brain injury, and hearing impairments graduatingat the highest rates. Graduation and dropout rates also varied by racial/ethnic group.White students graduated at the highest rate, and Asian/Pacific Islander students hadthe lowest dropout rate.

23rd Annual Report to Congress
I-6
References
National Center for Education Statistics. (NCES). (2000). A recommended approach toproviding high school dropout and completion rates at the state level. (NCES 2000-305).Washington, DC: U.S. Department of Education.
U.S. Department of Education. (2000). U.S. Department of Education’s 1999 performancereport and 2001 annual plan. Washington, DC: Author. RetrievedDecember 14, 2000, from the World Wide Web:http://www.ed.gov/pubs/AnnualPlan2001/index.html

I-7
Participation and Performance of Students withDisabilities in State Assessment Systems
Participation
n 1999, the National Center on Educational Outcomes (NCEO) asked Statedirectors of special education to provide their most recent frequency data on the
participation of students with disabilities in State assessments (Thompson &Thurlow, 1999). In the past, most States were able to provide only estimates of theparticipation of students with disabilities in State assessments. In 1997, prior to thereauthorization of the Individuals with Disabilities Education Act (IDEA), 15 Statesprovided actual participation numbers (Erickson & Thurlow, 1997). In 1999, 23States provided these data.
Although the Federal requirement is for States to report the number of students withdisabilities participating in State and district assessments, participation rates (reportedas percentages) are useful for policymakers evaluating the inclusiveness ofassessment programs. Using State-provided numbers of students participating inassessments and child count data, NCEO calculated participation rates for specificadministrations of State tests (Thompson & Thurlow, 1999). These estimated ratesare contained in table I-3. Rates of participation varied from less than one-fourth ofstudents with disabilities to all students with disabilities.
There are several factors that State directors of special education believe may workagainst the full participation of students with disabilities in large-scale assessmentprograms, especially in States where accountability systems have significantconsequences for students or schools (Thompson & Thurlow, 1999). The top threefactors are:
• High stakes (i.e., sanctions or rewards) attached to school or districtperformance;
• Lack of exposure to the curriculum or content included in tests; and
• The perception of teachers, parents, and others that large-scale testing isirrelevant to the educational success of students with disabilities.
I

23rd Annual Report to Congress
I-8
Table I-3Percentage of Students Receiving Special Education Services Who
Participated in State Assessments
State
ElementaryGrades(K-5)
Middle SchoolGrades
(6-8)
High SchoolGrades(9-12)
1 44% 43% 27%2 81 73 513 52 63 534 51 79 785 62 66 566 100 100 1007 95 95 ---*8 96 93 919 84 89 ---*10 65 70 5111 83 88 9312 88 90 ---*13 62 59 4614 80 78 6115 48 56 3216 94 91 9117 58 74 6718 74 72 7019 39 42 4120 90 85 5021 92 94 ---*22 89 ---* ---*23 23 15 26
* No test administered at this level.
Note: Because there were multiple tests in some States and multiplegrades in others, total numbers are not available.
Source: Thompson & Thurlow, 1999.
An analysis of data from the National Assessment of Educational Progress (NAEP)suggested that the provision of accommodations also affects the participation rate ofstudents with disabilities. NAEP participation rates were higher in grades 4 and 8(but not grade 12) when accommodations were provided (U.S. Department ofEducation, 1999). Since accommodations are included in students’ IEPs, fewerstudents will participate in assessments if the terms guiding the use ofaccommodations for specific assessments are in conflict with students’ IEPs. Forexample, if a student’s IEP specifies multiple breaks during testing but a particularassessment’s guidelines say to break only at specific times, that student is less likely toparticipate in the assessment.

Participation and Performance of Students with Disabilitiesin State Assessment Systems
I-9
Performance
NCEO analyzes State education reports to determine what types of information areprovided on students with disabilities. Previous analyses had shown that few States(11 in the first analysis and 13 States in the second analysis) reported test-basedresults for students with disabilities. For the most recent analysis, 170 reports werecollected from State accountability offices and State special education officesbetween March 1999 and August 1999. This analysis found that only 14 Statesincluded participation data, and only 17 States included performance data forstudents with disabilities in State assessments (Thurlow, Nelson, Teelucksingh, &Ysseldyke, 2000).
According to public reports, participation rates in State assessments varied from 33percent to 97 percent of students with disabilities. Performance levels also variedwidely, with the differences between rates of students with disabilities who met Statestandards and all students ranging from 20 percent to 50 percent. Table I-4summarizes the performance data obtained from State reports.
There were increases in the reporting of performance data for students withdisabilities but not to the extent that might be expected given the timelines in theIDEA Amendments of 1997. Of the 41 States that provide information other thanfinancial data on students with disabilities, 17 States disaggregated performance datafor students with disabilities on statewide assessments. A handful of States includedinformation in their State accountability documents on how students with disabilitiesperform over time and whether their performance improves from year to year(Thurlow et al., 2000).
For the 17 States that presented information on statewide assessments, the mostfrequently reported content areas were reading (17 States) and mathematics (17States). Eleven States reported science data, 10 reported writing data, and 6 reportedsocial studies data. Sixteen States reported on students with disabilities in three ormore content areas.
Reading Achievement
In the 17 States with disaggregated performance data, between 5 percent and 87percent of students with disabilities who were tested met performance standards inreading. The differences in passing rates for all students and students with disabilitiesranged from 12 to 49 percentage points. In grade 8, the grade for which the mostStates reported data, the differences in passing rates for all students and students

23rd Annual Report to Congress
I-10
Table I-4Summary of Reports on Educational Results on Students with Disabilities
Educational Results
• Seventeen States disaggregated performance data as specified in IDEA for students withdisabilities (CT, DE, MD, MA, MN, MS, NV, NH, NY, NC, RI, SC, SD, TX, VT, VA,WV)
• Of 74 reports that did not include data on students with disabilities, over 50 includedperformance data on regular education students
• The most frequently reported content areas for assessment are reading (17 States) andmathematics (17 States)
• Sixteen States tested and reported on students with disabilities in three or more contentareas
• While 20 States reported graduation exam results for regular education, only 35 percent(7 States: MD, MN, MS, NY, SC, TX, VA) reported these results for students withdisabilities
• It is important to keep in mind participation factors (e.g., percentage of students withdisabilities actually being tested) when examining the performance results of studentswith disabilities. Higher proficiency rates may also be a result of increased exclusion ofstudent scores or lower standards
• The differences in proficiency rates between all students and students with disabilities on8th grade State assessments ranged from:
o 23 to 47 percent in reading
o 19 to 42 percent in math
o 25 to 44 percent in writing
• New York, Rhode Island, and Texas presented unique data on students with disabilitiesin the domain of Academic and Functional Literacy:
o NY: Test scores on Occupational Education Proficiency examinations
o RI: Test scores on health content area in statewide assessment
o TX: Test scores on college entrance exam (TASP)
• Kansas continued to report data in the domain of personal and social well-being(number of violent acts toward staff and students)
Source: Thurlow et al., 2000.

Participation and Performance of Students with Disabilitiesin State Assessment Systems
I-11
Figure I-3Differences on Criterion-Referenced Mathematics Tests Between 8th Grade
Students with and Without Disabilities in 10 States
0102030405060708090
1 2 3 4 5 6 7 8 9 10
State
Per
cen
t P
assi
ng
Students without disabilities Students with disabilities
Source: Thurlow et al., 2000.
with disabilities in reading performance ranged from 23 to 47 percentage points,using criterion-referenced measures.
Mathematics Achievement
Mathematics performance was similarly variable. Overall, 3 percent to 74 percent ofstudents with disabilities met mathematics performance standards in the 17 Stateswith disaggregated performance data. The differences in passing rates of studentswith disabilities and all students ranged from 13 to 42 percentage points (see figureI-3). For 8th graders taking criterion-referenced mathematics exams, the differencesin passing rates ranged from 19 to 42 percentage points.
These results are consistent in direction with results from the NAEP assessment ofmathematics skills in 1996 (U.S. Department of Education, 1999). In the 1996NAEP, students with disabilities scored between the 9th and 18th percentile, varyingby grade and subsample. Across grades and subsamples, the NAEP mathematics
23rd Annual Report to Congress
I-12
scores of white students with disabilities were higher than those of minority studentswith disabilities.
Using a large longitudinal database, NCEO examined the effect of transitionsbetween regular education and special education across grades on performancetrends for the special education population. The study also examined the effect ofchanges in assessment exemption rates across grades for students with disabilities.NCEO found that the highest achieving special education students left specialeducation to return to regular education and that the lowest performing regulareducation students who had been referred to and found eligible for special educationentered special education (Bielinski & Ysseldyke, 2000). The result of this movementbetween regular and special education was a substantial increase in the performancegap over time between regular education and special education students acrossgrades. The study also revealed that the reduction in assessment exemption ratesfrom testing that has occurred over timeand that is reflected in this study primarilyin the higher gradesadded to the size of the gap.
When the same special education students were tracked over time, however, theperformance gap decreased slightly (Bielinski & Ysseldyke, 2000). These findingshave significant implications for the States as they begin to publicly reportdisaggregated data on students with disabilities (such as those shown in figure I-3),particularly if attempts are made to track performance across time. Failure todocument and account for changes in students’ special education status and previousassessment exemption rates could result in misinterpretations about the effectivenessof special education services. Restricting the group of students for longitudinalanalysis to those who received special education services during the first year ofanalysis and following their performance regardless of whether they continued toreceive special education services will provide a more accurate indication of progressover time. Thus, States should consider ways to report on both the performance ofall students with disabilities and the longitudinal performance of clearly definedtargeted groups of students receiving special education services.
Change in Participation Rates and Performance Levels ofStudents with Disabilities
NCEO’s 2001 Survey of State Directors of Special Education (Thompson, Thurlow,& Boys, 2001) asked directors whether the most recent test participation rates ofstudents with disabilities on their State assessments had changed from previousyears. Similarly, directors were asked whether the most recent test performance levelsof students with disabilities on their State assessments had changed (see figures I-4and I-5).

Participation and Performance of Students with Disabilitiesin State Assessment Systems
I-13
Figure I-4Change in Test Participation Rates of Students with Disabilities Over
Previous Testing Years
����������������������������������������������������������������������������������������������������������������������������������������������������������������������������������������������������������������������������������������������
Higher than previous years
56%
Lower than previous years
2%Comparison data
not available18%
About the same as previous years
24%
Source: Thompson et al., 2001.
The assessment participation rates of students with disabilities have increased in overhalf of the States and remained the same in another 25 percent of States. Only oneState reported participation rates that are lower than in previous years. Nine Statesreported that they were in their first year of testing and did not have comparison datafrom previous years. State directors of special education attributed an increase inparticipation rates primary to these factors:
• IDEA regulations requiring participation in statewide assessments;
• Requirements of State accountability programs;
• Alternate assessment participants being exempt in previous years; and
• Increased flexibility in test accommodations.

23rd Annual Report to Congress
I-14
Figure I-5Changes in Test Performance Levels of Students with Disabilities Over
Previous Testing Years
������������������������������������������������������������������������������������������������������������������������������������������������������������������������������������������������������������������������������������������������������������������������������������������������������������������������������������������������������������������������������������������������������������
Higher than previous years
22%
About the same as previous years
32%
Comparison data not available
38%
Lower than previous years
8%
Source: Thompson et al., 2001.
State directors of special education reported that the assessment performance levelsof students with disabilities have increased in about a quarter of the States andremained the same in another 32 percent of the States. Four States reported lowerperformance levels than in previous years. The director in one of these Statescommented, “The lower levels of performance may be the result of increasedparticipation of students who previously received an alternative form of assessmentas determined by their IEP teams.” Over a third of the State directors reported thateither their States have not yet disaggregated performance data for students withdisabilities or that this is their first year of testing, and they do not have data fromprevious years to use for comparison purposes.
Participation and Performance of Students with Disabilitiesin State Assessment Systems
I-15
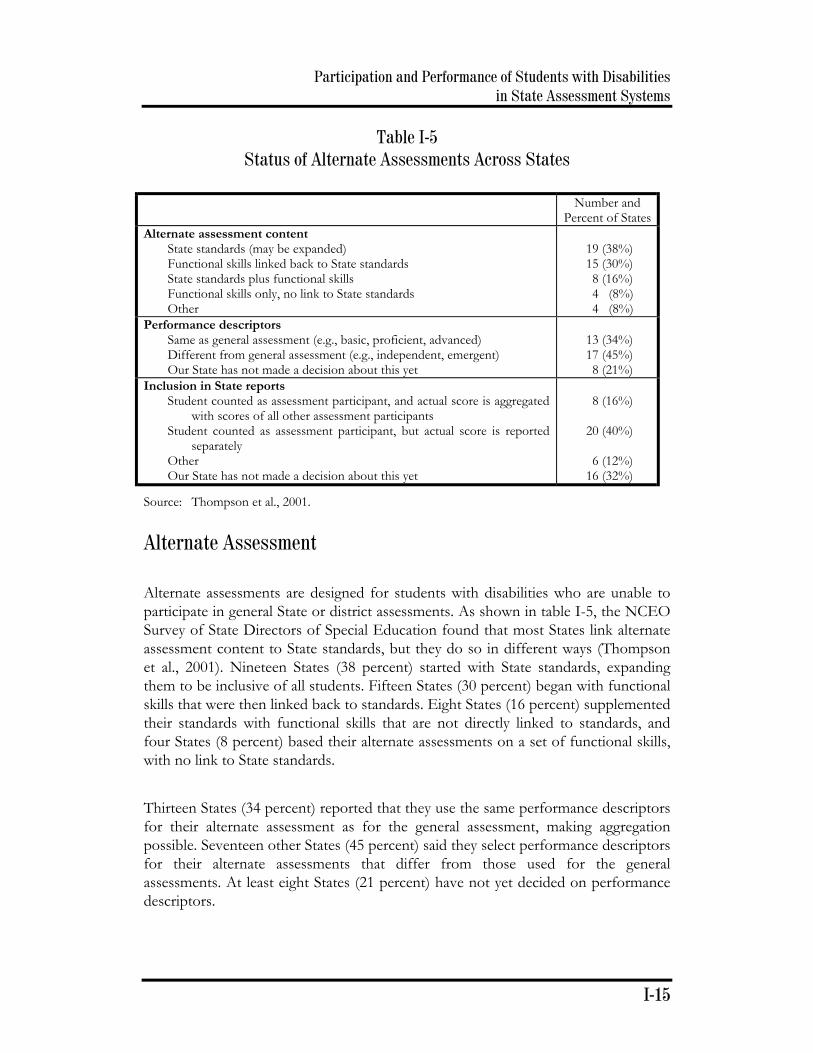
Table I-5Status of Alternate Assessments Across States
Number andPercent of States
Alternate assessment contentState standards (may be expanded)Functional skills linked back to State standardsState standards plus functional skillsFunctional skills only, no link to State standardsOther
19 (38%)15 (30%)8 (16%)4 (8%)4 (8%)
Performance descriptorsSame as general assessment (e.g., basic, proficient, advanced)Different from general assessment (e.g., independent, emergent)Our State has not made a decision about this yet
13 (34%)17 (45%)8 (21%)
Inclusion in State reportsStudent counted as assessment participant, and actual score is aggregated
with scores of all other assessment participantsStudent counted as assessment participant, but actual score is reported
separatelyOtherOur State has not made a decision about this yet
8 (16%)
20 (40%)
6 (12%)16 (32%)
Source: Thompson et al., 2001.
Alternate Assessment
Alternate assessments are designed for students with disabilities who are unable toparticipate in general State or district assessments. As shown in table I-5, the NCEOSurvey of State Directors of Special Education found that most States link alternateassessment content to State standards, but they do so in different ways (Thompsonet al., 2001). Nineteen States (38 percent) started with State standards, expandingthem to be inclusive of all students. Fifteen States (30 percent) began with functionalskills that were then linked back to standards. Eight States (16 percent) supplementedtheir standards with functional skills that are not directly linked to standards, andfour States (8 percent) based their alternate assessments on a set of functional skills,with no link to State standards.
Thirteen States (34 percent) reported that they use the same performance descriptorsfor their alternate assessment as for the general assessment, making aggregationpossible. Seventeen other States (45 percent) said they select performance descriptorsfor their alternate assessments that differ from those used for the generalassessments. At least eight States (21 percent) have not yet decided on performancedescriptors.

23rd Annual Report to Congress
I-16
About a third of the States (n=16) have not decided how alternate assessmentperformance will be included in their State reports. Of those that have, eight States(16 percent) have decided that the scores of alternate assessment participants will beaggregated with the scores of other assessment participants. In 20 States (40 percent),alternate assessment scores will be reported separately.
Difficulties in Reporting Data for Students with Disabilities
Differences in data collection and management systems may contribute to difficultiesin reporting data for students with disabilities. Many States collect data at differentpoints in time, through different offices, and for different purposes. In their study ofperformance and participation rates of students with disabilities in Oregon’s Stateassessment, Almond, Tindal, & Stieber (1997) discovered that joining two extantdatabases was difficult because the two systems did not share a common studentidentifier. The researchers pointed to the historical and legal conditions under whichthese two databases were created and how those precedents may have interfered withthe eventual merging of the two systems. The researchers also noted assessmentdifficulties for assessments conducted at particular grade levels. Such assessmentsgenerally rely on age-to-grade designations and thus may exclude students fromnongraded programs, those who started school late, or those who repeat a grade.States may need to retool their data collection and management systems to ensurethat all students with disabilities are included in performance reporting. Additionalchallenges in reporting these data include:
• Information systems that do not identify students with disabilities in Stateassessment procedures;
• Inaccuracy in marking answer documents by students, staff members, orproctors;
• State policies that exclude students with disabilities who receive any type ofaccommodation or those who use “nonstandard” accommodations;
• Lack of standardized procedures for calculating participation rates;
• Use of information on the number of students who were absent from theassessment;
• Data aggregation at the school or district level but not at the State level;
• State reports that do not explicitly describe the population sample ordisaggregate the data of students with disabilities; and

Participation and Performance of Students with Disabilitiesin State Assessment Systems
I-17
• Policies that allow for the collection but no public reporting of data onstudents with disabilities.
Summary
The IDEA Amendments of 1997 required that students with disabilities be includedin large-scale assessments and provided for the use of accommodations or alternateassessments where necessary. The amendments also stipulated that State educationalagencies must report on the performance of students with disabilities with the samefrequency and in the same detail as they report on the performance of nondisabledstudents. Recent research indicates that the participation of students with disabilitiesin state- and districtwide assessments still varies considerably across States. Similarvariations are seen in States’ reporting of assessment results for students withdisabilities. Although barriers to increasing assessment participation, performance,and reporting still remain, NCEO studies have found that the States are makingprogress toward meeting the requirements set forth in the IDEA Amendments of1997. Research has also suggested methodologies that will enhance States’ abilities toaccurately monitor performance trends over time.

23rd Annual Report to Congress
I-18
References
Almond, P., Tindal, G., & Stieber, S. (1997). Linking inclusion to conclusions: An empiricalstudy of participation of students with disabilities in statewide testing programs.Minneapolis: University of Minnesota, National Center on EducationalOutcomes.
Bielinski, J., & Ysseldyke, J. (2000). Interpreting trends in the performance of special educationstudents (Technical Report 27). Minneapolis: University of Minnesota,National Center on Educational Outcomes.
Erickson, R., & Thurlow, M. (1997). 1997 state special education outcomes: A report on stateactivities during educational reform. Minneapolis: University of Minnesota,National Center on Educational Outcomes.
Thompson, S., & Thurlow, M. (1999). 1999 state special education outcomes: A report onstate activities at the end of the century. Minneapolis: University of Minnesota,National Center on Educational Outcomes.
Thompson, S., & Thurlow, M. (2000). State alternate assessments: Status as IDEAalternate assessment requirements take effect (Synthesis Report 35). Minneapolis:University of Minnesota, National Center on Educational Outcomes.
Thompson, S., Thurlow, M., & Boys, C. (2001). 2001 State special education outcomes: Areport on state activities at the beginning of a new decade. Minneapolis: University ofMinnesota, National Center on Educational Outcomes.
Thurlow, M.L., House, A., Boys, C., Scott, D., & Ysseldyke, J. (2000). Stateparticipation and accommodation policies for students with disabilities: 1999 update.(Synthesis Report 33). Minneapolis: University of Minnesota, NationalCenter on Educational Outcomes.
Thurlow, M., Nelson, J.R., Teelucksingh, E., & Ysseldyke, J. (2000). Where’s Waldo?A third search for students with disabilities in state accountability reports (TechnicalReport 25). Minneapolis: University of Minnesota, National Center onEducational Outcomes.
U.S. Department of Education. (1999). Twenty-first annual report to Congress on theimplementation of the Individuals with Disabilities Education Act. Washington, DC:Author.

I-19
Challenges To Providing Secondary Education andTransition Services for Youth with Disabilities1
eginning in the mid-1980s, the U.S. Department of Education’s Office ofSpecial Education and Rehabilitative Services (OSERS) has emphasized the
importance of improving transition services nationally. The Federal Government hasassumed a crucial role in stimulating State and local efforts to improve transitionservices through a variety of policy, research model demonstration, and technicalassistance efforts. Specific language on transition was included in the Individualswith Disabilities Education Act (IDEA) Amendments of 1990 and again in theIDEA Amendments of 1997. From this Federal legislation, regulations wereestablished requiring State and local educational agencies specifically to address theschool and postschool transition service needs of students with disabilities. Theseneeds would be met through interagency agreements and coordinated planningamong special education staff, parents, students, regular education, and public serviceagencies.
With the reauthorization of IDEA in 1997, significant new requirements were putinto place to ensure students greater access to the general curriculum and state- anddistrictwide assessment programs. The IDEA Amendments of 1997 also expandedprevious transition requirements by requiring that the individualized educationprogram (IEP) include, at age 14 or earlier, a statement of transition service needsthat focus on the student’s courses of study (such as participation in advanced-placement courses or vocational education programs). The IEP must also include,beginning at age 16 or younger, a statement of needed transition services andinteragency responsibilities or any needed linkages.
The current challenge is to integrate and align these transition requirements withother IDEA requirements that give students with disabilities greater access to thegeneral curriculum and state- and districtwide assessment programs. Several recentstudies indicate that the implementation of transition service requirements has beentoo slow, with many States failing to achieve minimal levels of compliance (Hasazi,Furney, & DeStefano, 1999; Johnson & Sharpe, 2000; National Council onDisability, 2000). Areas of greatest noncompliance include having appropriateparticipants in IEP meetings, providing adequate notice of meetings, and providing a
1 This module is based, in part, on a synthesis of research funded by the U.S. Department of
Education, Office of Special Education Programs, to the National Center on Secondary Educationand Transition at the University of Minnesota (H326J000005). The National Center on SecondaryEducation and Transition is supported by a cooperative agreement from the Office of SpecialEducation Programs, U.S. Department of Education.
B
23rd Annual Report to Congress
I-20
statement of needed services in students’ IEPs. These problems have beencomplicated further by State and local standards-based assessment systems thateither fail to include students with disabilities or provide inadequate accommodationsthat support their participation.
Students with disabilities also experience difficulties in meeting State and localgraduation requirements, and concerns are mounting about the relationship betweenstudents’ academic experiences and the development of postschool transition plansthat address how students will access postsecondary education, employment, andcommunity living opportunities (Guy, Shin, Lee, & Thurlow, 1999; Johnson, Sharpe,& Stodden, 2000; Policy Information Clearinghouse, 1997; Stodden & Dowrick,2000a). Limited levels of service coordination and collaboration among schools andlocal service agencies create difficulties for students with disabilities and families inaccessing postschool education or work results. Strategies are desperately needed tohelp State and local educational agencies and community service agencies address thetransition service requirements as students access the general curriculum and meetState standards and graduation requirements. This module will discuss the challengesinvolved in providing services to this population and some strategies for meetingthose challenges.
Challenges Affecting Secondary Education and TransitionServices
Challenge 1: Ensure Students with Disabilities Access to the Full Range of CurricularOptions and Learning Experiences
The IDEA Amendments of 1997 provide many students with disabilities newopportunities to participate in and benefit from a wide array of general courses andlearning experiences. A major goal of accessing the general curriculum is to preparestudents to earn a standard diploma and help prepare them for adult life (PolicyInformation Clearinghouse, 1997; U.S. Department of Education, 1999). Althoughthe general curriculum contains both academic (e.g., math, science) and nonacademic(e.g., career education, arts, citizenship) domains, student performance is assessedprimarily in academics. As a result, it is not uncommon for portions of the generalcurriculum as well as transition goals to receive limited or no attention (Hasazi et al.,1999; Warren, 1997). Efforts must be undertaken to ensure that students withdisabilities remain on a full “curriculum” track with learning expectations that guidethe instruction of regular education students. IEP teams must work to ensure thathigh expectations are maintained and students are afforded opportunities to developskills through a wide range of curricular options, including vocational education,service learning, community work experience, and adult living skills (Hasazi et al.,1999; Johnson et al., 2000). Therefore, secondary education and transition models
Challenges To Providing Secondary Education and Transition Servicesfor Youth with Disabilities
I-21
are also needed that integrate academic, career, work-based, service learning, andother learning experiences.
Access to the general curriculum requires more than common standards, theintegration of academic and applied learning, and universal design.2 It also dependson other factors, such as the knowledge and skill levels of educators (Boudah,Schumaker, & Deshler, 1997; Carnine, 1995; Kameenui & Carnine, 1994; Tralli,Colombo, Deshler, & Schumaker, 1999), use of appropriate accommodations duringinstruction and testing (Elliott & Thurlow, 2000; Thurlow, Elliott, & Ysseldke, 1998;Thurlow, House, Boys, Scott, & Ysseldyke, 2000), collaboration between regulareducation and special education personnel in designing educational programs forstudents with disabilities (Knight, 1998; Lenz & Scanlon, 1998), and the support andvision of educational leadership.
There is also a critical need to develop assessment, curriculum, and instructionalstrategies that are relevant to all students (including those who have significantlearning needs), allowing them to successfully achieve State and local standards, aswell as to develop other essential adult life skills through vocational education,training in adult living skills, and community participation. Strategies such asuniversal design offer another approach to ensuring that students with disabilitiesaccess the full range of learning opportunities in the secondary education curriculum(Jorgensen, 1997; Orkis & McLane, 1998; Rose & Meyer, 1996).
To ensure that students with disabilities access the full range of general curricularoptions and learning experiences, there is a need to:
• Promote high expectations for student achievement and learning. Highexpectations must be maintained for students with disabilities across the fullrange of academic and nonacademic courses and programs available withinmiddle schools and high schools nationally. This is consistent with the BushAdministration’s blueprint for education reform, No Child Left Behind, thatmakes schools accountable for ensuring that all students meet high academicstandards. In order to maintain high academic standards, instructionalstrategies that promote differential teaching, universal design, integratedacademic and applied learning, and other practices will need to be broadlyadopted.
2 In terms of learning, universal design means the design of instructional materials and activities that
allows the learning goals to be attainable by individuals with wide differences in their abilities. Thismeans, for example, that a curriculum should include instructional and assessment alternatives tomake it accessible and appropriate for individuals with diverse learning styles and abilities (Accessto the General Education Curriculum, www.cast.org/ncac).

23rd Annual Report to Congress
I-22
• Make systematic and appropriate use of assessment and instructionalaccommodations. Regular education and special education teachers needinformation and skills on how to appropriately use accommodations inassessment and instructional situations. Improved teacher preparation at thepreservice and continuing education levels, promotion of collaborativeteaching models, and other strategies are needed to address this issue. Stateand local agencies are also grappling with inconsistent policies, procedures,and practices on the use of accommodations. Consequently,accommodations are many times viewed as unacceptable in meeting State orlocal district testing conditions, often over-used in the hope of “boosting”student performance, and commonly considered too expensive and difficultto implement. The latter factor often results in students’ not receivingappropriate accommodations.
• Ensure that students have access to the full range of secondaryeducation curricula and programs. Students’ IEPs must focus on thebroadest range of curriculum and programs that support students withdisabilities in successfully meeting State academic and related standards aswell as developing essential adult skills. In addition to the academic focus ofthe general curriculum, high school curricular options must also includecommunity-based work experience, vocational education, dropoutprevention and re-entry programs, independent living skills programs, TechPrep programs, and service learning opportunities.
Challenge 2: Make High School Graduation Decisions Based on Meaningful Indicators ofStudents’ Learning and Skills and Clarify the Implications of Different Diploma Optionsfor Students with Disabilities
Requirements that States set for graduation can range from Carnegie unitrequirements (a certain number of course credits earned in specific areas),successfully passing a competency test, high school exit exams, or a series ofbenchmark exams (Thurlow, Ysseldyke, & Anderson, 1995). States may also requirea combination of these. Diversity in graduation requirements is complicated furtherby an increasingly diverse set of possible diploma options within individual States. Inaddition to the standard high school diploma, some States offer special educationdiplomas, certificates of completion, occupational diplomas, and others. Many Stateshave implemented multiple strategies to improve the passing rates of students withdisabilities on State exit exams and in meeting other requirements for graduation.Strategies have included grade-level retention; providing special instruction duringthe school day, after school, on weekends, and during the summer; and supportingteachers in using a variety of instructional strategies.
State and local educational agencies also need to examine the implications ofdeveloping and granting alternative diploma options for students with disabilities.

Challenges To Providing Secondary Education and Transition Servicesfor Youth with Disabilities
I-23
The question here is whether receiving less than a standard high school diploma maylimit a student’s access to future postsecondary education and employmentopportunities. Currently, most States offer and grant alternative diplomas in additionto the standard high school diploma (Guy et al., 1999). State and local educationalagencies need to thoroughly discuss the “meaning” and “rigor” of these alternativediplomas with, at a minimum, postsecondary education program representatives andemployers. Consensus must be reached on their use for postsecondary educationadmissions and in making hiring decisions.
Challenge 3: Ensure Students Access to and Full Participation in PostsecondaryEducation, Employment, and Independent Living Opportunities
Young adults with disabilities still face significant difficulties in securing jobs,accessing postsecondary education, living independently, and fully participating intheir communities. With the passage of recent Federal legislation (Americans withDisabilities Act, P.L. 101-336; and the IDEA Amendments of 1997; P.L. 105-17) hascome an expanding social awareness of accessibility and disability issues surroundingyouth with disabilities seeking access to postsecondary education, life-long learning,and employment (Benz, Doren, & Yovanoff, 1998; Horn & Berktold, 1999).
The National Center for the Study of Postsecondary Educational Supports(NCSPES), a Rehabilitation, Research and Training Center funded by the NationalInstitute on Disability and Rehabilitation Research, U.S. Department of Education,at the University of Hawaii at Manoa, has conducted an extensive program ofresearch focused upon the access, participation, and success of youth with disabilitiesin postsecondary education and subsequent employment. Based on this research,NCSPES has framed issues concerning students with disabilities and postsecondaryeducation within the following four areas of intervention:
(1) Include opportunities for students to understand themselves and theirdisability in relation to needed services and supports, with a focus onadvocating for those needs in different postschool educational andemployment settings (NCSPES, 2000a);
(2) Develop effective models of assistance and support that are personallyresponsive, flexible, and individualized, as well as coordinated withinstruction and integrated with the overall life support needs of the student(NCSPES, 2000b; Stodden & Dowrick, 2000a);
(3) Coordinate and manage postsecondary education supports and services withthose provided by other community service agencies (health, mental health,human services, transportation, others) required by many students with
23rd Annual Report to Congress
I-24
disabilities to successfully participate in and complete their postsecondaryeducation programs (NCSPES, 2000a; Stodden & Dowrick, 2000b); and
(4) Ensure that the educational supports required by students during theirpostsecondary education program experiences transfer to eventualemployment settings (NCSPES, 2000a; Thomas, 2000).
Another pressing societal challenge concerns the overall unemployment rate amongadults with disabilities in the United States. Although employment has improvedsomewhat over the past 14-year period for people who say they are able to work,employment is still an area with the widest gulf between all people with disabilitiesand the rest of the population. Currently, only 32 percent of persons with disabilities,ages 18-64, work full- or part-time, compared to 81 percent of the nondisabledpopulationa 49 percent gap (National Organization on Disabilities, 2000). Furtherresults from this study also note that employment prospects for 18- to 29-year-oldsare the most promising. Among this cohort, 50 percent of those with disabilities whoare able to work are working, compared to 72 percent of their nondisabledcounterparts.
It is well understood that preparation for the transition from high school topostsecondary education, employment, and independent living must begin early, orat least by age 14. It is at this age that students’ IEP teams must engage indiscussions regarding the types of coursework students will need, to the extentappropriate for each individual student, to be able to enroll in postsecondaryeducation programs; the types of learning options and experiences students will needto develop basic work skills for employment; and the skills students will need forindependent living.
Specific types and levels of accommodations and supports a student will need toovercome barriers to participation in these postschool environments must also beidentified. President Bush’s New Freedom Initiative is intended to help Americans withdisabilities by increasing their access to assistive and universally designedtechnologies that remove barriers to participation in postsecondary education,employment, and community life. Increased access to assistive technologies, fundingfor low-interest loan programs to purchase these technologies, and bettercoordination among agencies in prioritizing the immediate needs of young adultswith disabilities for assistive technology needs in communities nationwide are part ofthis initiative.
Prior to the student’s graduation from high school, it is the responsibility of thestudent’s IEP team to identify and engage the responsible agencies, resources, andaccommodations required for the student to successfully achieve positive adult lifeoutcomes. State vocational rehabilitation programs have, for example, served as a

Challenges To Providing Secondary Education and Transition Servicesfor Youth with Disabilities
I-25
major resource in the preparation of some transition-age youth for employment. Arecent longitudinal study of State vocational rehabilitation programs reported thattransition-age youth currently represent 13.5 percent of all vocational rehabilitationclients, or approximately 135,391 persons nationally (Hayward & Schmidt-Davis,2000). This study also reported that receipt of specific vocational rehabilitationservices, including education or training services, physical or mental restorationservices, and diagnostic or evaluation services, were strongly associated withachieving a positive employment outcome and to entering competitive employment.Overall, nearly two-thirds (63 percent) of transition-age youth who were vocationalrehabilitation clients achieved an employment outcome as a result of the servicesthey received (Hayward & Schmidt-Davis, 2000). Prior to a student’s graduationfrom high school, all agencies responsible need to:
• Ensure that community service agency participation systematicallyoccurs in the development of postschool transition plans. Strategiessuch as formalizing agency responsibilities through interagency agreementsor memorandums of understanding and formalizing follow-up proceduresand actions when agencies are unable to attend should be considered.
• Engage in integrated service planning. The IEP should be coordinatedwith the individualized service plans required under other Federal and Stateprograms (including Title I of the Rehabilitation Act of 1973, Title XIX ofthe Social Security Act [Medicaid], Title XVI of the Social Security Act[Supplemental Security Income (SSI)], and other Federal programs).
• Provide information to parents and students on essential health andincome maintenance programs. Information on the SSI program,including information on basic program eligibility, 18-year-old benefitredeterminations, appeals processes, and use of the SSI work incentives inpromoting employment outcomes must be readily accessible to professionals,parents, and students with disabilities.
• Promote collaborative employer engagement. Increased secondary andpostsecondary work-based learning opportunities, and ultimately jobs, arepredicated on available and willing employers. Vehicles are needed that buildon existing cooperative education programs in high schools, such asintermediary linking entities, that convene and connect schools, serviceagencies, and employers so as to maximize the important learning adjunctsthat workplaces represent.
• Establish partnerships with workforce development entities. Theparticipation of youth and young adults with disabilities, family members, andspecial education and rehabilitation professionals in State and local workforcedevelopment initiatives should be promoted. This is critically important toensure that initiatives such as the Workforce Investment Act’s youth

23rd Annual Report to Congress
I-26
employment programs are fully accessible to individuals with disabilities asthey pursue postsecondary education and employment opportunities.
Challenge 4: Support Student and Family Participation
The importance of student participation has been reinforced by emerging practices inpublic schools emphasizing the core values of self-determination, personal choice,and shared responsibility. OSEP has played a major role in advancing a wide range ofself-determination strategies through sponsored research and demonstrationprojects. A recent national study that surveyed local special education directors andsupervisors found that the majority (82 percent) of students over the age of 14 withdisabilities frequently or almost always participate in their IEP meetings (Johnson &Sharpe, 2000). This study, however, did not address the question of how wellprepared these young people are to participate in and ultimately lead discussionsconcerning their school and postschool goals.
Parent participation in IEP meetings has been required since the inception of IDEAin 1975. A large part of the discussion in the literature centers around the role ofparents as participants in the development of their child’s IEP. The IDEAAmendments of 1990 and the 1997 amendments have also required that State andlocal educational agencies notify parents and encourage their participation when thepurpose of the meeting is the consideration of transition services. While existingpolicies have strongly encouraged parent participation, it is less clear how successfulthese strategies have been in creating meaningful and valued roles for parents.Because of the critical role that parents play in assisting their children in making thetransition from school to adult life, additional attention must be given to establishingstrategies and methods needed to actively engage them in discussions and decisionsconcerning school and postschool options. Special attention is being given toincreased funding for effective training and outreach strategies for parents fromdiverse multicultural backgrounds and those living in poverty. To improve studentand parent participation, there is a need to:
• Support students in the development of decisionmaking,communication, and self-advocacy skills necessary to assume aleadership role in their transition/IEP meetings. Strategies may includeoffering classes specifically designed to enhance decision making, efforts topromote self-determination and goal setting throughout the curriculum, andsending information home to assist parents in preparing their child forparticipation. Students’ goals for self-determination must also be clearlystated within IEPs.

Challenges To Providing Secondary Education and Transition Servicesfor Youth with Disabilities
I-27
• Ensure that parents and students have the information they need toparticipate in the IEP and transition planning process. Parents also needinformation on the juvenile justice system, appropriate strategies andprograms for serving youth with emotional and behavioral disabilities,information on community service programs and their availability, and manyother issues.
Challenge 5: Improve Collaboration and System Linkages at All Levels
The effective use of interagency collaboration and cooperation to address transitionneeds of youths with disabilities has been difficult to achieve due to widely varyingfactors, including: (1) lack of shared information on students across agencies, makingit virtually impossible to develop integrated service plans that support individuals inachieving school and postschool results (Johnson et al., 2000); (2) lack of follow-updata on program recipients that could be used to improve service effectiveness(Johnson, McGrew, Bloomberg, Bruininks, & Lin, 1997; Stodden & Boone, 1987);(3) lack of adequate attention in IEPs to health insurance, transportation, and otheraspects of adult living; (4) lack of systematic transition planning with those agenciesthat would assume responsibility for postschool service needs (Hasazi et al., 1999;Johnson & Sharpe, 2000); (5) ineffectual interagency agreements (Guy & Schriner,1997); (6) difficulties in anticipating needed postschool services; and (7) inefficientand ineffective management practices for establishing interagency teams (Johnson etal., 1987). Despite these problems, interagency collaboration and coordination ofservices must continue as a major strategy in addressing the needs of youths withdisabilities.
A wide range of collaborative approaches and models has been part of the ongoingeffort to improve transition services and postschool outcomes for youth withdisabilities and families for more than two decades. OSEP’s State and LocalImplementation of IDEA (SLIIDEA) study (2001) identified strategies by States toimprove the coordination of services. The study found, for example, that States haverelied extensively on the development of interagency agreements to provide servicesthat support students with disabilities as they transition from school to adult life. Thestudy found that 89 percent of the States have written agreements with vocationalrehabilitation, 56 percent with mental health agencies, and 51 percent with agenciesresponsible for employment and training (U.S. Department of Education, 2001).States have also funded transition coordinators whose primary responsibility isassisting districts to help students transition from school to postsecondary education,employment, and community living. Currently, 46 States report employing one ormore transition coordinators (U.S. Department of Education, 2001). To improvecollaboration at all levels, there is a need to:
23rd Annual Report to Congress
I-28
• Promote regular education and special education collaboration. Thiswould include collaborative models of instruction, student assessment, andIEP and transition planning between regular education and special educationto promote positive school outcomes.
• Promote collaborative staff development programs. A variety ofmultidisciplinary and interdisciplinary approaches such as cross-training,train-the-trainer, team-building, and others involving collaborativerelationships between State and local agencies, school-district personnel,institutions of higher education, parent centers, and consumer and advocacyorganizations must be promoted.
• Establish cross-agency evaluation and accountability systems. Thiswould include evaluations of school and postschool employment,independent living, and related outcomes of former special educationstudents.
• Develop innovative interagency financing strategies. Fiscal disincentivesshould be removed and waiver options provided to promote cost-sharingand resource-pooling among agencies in making available needed transitionservices and supports for students with disabilities.

Challenges To Providing Secondary Education and Transition Servicesfor Youth with Disabilities
I-29
References
Benz, M., Doren, B., & Yovanoff, P. (1998). Crossing the great divide: Predictingproductive engagement for young women with disabilities. Career Developmentfor Exceptional Individuals, 62, 3-16.
Boudah, D.H., Schumaker, J.B., & Deshler, D.D. (1997). Collaborative instruction: Isit an effective option for inclusion in secondary classrooms? LearningDisability Quarterly, 20, 293-316.
Carnine, D. (1995). A handbook for site councils to use to improve teaching andlearning. Effective School Practices, 14, 17-34.
Elliott, J.L., & Thurlow, M.L. (2000). Improving test performance of students with disabilitiesin state and district assessments. Thousand Oaks, CA: Corwin Press.
Guy, B., & Schriner, K. (1997). Systems in transition: Are we there yet? CareerDevelopment for Exceptional Individuals, 20, 141-164.
Guy, B., Shin, H., Lee, S.Y., & Thurlow, M.L. (1999). State graduation requirements forstudents with and without disabilities (Technical Report 24). Minneapolis, MN:University of Minnesota, National Center on Educational Outcomes.
Hasazi, S.B., Furney, K.S., & DeStefano, L. (1999). Implementing the IDEAtransition mandates. Exceptional Children, 65, 555-566.
Hayward, B., & Schmidt-Davis, H. (2000 July). A longitudinal study of the vocationalrehabilitation service program. Rehabilitation Services Administration, U.S.Department of Education, Fourth Interim Report: Characteristics andoutcomes of transitional youth in vocational rehabilitation. Washington, DC:Research Triangle Institute.
Horn, R., & Berktold, J. (1999). Students with disabilities in postsecondary education: Aprofile of preparation, participation, and outcomes. National Center on EducationStatistics, U.S. Department of Education, Statistical Analysis Report No. 199-187. Washington, DC: U.S. Government Printing Office.
Johnson, D.R., & Sharpe, M.N. (2000). Results of a national survey on theimplementation of transition service requirements of IDEA. Journal of SpecialEducation Leadership, 13, 15-26.
Johnson, D.R., Sharpe, M., & Stodden, R. (2000). The transition to postsecondaryeducation for students with disabilities. IMPACT, 13, 26-27. Minneapolis,MN: Institute on Community Integration, University of Minnesota.

23rd Annual Report to Congress
I-30
Johnson, D.R., McGrew, K.S., Bloomberg, L., Bruininks, R.H., & Lin, H.C. (1997).Results of a national follow-up study of young adults with severe disabilities.Journal of Vocational Rehabilitation, 8, 119-133.
Jorgensen, C. (July 1997). Curriculum and its impact on inclusion and the achievement ofstudents with disabilities. Issue Brief 2(2). Pittsburgh, PA: Allegheny Universityof the Health Sciences, Consortium on Inclusive School Practices.
Kameenui, E., & Carnine, D. (Eds.) (1994). Educational tasks for diverse learners.Columbus OH: Merrill Publishing.
Knight, J. (1998). Do schools have learning disabilities? Focus on Exceptional Children,30, 1-14.
Lenz, B.K., & Scanlon, D. (1998). SMARTER Teaching: Developingaccommodations to reduce cognitive barriers to learning for individuals withlearning disabilities. Perspectives, 24, 16-19.
National Council on Disability. (2000). Back to school on civil rights. Washington DC:Author.
National Organization on Disabilities. (2000). 2000 N.O.D./Harris survey of Americanswith disabilities. Washington, DC: Louis Harris & Associates.
NCSPES. (2000a). Technical report: Postsecondary education and employment for students withdisabilities: Focus group discussions on supports and barriers to lifelong learning.National Center for the Study of Postsecondary Educational Supports,Honolulu, Hawaii: University of Hawaii at Manoa.
NCSPES. (2000b). Technical report: National survey of educational support provision to studentswith disabilities in postsecondary education settings. National Center for the Study ofPostsecondary Educational Supports, Honolulu, Hawaii: University ofHawaii at Manoa.
Orkis, R., & McLane, K. (1998). A curriculum every student can use: Design principles forstudent access. Reston, VA: ERIC/OSEP Special Project, Council forExceptional Children.
Policy Information Clearinghouse. (1997). Students with disabilities and high schoolgraduation policies. Policy Update 5 (6). Alexandria, VA: National Associationof State Boards of Education.
Rose, D., & Meyer, A. (1996). Expanding the literacy toolbox (Literacy Research Paper11). New York: Scholastic.

Challenges To Providing Secondary Education and Transition Servicesfor Youth with Disabilities
I-31
Stodden, R.A., & Boone, R. (1987). Assessing transition services for handicappedyouth: A cooperative interagency approach. Exceptional Children, 53, 537-545.
Stodden, R.A., & Dowrick, P. (2000a) The present and future of postsecondaryeducation for adults with disabilities. IMPACT, 13, 4-5. Minneapolis, MN:Institute on Community Integration, University of Minnesota.
Stodden, R.A., & Dowrick, P.W. (2000b). Postsecondary education and employmentof adults with disabilities. American Rehabilitation, 24, 23-24.
Thomas, K. (2000, June 22). Disabled youths seek power over education. USAToday, p. 10.D.
Thurlow, M.L., Elliott, J.L., & Ysseldyke, J.E. (1998). Testing students with disabilities:Practical strategies for complying with district and state requirements. Thousand Oaks,CA: Corwin Press.
Thurlow, M.L., House, A., Boys, C., Scott, D., & Ysseldyke, J.E. (2000). 1999 stateassessment policies for students with disabilities: Participation and accommodations.Minneapolis, MN: University of Minnesota, National Center on EducationalOutcomes.
Thurlow, M., Ysseldyke, J., & Anderson, A. (1995). High school graduation requirements:What’s happening for students with disabilities? Minneapolis, MN: University ofMinnesota, National Center on Educational Outcomes.
Tralli, R., Colombo, B., Deshler, D.D., & Schumaker, J.B. (1999). The strategicintervention model: A model for supported inclusion at the secondary level.In S. Graham, K.R. Harris, & M. Pressley (Series Eds.) & D.D. Deshler, J.Schumaker, K.R. Harris, & S. Graham (Vol. Eds.) Advances in teaching andlearning: Vol. 2 Teaching every adolescent every day: Learning in diverse middle & highschool classrooms (pp. 250-280). Cambridge, MA: Brookline Books.
U.S. Department of Education. (1999). FY 2000 budget report: Office of Special Educationand Rehabilitation Services [On-line], Appendix Table 2g. Available:http://www.ed.gov/offices/OUS/Budget00/BudgetSumm/apndx-2g.html
U.S. Department of Education. (2001). State and local implementation of IDEA.Washington, DC: Abt Associates.
Warren, S. (April 1997). Building school-based capacity to sustain change in special educationpractices. Paper presented at the annual meeting of the American EducationResearch Association, San Diego, CA.
I-33
Outcomes for Students with Problem Behaviors inSchool: Issues, Predictors, and Practices
he purpose of this module is to review issues, practices, progress, and challengesregarding problem behaviors. Although the module addresses behavior issues
across all disability groups, as well as children without disabilities, the researchfoundation regarding behavior issues stems largely from the work with students withemotional and behavioral disorders. The module begins with a review of what weknow about this population and the academic and life outcomes for students withsome of the most challenging problem behaviorsthose whose behavior interfereswith their ability to learn or to maintain satisfactory relationships or is disruptive tothe learning environment. These difficulties may be termed academic and socialfailure.
Students who exhibit behavior disorders in school continue to be one of the mostproblematic issues for both teachers and administrators (Furlong, Morrison, & Dear,1994). As a consequence of their behaviors, these students spend less time engagedin instruction and often disrupt the learning environment for both themselves andtheir peers. The prognosis for success in school and in life for these students isfrighteningly poor. This prognosis creates the need to develop effective and efficientprevention and intervention practices. Unfortunately, while inclusion is a goal forthese students, research indicates that simply placing them in regular educationenvironments with appropriate peer models is not sufficient to facilitate academic orbehavioral success (Gable, McLaughlin, Sindelar, & Kilgore, 1993). For many ofthese students, placement in the regular education environment without appropriatesupports may lead to more academic and social failure than does placement in morerestrictive settings (Friedman, Cancelli, & Yoshida, 1988; Rich & Ross, 1989).
This module looks at trends and outcomes among students with problem behaviors,focusing on the school’s role. A review of the research will lead to a discussion of thepredictors of students who exhibit problem behaviors in school. Although thesestudents often come to school predisposed to failure, a comprehensive analysis ofthese predictors is key to developing effective school-based prevention strategies.Finally, the module presents a brief summary of effective prevention practices.
Students with Problem Behavior: Outcomes
This section presents a review of student outcomes in regard to problem behaviors.Throughout the 1997 reauthorization of the Individuals with Disabilities Education
T

23rd Annual Report to Congress
I-34
Act (IDEA), discussions on behavior and discipline were constant and somewhatcontentious. Through these debates, it became obvious that there was a lack of thedata that are needed to make informed decisions. Several data collection efforts arecurrently in place to provide information on behavioral issues, including nationalstudies on the implementation of the behavior-related provisions of IDEA and State-reported data on suspensions and expulsions.
School Outcomes
In 1998-99, OSEP began collecting data from States on children with disabilitieswho were removed from their educational placement for disciplinary reasons. Thesedata were required as part of a comprehensive effort to address discipline issues inthe 1997 reauthorization of IDEA. States reported the number of children withdisabilities who were (1) unilaterally removed to interim alternative education settingsfollowing drug or weapon offenses, (2) removed based on hearing officerdeterminations regarding likely injury to themselves or others, or (3) suspended/expelled for more than 10 days in a school year. States also reported on the actsprecipitating these removals. Data were reported by race/ethnicity and by disabilitycategory. In 1999-2000, OSEP funded a study of issues associated with the validityof the State-reported discipline data and found many threats to the validity of thedata. As a result, OSEP has initiated revisions to the collection.
In order to provide a more complete understanding of the importance of addressingproblem behaviors early and comprehensively, the following sections of the modulereview the literature to provide a synthesis of current views on typical outcomes forstudents with problem behaviors.3
Academic and Social Failure
While academic failures are directly related to curricular expectations, social failuresinvolve a lack of success in meeting expectations for interacting in a schoolenvironment. Academic and social failures are reciprocally and inextricably related(Kauffman, 2001; Maguin & Loeber, 1996). The most obvious connection is seen instudents with difficult behaviors who often suffer from associated academic deficits.However, the connection is equally sound in the opposite direction in that academicdeficits are among the most powerful predictors of social failures and problembehaviors (Maguin & Loeber, 1996; Morrison & D’Incau 1997; Rylance, 1997; Wu,Pink, Crain, & Moles, 1982). In some sense, there appears to be evidence ofcharacteristics of what might be termed “social learning disabilities” in many of these 3 The module does not include State-reported discipline data, which are available in Appendix A of
this report.

Outcomes for Students with Problem Behaviors in School:Issues, Predictors, and Practices
I-35
students. These students tend to have few friends and significantly impaired abilitiesto relate to peers (Kauffman, 2001). Regardless of the reasons, Marcus (1996) reportsthat delinquent adolescents’ friendships are characterized by greater conflict, poorerattachment quality, lesser ability to repair relationships, cognitive distortions, andpoorer social-cognitive problem solving.
Life-Long Challenges
The longer academic or social failure persists for these students, the less likely it isthat they will be successful in their educational experiences or in their lives followingseparation from school (Walker, Colvin, & Ramsey, 1995). About 50 percent ofstudents identified under IDEA as having emotional and behavioral disorders dropout of school (Wagner, Newman, D’Amico, Jay, Butler-Nalin, & Marder, 1991).Once they leave school, these students lack the social skills necessary to besuccessfully employed; they consequently suffer from low employment levels (Bullis,Nishioka-Evans, Fredricks, & Davis, 1993; Carson, Sitlington, & Frank, 1995) andpoor work histories (Bullis & Gaylord-Ross, 1991). Over the course of their lives,students with emotional and behavioral disorders typically hold multiple short-termjobs rather than long-term employment (Wagner, D’Amico, Marder, Newman, &Blackorby, 1992) and, consequently, earn less than students from any other disabilitycategory (Frank & Sitlington, 1997).
The poor prognosis for students with academic and social failures, regardless ofwhether they have been served under IDEA, extends beyond employment. Within 3years of leaving school, 70 percent of these students will be arrested (Jay & Padilla,1987), continuing a pattern of failure that becomes extremely difficult to correct. Ifthere is one characteristic that separates juvenile offenders from any other child whoexhibits problematic behavior, it is perhaps the extraordinarily poor prognosis ofsuccessful rehabilitation, particularly for those who have been incarcerated (Scott,Nelson, Liaupsin, Jolivette, Christle, & Riney, in press). Continuing life problemsinclude involvement with social services and the corrections system (Duncan,Forness, & Hartsough, 1995) and drug abuse (Wagner, Blackorby, Cameto, &Newman, 1993). These outcomes represent only a partial list of identified negativeoutcomes that are associated with students whose behavior problems result inacademic and social failure.
Students with Problem Behavior: Predictable Failure
When we can predict the academic and social failures of students with behaviorproblems, we then have much of the information necessary to prevent more seriousacademic and social problems from developing over time. However, unraveling the

23rd Annual Report to Congress
I-36
complex array of home, community, and school factors associated with any studentquickly becomes too unwieldy a task to undertake on a large scale. But research hasidentified significant predictors of which students with behavior problems willexperience academic and social failure. The purpose of prediction is not to place orremove blame; it is helpful only if it assists in alleviating the problem. Prediction hastwo clear benefits. First, we must understand the reasons for failure if we are toeffectively develop prevention and intervention strategies that are likely to providethese students with their best chances for success. Second, we must determine howto best use our existing resources and where additional resources will be needed tocreate successful programs. Regardless of the nature or source of identifiedpredictors, this review maintains a focus on the school’s role in creating andfacilitating environments that predict success for students predisposed to or currentlyexhibiting academic and social failure.
Poverty and Predictable Early Academic Deficits
The single greatest predictor of academic and social failure in America’s schools ispoverty (Illinois State Board of Education, 2001; Rylance, 1997). Multiple regressionanalyses of statewide data in Illinois and Kentucky demonstrate that approximately70 percent of the variance in standardized achievement scores can be accounted forby nothing more than income level (Illinois State Board of Education, 2001; Nelson,Scott, Liaupsin, Christle, & Riney, 2001). Further analysis in Illinois reveals that thecumulative effects of multiple other variables do not significantly add to thepredictability of student success or failure (see table I-6).
There is strong evidence regarding the issues associated with poverty that tend topredict student failure. Students from a background of poverty typically come toschool with significantly less exposure to print materials (Adams, 1988) and with lessvocabulary and less practice at following complex sets of directions (Hart & Risley,1995). These students then experience academic and social failures from the first dayof school and at a higher rate than their peers (Coleman & Vaughn, 2000). Thesefailures begin a pattern within which students experience more negative interactionand punishment while at the same time receiving less academic time with teachers.This becomes a vicious circle as students escalate problem behaviors in order toavoid aversive classroom experiences; the result is more punishment and eventualexclusion. This is an especially tragic pattern in light of the fact that there is ampleevidence to suggest that increased academic engaged time and effective instructionalpractices can promote both academic and social success with these students (Nelson,Johnson, & Marchand-Martella, 1996; Scott, Nelson, & Liaupsin, in press; Tarver &Jung, 1995).

Outcomes for Students with Problem Behaviors in School:Issues, Predictors, and Practices
I-37
Table I-6Percentage of Successful Predictions for ITBS Scores Below the Mean in
Illinois
PredictorsSuccessfulPrediction
Poverty rate 71 percent
Poverty rate + mobility rate 73 percent
Poverty rate + mobility rate, attendance rate, race, teacher race, and highest teacherdegree-masters
77 percent
Poverty rate + mobility rate, attendance rate, limited English proficiency rate, averageteacher salary, average teacher experience, truancy rate, race, teacher race, funding perpupil, school enrollment, average class size, highest teacher degree-bachelors, andhighest teacher degree-masters
78 percent
Source: Adapted from table presented on the Illinois State Board of Education web site.
Research indicates that there are no easy answers for low-income students with ahistory of early academic and social failure. Simply providing effective instruction inkey deficit areas is a necessity, although it is apparently insufficient to facilitatecontinuing success (Hart & Risley, 1995). Students with problem behaviors requireeffective instruction, supportive/encouraging environments, and continuousfeedback on an ongoing basis. That is, preventative support cannot be delivered via a“hit and run” model. Instead, support for students with these challenges must beincorporated into the system and follow students throughout their school career. Thelonger a student goes without support, at any level, the less likely it is that the studentwill experience success. Thus, research indicates that there is little room for error inpromoting success with all childrenbut especially those who are at-risk foracademic and social failure.
Practices Affecting Student Outcomes
The following practices have been successful in both preventing student failures andin providing effective supports for intervening with students who are alreadyexperiencing failure. These practices can be characterized in three stages: (1) primarypreventioncreating school environments that minimize conditions that predictfailure and provide effective instruction and prompting for success across allstudents; (2) secondary preventionidentifying students exhibiting initial failuresdespite primary prevention efforts and providing them with more individualizedstrategies to prevent failures from progressing; and (3) tertiary preventionidentifying students with the most chronic and pervasive academic and social failuresand providing intensive and collaborative school/community-based strategies to

23rd Annual Report to Congress
I-38
prevent these failures from resulting in school drop-out and the negative lifeoutcomes typically associated with it (i.e., incarceration, social welfare involvement,drug abuse, etc.).
Positive Behavioral Support
Systems of positive behavioral support provide schools with a framework withinwhich to predict student failures and to create strategies and expectations across allpersonnel in an effort to prevent failures. Such practices have been successful indecreasing a variety of student failures, thereby facilitating increased student successrates (Lewis & Sugai, 1999; Scott, 2001; Sugai, Sprague, Horner, & Walker, 2000). Tobe successful, positive behavioral supports must be implemented as a system whereinall personnel take equal responsibility for planning, implementation, and evaluationof student progress (Scott & Nelson, 1999a; Jolivette, Barton-Arwood, & Scott,2000).
Positive behavioral support is a schoolwide approach to adopting and sustaining theuse of effective practices to prevention designed to enhance the capacity of schoolsto educate all students, especially students with problem behaviors resulting inacademic and social failure (Sugai et al., 2000). For students with problem behavior,positive behavioral supports help to prevent many of the predictable behaviorproblems that typically begin a pattern of escalating academic and social failures. Thisapproach has been advocated in the 2000 Report of the Surgeon General’s Conference onChildren’s Mental Health as a cost-effective method of prevention. This reportrecommends that positive behavior support emphasize “primary prevention methodsthat recognize the unique differences of all children and youth, but should includeselective individual student supports for those who have more intense and long-termneeds” (p.7).
For students with problem behavior, positive behavioral supports help to preventmany of the predictable behavior problems that typically begin a pattern of escalatingproblems. However, regardless of the fidelity and implementation of schoolwidesupport systems, many students with problem behaviors will continue to exhibitbehavior problems and experience academic and social failure. These students willrequire more intensive and individualized interventions (Sugai & Horner, 1999).Sugai and Horner (1999) suggest that, within a system of support, the level andintensity of support are dictated by the level and complexity of the behaviorproblem. Efficiency is then realized by preventing problems across all students sothat more intensive needs may be identified earlier and more resources may beapplied in developing individualized interventions.
Outcomes for Students with Problem Behaviors in School:Issues, Predictors, and Practices
I-39
Because students with problem behaviors often experience a high degree ofacademic and social failure in their lives, effective schools provide multipleopportunities for success and facilitate success by communicating high expectations,providing effective instruction, and developing environments that encourage,prompt, and acknowledge success. Students with a background of failure are easilydiscouraged and must be set up to succeed on a frequent and predictable basis (Scottet al., in press).
Effective Instruction and Collaborative Practices
Meta-analyses of over 800 studies have examined effective practice for students withproblem behaviors (Gottfredson & Gottfredson, 1996; Lipsky, 1991). The largesteffects were found for social skills instruction, behaviorally based interventions (i.e.,encouragement and consistent responses to positive and negative behavior), andacademic instruction. What these three practices have in common is that they arebased on the delivery of effective instruction. For both academic and socialproblems, meta-analyses have identified practices in which instruction includes clearexpectations and how to meet them, encouragement and facilitation of success, andconsistent acknowledgment/feedback for both positive and negative behavior.
As previously discussed, students with problem behaviors require effectiveinstruction that engages them in learning and facilitates frequent success. Evidenceclearly indicates that academic success is associated with a decrease in problembehavior and involvement with the judicial system (Gottfredson & Gottfredson,1996; Lipsky, 1991; Maguin & Loeber, 1996). However, while effective instructionhas historically been conceived of as mainly an academic issue, students withproblem behaviors require effective instruction across the curriculum and intostudents’ extracurricular lives. In the social realm, research indicates a need forprograms that include social skills, peer mediation and conflict resolution, andtransition planning (Jolivette, Stichter, Nelson, Scott, & Liaupsin, 2000; Peck, Sasso,& Jolivette, 1997).
Effective interventions will likely require schools to look beyond their traditional rolewith these students. For example, Neel, Meadows, Levine, and Edgar (1988)described vocational training as the means for identifying, teaching, and reinforcingappropriate and specific job skills within a variety of work environments. Thisdefinition implies collaboration between the school and community in developingcoordinated experiences and expectations. The array of problems faced by manystudents requires interventions that are beyond the scope of the school. Althoughintervention plans may be initiated by the school, the plans themselves and effectiveimplementation of them will require a collaborative effort between the school,family, and community.

23rd Annual Report to Congress
I-40
Wraparound Planning
One positive trend for students with behavior problems has been the move towardintegrated and collaborative assessment and intervention. Wraparound planningtypically has been conceptualized as a family- and student-centered, multidisciplinaryplanning process specifically designed for students whose history of problembehaviors warrants the most intensive interventions. However, wraparound planninghas also been applied for students with more mild behavioral problems and as earlyintervention for students identified as at-risk for emotional and behavioral disabilities(Eber, Smith, Sugai, & Scott, 2001; Eber, 1999). Wraparound planning involves allstakeholders, including parents, school personnel, the student, and a variety ofassociated professionals from the community (e.g., vocational counselors, physicaltherapists, mental health, and medical professionals). Services commonly used byindividuals with emotional and behavioral disabilities include counseling; financialcounseling; job training, mentoring, and coaching; and health services (Karp, 1996).
School Responses
A survey conducted during the 1996-97 school year found that more than 75 percentof all schools reported having zero tolerance policies for various student offenses(U.S. Departments of Education and Justice, 1999). In addition, there has been anincrease in the presence of law enforcement officers and metal detectors in publicschools (U.S. Departments of Education and Justice, 1999). However, evidencesuggests that such measures have been ineffective, or even counterproductive, inpreventing school violence (Hyman & Perone, 1998; Mayer & Leone, 1999). Schoolscontinue to exclude students with problem behaviors as a first-level response, oftenwithout implementing active instructional strategies for future problem prevention.
Functional Behavioral Assessment
The 1997 amendments to the Individuals with Disabilities Education Act (IDEA)mandate the development of behavior intervention plans based on functionalbehavioral assessment for those students with disabilities who exhibit behaviors thatconstitute a pattern of misbehavior or require a change in placement (P.L. No. 105-17, §615(k)(1)(B)(i)). Functional behavior assessment has been defined as “a processfor gathering information that can be used to maximize the effectiveness andefficiency of behavioral support” (O’Neill et al., 1997, p. 3). Simply, functionalbehavior assessment is a systematic method of assessing the purpose or “function”of a student’s behavior in relation to its context (i.e., surrounding environment) sothat appropriate interventions can be designed to meet the unique needs of

Outcomes for Students with Problem Behaviors in School:Issues, Predictors, and Practices
I-41
Table I-7Steps for Conducting a Functional Behavioral Assessment and
Implementing a Behavioral Intervention Plan
Steps Procedures
Step 1: Define the Problem Behavior Create a concrete definition of the problem behaviorand the conditions under which it typically occurs.
Step 2: Gather Information RegardingEnvironment and Behavior
Use interviews, questionnaires, record reviews, anddirect observations to determine what environmentalevents tend to precede and follow behavior.
Step 3: Hypothesize Function of Behavior Use collected information to hypothesize the functionor purpose the behavior serves for the student.
Step 4: Develop a Behavioral InterventionPlan
Determine and teach an appropriate behavior thatserves the same function for the student. Arrange theenvironment to prompt desired behavior and developplans for providing consequences for both desired andundesired behavior.
Step 5: Monitor Behavior To VerifyHypothesis and Validate Intervention
When monitoring indicates that the intervention issuccessful, the functional behavioral assessment iscompleted. When intervention is unsuccessful, return toStep 2 and continue gathering data toward a more validhypothesis.
individual students. The great benefit of functional assessment is the ability to assistin developing proactive (i.e., preventative), positive, and individualized behaviorintervention plans for students with challenging behaviors. The basic steps forconducting a functional behavior assessment and implementing a behavioralintervention plan are presented in table I-7. The mandating of functional behaviorassessment has resulted in the need to train large numbers of personnel in theprocess of creating behavior intervention plans based on the function of studentproblem behavior. However, the structure and cost of traditional professionaldevelopment models make such large-scale training efforts difficult (Scott & Nelson,1999b; Sailor et al., 2000).
Traditionally, students with problem behaviors have been placed in exclusionaryenvironments (i.e., resource room, self-contained room, non-school placement). Asmore students identified with behavioral disabilities are being included in the generalenvironment, questions have arisen regarding the appropriateness of traditionalmethods of functional behavioral assessment. Recent literature, however, providessupport for the efficacy of functional behavioral assessment for most problemstudents in public school classrooms (Ellingson, Miltenberger, Stricker, Galensky, &Garlinghouse, 2000; Heckaman, Conroy, Fox, & Chait, 2000).

23rd Annual Report to Congress
I-42
Examples of systems and procedures for conducting functional behavioralassessment and implementing behavioral intervention plans in public schools haveincreasingly demonstrated positive outcomes for students with problem behavior(e.g., Scott, DeSimone, Fowler, & Webb, 2000; Sugai, Lewis-Palmer, & Hagan,1998). These student successes have been facilitated by functional behavioralassessment processes that involve collaborative decisionmaking and planning acrossa range of professionals and stakeholders (Eber, Smith, Sugai, & Scott, 2001;Jolivette, Barton-Arwood, & Scott, 2000). To bring systems together in creatingeffective and efficient plans, the functional behavioral assessment must be a part oftypical systemic procedures for assessing problem behaviors at any level (Sugai,Horner, & Sprague, 1999). In a 1998 research synthesis funded by OSEP, behavioralintervention plans that were based on a prior functional behavioral assessment weremore likely to result in positive behavior change.
This level of cooperation among a diverse group of professionals represents afundamental change in the ownership of problem studentsa shift from the expertmodel to the collaborative model. Such systemic changes are difficult for schools toundertake, regardless of the topic or students involved. When focusing on such agroup of students whose behaviors are seen as among the most problematic issuesfacing school personnel, the challenge of changing systems becomes ever larger(Scott, Nelson, & Zabala, in press). Still, current evidence suggests that suchprocesses and collaborative systems are related to positive student outcomes.
Summary
Students with problem behaviors present challenges to schools; in turn, schools tendto react in ways that often set the context for further problem behaviors andeventual school exclusion. Such students typically experience poor social andacademic outcomes in school, leading to poor employment outcomes, involvementwith the social services system, and incarceration. Research on school achievementpoints to poverty as the leading predictor of both academic and social failure.Students from a background of poverty are less prepared to enter school on bothacademic and social grounds and typically experience failure very early in life.
Practices that increase positive outcomes for students with problem behaviors arethose such as social skills instruction, behaviorally based interventions, and academicinstruction that provide systems-level support calculated to prevent predictablefailures. Individualized interventions based on functional behavioral assessment andinvolving a range of stakeholders from both the school and community have beenfound to increase positive outcomes for these students. Although not implementedon a large scale, interventions and collaborative ownership of problem behaviors thatare evidenced in the positive behavioral support model and the functional behavioral
Outcomes for Students with Problem Behaviors in School:Issues, Predictors, and Practices
I-43
assessment and wraparound procedures that have been implemented systematicallygive reason for optimism. In general, this trend would seem to be a turning point inthe effort to prevent student failure. The components of a successful model areknown and well-validated. The question of success will revolve around the ability ofsystems to adopt and share the responsibilities for change.

23rd Annual Report to Congress
I-44
References
Adams, M.J. (1988). Beginning to read: Thinking and learning about print. Cambridge: MITPress.
Bullis, M., & Gaylord-Ross, R. (1991). Transitions for youth with behavioraldisorders. In L. Bullock & R.B. Rutherford Jr. (Eds.). CEC mini-library:Working with behavioral disorders. Reston, VA: Council for ExceptionalChildren.
Bullis, M., Nishioka-Evans, V., Fredricks, H.D., & Davis, C. (1993). Identifying andassessing the job-related social skills of adolescents and young adults withemotional and behavioral disorders. Journal of Emotional and BehavioralDisorders, 1, 236-250.
Carson, R.R., Sitlington, P.L., & Frank, A.R. (1995). Young adulthood for individualswith behavioral disorders: What does it hold? Behavioral Disorders, 20, 127-135.
Coleman, M., & Vaughn, S. (2000). Reading interventions for students withemotional/behavioral disorders. Behavioral Disorders, 25, 93-105.
Duncan, B., Forness, S.R., & Hartsough, C. (1995). Students identified as seriouslyemotionally disturbed in day treatment: Cognitive, psychiatric, and specialeducation characteristics. Behavioral Disorders, 20, 238-252.
Eber, L., Smith, C., Sugai, G., & Scott, T.M. (2001). Blending process and practice tomaximize outcomes: Wraparound and positive behavioral interventions andsupports in the schools. Journal of Emotional and Behavioral Disorders.
Eber, L. (1999). Family voice, teacher voice: Finding common ground through thewraparound process. Claiming children. Alexandria, VA: The Federation ofFamilies for Children’s Mental Health.
Ellingson, S.A., Miltenberger, R.G., Stricker, J., Galensky, T.L., & Garlinghouse, M.(2000). Functional assessment and intervention for challenging behaviors inthe classroom by regular classroom teachers. Journal of Positive BehaviorInterventions, 2, 85-97.
Frank, A.R., & Sitlington, P.L. (1997). Young adults with behavioral disorders -before and after IDEA. Behavioral Disorders, 23, 40-56.
Friedman, D., Cancelli, A., & Yoshida, R. (1988). Academic engagement ofelementary school children with learning disabilities. The Journal of SchoolPsychology, 26, 327-340.

Outcomes for Students with Problem Behaviors in School:Issues, Predictors, and Practices
I-45
Furlong, M.J., Morrison, G.M., & Dear, J.D. (1994). Addressing school violence aspart of schools’ educational mission. Preventing School Failure, 38, 10-17.
Gable, R.A., McLaughlin, V.L., Sindelar, P., & Kilgore, K. (1993). Unifying generaland special education teacher preparation: Some cautions along the road toeducational reform. Preventing School Failure, 37, 5-10.
Gottfredson, G.D., & Gottfredson, D.C. (1996). A national study of delinquencyprevention in schools: Rationale for a study to describe the extensiveness andimplementation of programs to prevent adolescent problem behavior in schools. EllicottCity, MD: Gottfredson Associates, Inc.
Hart, B., & Risley, T. (1995). Meaningful differences in the everyday experiences of youngAmerican children. Baltimore, MD: Paul H. Brookes.
Heckaman, K., Conroy, M., Fox, J., & Chait, A. (2000). Functional assessment basedintervention research on students with or at risk for emotional andbehavioral disorders in school settings. Behavioral Disorders, 25, 196-210.
Hyman, I.A., & Perone, D.C. (1998). The other side of school violence: Educatorpolicies and practices that may contribute to student misbehavior. Journal ofSchool Psychology, 36, 7-27.
Illinois State Board of Education (2001). Predicting the school percentage of ISAT scores thatare below state standards [On-line]. Available:http://www.isbe.net/designation/indicators.htm
Jay, D.E., & Padilla, C.L. (1987). Special education dropouts. Menlo Park, CA: SRIInternational.
Jolivette, K., Barton-Arwood, S., & Scott, T.M. (2000). Functional behavioralassessment as a collaborative process among professionals. Education andTreatment of Children, 23, 298-313.
Jolivette, K., Stichter, P., Nelson, C.M., Scott, T.M., & Liaupsin, C.J. (2000). Improvingpost-school outcomes for students with emotional and behavioral disorders. (ERIC ECDigest E597). Reston, VA: Council for Exceptional Children.
Karp, N. (1996). Individualized wrap-around services for children with emotional,behavior, and mental disorders. In G.H. Singer, L.E. Powers, & A.L. Olson(Eds.). Redefining family support (pp. 291-310). Baltimore, MD: Paul H.Brookes.
Kauffman, J.M. (2001). Characteristics of emotional and behavioral disorders of children andyouth (7th ed.). Columbus, OH: Merrill.
23rd Annual Report to Congress
I-46
Lewis, T.J., & Sugai, G. (1999). Effective behavior support: A systems approach toproactive school-wide management. Focus on Exceptional Children, 31, 1-24.
Lipsky, M.W. (1991). The effect of treatment of juvenile delinquents: Results frommeta-analysis. In F. Losel, D. Bender, & T. Bliesener (Eds.), Psychology and law.New York: Walter deGruyter.
Maguin, E., & Loeber, R. (1996). Academic performance and delinquency. In M.Tonry (Ed.), Crime and justice: A review of research (vol. 20, pp. 145-264).Chicago: University of Chicago Press.
Marcus, R.F. (1996). The friendships of delinquents. Adolescence, 31, 145-159.
Mayer, M., & Leone, P. (1999). A structural analysis of school violence anddisruption: Implications for creating safer schools. Education and Treatment ofChildren, 22, 333-356.
Morrison, G.M., & D’Incau, B. (1997). The web of zero-tolerance: Characteristics ofstudents who are recommended for expulsion from school. Education andTreatment of Children, 20, 316-335.
Neel, R.S., Meadows, N., Levine, P., & Edgar, E.B. (1988). What happens afterspecial education: A statewide follow-up study of secondary students whohave behavioral disorders. Behavioral Disorders, 13, 209-216.
Nelson, C.M., Scott, T.M., Liaupsin, C.J., Christle, C., & Riney, M. (2001). Multipleregression of factors predicting Kentucky CTBS data. Unpublished data. Lexington,KY: University of Kentucky.
Nelson, J.R., Johnson, A., & Marchand-Martella, N. (1996). A comparative analysisof the effects of direct instruction, cooperative learning, and independentlearning practices on the disruptive behaviors of students with behaviordisorders. Journal of Emotional and Behavioral Disorders, 4, 53-63.
O’Neill, R.E., Horner, R.H., Albin, R.W., Sprague, J.R., Storey, D., & Newton, J.S.(1997). Functional assessment and program development for problem behavior: Apractical handbook (2nd ed.) Pacific Grove, CA: Brooks/Cole.
Peck, J., Sasso, G.M., & Jolivette, K. (1997). Use of the structural analysis hypothesistesting model to improve social interactions via peer mediated intervention.Focus on Autism and Other Developmental Disabilities, 12, 219-230.
Rich, H., & Ross, S. (1989). Students’ time on learning tasks in special education.Exceptional Children, 55, 508-515.
Outcomes for Students with Problem Behaviors in School:Issues, Predictors, and Practices
I-47
Rylance, B.J. (1997). Predictors of high school graduation or dropping out for youthswith severe emotional disturbances. Behavior Disorders, 23, 5-17.
Sailor, W., Smith, C., Freeman, R., Britten, J., McCart, A., Scott, T.M., & Nelson,C.M. (2000). Using information technology to prepare personnel toimplement functional behavior assessment and positive behavioral support.Exceptionality, 8, 217-230.
Scott, T.M. (2001). Positive behavioral support: A school-wide example. Journal ofPositive Behavioral Interventions, 3, 88-94.
Scott, T.M., DeSimone, C., Fowler, W., & Webb, E. (2000). Functional behavioralassessment-based interventions with problem behaviors in the classroom:Three case studies. Preventing School Failure, 44, 51-56.
Scott, T.M., & Nelson, C.M. (1999a). Universal school discipline strategies:Facilitating learning environments. Effective School Practices, 17, 54-64.
Scott, T.M., & Nelson, C.M. (1999b). Functional behavioral assessment: Implicationsfor training and staff development. Behavioral Disorders, 24, 249-252.
Scott, T.M., Nelson, C.M., & Liaupsin, C. (in press). Effective instruction as school-wide positive behavioral support: Facilitating success across all students.Education and Treatment of Children.
Scott, T.M., Nelson, C.M., Liaupsin, C., Jolivette, K., Christle, C., & Riney, M. (inpress). Positive behavioral support and the education of juvenile offenders:Effective prevention practices. Journal of Emotional and Behavioral Disorders.
Scott, T.M., Nelson, C.M., & Zabala, J. (in press). Functional behavior assessmenttraining in public schools: Facilitating systemic change. School Psychology Review.
Sugai, G.M., & Horner, R.H. (1999). Discipline and behavioral support: Preferredprocesses and practices. Effective School Practices, 17, 10-22.
Sugai, G.M., Horner, R.H., & Sprague, J.R. (1999). Functional assessment-basedbehavior support planning: Research-to-practice-to-research. BehavioralDisorders, 24, 223-227.
Sugai, G., Lewis-Palmer, T., & Hagan, S. (1998). Using functional assessments todevelop behavior support plans. Preventing School Failure, 43, 6-13.
Sugai, G., Sprague, J.R., Horner, R., & Walker, H.M. (2000). Preventing schoolviolence: The use of office discipline referrals to assess and monitor school-wide discipline interventions. Journal of Emotional and Behavioral Disorders, 8, 94-101.

23rd Annual Report to Congress
I-48
Tarver, S.C., & Jung, J.S. (1995). A comparison of mathematics achievement andmathematics attitudes of first and second graders instructed with either adiscovery-learning mathematics curriculum or a direct instruction curriculum.Effective School Practices, 14, 49-57.
U.S. Departments of Education and Justice (1999). Indicators of school crime and safety,1999. (NCES 19989-057/NCJ-178906). Washington, DC: Author.
Wagner, M., Newman, L., D’Amico, R., Jay, E.D., Butler-Nalin, P., & Marder, C.,(Eds.). (1991). Youth with disabilities: How are they doing? The firstcomprehensive report from the National Longitudinal Transition Study of SpecialEducation Students. Menlo Park, CA: SRI International.
Wagner, M., D’Amico, R., Marder, C., Newman, L., & Blackorby, J. (1992). Whathappens next? Trends in postschool outcomes of youth with disabilities. Thesecond comprehensive report from the National Longitudinal Transition Study of SpecialEducation Students. Menlo Park, CA: SRI International.
Wagner, M., Blackorby, J., Cameto, R., & Newman, L. (1993). What makes a difference?Influences in school outcomes of youth with disabilities. Menlo Park, CA: SRIInternational.
Walker, H.M., Colvin, G., & Ramsey, E. (1995). Antisocial behavior in school: Strategiesand best practices. Pacific Grove, CA: Brooks/Cole.
Wu, S.C., Pink, W.T., Crain, R.L., & Moles, O. (1982). Student suspension: A criticalreappraisal. The Urban Review, 14, 245-303.

I-49
Results Experienced by Children and FamiliesEntering Early Intervention
he emphasis in education and other social programs has recently shifted from afocus on documenting what was provided to describing what was achieved. For
infants and toddlers with special needs, the desired results of intervention servicesare challenging to conceptualize. Acquisition of school-age skills such as reading andmathematics skills are clearly not appropriate outcomes for this age group. Similarly,broad goals of community participation or membership in groups have limitedapplicability to children under 3 years of age. What then are the desired results ofearly intervention services?
A priority addressed by the National Early Intervention Longitudinal Study (NEILS)is to examine the outcomes experienced by children and families in earlyintervention. Some of the purposes of Part C deal specifically with child and familyoutcomes and provide guidance as to the results expected from early intervention.Part C was enacted in part because of the “urgent and substantial need:
(1) to enhance the development of infants and toddlers with disabilities and tominimize their potential for developmental delay;
(2) to reduce the educational costs to our society, including our Nation’s schools,by minimizing the need for special education and related services wheninfants and toddlers with disabilities reach school age;
(3) to minimize the likelihood of institutionalization of individuals withdisabilities and maximize the potential for their independently living insociety;
(4) to enhance the capacity of families to meet the special needs of their infantsand toddlers with disabilities” (§631(a)).
Drawing upon the stated purpose of the legislation, the conceptual framework forNEILS identified three distinct outcome areas that the study would assess: (1) short-term outcomes for children (enhancing development), (2) long-term outcomes forchildren (minimizing the need for future services, minimizing the likelihood ofinstitutionalization), and (3) outcomes for families (enhancing the capacity offamilies). These three outcome areas are discussed in greater depth in the pages thatfollow.
T
23rd Annual Report to Congress
I-50
NEILS is a longitudinal study following children from four birth years. Thesechildren received their first early intervention service between September 1997 andNovember 1998. The oldest children in the sample started kindergarten in 2000-01and thus exited early intervention in 1998. The youngest will exit the earlyintervention service system in mid-2001 and will probably begin kindergarten in2003-04. Because of the age distribution in the sample, it will be another year beforeshort-term child outcomes are completely analyzed and a little longer before the firstset of long-term child outcomes is ready for dissemination. The framework forlooking at child outcomes is presented along with some preliminary data on thechildren’s status at program entry.
Short-Term Outcomes for Children
Short-term outcomes refer to those that occur after a limited period of time in earlyintervention. NEILS is interviewing families annually until the child’s third birthday.The short-term outcome areas being tracked are physical health; developmentalmilestone attainments in motor, communication, cognition, and independence; socialskills and relationships with peers and adults; behavior and engagement; participationor interaction with typically developing peers; and the need for ongoing services.
The data presented in this report are baseline data against which short-term outcomedata will be compared at subsequent time points. Many of the findings on status atentry to early intervention were already presented elsewhere in this report in thesection on characteristics of children and families in early intervention. The data onphysical health indicated that although many parents of children entering earlyintervention reported their child’s health to be very good or excellent, theseproportions were substantially smaller than those reported for the general childpopulation under 5 (61 percent vs. 82 percent). Behavioral data suggested that morethan half (56 percent) of the children entering early intervention had no troubleplaying with other children, and 39 percent were not at all aggressive with otherchildren. In this section, we will focus on the attainment of developmentalmilestones by describing the developmental status of children when they beginservices.
Attaining age-appropriate developmental competencies is an important outcome forall infants and toddlers. It is significant for children under 3 because it facilitatesinteraction with the environment, which forms the foundation of individual childdevelopment. The developmental accomplishments of infancy and toddlerhood arealso important because they lay the groundwork for the next level of developmentalskills children must master as they move through the preschool years and then enterelementary school. For example, communication and mobility are importantdevelopmental tasks for young children. Acquiring beginning communication skills
Results Experienced by Children and Families Entering Early Intervention
I-51
allows the child to more effectively communicate his or her needs. Similarly,becoming mobile provides access to a much broader range of environments andobjects to explore and enjoy. On the other hand, the child without adequatecommunication skills is limited in his or her ability to interact with caregivers andothers in his or her social world and is possibly frustrated by this limitation. A childwho is not mobile is restricted to where he or she is placed and reliant on whatothers bring for the child to explore.
NEILS examined developmental attainments by asking parents to report on a set ofchild behavior and skills in several domains. For each item, the parent was to reportwhether the child “does it well,” “does it but not well,” or “doesn’t do it at all.” Thespecific milestones were selected because they were assumed to have face validity asmarkers of developmental attainment, to be universal in expression with minimalcultural/socioeconomic bias, and to be observable in everyday activities.
The status of children upon entry into early intervention on a select set of themilestones is shown in table I-8. The nationally representative data are grouped bydomain and reported separately for children who were less than 12 months of age atthe time of the first interview, between 12 and 24 months of age, and older than 24months of age. In interpreting these data, it is important to remember that the threeage groups of entry into early intervention reflect three fundamentally differentgroups of children with regard to the nature of their disability or delay. (Seediscussion of characteristics of children entering early intervention in Chapter II.)Children who began early intervention and whose families were interviewed whenthe child was less than 12 months of age are not just younger than the other two agegroups. Children who begin early intervention at less than 12 months of age aremuch more likely to have a diagnosed condition or a risk condition such as low birthweight. Children older than 12 months, especially those older than 24 months, aremuch more likely to have a communication-related disability or delay.
The findings for children who were less than 12 months old at the time of theinterview show that very few of the children in this group have mastered sitting,crawling, or walking. To some extent, this might be expected because the age rangeincludes children as young as several weeks old.
Within the group of children whose families were interviewed when they werebetween 12 and 24 months, some have mastered the motor milestones. For example,41 percent were reported as able to walk well. Nearly all children in the generalpopulation can walk by 17 months of age. Many of the youngest children in thismiddle age group entering early intervention would not therefore be expected towalk yet. Overall, the data on the motor milestones are consistent with other NEILS

23rd Annual Report to Congress
I-52
Table I-8Milestone Attainment in Different Domains by Age Group at Entry to Early
Intervention Services
Percentage of Children Reported AbleTo Do Milestone Well
Age at First Interview
<12Months
12 to 24Months
24 to 32Months
MotorGrasp objects and let go of them (10) 52 NA NACrawl, scoot, or creep (11) 17 NA NASit up (11) 15 NA NAPick up small objects with finger and thumb (12) 18 75 87Hold a crayon or pencil (16) 2 41 72Walk without holding on (17) 0 54 90Walk quickly or run (25) NA 42 81Take paper off candy to unwrap (25) NA 17 50
CommunicationBabbles (3) 64 NA NASays “mama” or “dada” (12) 13 58 77Responds to simple gestures like someone waving
“bye-bye” (17) 19 70 88Repeats or imitates a word (18) 4 22 30Follows a 2-step verbal direction (24) NA 37 65Says 2 or 3 words in a sentence (25) NA 5 17
Self-HelpEats bite size pieces with fingers (11) 11 NA NALifts a cup and drinks from it (18) 5 65 88Takes off socks without help (23) NA 65 78Washes and dries hands thoroughly (28) NA NA 36
CognitionLooks for object out of sight (7) 26 NA NALaughs in response to peek-a-boo (8) 49 NA NAExplores objects by shaking and banging (11) 39 NA NAPuts things into and takes them out of things (12) 5 NA NADoes simple pretending in play like feeding a doll (18) 1 29 64Shows that knows two body parts (28) NA 40 77Refers to things as “mine” (30) NA 21 51Gives his or her first name (35) NA 6 14
Note: The number in parenthesis after the milestone is the age in months by which almost allchildren in the general population (approximately 90 percent) have attained this milestone.Some milestones are too advanced or too young for some age groups and were “not asked”(NA) for these children.
Source: National Early Intervention Longitudinal Study.
Results Experienced by Children and Families Entering Early Intervention
I-53
data showing motor difficulties are less often a reason for early intervention servicesamong this middle age group compared to the younger population.
The predominance of communication difficulties among children who beginreceiving early intervention after 24 months of age is strongly reflected in themilestone data. Saying “mama” is a milestone mastered by the general population ofchildren by 12 months of age. Within the group of children who began earlyintervention between 12 and 24 months of age, only 58 percent could say “mama.”Similarly, almost all children in the general population can follow a two-stepdirection by 24 months. Only 37 percent of children who were between 12 and 24months when the interview was conducted could do this well. These children wererelatively more proficient in the area of self-help, but still only 65 percent could use acup to drink or take off their socks. Both of these are usually mastered by 24months.
The children who were the oldest when they began to receive early interventionservices, those who were between 24 and 32 months at the time of the interview,were somewhat skilled in the motor and self-help areas. Even in these areas, somechildren were having difficulties in areas typically mastered by much youngerchildren. Only 90 percent were reported as able to walk well, and only 81 percentcould run quickly. Only half could take the wrapper off a piece of candy, somethingthat nearly all children can do by 25 months. Most could use a cup and take off theirsocks.
The oldest children, those who began early intervention services after 24 months,have mastered milestones in the motor, self-help, and cognitive areas with oneexception. Almost all children can pick up small things by 12 months of age, so eventhough only 13 percent of the oldest group of children beginning early interventionwere not able to do this task well, these children are a year or more behind inacquiring this skill.
A different picture is presented by the communication milestones. Among this oldestgroup of early intervention entrants, the percentage who could say “mama,” a 12-month milestone, was only 77 percent. A task that almost all children can do by 18months is repeating a word. Among children who began early intervention between24 and 32 months of age, however, only 30 percent were reported by their caregiversas able to do this. All of the communication milestones show this oldest group ashaving difficulty in this area at the time they began to receive early interventionservices.

23rd Annual Report to Congress
I-54
These data describe the children at entry to early intervention. The more interestingquestion is how children will change over time with regard to short-termdevelopmental outcomes. Future analyses from NEILS will examine the attainmentof developmental milestones as children receive services over time and as they getolder.
Long-Term Outcomes for Children
Long-term outcomes from early intervention are those that occur after the child hasleft early intervention services. An important long-term outcome is prevention offuture delays and disabilities. The meaning of “prevention” varies for different kindsof children. It is important to understand that the population of children beingserved in early intervention programs is extremely heterogeneous with regard to thenature of their delay, disability, or risk condition. A baby born at 975 grams withmultiple physical problems presents a very different set of needs from a healthy 26-month-old with a delay in communication skills. Both of these children, as well aschildren with many other different conditions and needs, can be eligible for earlyintervention services. These variations among children have direct implications forwhat early intervention is trying or can reasonably be expected to enhance orprevent.
In NEILS, several different long-term outcomes for former recipients of earlyintervention are being examined, including the need for future services, physicalhealth, developmental attainments, academic skills, memberships in groups such asbeing a member of a sports team, and interpersonal relationships such as friendships.The need for future services is being examined at 36 months (what proportion ofchildren are referred for special education upon exiting early intervention?) and atkindergarten (what proportion are receiving special education in kindergarten?).Changes in physical health and developmental attainments are also being assessed at36 months and at kindergarten. The academic skills of reading and mathematics areassessed only at kindergarten, as is membership in groups. Relationships orfriendships are assessed at 36 months and at kindergarten.
Family Outcomes
Early intervention is a program designed for both children and families. Family-centered practices are mandated as an integral part of early intervention services andare expected to permeate all aspects of service delivery (Bailey, Buysse, Edmondson,& Smith, 1992). To address the need for an approach that could be applied inevaluating family outcomes across many families and programs, Bailey et al. (1998)proposed a general framework for assessing family outcomes. The frameworkidentifies two general types of family outcomes and corresponding questions that

Results Experienced by Children and Families Entering Early Intervention
I-55
reflect current values and the outcomes early intervention could be expected toaffect. The two general categories of outcomes are the family’s perception of theirearly intervention experience and the impact of services on the family. Thisframework was used to develop the family outcome measures in NEILS. TheNEILS data presented here refer only to the family’s initial perception of the earlyintervention experience. All families were interviewed within 4 months of beginningearly intervention; the majority were interviewed within 2 months. Additional data onthe impact on the family will be forthcoming as information at later time pointsbecomes available.
NEILS examined a number of issues related to the families’ perceptions about theirentry into early intervention, as well as satisfaction with initial services. These data areshown in table I-9. The great majority of families had little difficulty finding outabout early intervention services or getting the services started. The findings withregard to the individualized family service plan (IFSP) are somewhat surprising inthat one in five families was not aware of the existence of a written plan. Presumablythey had participated in such a process 1 to 2 months prior to being interviewed. Thediagnosis of a disability and the subsequent entry into a new service system can be anoverwhelming process for families, and it appears that the development of the IFSPmay have not been well explained, was forgotten, or both, for some families. It isalso possible that the development of the plan was not the family-professionalpartnership it is envisioned to be, so there was little for families to remember. Thismay be related to the substantial number of premature infants entering the systemshortly after birth.
Other aspects of the IFSP process were generally perceived as positive. Perceptionsabout who was seen as making decisions varied depending on the decision. Goalsand outcomes were overwhelmingly seen as joint decisions between families andprofessionals. The kinds of services to be provided were seen as joint decisions bytwo-thirds of the families. On the other hand, about half the families feltprofessionals mostly made the decisions on the amount of services. Most familieswere satisfied with their level of involvement in the decisionmaking.
Families were generally pleased with the quality and quantity of the early interventionservices they were receiving. Families were asked to rate their therapy services as wellas their other early intervention services with regard to both of these dimensions.They were also pleased with the number of professionals working with the child.Over 90 percent felt the help and information that had been provided to the familywas excellent or good. These ratings were offered within the first 4 months of thefamily’s experience with early intervention, but the data clearly indicate that, for mostfamilies, their initial experiences with early intervention are positive.

23rd Annual Report to Congress
I-56
Table I-9Families’ Perceptions of Entering Early Intervention, the IFSP Process,
and the Initial Services Provided
Percentage ofFamilies
Entering Early InterventionAmount of effort required to find out where to go to try to get earlyintervention services
A lot of effort 11Some effort 14Little 25No effort 50
Amount of effort to get services startedA lot of effort 9Some effort 14Little 34No effort 43
IFSP ProcessAware of a written plan that describes goals and services
Yes 82No 18
Who came up with the goals or outcomesMostly the family 7Mostly the professionals 12Family and professional together 81
Who decided on the kinds of servicesMostly the family 9Mostly the professionals 27Family and professional together 64
Who decided on the amount of servicesMostly the family 8Mostly the professionals 49Family and professional together 41
How family feels about involvement in decisionmakingWanted to be more involved 22Involved about the right amount 77Wanted to be less involved 1
Satisfaction with Initial ServicesRating of amount of therapyMore than needed 4About the right amount 76Less than needed 20
Quality of therapy servicesExcellent 60Good 32Fair 6Poor <1

Results Experienced by Children and Families Entering Early Intervention
I-57
Table I-9 (cont’d)
Percentage ofFamilies
Rating of amount of other early intervention servicesMore than needed 5About the right amount 82Less than needed 13
Quality of other early intervention servicesExcellent 52Good 45Fair 6Poor 1
Rating of number of professionals working with childToo many 2About the right number 91Not enough 7
Rating of help and information family had receivedExcellent 56Good 36Fair 7Poor 1
Note: Numbers may not sum to 100 due to rounding.
Source: National Early Intervention Longitudinal Study.
Conclusion
The information collected thus far in NEILS documents a relationship betweendevelopmental characteristics, reasons why children are eligible for services, and theage at which they enter the early intervention service system. It remains to be seenhow long-term child outcomes will relate to these findings and other child, family,and service provision characteristics.
Overall, families are satisfied with the services they are provided or offered at thetime their child enters early intervention. Continued contact with parents willdetermine if the early intervention service system is able to maintain this standard ofmeeting the needs of the families of young children with disabilities.

23rd Annual Report to Congress
I-58
References
Bailey, D.B., Buysse, V., Edmondson, R., & Smith, T.M. (1992). Creating family-centered services in early intervention: Perceptions of professionals in fourstates. Exceptional Children, 58, 298-309.
Bailey, D.B., McWilliam, R.A., Darkes, L.A., Hebbeler, K., Simeonsson, R.J., Spiker,D., & Wagner, M. (1998). Family outcomes in early intervention: Aframework for program evaluation and efficacy research. Exceptional Children,64, 313-328.
Diamond, A. (2000). Close interrelation of motor development and cognitivedevelopment of the cerebellum and prefrontal cortex. Child Development, 71,44-56.