tvg business valuation - the vant · pdf filetvg business valuation . abc company . ......
TRANSCRIPT

TVG Business Valuation
ABC Company
17766 Preston Rd Dallas, TX 75252 Tel 972.458.8989 Fax 972.458.7342
email: [email protected] website: www.thevantgroup.com
T V GThe Vant GroupMergers & Acquisitions
T V GThe Vant GroupMergers & Acquisitions
T V GThe Vant GroupMergers & Acquisitions
T V GThe Vant GroupMergers & Acquisitions
Valuation Report

Business Valuation of ABC Company
As of 12/31/13
Prepared for: Xxx xxx ABC Company
Prepared by: Alex Vantarakis The Vant Group
17766 Preston Rd Dallas, TX 75252
The information contained herein is of a confidential nature and is intended for the exclusive use of the persons or firm for whom it was prepared. Reproduction,
publication or dissemination of all or portions hereof may not be made without prior approval from The Vant Group.

Xx/xx, 2014 Xxx xxx ABC Company xxxxx St xxxxx, TX xxxxx RE: ABC Company Dear xxx: At your request, we have performed a valuation engagement, as defined in the Statement on Standards for Valuation Services (SSVS) of the American Institute of Certified Public Accountants, of 100.00% of the assets of ABC Company as of 12/31/13. This valuation was performed solely to assist in the matter of determine the current fair market value; the resulting estimate of value should not be used for any other purpose or by any other party for any purpose. This valuation engagement was conducted in accordance with the SSVS. The estimate of value that results from a valuation engagement is expressed as a conclusion of value. Based on our analysis as described within this valuation report, the estimate of value of 100.00% of the assets of ABC Company as of 12/31/13 was $600,900, as summarized below. This conclusion is subject to the Statement of Assumptions and Limiting Conditions presented in the following report and to our Representations also presented in the following report. We have no obligation to update this report or our conclusion of value for information that comes to our attention after the date of this report. Respectfully,
_____________________________________________ (Signature) xx/xx/2014 __________________________ (Date)
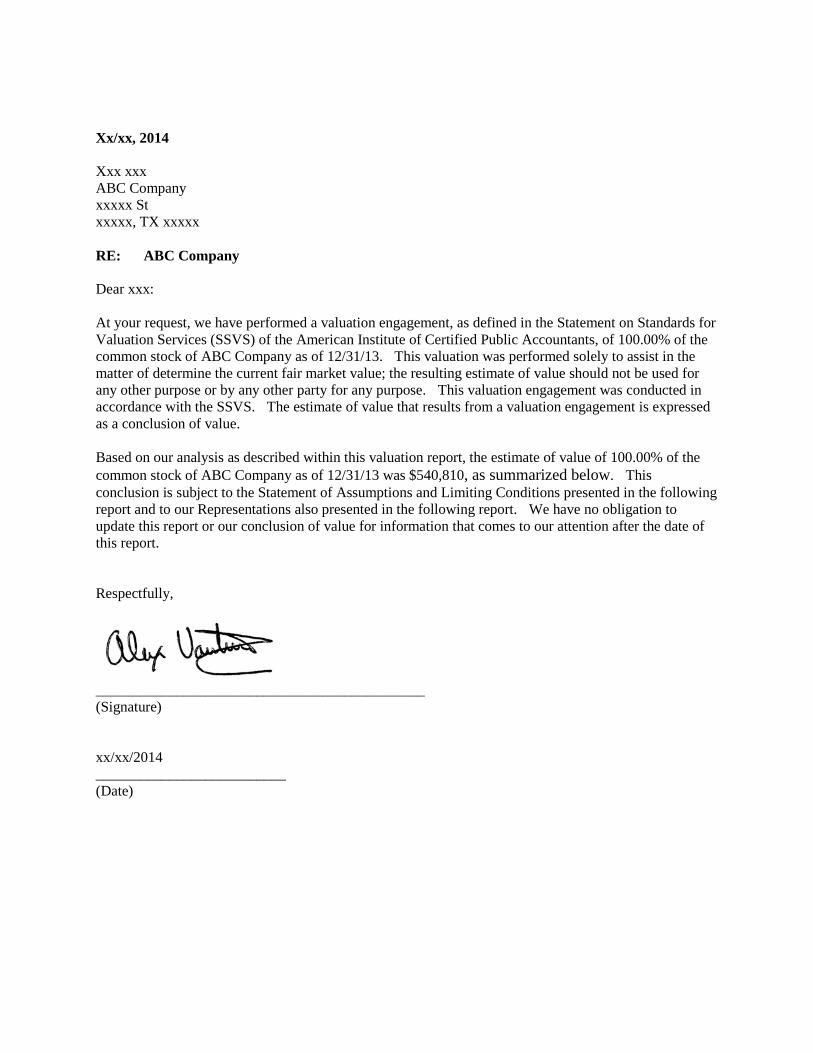
Xx/xx, 2014 Xxx xxx ABC Company xxxxx St xxxxx, TX xxxxx RE: ABC Company Dear xxx: At your request, we have performed a valuation engagement, as defined in the Statement on Standards for Valuation Services (SSVS) of the American Institute of Certified Public Accountants, of 100.00% of the common stock of ABC Company as of 12/31/13. This valuation was performed solely to assist in the matter of determine the current fair market value; the resulting estimate of value should not be used for any other purpose or by any other party for any purpose. This valuation engagement was conducted in accordance with the SSVS. The estimate of value that results from a valuation engagement is expressed as a conclusion of value. Based on our analysis as described within this valuation report, the estimate of value of 100.00% of the common stock of ABC Company as of 12/31/13 was $540,810, as summarized below. This conclusion is subject to the Statement of Assumptions and Limiting Conditions presented in the following report and to our Representations also presented in the following report. We have no obligation to update this report or our conclusion of value for information that comes to our attention after the date of this report. Respectfully,
_____________________________________________ (Signature) xx/xx/2014 __________________________ (Date)

— Table of Contents — OBJECTIVE 1
ASSUMPTIONS AND LIMITING CONDITIONS 3
COMPANY BACKGROUND 5 Company Identification 5 Nature and History of the Company 5 Stock Classes and Ownership 5 Management Team 5 Board of Directors 5 Officers 5 Product and Service Information 6 Market Data and Analysis 6 Marketing Strategy 6 Company Expectations 6
HISTORICAL AND NORMALIZED FINANCIAL STATEMENTS 7 Summary Historical Income Statements 7 Normalized Historical Income Statements 7 Summary Historical Balance Sheets 7 Normalized Historical Balance Sheets 8 Summary Historical Statements of Cash Flows 8 Normalized Earnings and Net Cash Flow Summary 8
ANALYSIS OF HISTORIC FINANCIAL STATEMENTS 9 Business Common-Size Financial Statements 9 Business Financial Ratio Analysis 10
VALUATION OF ABC COMPANY 12 Overview of Valuation Approaches and Methods 13 Net Asset Value 13 Liquidation Value 14 Capitalization of Earnings 14 Discounted Future Earnings 14
Projection Summary 15 Summary Income Statement Projections 15 Summary Balance Sheet Projections 15 Summary Retained Earnings Projections 16 Summary Cash Flow Projections 16 Summary Sources & Uses of Funds Projections 16
Comparative Company Method 16 Search for Comparatives 17 Capitalization of Excess Earnings 17 Multiple of Discretionary Earnings 18 Conclusions of Value 20
Objective Our objective was to estimate the Fair Market Value of 100.00% of ABC Company (the “Company”) as of 12/31/13. We were engaged by xxx to issue a detailed report. The Company is a S-Corporation and is organized under the laws of Texas. It is primarily engaged in the business of Wholesaler of Plastic Products and operates under the trade name of ABC Company. The standard of value used in our valuation of ABC Company is Fair Market Value. Fair Market Value is the price, in cash or equivalent, that a buyer could reasonably be expected to pay, and a seller could reasonably be expected to accept, if the business were exposed for sale on the open market for a reasonable period of time, with both buyer and seller being in possession of the pertinent facts and neither being under any compulsion to act. The purpose of this valuation is determine the current fair market value. This report is prepared for xxx and should not be used by others. This report is dated xx/xx, 2014. Our opinion of Fair Market Value relied on a “value in use” or going concern premise. This premise assumes that the Company is an ongoing business enterprise with management operating in a rational way with a goal of maximizing shareholder value. Our analysis considers those facts and circumstances present at the Company at the Valuation Date. Our opinion would most likely be different if another Valuation Date was used. There were no restrictions or limitations in the scope of our work or in the data available for analysis, and no hypothetical assumptions were used. To arrive at our conclusion of Fair Market Value, we performed the following procedures:
* Collected the Company's relevant historic financial statements. * Analyzed the historic financial statements by calculating financial ratios and common-size financial
statements for each historic year in order to identify trends. * Compared the Company's financial ratios and common-size financial statements to industry guideline
data to identify any significant variances. * Assisted management in preparing a 1 year projection of the financial statements based on management's
assumptions as to the Company's future outlook. * Developed risk-adjusted Capitalization and Discount Rates to apply to the Company's historic and
projected earnings, respectively. * Collected and analyzed transactional data from comparable companies within the same industry. * Adjusted historic earnings to eliminate the effects of excess and discretionary expenses, nonoperating
revenues and expenses, and non-transferable revenue streams. * Applied Asset, Income, Market, and Other valuation approaches to determine an estimate of Total Entity
Value. The following methods were considered under each approach:
1. Asset Approach Net Asset Value and Liquidation Value
2. Income Approach Capitalization of Earnings and Discounted Future Earnings.
3. Other Capitalization of Excess Earnings and Multiple of Discretionary Earnings
1
* Selected the most reasonable Total Entity Value from the range of values established in the valuation methods and then applied any appropriate discounts to arrive at our conclusion of the estimated Fair Market Value of the interest.
2

Assumptions and Limiting Conditions This valuation is subject to the following assumptions and limiting conditions:
1. Public, industry, statistical, and other information furnished by others, upon which all or portions of this analysis is based, is believed to be reliable. However, we make no representation as to the accuracy or completeness of such information and have performed no procedures to corroborate the information.
2. The Company and its representatives warranted to us that the information they supplied was complete and
accurate to the best of their knowledge and that the financial statement information reflects the Company's results of operations and financial and business condition in accordance with generally accepted accounting principles, unless otherwise noted. The financial statements and other related information supplied by management has been accepted as correct without further verification. We have not audited, reviewed, or compiled the financial information provided to us and, accordingly, we express no audit opinion or any other form of assurance on this information.
3. This report and conclusion of value is restricted to the internal use of the management of the Company for
the sole and specific purpose as noted herein, and shall not be used to obtain credit or for any other purpose or by any other party for any purpose. Neither our work product nor any portions thereof, including any conclusions or the identity of our firm, any individuals signing or associated with this report, or the professional associations or organizations with which they are affiliated, shall be disseminated to third parties other than the Company, its financial accounting firm and attorneys, and governmental agencies by any means without our prior written consent and approval.
4. We or any individual associated with this assignment are not required to provide future services regarding
the subject matter of this report, including but not limited to providing further consultation, providing testimony, or appearing in court or other legal proceedings unless specific arrangements have been made.
5. The conclusion of value is valid only for the stated purpose as of the valuation date indicated. We take no
responsibility for changes in market conditions and assume no obligation to revise our conclusion of value to reflect events or conditions which occur subsequent to the valuation date.
6. Full compliance by the Company with all applicable federal, state, and local zoning and use, occupancy,
environmental, and similar laws and regulations is assumed, unless otherwise stated. Furthermore, no effort has been made to determine the possible effect, if any, on the Company due to future Federal, state, or local legislation including any environmental or ecological matters or interpretations thereof, unless otherwise stated.
7. This report and the conclusion of value arrived at herein are not intended by the author and should not be
construed by the reader to be investment advice in any manner whatsoever. The conclusion of value represents the considered opinion of Alex Vantarakis based on information furnished to them by the Company and other sources.
8. We do not provide assurance on the achievability of the results forecasted by the Company because
events and circumstances frequently do not occur as expected; differences between actual and expected results may be material; and achievement of the forecasted results is dependent on actions, plans, and assumptions of management.
9. For the prospective financial information approved by management that was used in our engagement, we
have not examined or compiled the prospective financial information and therefore, do not express an
3
audit opinion or any other form of assurance on the prospective financial information or the related assumptions. Events and circumstances frequently do not occur as expected and there will usually be differences between prospective financial information and actual results, and those differences may be material.
10. We are not environmental consultants or auditors, and we take no responsibility for any actual or potential
environmental liabilities. Any person entitled to rely on this report, wishing to know whether such liabilities exist, or the scope and their effect on the value of the property, is encouraged to obtain a professional environmental assessment. We do not conduct or provide environmental assessments and have not performed one for the subject property.
11. We have not determined independently whether the Company is subject to any present or future liability
relating to environmental matters, including but not limited to CERCLA/Superfund liability, nor the scope of any such liabilities. Our valuation takes no such liabilities into account, except as they have been reported to us by the Company or by an environmental consultant working for the Company, and then only to the extent that the liability was reported to us in an actual or estimated dollar amount. Such matters, if any, are noted in the report. To the extent such information has been reported to us, we relied on it without verification and offer no warranty or representation as to its accuracy or completeness.
12. Except as noted, we have relied on the representations of the owners, management, and other third parties
concerning the value and useful condition of all equipment, real estate, and any other assets or liabilities, except as specifically stated to the contrary in this report. We have not attempted to confirm whether all assets of the business are free and clear of liens and encumbrances or that the Company has good title to all assets.
13. Neither all nor any part of the contents of this report (including the conclusion of value, the identity of
any valuation specialist(s), the firm with which such valuation specialists are connected, or any reference to any of their professional designations) should be disseminated to the public through advertising media, public relations, news media, sales media, mail, direct transmittal, or any other means of communication without our prior written consent and approval.
14. We have not made a specific compliance survey or analysis of the subject property to determine whether
it is subject to, or in compliance with, the American Disabilities Act of 1990, and this valuation does not consider the effect, if any, of noncompliance.
15. No change of any item in this valuation report shall be made by anyone other than Alex Vantarakis, and
we shall have no responsibility for any such unauthorized change.
16. We have conducted interviews with the current management of the Company concerning the past, present, and future operating results of the Company.
17. This conclusion of value assumes that the Company will continue to operate as a going concern, and that
the character and integrity of the Company through any sale, reorganization, exchange, or diminution of the owners' participation would not be materially or significantly changed. It also assumes that the current level of management expertise and effectiveness would continue to be maintained.
4

Company Background
Company Identification ABC Company is a S-Corporation organized under the laws of Texas and located at xxx xxx St, xxxx, TX, xxxxx. The Company can be categorized under the Standard Industrial Classification (SIC) Code of 326100 and North American Industry Classification System (NAICS) Code of 326100.
Nature and History of the Company Established in xxxx, the Company is primarily engaged in the business of Wholesaler of Plastic Products and operates under the trade name of ABC Company. The company was moved in July 2001 from xxx to its current location.
Stock Classes and Ownership Shareholder Amount of Shares Percentage of Ownership xxxx 2,250 21.95% xxxx 2,250 21.95% xxxx 1,915 18.69% xxxx 638 6.22% xxxx 638 6.22% xxxx 1,250 12.19% xxxx 1,309 12.19% Total 10,250 100%
Management Team
The key personal include xxxx, who performs primarily a sales function.
Board of Directors xxxxx xxxxx xxxxx
Officers xxxx – President xxxx – VP xxxx – Secretary/Treasurer
5
Product and Service Information The company distributes mounting pads, insulators, heat sinks, bushings and hardware used in the electronic industry.
Market Data and Analysis The company’s main competitors include: xxx, xxx and xxx.
Marketing Strategy
The company markets its products through phone sales and faxed in inquiries.
Company Expectations
The company believes sales will remain flat or grow marginally.
6
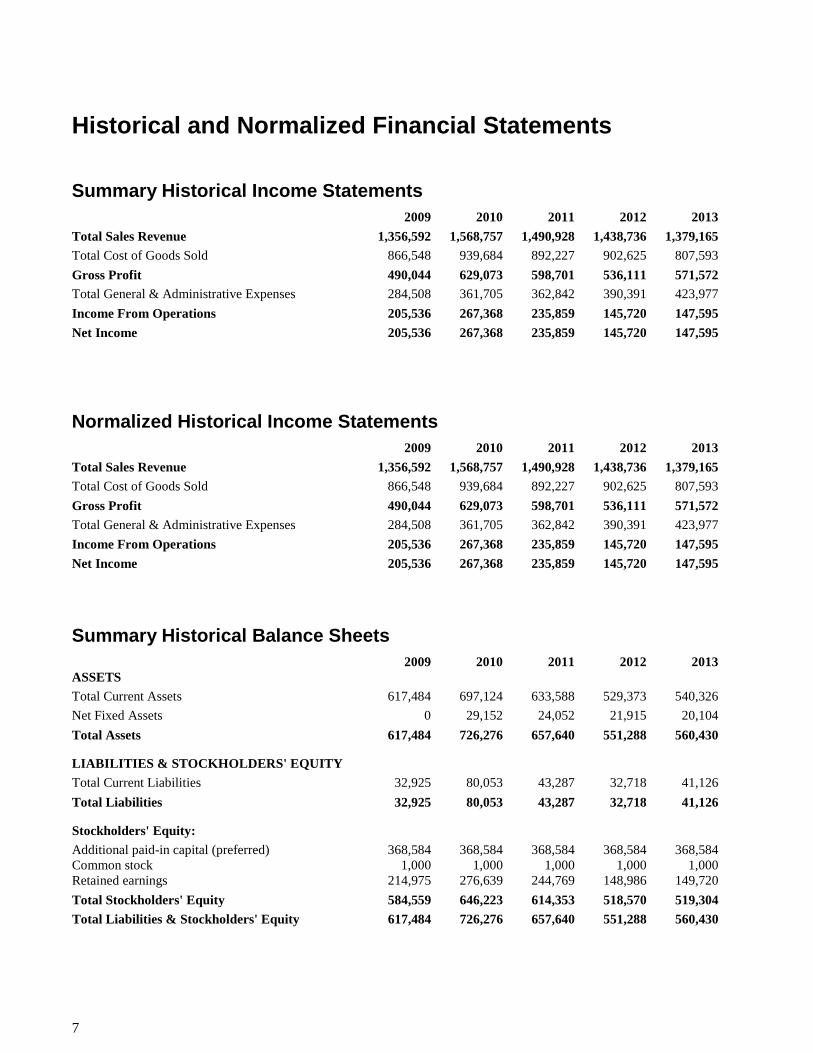
Historical and Normalized Financial Statements
Summary Historical Income Statements 2009 2010 2011 2012 2013 Total Sales Revenue 1,356,592 1,568,757 1,490,928 1,438,736 1,379,165 Total Cost of Goods Sold 866,548 939,684 892,227 902,625 807,593 Gross Profit 490,044 629,073 598,701 536,111 571,572 Total General & Administrative Expenses 284,508 361,705 362,842 390,391 423,977 Income From Operations 205,536 267,368 235,859 145,720 147,595 Net Income 205,536 267,368 235,859 145,720 147,595
Normalized Historical Income Statements 2009 2010 2011 2012 2013 Total Sales Revenue 1,356,592 1,568,757 1,490,928 1,438,736 1,379,165 Total Cost of Goods Sold 866,548 939,684 892,227 902,625 807,593 Gross Profit 490,044 629,073 598,701 536,111 571,572 Total General & Administrative Expenses 284,508 361,705 362,842 390,391 423,977 Income From Operations 205,536 267,368 235,859 145,720 147,595 Net Income 205,536 267,368 235,859 145,720 147,595
Summary Historical Balance Sheets 2009 2010 2011 2012 2013 ASSETS Total Current Assets 617,484 697,124 633,588 529,373 540,326 Net Fixed Assets 0 29,152 24,052 21,915 20,104 Total Assets 617,484 726,276 657,640 551,288 560,430
LIABILITIES & STOCKHOLDERS' EQUITY Total Current Liabilities 32,925 80,053 43,287 32,718 41,126 Total Liabilities 32,925 80,053 43,287 32,718 41,126
Stockholders' Equity: Additional paid-in capital (preferred) 368,584 368,584 368,584 368,584 368,584 Common stock 1,000 1,000 1,000 1,000 1,000 Retained earnings 214,975 276,639 244,769 148,986 149,720 Total Stockholders' Equity 584,559 646,223 614,353 518,570 519,304 Total Liabilities & Stockholders' Equity 617,484 726,276 657,640 551,288 560,430
7

Normalized Historical Balance Sheets 2009 2010 2011 2012 2013 ASSETS Total Current Assets 617,484 697,124 633,588 529,373 540,326 Net Fixed Assets 0 29,152 24,052 21,915 20,104 Total Assets 617,484 726,276 657,640 551,288 560,430
LIABILITIES & STOCKHOLDERS' EQUITY Total Current Liabilities 32,925 80,053 43,287 32,718 41,126 Total Liabilities 32,925 80,053 43,287 32,718 41,126
Stockholders' Equity: Additional paid-in capital (preferred) 368,584 368,584 368,584 368,584 368,584 Common stock 1,000 1,000 1,000 1,000 1,000 Retained earnings 214,975 276,639 244,769 148,986 149,720 Total Stockholders' Equity 584,559 646,223 614,353 518,570 519,304 Total Liabilities & Stockholders' Equity 617,484 726,276 657,640 551,288 560,430
Summary Historical Statements of Cash Flows 2010 2011 2012 2013 Net Cash Flow From Operations 314,496 199,093 135,151 156,003 Net Cash Flow From Investments (29,152) 5,100 2,137 1,811 Net Cash Flow 285,344 204,193 137,288 157,814 Cash at Beginning of Year 617,484 697,124 633,588 529,373 Cash at End of Year 902,828 901,317 770,876 687,187
Normalized Earnings and Net Cash Flow Summary 2009 2010 2011 2012 2013 Normalized Net income 205,536 267,368 235,859 145,720 147,595 Normalized EBT 205,536 267,368 235,859 145,720 147,595 Normalized EBIT 205,536 267,368 235,859 145,720 147,595 Normalized EBITDA 205,536 267,368 235,859 145,720 147,595
Historic net change in cash 285,344 204,193 137,288 157,814 Normalized Net cash flow 285,344 204,193 137,288 157,814
Historic income from operations 267,368 235,859 145,720 147,595 Normalized operating income 267,368 235,859 145,720 147,595 Less: Normalized fixed asset purchases 29,152 (5,100) (2,137) (1,811) Less: Normalized changes in net working capital ** (47,128) 36,766 10,569 (8,408) Normalized Free cash flow 285,344 204,193 137,288 157,814
Normalized Net income 267,368 235,859 145,720 147,595 Less: Normalized fixed asset purchases 29,152 (5,100) (2,137) (1,811) Less: Normalized changes in net working capital ** (47,128) 36,766 10,569 (8,408) Free Cash Flow available to Equity 285,344 204,193 137,288 157,814
8

Analysis of Historic Financial Statements
Business Common-Size Financial Statements This analysis includes a review of the Company's common-size income statement and balance sheet percentages on an unadjusted and a normalized basis. In order to portray the relative size of financial statement items for comparison over time, each line item in the common-size income statements is expressed as a percentage of total revenue and each line item in the common-size balance sheets is expressed as a percentage of total assets. A summary of the normalized common-size income statements and balance sheets is presented below. Unadjusted Business Common-Size Statements 2009 2010 2011 2012 2013 Income Data: Net sales 100.00% 100.00% 100.00% 100.00% 100.00% Gross profit 36.12% 40.10% 40.16% 37.26% 41.44% Operating expenses 20.97% 23.06% 24.34% 27.13% 30.74% Operating profit 15.15% 17.04% 15.82% 10.13% 10.70% Profit Before Tax 15.15% 17.04% 15.82% 10.13% 10.70% Assets: Cash & equivalents 100.00% 95.99% 96.34% 96.02% 96.41% Total Current Assets 100.00% 95.99% 96.34% 96.02% 96.41% Fixed assets (net) 0.00% 4.01% 3.66% 3.98% 3.59% Total Noncurrent Assets 0.00% 4.01% 3.66% 3.98% 3.59% Total Assets 100.00% 100.00% 100.00% 100.00% 100.00% Liabilities & Net Worth: Trade payables 5.33% 11.02% 6.58% 5.93% 7.34% Total Current Liabilities 5.33% 11.02% 6.58% 5.93% 7.34% Net worth 94.67% 88.98% 93.42% 94.07% 92.66% Total Liabilities & Net Worth 100.00% 100.00% 100.00% 100.00% 100.00% Normalized Business Common-Size Statements 2009 2010 2011 2012 2013 Income Data: Net sales 100.00% 100.00% 100.00% 100.00% 100.00% Gross profit 36.12% 40.10% 40.16% 37.26% 41.44% Operating expenses 20.97% 23.06% 24.34% 27.13% 30.74% Operating profit 15.15% 17.04% 15.82% 10.13% 10.70% Profit Before Tax 15.15% 17.04% 15.82% 10.13% 10.70% Assets: Cash & equivalents 100.00% 95.99% 96.34% 96.02% 96.41% Total Current Assets 100.00% 95.99% 96.34% 96.02% 96.41% Fixed assets (net) 0.00% 4.01% 3.66% 3.98% 3.59% Total Noncurrent Assets 0.00% 4.01% 3.66% 3.98% 3.59% Total Assets 100.00% 100.00% 100.00% 100.00% 100.00% Liabilities & Net Worth: Trade payables 5.33% 11.02% 6.58% 5.93% 7.34% Total Current Liabilities 5.33% 11.02% 6.58% 5.93% 7.34%
9
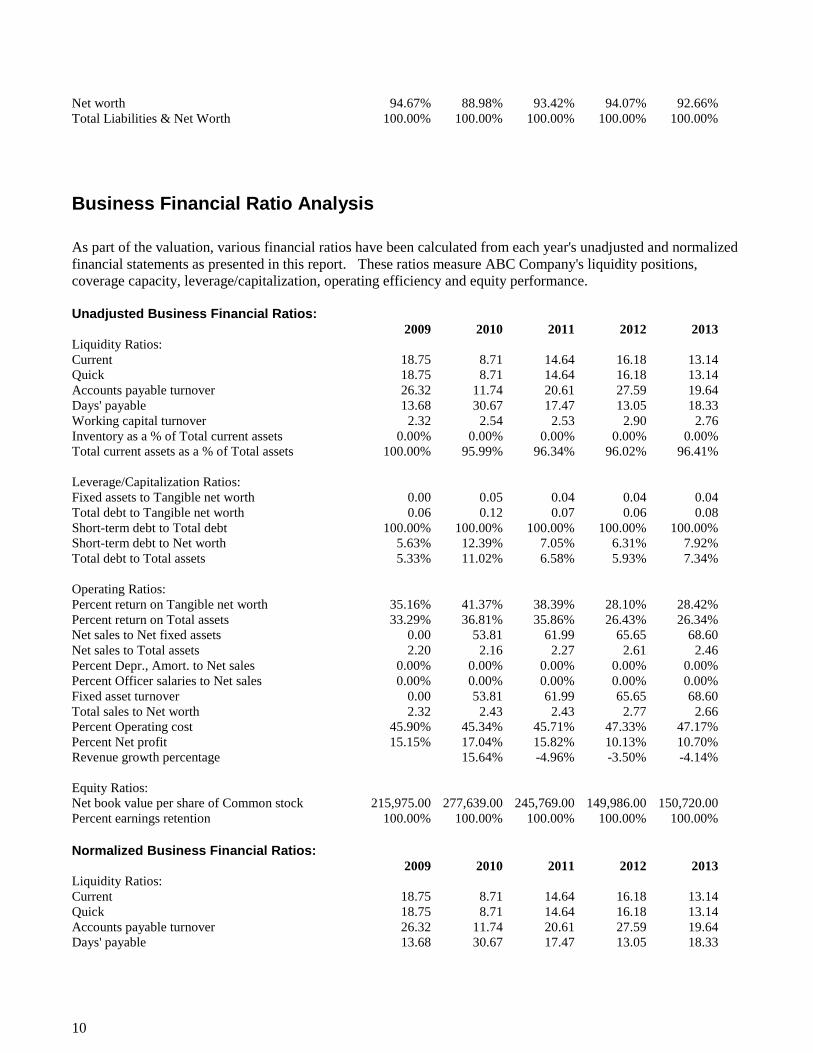
Net worth 94.67% 88.98% 93.42% 94.07% 92.66% Total Liabilities & Net Worth 100.00% 100.00% 100.00% 100.00% 100.00%
Business Financial Ratio Analysis As part of the valuation, various financial ratios have been calculated from each year's unadjusted and normalized financial statements as presented in this report. These ratios measure ABC Company's liquidity positions, coverage capacity, leverage/capitalization, operating efficiency and equity performance. Unadjusted Business Financial Ratios: 2009 2010 2011 2012 2013 Liquidity Ratios: Current 18.75 8.71 14.64 16.18 13.14 Quick 18.75 8.71 14.64 16.18 13.14 Accounts payable turnover 26.32 11.74 20.61 27.59 19.64 Days' payable 13.68 30.67 17.47 13.05 18.33 Working capital turnover 2.32 2.54 2.53 2.90 2.76 Inventory as a % of Total current assets 0.00% 0.00% 0.00% 0.00% 0.00% Total current assets as a % of Total assets 100.00% 95.99% 96.34% 96.02% 96.41% Leverage/Capitalization Ratios: Fixed assets to Tangible net worth 0.00 0.05 0.04 0.04 0.04 Total debt to Tangible net worth 0.06 0.12 0.07 0.06 0.08 Short-term debt to Total debt 100.00% 100.00% 100.00% 100.00% 100.00% Short-term debt to Net worth 5.63% 12.39% 7.05% 6.31% 7.92% Total debt to Total assets 5.33% 11.02% 6.58% 5.93% 7.34% Operating Ratios: Percent return on Tangible net worth 35.16% 41.37% 38.39% 28.10% 28.42% Percent return on Total assets 33.29% 36.81% 35.86% 26.43% 26.34% Net sales to Net fixed assets 0.00 53.81 61.99 65.65 68.60 Net sales to Total assets 2.20 2.16 2.27 2.61 2.46 Percent Depr., Amort. to Net sales 0.00% 0.00% 0.00% 0.00% 0.00% Percent Officer salaries to Net sales 0.00% 0.00% 0.00% 0.00% 0.00% Fixed asset turnover 0.00 53.81 61.99 65.65 68.60 Total sales to Net worth 2.32 2.43 2.43 2.77 2.66 Percent Operating cost 45.90% 45.34% 45.71% 47.33% 47.17% Percent Net profit 15.15% 17.04% 15.82% 10.13% 10.70% Revenue growth percentage 15.64% -4.96% -3.50% -4.14% Equity Ratios: Net book value per share of Common stock 215,975.00 277,639.00 245,769.00 149,986.00 150,720.00 Percent earnings retention 100.00% 100.00% 100.00% 100.00% 100.00% Normalized Business Financial Ratios: 2009 2010 2011 2012 2013 Liquidity Ratios: Current 18.75 8.71 14.64 16.18 13.14 Quick 18.75 8.71 14.64 16.18 13.14 Accounts payable turnover 26.32 11.74 20.61 27.59 19.64 Days' payable 13.68 30.67 17.47 13.05 18.33
10

Working capital turnover 2.32 2.54 2.53 2.90 2.76 Total current assets as a % of Total assets 100.00% 95.99% 96.34% 96.02% 96.41% Leverage/Capitalization Ratios: Fixed assets to Tangible net worth 0.00 0.05 0.04 0.04 0.04 Total debt to Tangible net worth 0.06 0.12 0.07 0.06 0.08 Short-term debt to Total debt 100.00% 100.00% 100.00% 100.00% 100.00% Short-term debt to Net worth 5.63% 12.39% 7.05% 6.31% 7.92% Total debt to Total assets 5.33% 11.02% 6.58% 5.93% 7.34% Operating Ratios: Percent return on Tangible net worth 35.16% 41.37% 38.39% 28.10% 28.42% Percent return on Total assets 33.29% 36.81% 35.86% 26.43% 26.34% Net sales to Net fixed assets 0.00 53.81 61.99 65.65 68.60 Net sales to Total assets 2.20 2.16 2.27 2.61 2.46 Fixed asset turnover 0.00 53.81 61.99 65.65 68.60 Total sales to Net worth 2.32 2.43 2.43 2.77 2.66 Percent Operating cost 45.90% 45.34% 45.71% 47.33% 47.17% Percent Net profit 15.15% 17.04% 15.82% 10.13% 10.70% Revenue growth percentage 15.64% -4.96% -3.50% -4.14% Equity Ratios: Net book value per share of Common stock 215,975.00 277,639.00 245,769.00 149,986.00 150,720.00 Percent earnings retention 100.00% 100.00% 100.00% 100.00% 100.00% Financial Ratios Notes and Discussion of Trends: 1. Liquidity ratios measure the short-term ability of a company to meet its maturing obligations. 2. Coverage ratios measure the degree of protection for long-term creditors and investors and the margin by which certain obligations of a company can be met. 3. Leverage/capitalization ratios measure the amount of a company's operations that are financed from debt versus financed from equity. 4. Operating ratios measure the efficiency and productivity of a company using the resources that are available and the returns on sales and investments. 5. Equity ratios measure the performance of assets and earnings in relation to common and preferred equity.
11

Valuation of ABC Company The objective of this valuation is to estimate the Fair Market Value of 100.00% of the common stock of ABC Company as of 12/31/13 for the purpose as set forth in this Valuation Report. The standard of value used in our valuation of ABC Company is Fair Market Value. Fair Market Value is the price, in terms of cash or equivalent, that a buyer could reasonably be expected to pay, and a seller could reasonably be expected to accept, if the business were exposed for sale on the open market for a reasonable period of time, with both buyer and seller being in possession of the pertinent facts and neither being under any compulsion to act. There is a large number of factors to consider when estimating the common stock value of any business entity. These factors vary for each valuation depending on the unique circumstances of the business enterprise and general economic conditions that exist at the effective date of the valuation. However, fundamental guidelines of the factors to consider in any valuation have been established. The most commonly used valuation guidelines are derived from the Internal Revenue Service's Revenue Ruling 59-60. Revenue Ruling 59-60 states that in the valuation of the stock of closely held businesses, the following factors, although not all inclusive, are fundamental and require careful consideration in each case:
The nature of the business and the history of the enterprise from its inception. The economic outlook in general and the condition and outlook of the specific industry in particular. The book value of the stock and the financial condition of the business. The earning capacity of the company. The dividend-paying capacity. Whether or not the enterprise has goodwill or other intangible value. Sales of the stock and the size of the block of stock to be valued. The market price of stocks of corporations engaged in the same or a similar line of business having their
stocks actively traded in a free and open market, either on an exchange or over-the-counter. Based on circumstances unique to ABC Company as of 12/31/13, additional factors have been considered. In addition to providing general valuation guidelines, Revenue Ruling 59-60 outlines other considerations and techniques for valuing the stock of closely held businesses. The techniques are commonly divided into general approaches, i.e., the Asset, Income, Market, and Other approaches. Specific methods are then used to estimate the value of the total business entity under each approach. Our conclusion of Fair Market Value is determined based on the results of these methods and the specific circumstances surrounding the interest being valued.
12

Overview of Valuation Approaches and Methods
As previously specified, various approaches have been used to value ABC Company. These approaches, described below, are the: 1) Asset Approach, 2) Income Approach, 3) Market Approach, and 4) Other. The Asset Approach is generally considered to yield the minimum benchmark of value for an operating enterprise. The most common methods within this approach are Net Asset Value and Liquidation Value. Net Asset Value represents net equity of the business after assets and liabilities have been adjusted to their fair market values. The Liquidation Value of the business represents the present value of the estimated net proceeds from liquidating the Company's assets and paying off its liabilities. The Income Approach serves to estimate value by considering the income (benefits) generated by the asset over a period of time. This approach is based on the fundamental valuation principle that the value of a business is equal to the present worth of the future benefits of ownership. The term income does not necessarily refer to income in the accounting sense but to future benefits accruing to the owner. The most common methods under this approach are Capitalization of Earnings and Discounted Future Earnings. Under the Capitalization of Earnings method, normalized historic earnings are capitalized at a rate that reflects the risk inherent in the expected future growth in those earnings. The Discounted Future Earnings method discounts projected future earnings back to present value at a rate that reflects the risk inherent in the projected earnings. The Market Approach compares the subject company to the prices of similar companies operating in the same industry that are either publicly traded or, if privately-owned, have been sold recently. A common problem for privately owned businesses is a lack of publicly available comparable data. The Other methods consist of valuation methods that cannot be classified into one of the previously discussed approaches. The methods utilized in the Other Approach are Capitalization of Excess Earnings and Multiple of Discretionary Earnings. Commonly referred to as the “formula method,” the Capitalization of Excess Earnings method determines the value of tangible and intangible assets separately and combines these component values for an indication of total entity value. Under the Multiple of Discretionary Earnings method, the entity is valued based on a multiple of “discretionary earnings,” i.e., earnings available to the owner who is also a manager. Both of these methods are normally used to value small businesses and professional practices. The methods utilized under each approach are presented and discussed in the following sections.
Net Asset Value The Net Asset Value of ABC Company is estimated to be $519,304. The Net Asset Value method assumes that the value of a business will be realized by the hypothetical sale of its net assets as part of a going concern. In our analysis, assets and liabilities from the most recent historic, unadjusted balance sheet have been adjusted to their individual tax bases. Assets and liabilities were further adjusted to their individual appraised values. The net result is the total entity value.
13

Liquidation Value The Liquidation Value of ABC Company is estimated to be $519,304. Liquidation Value is defined as the present value of the net cash remaining if all assets are sold in a quick and orderly, piecemeal sale and all liabilities are paid at face value with the proceeds. In our analysis, the appraised value of individual assets and liabilities have been adjusted to reflect the value that could be obtained in a quick and orderly liquidation. A tax adjustment in the amount of $0 was then estimated based on the difference between the appraised value and the tax basis of assets and liabilities using an effective tax rate of 27.65%. The net result is the total entity value. See the Liquidation Value schedule for detailed value calculations and the Estimated Liquidation Cost schedule for the calculation of estimated liquidation costs.
Capitalization of Earnings The Capitalization of Earnings method arrives at an estimate of value by dividing current normalized operations, which are weighted and averaged to approximate future earnings expectations, by a capitalization rate. As shown below, The Total Entity Value of ABC Company based on the Capitalization of Earnings method is estimated to be $2,307,253. In the Capitalization of Earnings method, weighted average, normalized Net Income is divided by the capitalization rate, 8.00%, to determine Total Entity Value. See the Income Statement Adjustments section for a listing of any adjustments made to historic earnings and the Discount & Capitalization Rates section for the capitalization rate calculations.
Capitalization of Earnings Normalized Weighting Weighted Net Income Factor Earnings Fiscal Year End 2009 205,536 1.0 205,536 Fiscal Year End 2010 267,368 2.0 534,736 Fiscal Year End 2011 235,859 3.0 707,577 Fiscal Year End 2012 145,720 4.0 582,880 Fiscal Year End 2013 147,595 5.0 737,975 Sum of Weighted earnings 2,768,704 Divided by: Sum of weighting factors 15.0 Weighted average earnings 184,580 Divided by: Historic capitalization rate 8.00% Total entity value 2,307,253
Discounted Future Earnings The underlying premise for this valuation method is the basic valuation principle that an investment in a business is worth the present value of all the future benefits it will produce for its owner(s), with each expected future benefit discounted back to present value at a discount rate that reflects the risk (degree of uncertainty) that those benefits may not be realized. Therefore, the application of this method requires a determination of the present value of an expected future income stream that the business generates for that owner. To determine the expected future income stream, we assisted management in preparing projections of the financial statements for the first 1 years after the valuation date. An overall summary of the projections is presented below, followed by the individual statements in condensed format. (See the Projection Assumptions and Projection schedules for complete details.)
14

Projection Summary 2014 Net sales revenue 1,379,165 Gross profit 571,526 EBITDA 147,571 EBIT 147,571 EBT 147,571 Net income 147,571 Net cash flow 147,567 Total current assets 687,893 Net fixed assets 20,104 Total assets 707,997 Total current liabilities 41,122 Total liabilities 41,122 Total Equity 666,875 Net working capital 646,771 Income from operations 147,571 Less: Changes in Net Working capital ** 4 Free Cash Flow 147,567
Summary Income Statement Projections 2014 Total Sales Revenue 1,379,165 Total Cost of Goods Sold 807,639 Gross Profit 571,526 Total General & Administrative Expenses 423,955 Income From Operations 147,571 Net Income 147,571
Summary Balance Sheet Projections 2014 ASSETS Total Current Assets 687,893 Net Fixed Assets 20,104 Total Assets 707,997
LIABILITIES & STOCKHOLDERS' EQUITY Total Current Liabilities 41,122 Total Liabilities 41,122
Stockholders' Equity: Additional paid-in capital (preferred) 368,584
15

Common stock 1,000 Retained earnings 297,291 Total Stockholders' Equity 666,875 Total Liabilities & Stockholders' Equity 707,997
Summary Retained Earnings Projections 2014 Retained Earnings Beginning of Period 149,720
Additions: Normalized net income for the year 147,571
Deductions:
Retained Earnings End of Period 297,291
Summary Cash Flow Projections 2014 Net Cash Flow From Operations 147,567 Net Cash Flow 147,567 Cash at Beginning of Period 540,326 Cash at End of Period 687,893
Summary Sources & Uses of Funds Projections 2014 Total Internally Generated Cash 147,571 Total Cash from External Financing (4) Net Cash Flow 147,567
Comparative Company Method The notion behind the comparative company method is that prices of publicly traded stocks in the same or a similar industry provide objective evidence as to values at which investors are willing to buy and sell interests in companies in that industry. In applying the comparative company valuation method, the consultant usually computes a value multiple for each comparative company. The appropriate multiple is then determined and adjusted for the unique aspects of the company being valued. This multiple is then applied to the company being valued to arrive at an estimate of value for the appropriate ownership interest. A value multiple represents a ratio that uses a comparative company's stock price as the numerator and a measure of the comparative company's operating results (or financial position) as the denominator. Value multiples are usually computed on a per share basis, but can also be determined by dividing a company's total common stock market value by its total annual earnings or other measure. The most well known value multiple is price/earnings (P/E) whereby a company's stock price is divided by its earnings per share. The process of computing the value multiples normally consists of the
16
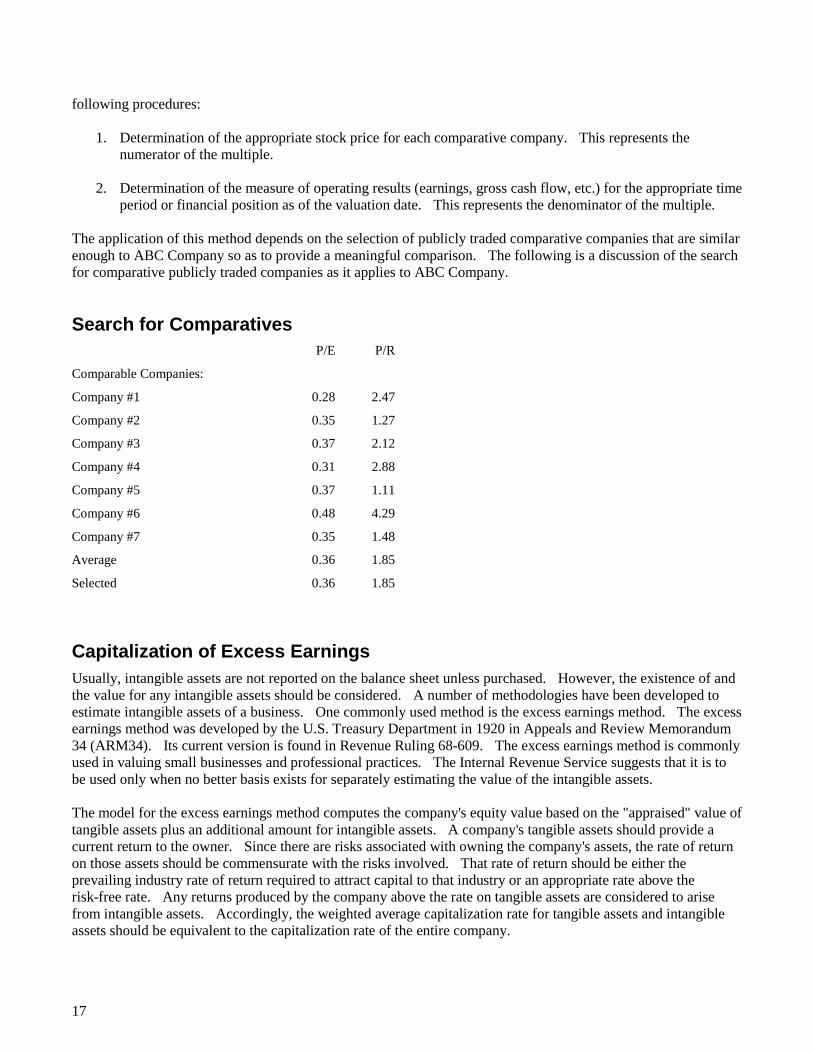
following procedures:
1. Determination of the appropriate stock price for each comparative company. This represents the numerator of the multiple.
2. Determination of the measure of operating results (earnings, gross cash flow, etc.) for the appropriate time
period or financial position as of the valuation date. This represents the denominator of the multiple. The application of this method depends on the selection of publicly traded comparative companies that are similar enough to ABC Company so as to provide a meaningful comparison. The following is a discussion of the search for comparative publicly traded companies as it applies to ABC Company.
Search for Comparatives P/E P/R
Comparable Companies:
Company #1 0.28 2.47
Company #2 0.35 1.27
Company #3 0.37 2.12
Company #4 0.31 2.88
Company #5 0.37 1.11
Company #6 0.48 4.29
Company #7 0.35 1.48
Average 0.36 1.85
Selected 0.36 1.85
Capitalization of Excess Earnings Usually, intangible assets are not reported on the balance sheet unless purchased. However, the existence of and the value for any intangible assets should be considered. A number of methodologies have been developed to estimate intangible assets of a business. One commonly used method is the excess earnings method. The excess earnings method was developed by the U.S. Treasury Department in 1920 in Appeals and Review Memorandum 34 (ARM34). Its current version is found in Revenue Ruling 68-609. The excess earnings method is commonly used in valuing small businesses and professional practices. The Internal Revenue Service suggests that it is to be used only when no better basis exists for separately estimating the value of the intangible assets. The model for the excess earnings method computes the company's equity value based on the "appraised" value of tangible assets plus an additional amount for intangible assets. A company's tangible assets should provide a current return to the owner. Since there are risks associated with owning the company's assets, the rate of return on those assets should be commensurate with the risks involved. That rate of return should be either the prevailing industry rate of return required to attract capital to that industry or an appropriate rate above the risk-free rate. Any returns produced by the company above the rate on tangible assets are considered to arise from intangible assets. Accordingly, the weighted average capitalization rate for tangible assets and intangible assets should be equivalent to the capitalization rate of the entire company.
17
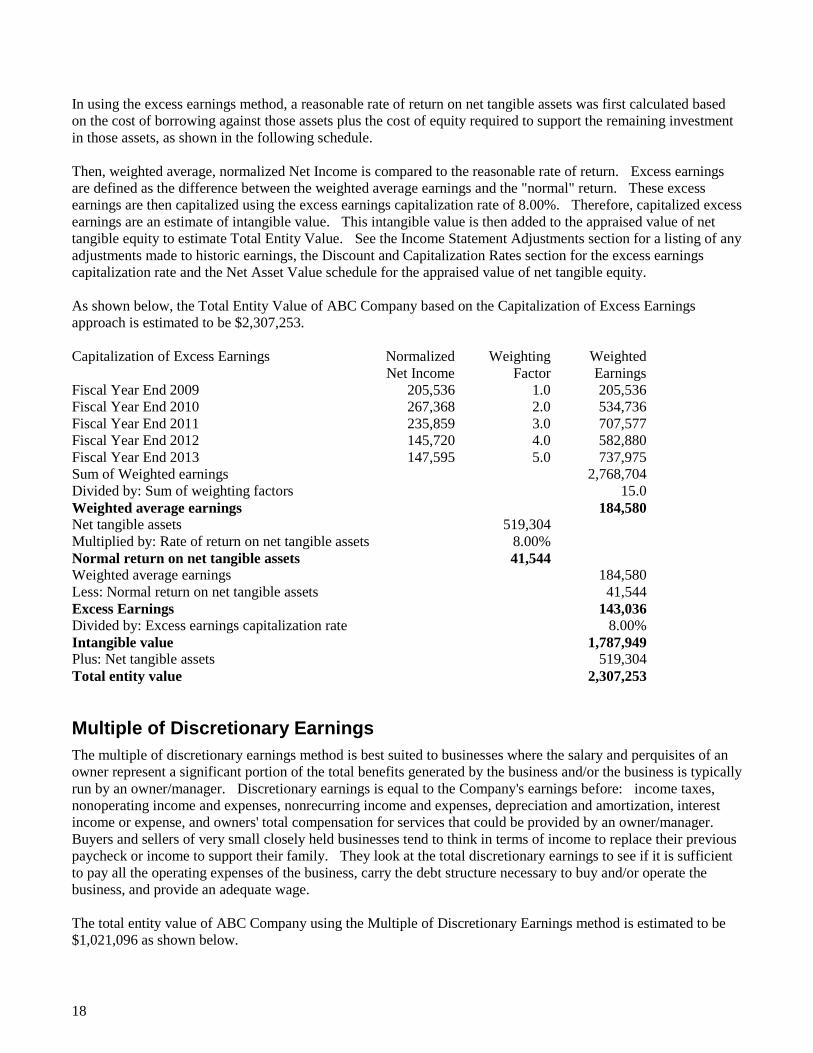
In using the excess earnings method, a reasonable rate of return on net tangible assets was first calculated based on the cost of borrowing against those assets plus the cost of equity required to support the remaining investment in those assets, as shown in the following schedule. Then, weighted average, normalized Net Income is compared to the reasonable rate of return. Excess earnings are defined as the difference between the weighted average earnings and the "normal" return. These excess earnings are then capitalized using the excess earnings capitalization rate of 8.00%. Therefore, capitalized excess earnings are an estimate of intangible value. This intangible value is then added to the appraised value of net tangible equity to estimate Total Entity Value. See the Income Statement Adjustments section for a listing of any adjustments made to historic earnings, the Discount and Capitalization Rates section for the excess earnings capitalization rate and the Net Asset Value schedule for the appraised value of net tangible equity. As shown below, the Total Entity Value of ABC Company based on the Capitalization of Excess Earnings approach is estimated to be $2,307,253. Capitalization of Excess Earnings Normalized Weighting Weighted Net Income Factor Earnings Fiscal Year End 2009 205,536 1.0 205,536 Fiscal Year End 2010 267,368 2.0 534,736 Fiscal Year End 2011 235,859 3.0 707,577 Fiscal Year End 2012 145,720 4.0 582,880 Fiscal Year End 2013 147,595 5.0 737,975 Sum of Weighted earnings 2,768,704 Divided by: Sum of weighting factors 15.0 Weighted average earnings 184,580 Net tangible assets 519,304 Multiplied by: Rate of return on net tangible assets 8.00% Normal return on net tangible assets 41,544 Weighted average earnings 184,580 Less: Normal return on net tangible assets 41,544 Excess Earnings 143,036 Divided by: Excess earnings capitalization rate 8.00% Intangible value 1,787,949 Plus: Net tangible assets 519,304 Total entity value 2,307,253
Multiple of Discretionary Earnings The multiple of discretionary earnings method is best suited to businesses where the salary and perquisites of an owner represent a significant portion of the total benefits generated by the business and/or the business is typically run by an owner/manager. Discretionary earnings is equal to the Company's earnings before: income taxes, nonoperating income and expenses, nonrecurring income and expenses, depreciation and amortization, interest income or expense, and owners' total compensation for services that could be provided by an owner/manager. Buyers and sellers of very small closely held businesses tend to think in terms of income to replace their previous paycheck or income to support their family. They look at the total discretionary earnings to see if it is sufficient to pay all the operating expenses of the business, carry the debt structure necessary to buy and/or operate the business, and provide an adequate wage. The total entity value of ABC Company using the Multiple of Discretionary Earnings method is estimated to be $1,021,096 as shown below.
18
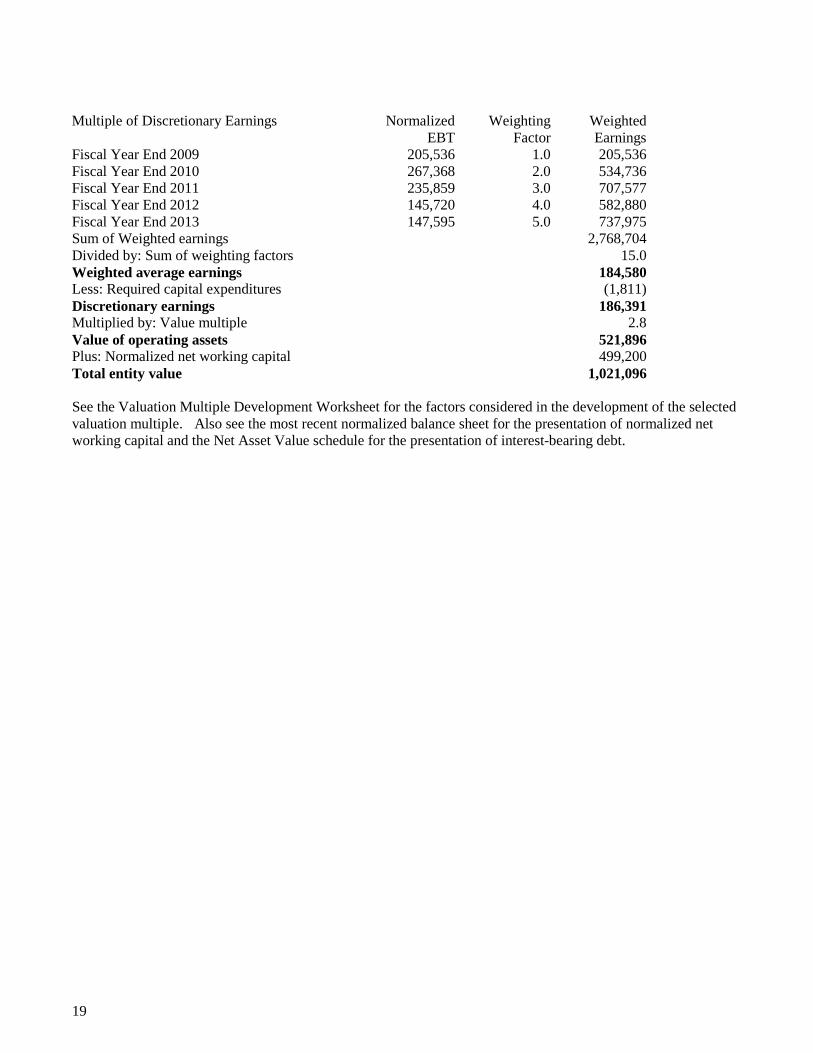
Multiple of Discretionary Earnings Normalized Weighting Weighted EBT Factor Earnings Fiscal Year End 2009 205,536 1.0 205,536 Fiscal Year End 2010 267,368 2.0 534,736 Fiscal Year End 2011 235,859 3.0 707,577 Fiscal Year End 2012 145,720 4.0 582,880 Fiscal Year End 2013 147,595 5.0 737,975 Sum of Weighted earnings 2,768,704 Divided by: Sum of weighting factors 15.0 Weighted average earnings 184,580 Less: Required capital expenditures (1,811) Discretionary earnings 186,391 Multiplied by: Value multiple 2.8 Value of operating assets 521,896 Plus: Normalized net working capital 499,200 Total entity value 1,021,096 See the Valuation Multiple Development Worksheet for the factors considered in the development of the selected valuation multiple. Also see the most recent normalized balance sheet for the presentation of normalized net working capital and the Net Asset Value schedule for the presentation of interest-bearing debt.
19

Conclusions of Value Weighted Method Value Weight Value Net Asset Value 519,304 11.0 5,712,344 Liquidation Value 519,304 11.0 5,712,344 Capitalization of Earnings 2,307,253 0.1 230,725 Discounted Future Earnings 1,844,633 0.5 922,317 Discounted Net Cash Flow 1,844,585 0.5 922,317 Capitalization of Excess Earnings 2,307,253 0.1 230,725 Multiple of Discretionary Earnings 1,021,096 0.5 510,548 Sum of weighted values 14,241,320 Divided by: Sum of weights 24.0 Weighted average total entity value 600,900
20
T V GThe Vant GroupMergers & Acquisitions
T V GThe Vant GroupMergers & Acquisitions
Financial Information Summary

No Independent investigation or verification of the information presented herein has been made by The Vant Group
Sales 1,379,165$ 100% 1,438,736$ 100% 1,490,928$ 100% 1,568,757$ 100% 1,356,592$ 100%-4% -4% -5% 16% N/A
Cost of Goods Sold 807,593 59% 902,625 63% 892,227 60% 939,684 60% 866,548 64%Net Gain / Other Income - 0% - 0% - 0% - 0% - 0%
Gross profit 571,572 41% 536,111 37% 598,701 40% 629,073 40% 490,044 36%
Operating expenses:Compensation of officers - 0% - 0% - 0% - 0% - 0%Salaries and wages 338,776 25% 312,718 22% 269,432 18% 267,638 17% 236,028 17%Repairs and maintenance 4,690 0% 5,466 0% 3,570 0% 3,163 0% 325 0%Bad debts - 0% - 0% - 0% - 0% - 0%Rent 18,996 1% 18,996 1% 18,396 1% 18,396 1% 18,396 1%Taxes and licenses 39 0% 127 0% 180 0% - 0% 2,400 0%Interest 59 0% 727 0% 1,511 0% 1,427 0% - 0%Charitable Contributions - 0% - 0% - 0% - 0% - 0%Depreciation 1,875 0% 3,050 0% 5,100 0% 11,160 1% - 0%Depletion - 0% - 0% - 0% - 0% - 0%Advertising 211 0% - 0% - 0% 665 0% 670 0%Pension, Profit Sharing - 0% - 0% - 0% - 0% - 0%Employee Benefit Programs 8,202 1% 8,577 1% 6,569 0% 5,448 0% 3,261 0%Other Deductions* 51,129 4% 40,730 3% 58,084 4% 53,808 3% 23,428 2%
Total operating expenses 423,977 31% 390,391 27% 362,842 24% 361,705 23% 284,508 21%
Income from operations 147,595$ 11% 145,720$ 10% 235,859$ 16% 267,368$ 17% 205,536$ 15%
* A more detailed breakout is provided on the interim financial statements and tax returns
ABC CompanyComparative Tax Returns - Accrual Basis
Periods Beginning January 1, 2009 - Ending December 31, 2013
2013 TR 2012 TR 2011 TR 2010 TR 2009 TR

No Independent investigation or verification of the information presented herein has been made by The Vant Group
2013 2012 2011 2010 2009
Sales 1,379,165$ 1,438,736$ 1,490,928$ 1,568,757$ 1,356,592$
Net Income 147,595 145,720 235,859 267,368 205,536 Depreciation - G&A 1,875 3,050 5,100 11,160 - Interest 59 727 1,511 1,427 - EBITDA 149,529$ 149,497$ 242,470$ 279,955$ 205,536$
Owner's Discretionary Cash Flow 149,529$ 149,497$ 242,470$ 279,955$ 205,536$ (Adjusted EBITDA)
Adjusted EBITDA as a % of Sales 10.84% 10.39% 16.26% 17.85% 15.15%
ABC CompanyComparative Cash Flow Summaries
Periods Beginning January 1, 2009 - Ending December 31, 2013
No Independent Investigation or Verification of the Information Presented has been made by The Vant Group
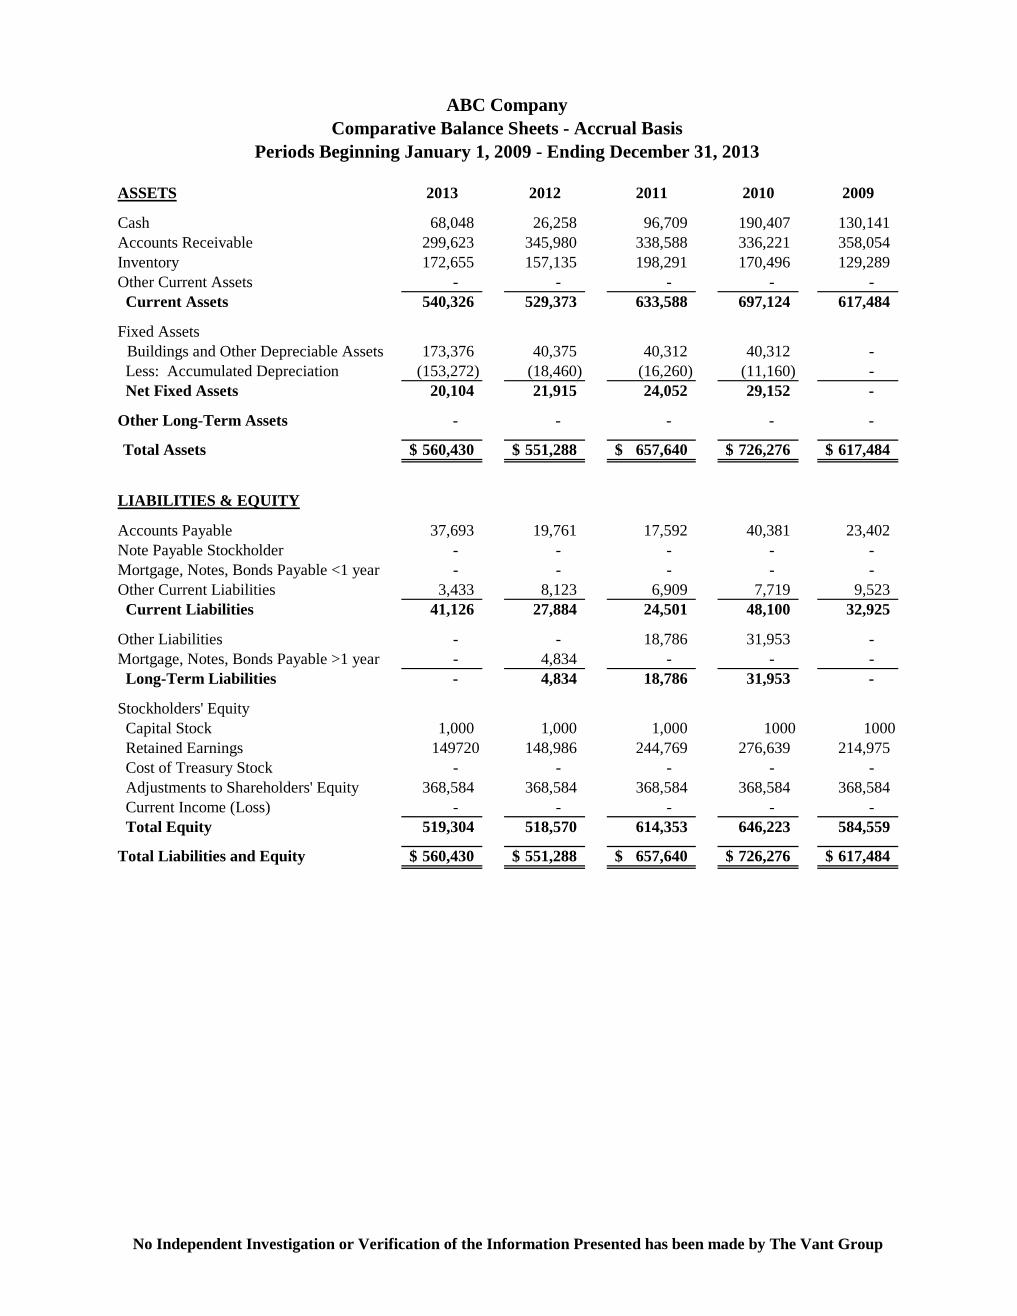
ASSETS 2013 2012 2011 2010 2009
Cash 68,048 26,258 96,709 190,407 130,141 Accounts Receivable 299,623 345,980 338,588 336,221 358,054 Inventory 172,655 157,135 198,291 170,496 129,289 Other Current Assets - - - - - Current Assets 540,326 529,373 633,588 697,124 617,484
Fixed Assets Buildings and Other Depreciable Assets 173,376 40,375 40,312 40,312 -
Less: Accumulated Depreciation (153,272) (18,460) (16,260) (11,160) - Net Fixed Assets 20,104 21,915 24,052 29,152 -
Other Long-Term Assets - - - - -
Total Assets 560,430$ 551,288$ 657,640$ 726,276$ 617,484$
LIABILITIES & EQUITY
Accounts Payable 37,693 19,761 17,592 40,381 23,402 Note Payable Stockholder - - - - - Mortgage, Notes, Bonds Payable <1 year - - - - - Other Current Liabilities 3,433 8,123 6,909 7,719 9,523 Current Liabilities 41,126 27,884 24,501 48,100 32,925
Other Liabilities - - 18,786 31,953 - Mortgage, Notes, Bonds Payable >1 year - 4,834 - - - Long-Term Liabilities - 4,834 18,786 31,953 -
Stockholders' Equity Capital Stock 1,000 1,000 1,000 1000 1000 Retained Earnings 149720 148,986 244,769 276,639 214,975 Cost of Treasury Stock - - - - - Adjustments to Shareholders' Equity 368,584 368,584 368,584 368,584 368,584 Current Income (Loss) - - - - - Total Equity 519,304 518,570 614,353 646,223 584,559
Total Liabilities and Equity 560,430$ 551,288$ 657,640$ 726,276$ 617,484$
ABC CompanyComparative Balance Sheets - Accrual Basis
Periods Beginning January 1, 2009 - Ending December 31, 2013

$205,536
$279,955
$242,470
$149,497 $149,529
$0
$50,000
$100,000
$150,000
$200,000
$250,000
$300,000
2009 2010 2011 2012 2013
Adj
uste
d E
BIT
DA
Year
Comparative Annual Adjusted EBITDA

15.15%
17.85% 16.26%
10.39% 10.84%
0%
5%
10%
15%
20%
2009 2010 2011 2012 2013
Year
Comparative Annual Adjusted EBITDA as a % of Sales A
nnua
l Adj
uste
d E
BIT
DA

$1,356,592
$1,568,757
$1,490,928
$1,438,736
$1,379,165
$1,250,000
$1,300,000
$1,350,000
$1,400,000
$1,450,000
$1,500,000
$1,550,000
$1,600,000
2009 2010 2011 2012 2013
Rev
enue
Year
Comparative Annual Revenue

$866,548
$939,684
$892,227 $902,625
$807,593
$700,000
$750,000
$800,000
$850,000
$900,000
$950,000
2009 2010 2011 2012 2013
Cos
t of G
oods
Sol
d
Year
Comparative Annual Cost of Goods Sold

T V GThe Vant GroupMergers & Acquisitions
T V GThe Vant GroupMergers & Acquisitions
Comparable Sales
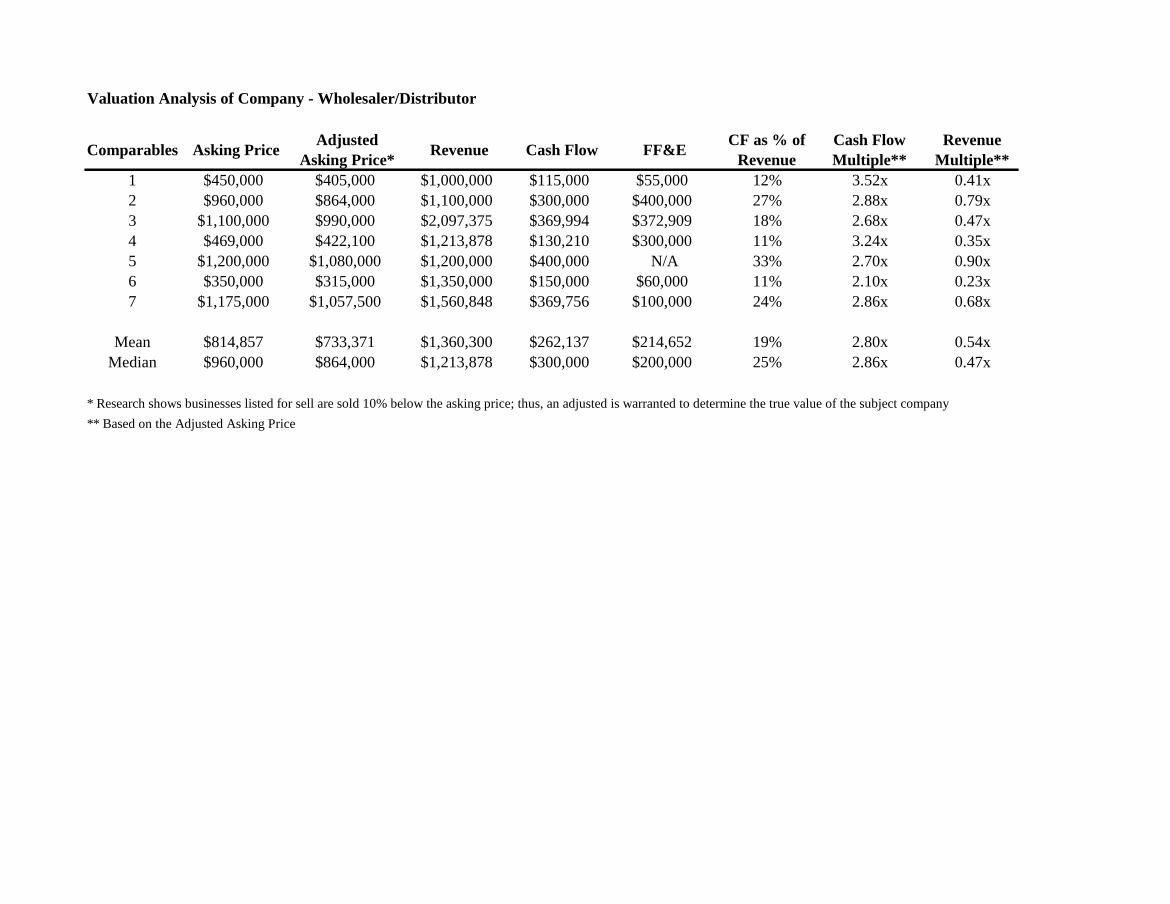
Valuation Analysis of Company - Wholesaler/Distributor
Comparables Asking Price Adjusted Asking Price* Revenue Cash Flow FF&E CF as % of
RevenueCash Flow Multiple**
Revenue Multiple**
1 $450,000 $405,000 $1,000,000 $115,000 $55,000 12% 3.52x 0.41x2 $960,000 $864,000 $1,100,000 $300,000 $400,000 27% 2.88x 0.79x3 $1,100,000 $990,000 $2,097,375 $369,994 $372,909 18% 2.68x 0.47x4 $469,000 $422,100 $1,213,878 $130,210 $300,000 11% 3.24x 0.35x5 $1,200,000 $1,080,000 $1,200,000 $400,000 N/A 33% 2.70x 0.90x6 $350,000 $315,000 $1,350,000 $150,000 $60,000 11% 2.10x 0.23x7 $1,175,000 $1,057,500 $1,560,848 $369,756 $100,000 24% 2.86x 0.68x
Mean $814,857 $733,371 $1,360,300 $262,137 $214,652 19% 2.80x 0.54xMedian $960,000 $864,000 $1,213,878 $300,000 $200,000 25% 2.86x 0.47x
* Research shows businesses listed for sell are sold 10% below the asking price; thus, an adjusted is warranted to determine the true value of the subject company** Based on the Adjusted Asking Price