tva’s flood hydrology strategy and potential for … · tva’s flood hydrology strategy and...
TRANSCRIPT

TVA’s Flood Hydrology Strategy and Potential for Federal Collaboration
Briefing to Subcommittee on Hydrology10/22/2015
Curt Jawdy, P.E. (TVA, Lead Hydrologist)

2
History of Flood Preparedness at TVA
The Tennessee Valley Authority (TVA) was established “to control the destructive flood water in the Tennessee River Basin” (TVA Act, 1933). TVA’s flood reduction mission has been valued at over $6 billion to date. The first rule in flood reduction is to “do no harm”.
TVA has performed several rounds of Probable Maximum Precipitation (PMP) and Probable Maximum Flood (PMF) studies at intervals of a decade or so. These studies provide the hydrologic loading for dam stability studies that have been performed on a similar cadence.
Many dam safety construction projects have been performed over the years to ensure our dams perform as intended.
In 2008, a Nuclear Regulatory Commission (NRC) relicensing effort uncovered some deficiencies in TVA’s hydrology documentation, so a very large revision to the calculations was performed, raising PMF levels at many dams by several feet.
Over $150 million of dam safety improvements have been performed in response to changes in engineering standards and criteria and the subsequent evaluations, and several nuclear licensing packages have been approved by NRC.
If TVA rehabilitated every dam to the new PMF levels, the cost would be very significant.

3
Limitations of the Previous Program
Collaboration between the hydrology, dam safety and nuclear licensing groups was not always tight.
PMF values were based on TVA-custom models that were not commercially supported.
PMF values were based on older PMP studies that didn’t take advantage of the latest observations and technology.
Dam safety improvement funding favored raising dams in response to PMF loadings, with comparatively less attention paid to more latent and difficult to quantify risks.

4
Improve collaboration between the hydrology, dam safety and nuclear staff in an integrated team environment.
Perform an integrated PMF study with the latest tools in order to put an upper bound on flood hazard.
Perform a hydrologic hazard study to provide the best possible hydrologic loading probabilities so that good risk management decisions can be made with the new risk informed decision making (RIDM) program.
Goals of the New Program

5
Role of Extreme (PMP) Rainfall
PMP rainfall studies will provide an upper bound on rainfall.PMF loadings will provide an upper bound on hydrologic loading.The long-range goal is to have all dams stable with appropriate factors of safety at the PMF loading level.

6
Current HMRs in Effect
HMR-56 for TVA basins < 3,000 mi2 (1986)HMR-41 for TVA main river (1965)HMR-47 for Kentucky Dam (1973)Custom research from NWS for Douglas and Cherokee (1970s)

7
State of PMP Hydrometeorological Reports
Excerpts from “Review of Probable Maximum Precipitation Procedures and Databases Used to Develop HMRs” by U.S. Bureau of Reclamation (USBR) for the Nuclear Regulatory Commission (NRC).
“The PMP Depth-Area Duration (DAD) storm data base and related data bases are outdated.”“There are relatively poor records and documentation in reports and files on individual extreme storms.”“Dew point climatology information is outdated and data sources for coastal areas have changed from land-based dew points (HMR 51) to SST estimates (HMRs 57 and 59).”“Precipitation frequency estimates, used for PMP comparisons (TP-40) and as base maps in orographic areas (NOAA Atlas 2), are outdated.”“As HMR 51 did not include orographic factors; limited PMP estimates were provided over the Appalachians and western parts of the region. Orographic methods, including storm separation, were developed in HMR 55A and 56.”

8
TVA Sponsored PMP Study
Storm database was brought up to date.Storm analysis was performed using the latest datasets and GIS technology.Updated dew point climatologies were used.Detailed orographic transposition was performed spatially using Atlas-14 to account for impact of mountains.All data was provided and all techniques are reproducible.Independent review panel was engaged throughout and concurred with the study findings.User-friendly tools were created to provide PMP rainfall values.

9
Key Tasks for PMP Studies
Identify extreme storm typesCreate list of candidate storms and cull Thoroughly describe the rainfall in time and space for each candidate stormIdentify transposition limits for each stormDescribe topographic maximization effectsDescribe moisture source maximization effectsTranspose each storm (gridwise in recent studies)Create depth-area-duration table for each storm and create a maximum enveloped DAD table (gridwise in recent studies)Review the results and explain or adjust anomaliesCreate a tool that allows easy use of the results by non-experts

10
Storm Types Applicable to the Tennessee Valley
General StormsThunderstorms and Mesoscale Convective SystemsTropical Storms

11
Storm Search Domain
A search was performed for “storms that have occurred in meteorological and topographically similar regions, where extreme rainfall storms similar to those that could occur over some part of the TVA domain have been observed.”

12
Final Candidate Storms
58 storms were selected for detailed analysis.

13
Storm Analysis with SPAS
The Storm Precipitation Analysis System (SPAS) was used to describe all storms.
SPAS has been used to analyze over 500 storm centers across all types of terrain, among highly varied meteorological settings and some occurring over 100-years ago.
Combined the best data available:Radar grids with custom Z-R relationshipsHourly GagesDaily GagesSpatial interpolation aided by Atlas 14

14
SPAS uses the same basic principles used by the Corps of Engineers and National Weather Service/Bureau thereby achieving consistency among the storm analyses.The DAD results compared favorably to previously analyzed storms, including:
Westfield, MA, storm of August 17-20, 1955
ResultsImproved detail in space and time.
20000Generally within +/- 5% !!
SPAS Depth-Area-Duration Results
SPASSq-Miles 6-hour 12-hour 24-hour 36-hour 48-hour 60-hour Total
10 7.96 11.48 16.40 19.10 19.11 19.47 19.70100 7.22 10.72 15.20 17.77 17.76 18.23 18.47200 6.99 10.27 14.28 16.91 16.84 17.39 17.54
1000 5.97 9.06 12.55 14.97 15.08 15.40 15.955000 4.14 6.45 9.25 11.70 12.02 12.35 13.05
10000 3.23 5.46 7.63 9.60 9.91 10.26 10.8620000 2.24 4.03 5.91 7.66 7.97 8.22 8.77
Weather BureauSq-Miles 6-hour 12-hour 24-hour 36-hour 48-hour 60-hour Total
10 7.80 11.10 16.40 18.90 19.40 19.40 19.40100 7.60 10.50 14.60 18.10 18.80 19.00 19.00200 7.40 10.20 14.20 17.60 18.20 18.40 18.40
1000 6.20 9.20 12.40 15.90 16.20 16.40 16.405000 4.00 6.30 9.50 12.10 12.60 13.00 13.00
10000 3.10 5.00 8.00 10.00 10.60 10.80 10.8020000 2.10 3.60 6.30 7.90 8.30 8.50 8.50
Percent DifferenceSq-Miles 6-hour 12-hour 24-hour 36-hour 48-hour 60-hour Total
10 2.1% 3.4% 0.0% 1.1% -1.5% 0.4% 1.5%100 -5.0% 2.1% 4.1% -1.8% -5.5% -4.1% -2.8%200 -5.5% 0.7% 0.6% -3.9% -7.5% -5.5% -4.7%
1000 -3.7% -1.5% 1.2% -5.8% -6.9% -6.1% -2.7%5000 3.5% 2.4% -2.6% -3.3% -4.6% -5.0% 0.4%
10000 4.2% 9.2% -4.6% -4.0% -6.5% -5.0% 0.6%6.7% 11.9% -6.2% -3.0% -4.0% -3.3% 3.2%

15
Storm Maximization and Transposition
Transposition limits were then derived for each storm, representing the locations where the same storm physics could occur.
The following process was then performed for each storm:In place moisture maximization based on 100-yr dew points,Moisture transposition based on 100-yr dew points by grid cell,Orographic transposition based on Atlas-14 rainfall by grid cell.
A bounding DAD curve was then made for each cell.

16
Resulting Map after Transposition & Maximization
A series of maps was made to cover each storm type, area and duration.
A GIS tool was made to allow the user to easily extract PMP values using shapefiles of watershed boundaries.
17
Benefits of PMP Modernization
More recent data
Improved methods
Grid cell-by-cell values
Easy application tool
Documentation
Recent independent review
Reproducibility

18
Breadth of new PMP Studies
Over 500 storms have been analyzed.
Over 80 PMP studies have been completed.
Since PMP studies draw from wide transposition domains and storm databases, much of the storm analysis needed nationally is complete.

19
Agencies that have Approved Updated PMP Studies
TVA
Federal Energy Regulatory Commission (FERC)
Many state dam safety agencies
Corps of Engineers
NRCS
Statewide studies for Nebraska, Arizona, Wyoming, Ohio, Texas and Virginia
NRC is in the process of reviewing many for Flood Hazard Re-evaluations submitted after Fukushima incident.
NRC performed an audit of the vendor’s methodology so that the review for each site could focus on site-specific details

20
AUDIT REPORT BY THE OFFICE OF NUCLEAR REACTOR REGULATION OF APPLIED WEATHER ASSOCIATES, LLC REGARDING SITE SPECIFIC PROBABLE MAXIMUM PRECIPITATION DEVELOPMENT IN SUPPORT OF NEAR-TERM TASK FORCE RECOMMENDATION 2.1 FLOOD HAZARD REEVALUATIONS
“The audit successfully addressed each of the topics listed in the audit plan and identified areas in the AWA process that may be applicable to all of its PMP studies. In these areas the staff may be able to generically resolve any concerns, and thus reduce the number of requests for additional information (RAIs) for its FHRR reviews. The staff also identified areas where case-by-case information that will be necessary to complete its reviews.”
“The NRC staff did not identify any open items regarding…”“AWA’s use of the SPAS software.”“AWA’s identification and quantification of actual and potential storm moisture sources.”“maximum dew point climatology.”“AWA’s determination of storm transposition limits.”“AWA’s adjustment of available moisture during storm transposition.”“topographic effects.”“sensitivity analysis to specific storms.”“uncertainty in ssPMP estimates.”“climate change.”“the webinar follow-up.”

21
“As part of its future review the staff may…”
“examine the level of documentation, independence and relevance of past reviews by BOCs and TRBs...”
“review past reports from BOCs and TRBs to determine the level of review and scrutiny applied to SPAS for each referenced study.”
“review the dew point temperature adjustment on the controlling storms for each ssPMP.”
“request further sensitivity analysis for the impact of smoothing using unadjusted PRISM dew point data and if using the standard goodness-of-fit test has a significant impact on the final dew point climatology maps.”
“ensure that relevant storm data points are bounded by the envelopment curves for each FHRR.”
Consider “that the OTF is not purely based on orographics and may double count moisture adjustment since the influence of climatology is retained when using precipitation frequency analysis. The Wyoming statewide PMP report also documents its BOC’s concern on this topic.”
Determine whether orographic transposition based on Atlas-14 100-yr storm provides proper accuracy in capturing topographic effects on a PMP.
Consider, “the impact of using average rather than persisting dew point temperatures, and breaking large storms into smaller DAD regions.”
Examine rainfall time distributions “to ensure conservative application.”

22
Potential for a Methodology Standard
Extreme Storm Event Work Group (ESEWG) might take the lead by:collecting completed PMP studies and examining the state of practice, and publishing a standard methodology for performing PMP studies.
Limiting the potential re-work and undue hardship that would be caused by a major change from the next-generation PMP studies that have been approved by several regulatory agencies.
Building on this, further work could:Lay the groundwork for future consolidation of the database and results coming from studies using the approved methodology. These tools would be especially useful for smaller actors that cannot invest in a full blown hydrologic hazard study.Set a plan for maintaining the database into the future.

23
Shortcoming of a Design Storm Only Approach
Given that many dams throughout the country do not meet current stability criteria for PMF loadings, how should you prioritize capital improvements with limited resources to reduce risk the fastest?
Elevation
Frequency

24
TVA’s Transition to Risk-Informed Decision Making
TVA is implementing a RIDM paradigm similar to that pioneered by USBR and Corps.
Hydrology and hydraulics play an integral role in RIDM.
How high does the
water get?
Does the dam fail?
How does it
fail?
What are the consequences of the failure?
Non-hydrologic loadings and fragility curves

25
Role of Probabilistic Approaches
Q: Given budgetary constraints and ever increasing engineering standards for continued operation of dams, not to mention the increasing risk as populations are drawn to the benefits these structures provide, how do we continue to meet routine dam safety requirements and prioritize needed capital improvement while reducing risk most efficiently and effectively?A: The RIDM program will prioritize dam safety projects.The hydrologic hazard study will provide headwater frequency curves to the RIDM program.Dam failure consequence studies will provide the consequences of each dam’s failure to the RIDM program.Precipitation frequency studies and watershed-specific precipitation-frequency relationships drive the current hydrologic hazard study.A suite of scalable spatial and temporal storm templates are used in stochastic flood modeling to develop project-specific hydrologic hazard curves.
0.00.20.40.60.8

26
How are Dam Risk Calculations Performed?
Risk = probability of loading x probability of failure given loading x consequence of failure.
Event probabilities based on loading conditions Non-failure outcomes
and probabilities
Failure outcomes and probabilities
Hydrologic hazard loading curve

27
What kind of guidance can risk assessments give to decision-makers?
Risk analysis quantifies both the probability and consequences of an event.
Combining these two types of information can allow for much better decision-making.
Probabilities are shown as a likelihood/year.
Consequences can be estimated for a range of components like:
Loss of life,Damage to private property,Damage to TVA assets,Loss of TVA generation revenue,Economic damages, andEnvironmental damages …..

28
Benefits
Proper hydrologic hazard inputs can improve risk estimates across the portfolio.Projects that provide the most risk reduction can be given priority in the program, and risk reduced the most quickly and effectively.

29
Precipitation-Frequency Study
Floods in the Tennessee Valley are produced by a mixed-population of storm types for TVA watersheds ranging from 60-mi2 to over 20,000-mi2 .
TVA worked with Riverside Technology, MGS Engineering (Mel Schaeffer), MetStat and Applied Climate Services to create separate precipitation-frequency relationships for 3 storm types within the Tennessee Valley.
Atlas 14 was not used because the datasets included precipitation maxima from all storm types and procedures for analysis were focused on the events commonly used by the engineering community (more common than 100-year event).
0100200300400500600700800900
1000
Nov Dec Jan Feb Mar Apr May Jun Jul Aug Sep Oct
NUMBER
OF DAY
S
MONTH
Mesoscale Storm Embedded Convection
TVA Study Area 1910‐2012 Database Daily Storm Types
MEC MLC

30
Storm Events Data Mining
PRECIPITATION GAGE TYPE
NUMBER OF STATIONS/GAGES
STATION-YEARS OF RECORD
NOAA Daily Gages 758 43,040NOAA Hourly Gages 91 3,713TVA Synoptic Gages 135 3,433TOTAL 984 50,186
Precipitation data series were created for precipitation annual maxima produced by specific storm types in the period from 1881 through mid-2014.
Precipitation annual maxima data series for precipitation stations for each of four storm types were assembled based on a database of daily storm types developed from storm typing procedures.
The storms were typed based on the 20th Century Re-analysis using discriminatory variables and a logic structure
Local Storms (LS), Mesoscale Storms with Embedded Convection (MEC), Synoptic-scale Mid-Latitude Cyclones (MLC) and Tropical Storm Remnants (TSR).

31
Each storm type showed clear seasonality; this will have considerable interaction with results due to the yearly reservoir guide curves, which also respond to seasonality.
Seasonality Results
01002003004005006007008009001000
Nov Dec Jan Feb Mar Apr May Jun Jul Aug Sep Oct
NUMBE
R OF D
AYS
MONTH
Mid‐Latitude Cyclones
TVA Study Area 1910‐2012

32
Regional boundaries were created based on climatic characteristics, meteorological processes at play, and validated based on homogeneity tests and the explanatory power in describing statistical behavior of storm data.
These boundaries were used in grouping of stations for conducting regional analyses to increase sample size and increase the reliability of precipitation-frequency estimates.
Analysis by Region
33
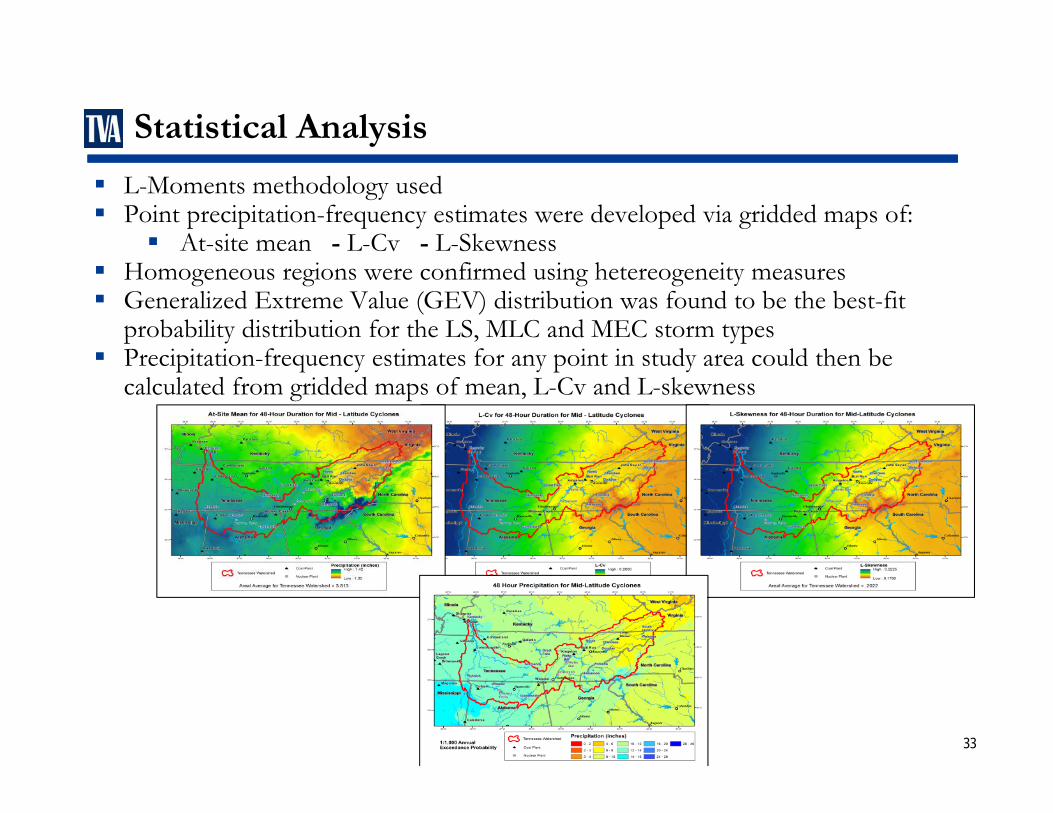
L-Moments methodology usedPoint precipitation-frequency estimates were developed via gridded maps of:
At-site mean - L-Cv - L-SkewnessHomogeneous regions were confirmed using hetereogeneity measuresGeneralized Extreme Value (GEV) distribution was found to be the best-fit probability distribution for the LS, MLC and MEC storm typesPrecipitation-frequency estimates for any point in study area could then be calculated from gridded maps of mean, L-Cv and L-skewness
Statistical Analysis

34
The regional precipitation-frequency solution was back-tested against individual gages and showed good fit throughout.
Test Against Observed Data
0.001.002.003.004.005.006.007.008.009.00
10.0011.0012.00
2-D
AY
PR
EC
IPIT
AT
ION
(in
)
ANNUAL EXCEEDANCE PROBABILITY .001.10
Extreme Value Type 1 Plotting Paper
.20 .05 .02 .002.50.90
Regional Solution
.80 .01 .005
Charleston TN
.99
Data 1884‐2013
March 31, 1886May 6, 2003

35
Hydrologic Hazard Project Tasks Currently Underway
Creating watershed-specific precipitation-frequency relationships for all basins using point-to-areal techniques.Creating a library of starting states.Creating a stochastic simulation framework to:
Sample starting states and forcings,Run a stack of hydrologic, routing and hydraulic models, andTabulate results.
Creating elevation frequency curves at key points.

36
NWS Community Hydrologic Prediction System (CHPS) backbone provided by the National Weather Service (NWS).
A 140-subbasin model was calibrated over 50+ years in partnership with the NWS.
Typical improvement in goodness of fit shown below.
Building Block: New Hydrology Model

37
RiverWare is the operational decision-making model used in the River Forecast Center
RiverWare can be run in a rules-based mode to mimic how the river would be run by forecasters
The RiverWare rules-based model is being refreshed with the latest improvements from the operational system in order to best represent the system’s response to floods
Building Block: Improved RiverWare Model

38
A new HEC-RAS model was created for the purpose of modeling dam-breaks for emergency action planning and inundation maps.
The model has extensive rules to reproduce basic flood operating guides and dam rating curves.
It will be used to refine the results of the RiverWare model in cases that simpler hydrologic methods do not represent conditions well.
Building Block: New Hydraulics Model

39
Current work: create a software system for sampling input probabilities and running 1,000s of realistic flow scenarios to come up with a headwater frequency distribution.
Hydrologic Hazard Project Workflow
Randomly select dates from historic record
Sample inputs for the chosen dates
Storm Seasonality
Historic Soil Moisture
Historic River Levels
Storm Depth from freq-curve
Apply storm template and calculate basin rainfall
Calculate runoff
Route flows and report max levels
Compile and summarize results

40
These headwater frequency curves will be the main hydrologic input to the risk-informed decision-making process.
Dam Headwater Frequency Curve

41
Benefits of Rainfall Frequency Modernization
Drives the dam safety RIDM methodology for reducing dam safety risk.
Refined regionalization approach minimizes uncertainty in the long tails necessary for handling remote risks.
Separating storm types and understanding seasonality allows for much better understanding of processes involved and reduces uncertainty in the tails.
Contributions to uncertainty can be quantified well and tracked through the hydrologic hazard analysis.
Point-to-areal methods allow for use in hydrologic hazard calculationsGeospatial storm analyses needed for point-to-areal calculations have many other uses in river management.
As more and smaller infrastructure owners move towards RIDM, a robust standard and dataset for rainfall frequency could make a major impact in reducing flood risk and optimizing infrastructure spending.

42
Potential for Rainfall Frequency Extension Deeper into the Rare Events Tails
Hydrologic Frequency Analysis Working Group (HFAWG) might take the lead by:collecting and examining the state of practice in rainfall-frequency studies for rare storms,promoting and sponsoring studies to improve understanding of the temporal, spatial and probabilistic behavior of the most extreme storms observed for various storm types,presenting recommendations for methodologies for performing regional precipitation-frequency studies with an emphasis on characterizing extreme events, andhelping publicize the new methodologies and coordinating funding.
NWS could:participate in studies and provide storm data to assist in examining the temporal, spatial and probabilistic behavior of the most extreme storms observed for various storm types, andconsider another round of rainfall-frequency development and publication once Atlas-14 is complete.