tutorial: rma analysis using the microarray platform website … · tutorial: rma analysis using...
TRANSCRIPT
Tutorial: RMA Analysis using the Microarray Platform Website
I Overview
Objective of Tutorial
This tutorial provides an introduction to data analysis using a data processing method
known as RMA (Robust Multi-array Average). The tutorial outlines how to download
data from the website, obtain RMA expression data and perform a simple 2-class
comparison using fold change. The case study for the tutorial, described in more detail
below, involves nine hybridizations: three conditions measured in triplicate.
Concepts Illustrated
• Data Download - How to obtain RMA expression summary data online and a
look at the format of this data.
• Class Comparison - Designating differentially expressed genes between two
groups of samples by calculating the fold change for each gene.
Please Note: The first step in any analysis should be a visualization of the data. In other
words, array results within and between sample groups should be plotted against each
other to look for arrays that stand out. This process is an essential analysis and quality
control step. So, before proceeding, you should either have already looked at plots of the
data (see the RMA plots description) or should contact the statistical staff at the centre.
Case Study Design
The motivation for the case study experiments is to study the homing of T-Cells in lung.
Affymetrix murine MG-U74vA chips were used to monitor the expression of 12488
genes in three CD8+ T cell populations. All three populations are derived from BALB/c
mice, but differ in exposure to anti-CD3 and anti-CD28: naïve cells (0h exposure), 48h
exposure, and a HA210-219-specific CD8+ T cell clone. Nine arrays were performed in
total: triplicates of each condition.
Objective of Analysis
Make a two-class comparison between the gene expression patterns in naive and 48 hour
antibody exposed CD8+ T cells. Those genes that are differentially expressed between
the two samples may play a role in the CD8+ T cell immune response.
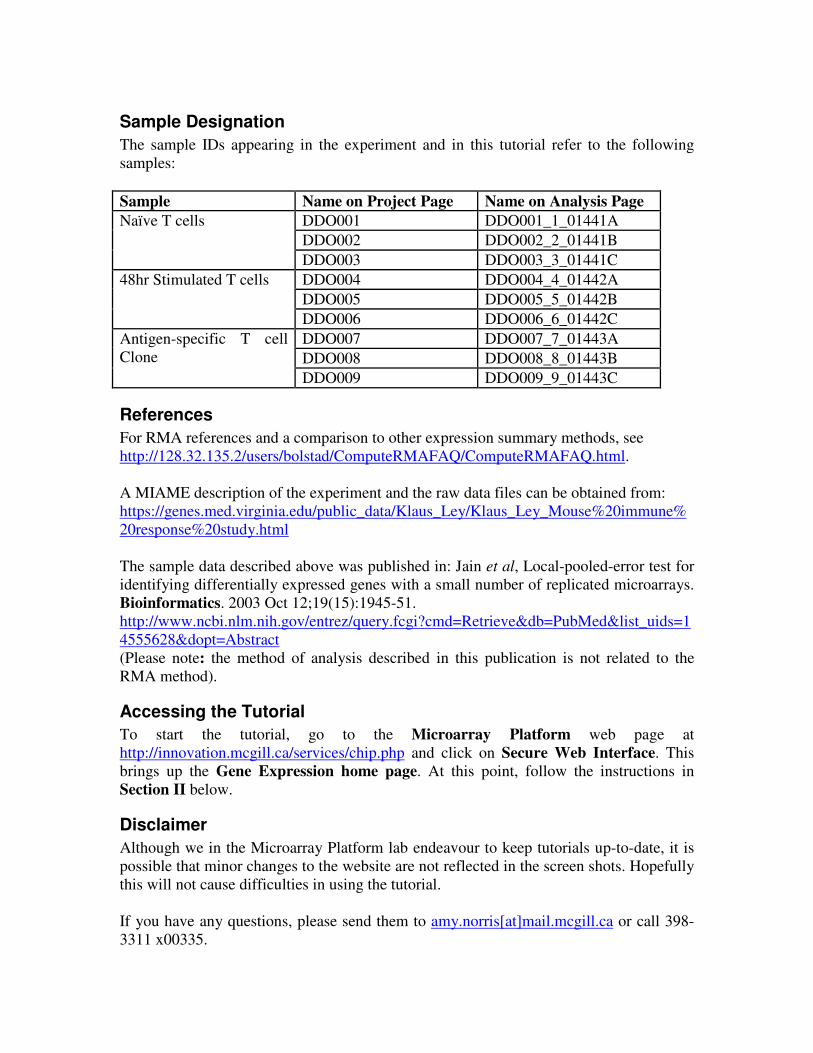
Sample Designation
The sample IDs appearing in the experiment and in this tutorial refer to the following
samples:
Sample Name on Project Page Name on Analysis Page
DDO001 DDO001_1_01441A
DDO002 DDO002_2_01441B
Naïve T cells
DDO003 DDO003_3_01441C
DDO004 DDO004_4_01442A
DDO005 DDO005_5_01442B
48hr Stimulated T cells
DDO006 DDO006_6_01442C
DDO007 DDO007_7_01443A
DDO008 DDO008_8_01443B
Antigen-specific T cell
Clone
DDO009 DDO009_9_01443C
References
For RMA references and a comparison to other expression summary methods, see
http://128.32.135.2/users/bolstad/ComputeRMAFAQ/ComputeRMAFAQ.html.
A MIAME description of the experiment and the raw data files can be obtained from:
https://genes.med.virginia.edu/public_data/Klaus_Ley/Klaus_Ley_Mouse%20immune%
20response%20study.html
The sample data described above was published in: Jain et al, Local-pooled-error test for
identifying differentially expressed genes with a small number of replicated microarrays.
Bioinformatics. 2003 Oct 12;19(15):1945-51.
http://www.ncbi.nlm.nih.gov/entrez/query.fcgi?cmd=Retrieve&db=PubMed&list_uids=1
4555628&dopt=Abstract
(Please note: the method of analysis described in this publication is not related to the
RMA method).
Accessing the Tutorial
To start the tutorial, go to the Microarray Platform web page at
http://innovation.mcgill.ca/services/chip.php and click on Secure Web Interface. This
brings up the Gene Expression home page. At this point, follow the instructions in
Section II below.
Disclaimer
Although we in the Microarray Platform lab endeavour to keep tutorials up-to-date, it is
possible that minor changes to the website are not reflected in the screen shots. Hopefully
this will not cause difficulties in using the tutorial.
If you have any questions, please send them to amy.norris[at]mail.mcgill.ca or call 398-
3311 x00335.

II Data Download The first step towards downloading data is to access the project where that data is stored.
The Project page contains all the information for one project and is the gateway to the
Download Page.
To access the Project page:
• Go to the Gene Expression home page at
https://genomequebec.mcgill.ca/mp/home.cgi?logout=en
• Log in to the demo account using the user login demo and password genome.
This brings up the Client Dominique Demo page.
• Click on the project name Demo001 from the Projects list appearing at the
bottom of the page.
On the Project page, each sample’s success at proceeding through all stages of the
microarray hybridization experiment is indicated. These results are summarized in the top
right hand corner of the Project page.
To access the Download page, select Download from the Navigate section of the left-
hand menu.
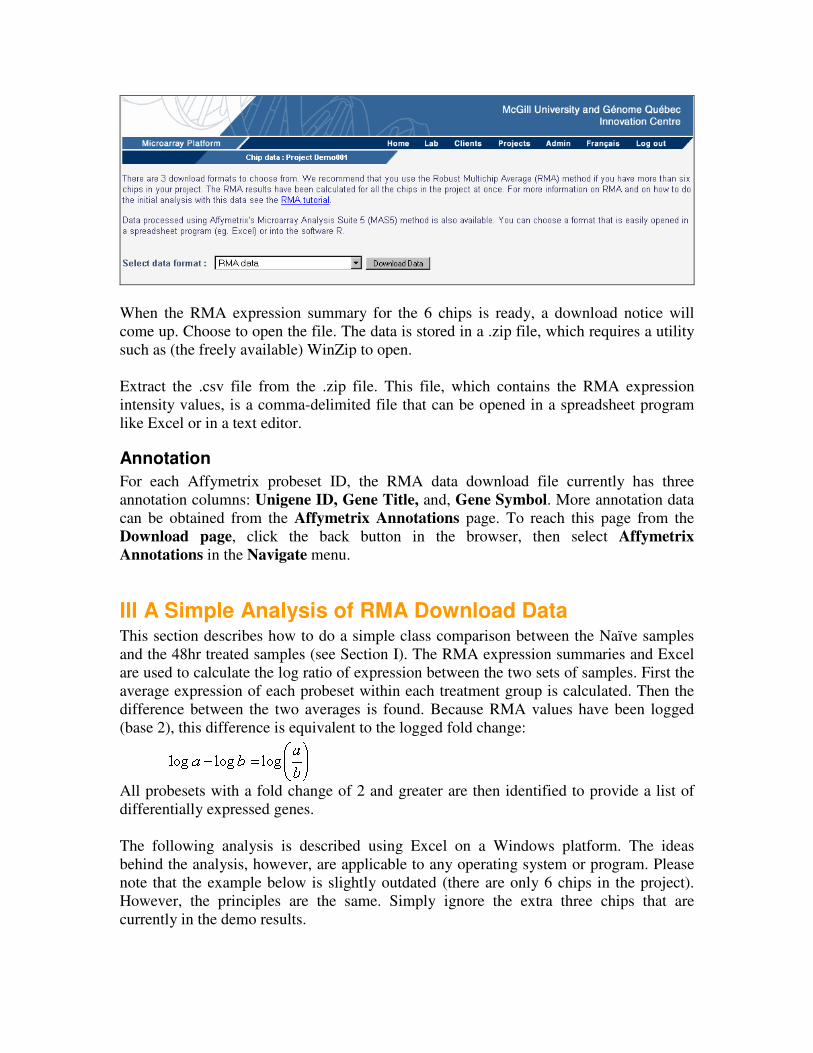
Array data can be obtained in several different formats from the Download Page:
Excel/Genespring MAS5.0, R formatted MAS5.0, and RMA. These formats describe the
methods of performing background correction, normalization, and expression summary
as well as the output format. To understand what these data processing steps do requires
some knowledge of the Affymetrix GeneChip technology.
Affymetrix arrays
The expression of a target gene is represented by the calculated signal intensity of a probe
set on an Affymetrix GeneChip. Each probe set is comprised of 11 or 16 pairs of probes,
depending on the chip type. A pair of probes consists of a perfect match and a mismatch
25-mer oligonucleotide. The mismatch is identical to the perfect match with the
exception of the middle nucleotide (which is the complementary base to the perfect
match) and is intended to provide a indication of the degree of cross-hybridization for
each probe.
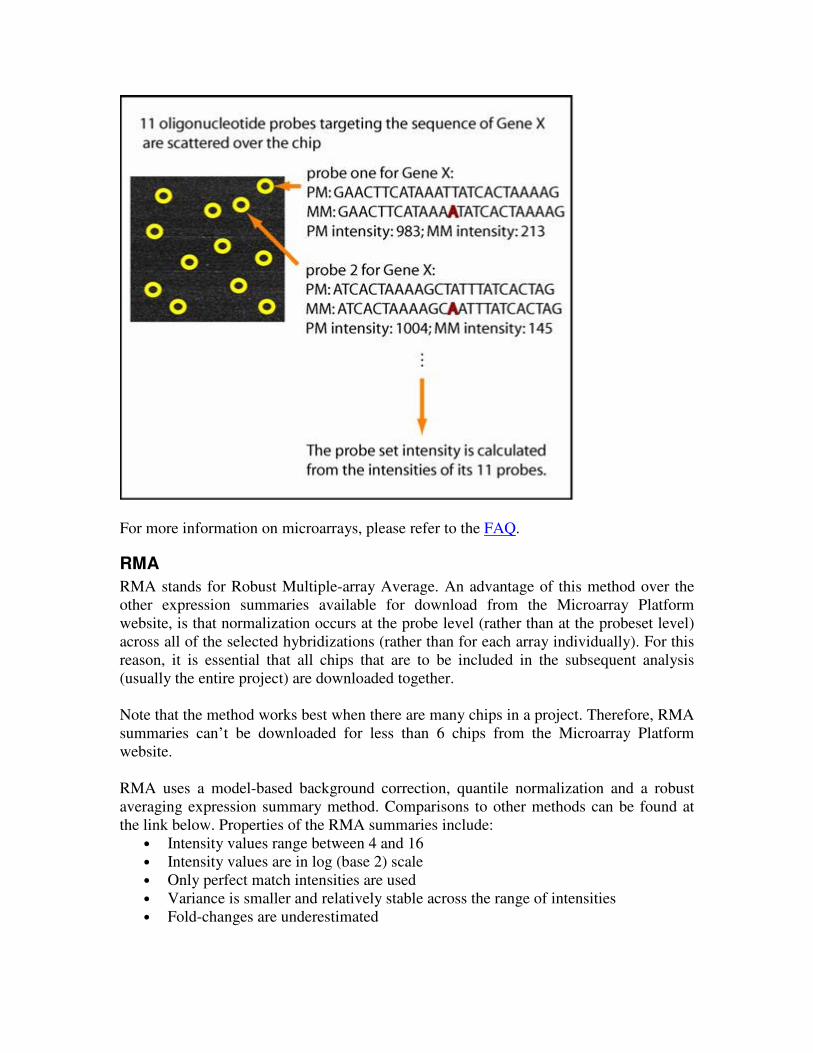
For more information on microarrays, please refer to the FAQ.
RMA
RMA stands for Robust Multiple-array Average. An advantage of this method over the
other expression summaries available for download from the Microarray Platform
website, is that normalization occurs at the probe level (rather than at the probeset level)
across all of the selected hybridizations (rather than for each array individually). For this
reason, it is essential that all chips that are to be included in the subsequent analysis
(usually the entire project) are downloaded together.
Note that the method works best when there are many chips in a project. Therefore, RMA
summaries can’t be downloaded for less than 6 chips from the Microarray Platform
website.
RMA uses a model-based background correction, quantile normalization and a robust
averaging expression summary method. Comparisons to other methods can be found at
the link below. Properties of the RMA summaries include:
• Intensity values range between 4 and 16
• Intensity values are in log (base 2) scale
• Only perfect match intensities are used
• Variance is smaller and relatively stable across the range of intensities
• Fold-changes are underestimated

For more details on RMA, please see Ben Bolstad’s RMA webpage:
http://128.32.135.2/users/bolstad/ComputeRMAFAQ/ComputeRMAFAQ.html.
The RMA output from the Download page is one .csv file that contains the intensity for
each probeset on each chip. The file can be opened in Excel or loaded into another
software program for analysis. A simple example of a fold-change calculation in Excel is
given in Section III.
How to Download
To download the expression summaries for the current project, click Download in the
Navigate section of the left-hand menu.
The default download format is RMA data. If you select another format from the
selection box, a list of chips will appear. With RMA there is no need to select chips,
because RMA normalisation is done on the whole project together. Simply click the
Download Data button.
When the RMA expression summary for the 6 chips is ready, a download notice will
come up. Choose to open the file. The data is stored in a .zip file, which requires a utility
such as (the freely available) WinZip to open.
Extract the .csv file from the .zip file. This file, which contains the RMA expression
intensity values, is a comma-delimited file that can be opened in a spreadsheet program
like Excel or in a text editor.
Annotation
For each Affymetrix probeset ID, the RMA data download file currently has three
annotation columns: Unigene ID, Gene Title, and, Gene Symbol. More annotation data
can be obtained from the Affymetrix Annotations page. To reach this page from the
Download page, click the back button in the browser, then select Affymetrix
Annotations in the Navigate menu.
III A Simple Analysis of RMA Download Data This section describes how to do a simple class comparison between the Naïve samples
and the 48hr treated samples (see Section I). The RMA expression summaries and Excel
are used to calculate the log ratio of expression between the two sets of samples. First the
average expression of each probeset within each treatment group is calculated. Then the
difference between the two averages is found. Because RMA values have been logged
(base 2), this difference is equivalent to the logged fold change:
All probesets with a fold change of 2 and greater are then identified to provide a list of
differentially expressed genes.
The following analysis is described using Excel on a Windows platform. The ideas
behind the analysis, however, are applicable to any operating system or program. Please
note that the example below is slightly outdated (there are only 6 chips in the project).
However, the principles are the same. Simply ignore the extra three chips that are
currently in the demo results.
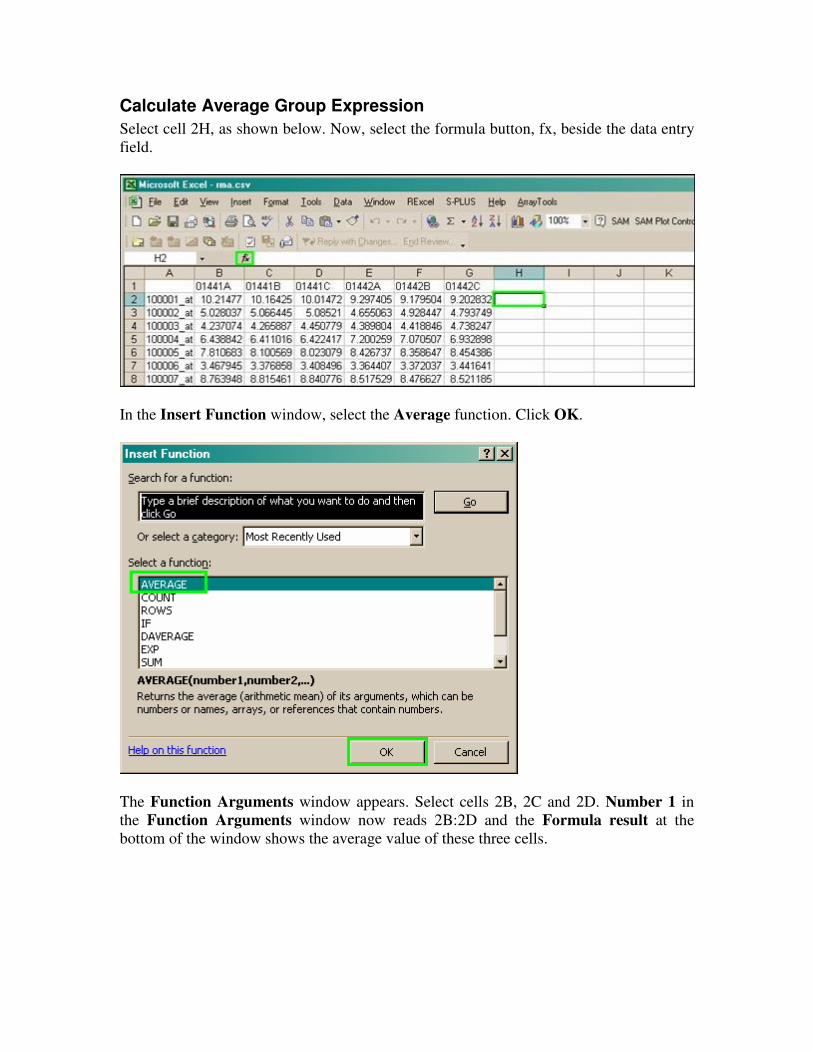
Calculate Average Group Expression
Select cell 2H, as shown below. Now, select the formula button, fx, beside the data entry
field.
In the Insert Function window, select the Average function. Click OK.
The Function Arguments window appears. Select cells 2B, 2C and 2D. Number 1 in
the Function Arguments window now reads 2B:2D and the Formula result at the
bottom of the window shows the average value of these three cells.
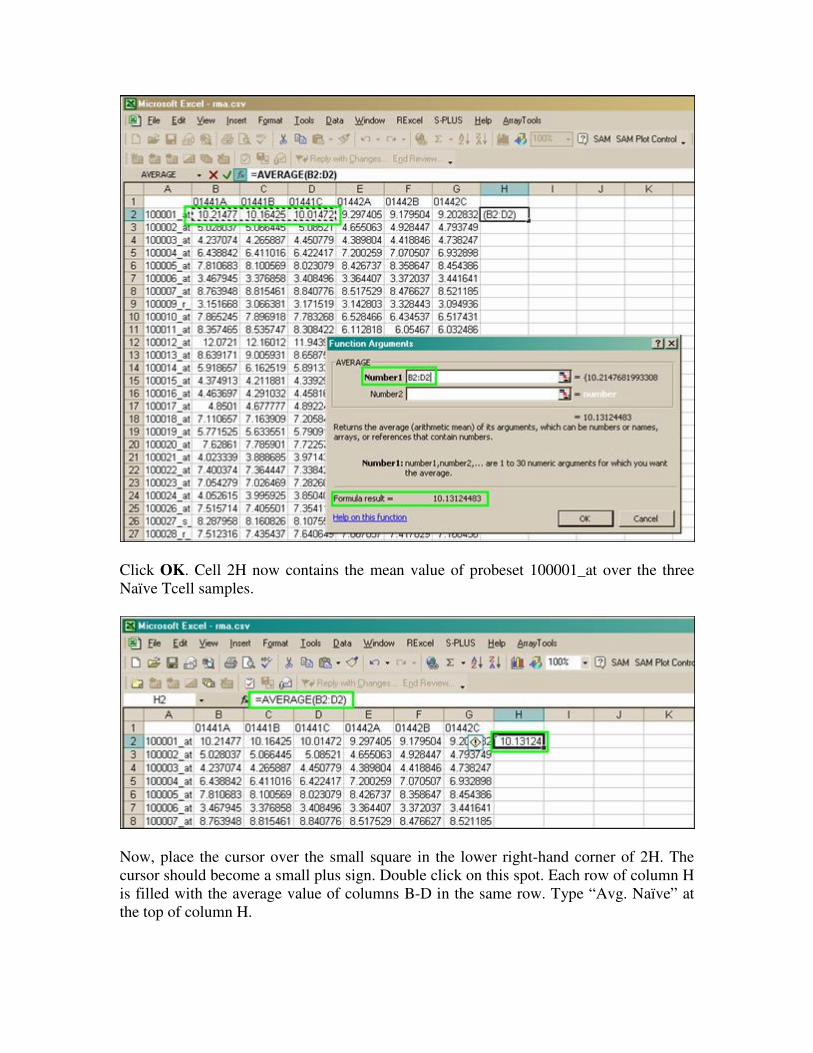
Click OK. Cell 2H now contains the mean value of probeset 100001_at over the three
Naïve Tcell samples.
Now, place the cursor over the small square in the lower right-hand corner of 2H. The
cursor should become a small plus sign. Double click on this spot. Each row of column H
is filled with the average value of columns B-D in the same row. Type “Avg. Naïve” at
the top of column H.
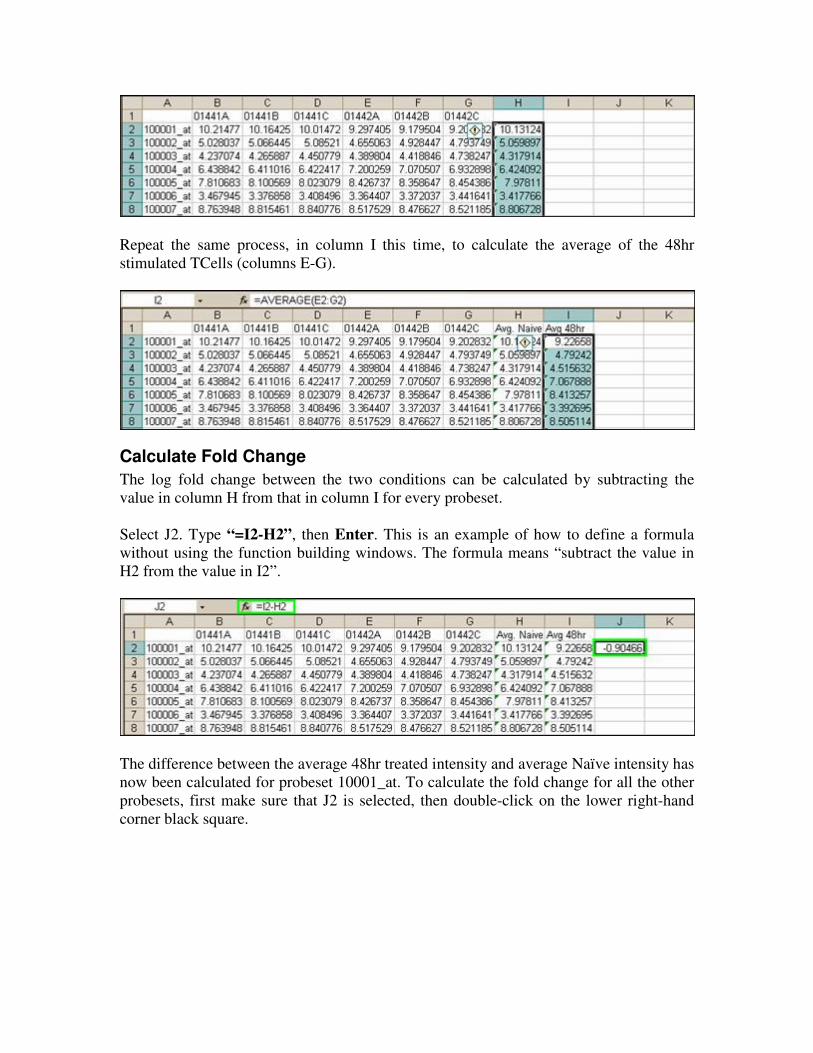
Repeat the same process, in column I this time, to calculate the average of the 48hr
stimulated TCells (columns E-G).
Calculate Fold Change
The log fold change between the two conditions can be calculated by subtracting the
value in column H from that in column I for every probeset.
Select J2. Type “=I2-H2”, then Enter. This is an example of how to define a formula
without using the function building windows. The formula means “subtract the value in
H2 from the value in I2”.
The difference between the average 48hr treated intensity and average Naïve intensity has
now been calculated for probeset 10001_at. To calculate the fold change for all the other
probesets, first make sure that J2 is selected, then double-click on the lower right-hand
corner black square.
Type in “log2 fold-change” as the title of column J. Note that these fold changes are in
log2 scale, that is, a value of 1 in this column indicates a fold-change of 2 (2^1) and a
value of -1 indicates a fold-change of ½ (2^{-1}). The former implies that the probeset is
induced by 2-fold in the 48hr treated samples, while the latter implies that the probeset is
repressed 2-fold in the 48hr treated samples.
Identify Differentially Expressed Genes
Finally, it is useful to find all the probesets that are induced or repressed by a given fold
change. For this, a conditional statement is required.
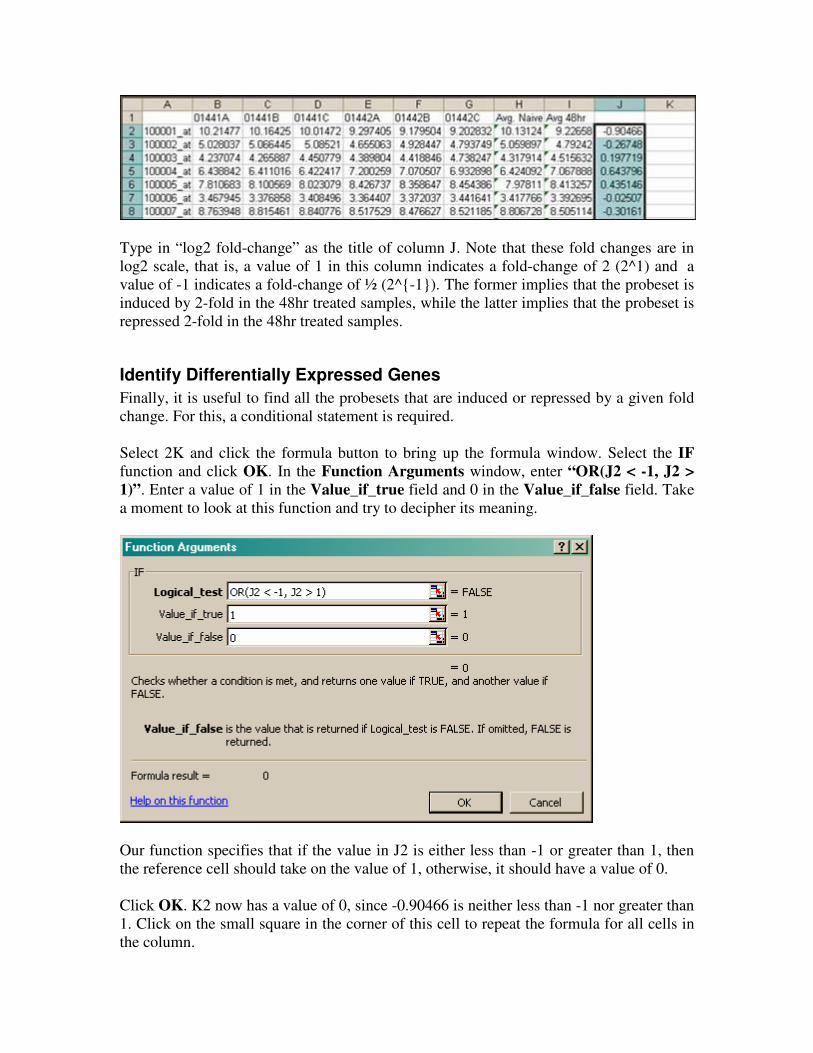
Select 2K and click the formula button to bring up the formula window. Select the IF
function and click OK. In the Function Arguments window, enter “OR(J2 < -1, J2 >
1)”. Enter a value of 1 in the Value_if_true field and 0 in the Value_if_false field. Take
a moment to look at this function and try to decipher its meaning.
Our function specifies that if the value in J2 is either less than -1 or greater than 1, then
the reference cell should take on the value of 1, otherwise, it should have a value of 0.
Click OK. K2 now has a value of 0, since -0.90466 is neither less than -1 nor greater than
1. Click on the small square in the corner of this cell to repeat the formula for all cells in
the column.
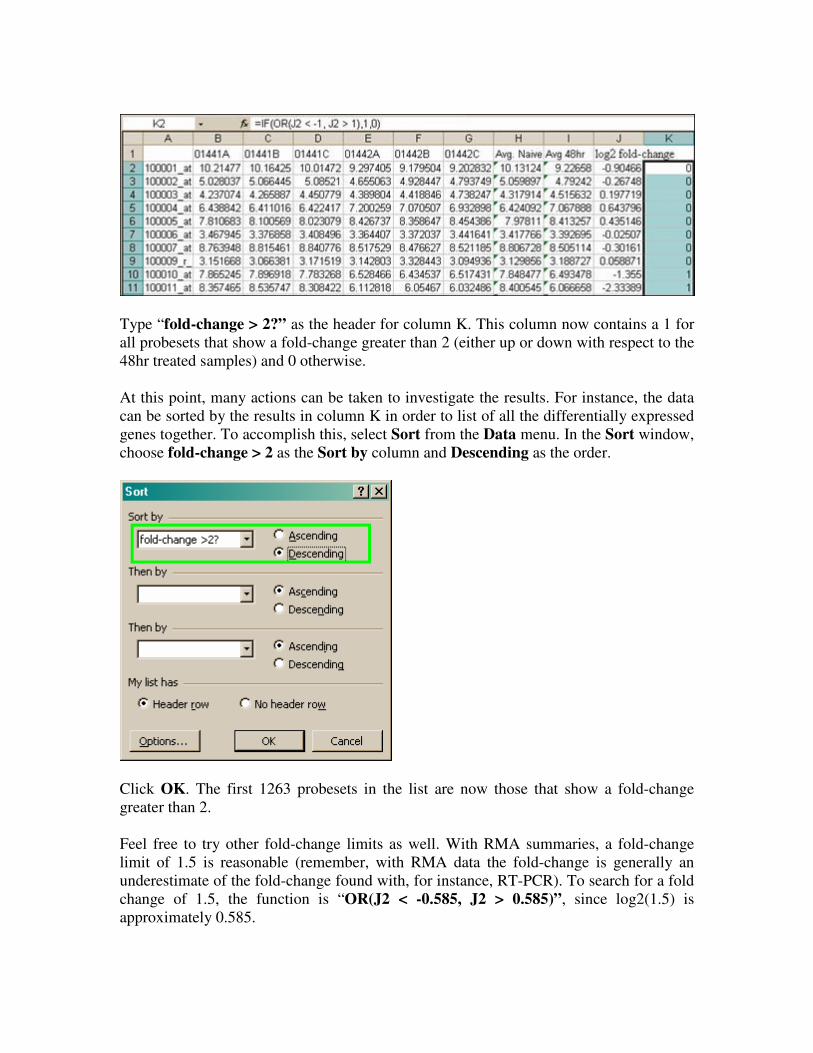
Type “fold-change > 2?” as the header for column K. This column now contains a 1 for
all probesets that show a fold-change greater than 2 (either up or down with respect to the
48hr treated samples) and 0 otherwise.
At this point, many actions can be taken to investigate the results. For instance, the data
can be sorted by the results in column K in order to list of all the differentially expressed
genes together. To accomplish this, select Sort from the Data menu. In the Sort window,
choose fold-change > 2 as the Sort by column and Descending as the order.
Click OK. The first 1263 probesets in the list are now those that show a fold-change
greater than 2.
Feel free to try other fold-change limits as well. With RMA summaries, a fold-change
limit of 1.5 is reasonable (remember, with RMA data the fold-change is generally an
underestimate of the fold-change found with, for instance, RT-PCR). To search for a fold
change of 1.5, the function is “OR(J2 < -0.585, J2 > 0.585)”, since log2(1.5) is
approximately 0.585.

IV Concluding Remarks Thank you for taking the time to go through the Microarray Platform RMA tutorial. At
this point you can download RMA results and perform a simple class comparison in
Excel that results in a list of differentially expressed genes.
If you have any questions or comments, please feel free to contact André Ponton.
Good luck!