tutorial: fundamentals of supercritical co2€¦ · 3 the following slides present an overview of...
TRANSCRIPT

The 6th International Supercritical CO2 Power Cycles Symposium March 27 - 29, 2018, Pittsburgh, Pennsylvania
Grant O. Musgrove
Shaun Sullivan Marc Portnoff
Heat Exchangers for Supercritical CO2 Power Cycle Applications
Tutorial:

Grant Musgrove (SwRI)
Shaun Sullivan (Brayton Energy)
Marc Portnoff (Thar Energy)
Heat Exchangers for Supercritical CO2 Power Cycle Applications
Tutorial:

3
The following slides present an overview of heat exchangers in supercritical CO2 applications
General heat exchanger overview and design trades
Heat exchanger mechanical design for sCO2
Hydraulic design and heat transfer in supercritical fluids
Specific heat exchangers for sCO2
0
20,000
40,000
60,000
80,000
100,000
120,000
0 500 1000 1500
kPr1/3
ν4/5
Temperature [K]
4.0 MPa
8.0 MPa
12 MPa
16 MPa


5
A fluid is supercritical if the pressure and temperature are greater than the critical values
Source: Musgrove et al. GT2012-70181

6
A power cycle is supercritical if part of the cycle takes place in the supercritical phase region
Source: Musgrove et al. GT2012-70181

7
A Rankine cycle requires heat exchangers for phase change Heat Input: • Typically indirect-fired like a boiler or
steam generator
Heat Rejection: • Cooling by air or condensing towers
Turb.
Boiler
Condenser
Qin
Qout
WT,out
1
2 3
4
PumpWP,in

8
A Brayton Cycle requires heat exchangers for single-phase heat transfer
Heat Input: • Direct-fired (oxy-combustion) • Indirect-fired like a boiler
Heat Rejection: • Closed-loop cycle – uses cooling water or
cooling air
Comp. Turb.
HP-HE
LP-HE
Qin
Qout
Wnet
1
2 3
4

9
A recuperator exchanges heat within the cycle to improve overall cycle thermal efficiency
Recuperators generally transfer heat between separated flow streams

10
The number and types of heat exchangers depend on the cycle design
Super-critical Brayton cycle: • Heater • Cooler • Single-phase heat transfer • Optional: High temperature recuperator for the cycle • Optional: Low temperature recuperator for the cycle • Optional: Recuperator for waste heat recovery
Super/trans-critical Rankine cycle: • Heater • Cooler • Multi-phase heat transfer (separator?) • Optional: High temperature recuperator • Optional: Low temperature recuperator

11
0.00.10.20.30.40.50.60.70.80.91.0
0 2 4 6 8 10 12 14 16
Eff
ectiv
enes
s (ε)
NTU
Concentric Tube, CounterflowCrossFlow (both unmixedCross Flow (Hot Mixed)Cross Flow (Cold Mixed)Shell and Tube - One Shell (TEMA E)Concentric Tube, Parallel flow
Most heat exchangers for sCO2 are a counter-flow configuration because of the high effectiveness
Courtesy Thar Energy, DE-FE0026273

12
Some Conventional Heat Exchanger Layouts
[1] Shah, R. K., and Sekulic, D. P., 2003, Fundamentals of Heat Exchanger Design, John Wiley & Sons, New Jersey. [2] Alfa Laval [4] Shah, R. K., and Sekulic, D. P., 2003, Fundamentals of Heat Exchanger Design, John Wiley & Sons, New Jersey.
[2]
[1]

13
Plate-type Configuration • Corrugated plates are stacked to create flow passages • Layers and corrugations provide rigidity and structural support • Plates are sealed by a gasket, weld, or braze – depending on operating conditions
[1] Thomas Wicht, 2011, “Phase change behavior of ammonia-water mixtures in corrugated plate heat exchangers.” [2] L. Wang, B. Sunden, and R.M. Manglik, 2007, Plate Heat Exchangers: Design, Applications and Performance, WIT Press. [3] Stuhrlingenterprise [4] Alfa Laval, “Alfa Laval Launches WideGap Heat Exchanger,”Ethanol Produce Magazine.
[1]
[2]
[2] [3]
[4]

14
Shell and Tube Heat Exchangers
[1] Shah, R. K., and Sekulic, D. P., 2003, Fundamentals of Heat Exchanger Design, John Wiley & Sons, New Jersey. [2] PRE-heat INC. [3] Southwest Thermal Technology, Inc
• Mechanical layout and design are detailed in ASME Boiler and Pressure Vessel Code and TEMA
• The conceptual layout is simple: • Casing • Tube bundle • Tube sheets • High pressure fluid usually in the tube
[1]
[2]
[3]

15
0
200
400
600
800
1000
0
10
20
30
40
50
60
Spi
ral P
late
Spi
ral P
late
Com
pabl
oc …
Pla
teP
latu
lar p
late
Lam
ella
Dou
ble
pipe
B
avex
Pla
teP
late
fin
Coi
led
tube
Bra
zed
plat
e fin
She
ll and
tube
Diff
usio
n …P
rinte
d ci
rcui
t
Max Temperature
[°C]Max Pressure
[MPa]
Heat exchanger type is dependent on the expected conditions
Data from: [1] Shah, R. K., and Sekulic, D. P., 2003, Fundamentals of Heat Exchanger Design, John Wiley & Sons, New Jersey. [2] Kuppan, T., 2000, Heat Exchanger Design Handbook, Taylor & Francis, New York.
*Max pressure and Max Temperature should not be combined to select a heat exchanger from this chart!

16
The sky is the limit for heat exchanger concepts
16 Courtesy Thar Energy, DE-FE0026273

17
How Much Heat Transfer Area in a Heat Exchanger?
Kakac, S., Bergles, A., and Mayinger, F., eds., 1981, Heat Exchangers: Thermal-Hydraulic Fundamentals and Design, Hemisphere Publishing Corporation, Washingtion.

18
The flow passage must decrease to pack more heat transfer area into the heat exchange volume


20
Heat exchanger design considerations sCO2 physical property variations require sensitivity checks • Operating conditions • Pressure levels • Off-design points including turn-down conditions need to be analyzed
for avoiding pinch point and reversal Plant efficiency vs HX CAPEX • Close temperature approach requires high effectiveness recuperators • High design temperature requires high nickel alloy

21
Tem
pera
ture
Distance along Heat Exchanger
Counter-Flow heat exchanger
Th,i
Th,o
Tc,i
Tc,o
Pinch Point
Real gas properties or phase change can create ‘pinch’ points in the temperature profile
Tem
pera
ture
Distance along Heat Exchanger
Counter-Flow heat exchanger
Th,i
Th,o
Tc,i
Tc,o
Pinch results in a poor design because the little-no heat is transfer when ∆T becomes very small

22
Recuperation can be split into high- and low-temperature units
Selecting the split point between recuperators is part of the cycle design

23
0.5
1.0
1.5
2.0
2.5
3.0
0.80 0.85 0.90 0.95 1.00
Rela
tive
chan
ge in
cos
t
Heat Exchanger Effectiveness [-]
Counterflow (NTU Ratio)Shiferaw 2016
The required effectiveness can have a dramatic impact on heat exchanger size and cost
Shiferaw, D., 2016, “Economic Analysis of SCO2 Cycles with PCHE Recuperator Design Optimisation.”
0.00.10.20.30.40.50.60.70.80.91.0
0 2 4 6 8 10 12 14 16
Eff
ectiv
enes
s (ε)
NTU
Concentric Tube, CounterflowCrossFlow (both unmixedCross Flow (Hot Mixed)Cross Flow (Cold Mixed)Shell and Tube - One Shell (TEMA E)Concentric Tube, Parallel flow

24
Economy of scale must also consider manufacturing limits as HXs are scaled to large thermal duties

25
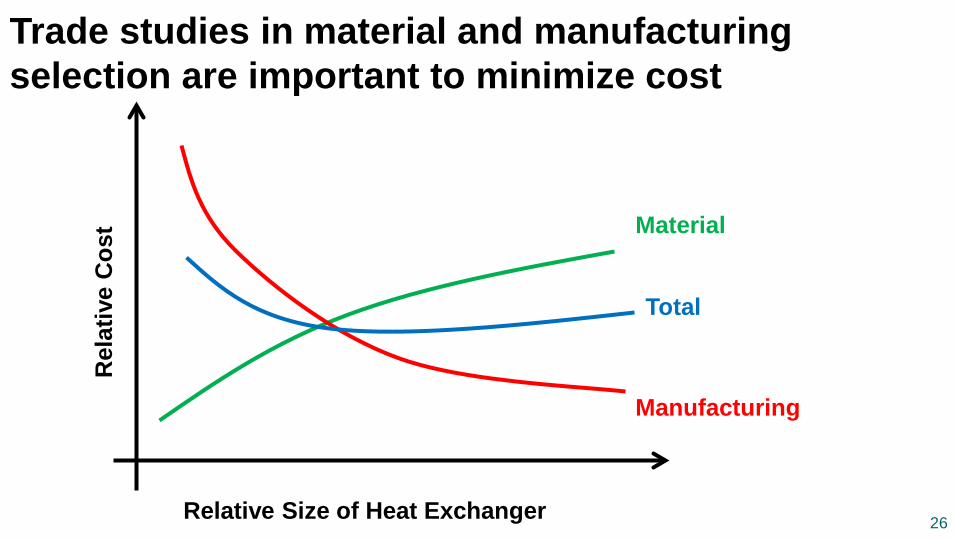
As passage size and overall volume require a trade between material and manufacturing costs
25
26
Trade studies in material and manufacturing selection are important to minimize cost
26 Relative Size of Heat Exchanger
Rel
ativ
e C
ost
Manufacturing
Material
Total

27
Many possible detail design options and trades for example, shell and tube
[1] Kakac, S., Bergles, A., and Mayinger, F., eds., 1981, Heat Exchangers: Thermal-Hydraulic Fundamentals and Design, Hemisphere Publishing Corporation, Washingtion.
Shell and Tube Casing and Head Tube bundle design

28
Complex design codes can be used to optimize a heat exchanger design

29
Performance, cost, and ASME code calculations can be combined for optimization
• Monte Carlo • Genetic algorithm • Response surface • Neural network
Genetic Algorithm Variables (Dia, # Tubes , Length) Objectives (Minimize Cost, Increase ε) Constraints (∆P, Thermal Duty)
Heat Exchanger Specific Geometry Initial Conditions ASME code calculations Cost estimates
mHX - source
Solution


31
Heatric PCHE PCHE
Printed Circuit Heat Exchanger H2X
Hybrid FPHE
Formed Plate Heat Exchanger

32
Main Components Etched plates
Diffusion bonded core
Headers, nozzles, flanges
Formed plates

33
Construction
1. Stack and Diffusion Bond Core
2. Block to block joints
3. Assemble headers, nozzles and flanges
4. Weld headers, nozzles and flanges to core
1. Stack and Diffusion Bond Core
2. Block to block joints
3. Assemble headers, nozzles and flanges

34
Core Details Current Typical Dimensions Channel Depth – 1.1 mm Plate Thickness – 1.69 mm Individual core block – 600 x 600 x 1500 mm Total unit length – 8500 mm Hydraulic Diameter – 1.5 mm
Cores are designed and values depend on thermal and hydraulic requirements

35
Operating Conditions
Design capabilities and maximum rated exchangers in operation.

36
Maintenance • Mechanical: Ultra High Pressure (UHP) water jetting • Chemical: Can be used with UHP or standalone
Broken down additive in header
before UHP …
… and after

Design & Test for Heat Exchangers in the sCO2 Brayton Cycle
Lalit Chordia, [email protected]
Marc [email protected]
Thar Energy, LLC © 2018│ All Rights Reserved

Content
HXs Design Consideration1
Benefit of Compact Microtube HXs2
sCO2 HXs Model3
sCO2 HXs Data4
Summary5
Thar Energy, LLC © 2018│ All Rights Reserved

1HXs Design Consideration
Recuperator
Heater
Cooler
Thar Energy, LLC © 2018│ All Rights Reserved

Standard sCO2 Brayton Cycle
RecuperatorCounter-flow heat exchanger that increases the system efficiency by reusing energy in exhaust sCO2 from turbine
HeaterCross-flow counter current heat exchanger that takes combustion gas to heat sCO2 to high temperature
CoolerHeat exchanger that utilizes water (counter flow) or air (cross flow) to cool sCO2 for compression
cooler heater
recuperator
compressor turbine
Thar Energy, LLC © 2018│ All Rights Reserved

HX design specification questions
Material of Construction• Physical Properties• Corrosion• Contamination potential
ASME Code Stamp/Design
Fouling Factor
Goal: Meet performance requirements and provide
margin of safety while minimizing over design.
Thar Energy, LLC © 2018│ All Rights Reserved
Fluid Stream 2T, P, Mass Flow
Thermal capacityEffectivenessPressure dropDesign T & PSize (L X W X H)
Fluid Stream 1T, P, Mass Flow
Design T increases material strength
drops & corrosion rates increase
Design T $
0
5
10
15
20
25
30
35
40
45
50
55
60
65
70
75
300 350 400 450 500 550 600 650 700 750 800 850 900 950 1000
Stre
ss (
ksi)
Temperature (°C)
H740 Allow
H282 Alow
H230 Allow
H625 Allow
Sanicro 25 Allow
316 SS Allow
740 CR 10K hr
282 CR 10K hr
230 CR 10K hr
625 CR 10K hr
Sanicro25 CR 10K hr
316 SS CR 10K hr
610°C
ASME Allowable Stress and 10,000 Hour Creep Rupture Values
Work supported by US DOE NETL under DE-FE0026273
Stre
ss (
ksi)
Temperature (°C)

1 High strength at high temperatureDesign to creep/rupture strength rather than yield strength
Material Selection
2 Select materials that can stand carbon corrosion and combustion gas corrosion
Corrosion
3 Design the structure to allow free thermal expansion under high temperature
Thermal Expansion
Heater Design Considerations
Design Conditions:
Combustion GasMax Temperature: 870°C
sCO2Max Temperature:715°CPressure: 280 bar
4 Air side pressure drop has to be under limit to ensure overall efficiency
Air Side Pressure Drop
Thar Energy, LLC © 2018│ All Rights Reserved

1•Nickel-Alloys to hold pressure under high temperature. (Inconel 625 / Stainless Steel 316H)•Design to yield strength or creep/rupture strength, depending on the metal and the design conditions•Carbon corrosion resistant
Material Selection
2 Design the structure to allow free thermal expansion under high temperature, such as floating head
Thermal Expansion
3 Recuperator has to have high efficiency (>90%) to maximize the efficiency of the whole cycle
High Efficiency
Recuperator Design Considerations
Design Conditions:Max Temperature: 575°CPressure: 280 bar / 100bar
4 Reduce capital investment
Lower Cost
5 Replaceable tube bundle and removable end cap
Easy Maintenance
Thar Energy, LLC © 2018│ All Rights Reserved
FloatingTube-Sheet Flange
Vessel Body
Fixed Tube-Sheet
Inconel 625 MicrotubeTube bundle
Cold High Pressure CO2
Hot High Pressure CO2
Hot Low Pressure CO2
Cold Low Pressure CO2
Flanged Pressure VesselHorizontal Separators - Counter-current

Finned-Tubes
Air cool
Brazed-Plate
Water coolMicrotubeWater cool
)
Cooler Design Considerations
1 More flexible due to low temperature. No one material is perfect for all applications. Tradeoffs in cost vs. reliability depends on water quality.
Material Selection
2 Apart from corrosion issue, erosion should also be taken into account.
Corrosion and Erosion
3 Water-cool heat exchanger requires regular maintenance.
Easy Maintenance
Design Conditions:Max Temperature: up to 100°CPressure: 100bar
Micro-channel
Air cool
Thar Energy, LLC © 2018│ All Rights Reserved

2Benefit of Compact Microtube HX
High Performance
Smaller Footprint
Lighter Weight
Thar Energy, LLC © 2018│ All Rights Reserved

Surface Density and
Heat transfer
coefficient of heat
exchangers are
significantly improved
by using microtube
Microtube Improves Performance
Tube Diameter [in]Rel
ativ
e U
A of
cou
nter
-cur
rent
HX
www.mezzotech.com
1 mm
7 mm
3 mm
0
50
100
150
200
250
300
350
400
450
0 0.2 0.4 0.6 0.8 1
Surf
ace
Den
sity
[in
^2/i
n^3
]
Tube Diameter [in]
1 mm
7 mm3 mm
Q = UA x ΔT
Thar Energy, LLC © 2018│ All Rights Reserved

Cross Flow, Counter-current Microtube Heater
Figs shows the overall size comparison of microtube and conventional tube air to CO2cross flow heat exchangers with different tube sizes with the same capacity, effectiveness and air side pressure drop
1mm tube vs. 3mm tube vs. 7mm tube
3.5’’
7’’
19’’
13’’
6’’
10.5’’
1mm 3mm 7mm
Total Tube Length 16,800’’ 9,240’’ 7,020’’
Tube Number 600 220 90
Bundle Weight 4.5 lb 20 lb 90 lb
Surface Density 46 in2/in3 17 in2/in3 7 in2/in3
Efficiency 89% 89% 89%
1mm tube vs. 3mm tube vs. 7mm tube
Thar Energy, LLC © 2018│ All Rights Reserved

Counter Flow Microtube Recuperator
Figs shows the overall size comparison of microtube and conventional tube counter-current heat exchangers with different tube sizes with the same capacity, effectiveness and pressure drop
With the same performance, microtubecounter-current heat exchanger is much more compact and lighter in weight
1mm 3mm 7mm
Tube Length 40’’ 135’’ 450’’
Tube Number 1500 175 30
Bundle Weight 17 lb 59 lb 244 lb
Surface Density 76 in2/in3 30 in2/in3 12 in2/in3
Efficiency 97% 97% 97%
40’’
135’’ 450’’
1mm tube vs. 3mm tube vs. 7mm tube
1mm tube vs. 3mm tube vs. 7mm tube
Thar Energy, LLC © 2018│ All Rights Reserved

Mircotube/Micro-channel Cooler
Micro-channel coils are generally 40% smaller, 40% more efficient, and use 50% less refrigerant than standard tube and fin coils. Air side pressure drop is also lower
At Thar’s test facility, air and CO2approaching temperature as low as 2°Fwas achieved using micro-channel coil.
60
70
80
90
100
110
120
130
140
150
160
170
310 315 320 325 330 335Te
mp
(d
eg
F)
Time (min.)
AHU_2_TE1 AHU_2_TE2 AHU_In_Temp AHU_Out_Temp
Higher Pressure - CO2 In
Higher Pressure - CO2 OutAmbient Air In
Ambient Air Out
~2°F Approach Temperature
Air In Air Out
CO2 In
CO2 Out
Thar Energy, LLC © 2018│ All Rights Reserved

3sCO2 HX Model Selection
Thar Energy, LLC © 2018│ All Rights Reserved

Heat Exchanger Calculation Method
CO2 P-H Diagram
Enthalpy
Pre
ssur
e
CO2 Cp-P Diagram
请插入图片(见教程)
Pressure
Hea
t Cap
acity
80 BAR
Used discretized model for sCO2 heat transfer calculation• Break the heat exchanger into n sections• Calculate average properties of each section• Interactively calculate the overall performance
Section 1 Section 2 Section n-1 Section n
Tout TinTave
CO2 K-P Diagram
请插入图片(见教程)
Pressure
Ther
mal
Con
duct
ivity
80 BAR
CO2 properties change dramatically with little variation in supercritical region
…
T&Pcold,out ?T&Pcold,inmcold,in
T&Phot,inmhot,in
T&Phot,out?
Thar Energy, LLC © 2018│ All Rights Reserved

Heat Transfer Equations
Martin (2002)
Air Side Nusselt Number2
Petukhov (1970)
CO2 Side Nusselt Number1
Bhatti and Shah (1987)
CO2 Side Pressure Drop3
Models selected from established heat transfer and pressure drop equations for the best accuracy compared to testing data
Zukauskas (1988)
Air Side Pressure Drop4
Thar Energy, LLC © 2018│ All Rights Reserved

4sCO2 HXs Test Loop and Data
Thar Energy, LLC © 2018│ All Rights Reserved

Thar Loop Compares to Standard Brayton Cycle
Enthalpy
Pre
ssur
e
Thar sCO2 HX Test Loop vs. a standard sCO2 Brayton Test Loop
Test Condition
Supercritical Carbon Dioxide• Operating Pressure: 255bar / 87bar• Operating Temperature: 570°C
Combustion Gas• Maximum Temperature: 750°C• Maximum Flow: 250 scfm @ 750°C
Different from Standard Loop
• Pump used in place of a compressor
• Turbine is replaced by back pressure regulator
Standard Brayton Cyclecooler
heater
recuperatorcompressor
turbine
Thar Energy, LLC © 2018│ All Rights Reserved

Thar sCO2 HX Test Loop
Purpose of Test Loop
1. Collect sCO2 performance data2. Validate calculation model3. Verify mechanical design and
material strength
Work supported by US DOE NETL under DE-FE0024012Thar Energy, LLC © 2018│ All Rights Reserved

Three Heat Exchangers in Loop
Heater
Microtube Cross-flow, Counter-current Heater
Material: Inconel 625 Design Max Temperature: 750°C Design Max Pressure: 280 bar
7’’
7’’
Recuperator
Microtube Counter-current Recuperator
Material: Inconel 625 & SS 316H Design CO2 High Side Pressure: 280 bar Design CO2 Low Side Pressure: 100 bar Maximum Temperature: 575°C
35’’3.5’’
Cooler
Counter-flow, Shell & Tube Water Cooler
Material: Stainless Steel 304 Design CO2 Pressure: 100 bar
126’’8’’
Work supported by US DOE NETL under DE-FE0024012 & DE-FE0025348Thar Energy, LLC © 2018│ All Rights Reserved

Data Collected
0
10
20
30
40
50
60
70
80
0
100
200
300
400
500
600
700
11
:04
11
:16
11
:27
11
:38
11
:49
12
:00
12
:11
12
:22
12
:33
12
:45
12
:56
13
:07
13
:19
13
:30
13
:41
13
:52
14
:03
14
:14
14
:25
14
:36
14
:47
14
:58
Hea
t Lo
ad [
kW]
Tem
per
atu
re [
C]
Cooler PerformanceQ-cooler Chilled Water InletCO2 Inlet Chilled Water OutletCO2 Outlet
0
10
20
30
40
50
60
70
80
0
100
200
300
400
500
600
700
11
:05
11
:18
11
:30
11
:42
11
:54
12
:06
12
:18
12
:30
12
:43
12
:55
13
:07
13
:20
13
:32
13
:44
13
:56
14
:08
14
:20
14
:32
14
:44
14
:56
Hea
t Lo
ad [
kW]
Tem
per
atu
re [
C]
Recuperator PerformanceQ-Recuperator HP CO2 InletHP CO2 Outlet LP CO2 InletLP CO2 Outlet
0
10
20
30
40
50
60
70
80
0
100
200
300
400
500
600
700
11
:05
11
:18
11
:30
11
:42
11
:54
12
:06
12
:18
12
:30
12
:43
12
:55
13
:07
13
:20
13
:32
13
:44
13
:56
14
:08
14
:20
14
:32
14
:44
14
:56
Hea
t Lo
ad [
kW]
Tem
pe
ratu
re [
C]
Heater Performance
Q-heater CO2 Inlet CO2 Outlet Gas Inlet Gas Outlet
Test Condition•CO2 flow rate: 7kg/min
•Low Pressure Side: 75bar
•High Pressure Side: 150 bar
•Blower at 40 Hz constant
Figures show effect of increasing combustion gas
temperature on heat exchangers’ performance
Thar Energy, LLC © 2018│ All Rights Reserved Work supported by US DOE NETL under DE-FE0024012 & DE-FE0025348
LP CO2 in
HP CO2 out
LP CO2 outHP CO2 in
Gas in LP CO2 in
Gas out
LP CO2 out

0
10
20
30
40
50
60
70
80
90
0 10 20 30 40 50 60 70 80 90
Act
ual
Q (
kW)
Predicted Q (kW)
Transferred heat Q
0%10%20%30%40%50%60%70%80%90%
100%
0% 10% 20% 30% 40% 50% 60% 70% 80% 90% 100%
Act
ual
Eff
icie
ncy
Predicted Efficiency
Efficiency
0
100
200
300
400
500
600
0 100 200 300 400 500 600
Act
ual
To
ut
[°C
]
Predicted T out [°C]
Cold Side Outlet Temperature
0
10
20
30
40
50
60
0 10 20 30 40 50 60
Act
ual
To
ut
[C]
Predicted T out [C]
Hot Side Outlet Temperature
Good linear relationship between actual data and calculated data
Comparison of Actual data vs. Prediction: Recuperator
Thar Energy, LLC © 2018│ All Rights Reserved Work supported by US DOE NETL under DE-FE0024012
Actu
al T
out (
°C)
Actu
al T
out (
°C)
Predicted Tout (°C)
Predicted Tout (°C)

0
100
200
300
400
500
600
0 100 200 300 400 500 600
Act
ual
T o
ut
[C]
Predicted T out [C]
Air Outlet Temperature
0
100
200
300
400
500
600
0 100 200 300 400 500 600
Act
ual
T o
ut
[C]
Predicted T out [C]
CO2 Outlet Temperature
0
5
10
15
20
25
30
35
0 5 10 15 20 25 30 35
Act
ual
Q (
kW)
Predicted Q (kW)
Transferred Heat Q
Good linear relationship between actual data and calculated dataActual performance ~10% better than prediction
Comparison of Actual data vs. Prediction: Heater
Thar Energy, LLC © 2018│ All Rights Reserved
0%
20%
40%
60%
80%
100%
0% 20% 40% 60% 80% 100%
Act
ual
Eff
icie
ncy
Predicted Efficiency
Efficiency
Work supported by US DOE NETL under DE-FE0024012 & DE-FE0025348
Actu
al T
out (
°C)
Actu
al T
out (
°C)
Predicted Tout (°C)
Predicted Tout (°C)

8
5Summary
Thar Energy, LLC © 2018│ All Rights Reserved

01
02
03
04
1• Select high strength and corrosion resistance material• Consider creep/rupture strength at high temperature• Allow for thermal expansion• Efficiency, cost, maintenance...
HXs Design Considerations
2 • Significantly improve thermal performance• Smaller footprint and lighter
Use of Microtube
3• Discretized model increases accuracy• Establish relationship between models and data
Heat Exchanger Calculation Model
4 • Microtube heat exchangers were successfully evaluated at Brayton cycle T & P conditions
• Test data confirms sCO2 microtube heat exchanger performance• Good correlation between design & actual heat exchanger
performance data
sCO2 Brayton Cycle Testing Data
Summary
Thar Energy, LLC © 2018│ All Rights Reserved

THANK YOU!QUESTIONS?
Thar Energy, LLC © 2018│ All Rights Reserved
Thar Energy, LLC150 Gamma DrivePittsburgh, PA 15238412-963-6500 [email protected]


2
Mercury-50 (4.6 MW)
(30, 65, and 200 kW) (250 and 333 kW) (70 and 250 kW)
WR-21 (25.2 MW)
Plate-Matrix Heat Exchangers – An Overview

3
The Plate-Matrix Unit Cell
Parting plates • provide fluid boundary
between the two flows
External low-pressure matrices • Enhances the heat transfer of the low-
pressure fluid as it flows between adjacent unit cells
Internal high-pressure matrix • Enhances the heat transfer of the high
pressure fluid as it flows between the two parting plates
• Can serves as structural features for high-pressure (sCO2) applications

4
Unit Cell Design
Plate-Matrix Heat Exchangers
Fully-welded pressure boundary ensures sealing
Brazed fins react high internal pressures by acting as tensile support members
Small hydraulic diameters, densely-packed fins, and thin walls enhance heat transfer
Individually tested for quality control
Customizable fin geometry

5
Straight Fin WavyFin Wire Mesh
Heat Transfer Matrices
Plate-Matrix Heat Exchangers

6
10mm Choosing a Matrix
• Cost • Mass • Footprint • Size (Volume)
Plate-Matrix Heat Exchangers

7
Air In
Air Out
CO2 In CO2 Out
• Manifolds and headers may be integrated directly cell • Easily configurable flow orientations:
• Counterflow for maximum heat exchanger potential • Crossflow for mismatched flows (e.g. radiator-type
applications)
The Unit Cell - Characteristics • Inspectable at the unit-cell level
• Identifies issues (leaks, poor bonds) at the earliest possible processing point
Plate-Matrix Heat Exchangers
• Avoids expensive scrap/repair for local defects
• Enables the independent specification of extended surfaces for each flow

8
Plate-Matrix Heat Exchanger Cell Counter Flows
Plate-Matrix Heat Exchangers
HP flow
LP flow
LP flow

9
Plate-Matrix Heat Exchanger Manifolds • Multiple unit-cells are attached to each other at the
high-pressure manifolds
Plate-Matrix Heat Exchangers Header Plate
Header Plate Core = n cells

10
Plate-Matrix Heat Exchanger Cores • Multiple unit-cells are attached to each other at the high-
pressure manifolds
Plate-Matrix Heat Exchangers

• Standard configurations mount modular cores in standard ASME-stamped pressure vessels and/or pipes – Compact high-performance surfaces
enable minimal volume solutions
• Alternative high-pressure packaging designs may require ASME qualification
Pressure Vessel Packaging
Plate-Matrix Heat Exchangers

12
Thermo-Mechanical Strain Tolerance • Non-monolithic construction provides
thermo-mechanical strain tolerance • Each unit cell represents a unique slip plane
within the assembly • The associated low mechanical stiffness can
accommodate temperature differences without inducing stresses on the assembly
Plate-Matrix Heat Exchangers
Cold (Isothermal)
Hot

13
Heat Exchanger Mechanical Design and Validation for S-CO2 Environments
Shaun Sullivan

14
Mission Definition
Mechanical Design and Simulations
Thermal and Strain Validation
& Endurance
Configured and Processed Materials
Characterization
Design Methodology

15
• Specify Requirements in terms of mission profiles – Including dwells and transient maneuvers
• Render thermal hydraulic design into mechanical design
• Initial analyses with substrate material properties:
– temperature – stress/strain – durability
• Characterize as configured/processed materials as loaded in operation – creep – fatigue
• Validate/calibrate temperature and strain with actual heat exchanger cells
• Validate design with accelerated endurance testing – greater ∆T – greater pressure – design temperatures at control points.
Requirements-to-Design Validation Method

16
• Finite Difference modeling captures the non-intuitive nonlinear physical properties of supercritical fluids within heat exchangers (particularly in vicinity of critical point)
• Enthalpy change is used to calculate the heat gain (or loss) so as to capture the significant pressure dependence of the internal energy of the fluid
– ∆h(T,P) used instead of �̇�𝑚𝑐𝑐𝑝𝑝(T)
Heat Transfer Modeling
• Axial conduction losses – which may be significant in high-ε designs – are captured for both the parent material and the heat transfer enhancing structures

17
• High solidity structures – thick-walled tubes, dense extended surfaces.
• Ni-Cr alloys with precipitates in grain boundaries
• Choices: Alloy 625, Alloy 617, Alloy 718, Alloy 230, HR214™, HR224™
• Be careful of thickness. Sheet properties may not represent foil. (Grain size vs. thickness?)
Creep Considerations
600°C 850°C 1000°C For 10,000 hour creep life at 70 MPa

18
Fatigue Considerations
HR120 elongation with exposure at 649, 760 and 871⁰C. Source: Pike & Srivastava Haynes Int’l
• Highly design dependent gradient selection for ∆T
• Structural compliance • Bigger is NOT stronger!
• Thick-thin avoidance
• Stress in weld-heat affected zones.
• Ductility – as processed, after
aging

19
Simulations
Wire-mesh analysis for creep and pressure-fatigue simulation.
• Conduct thermal and structural FEA to determine temperature, stress, and strain
• Identify ‘control points; - details where damage may accumulate
• Perform initial life analyses to quantify creep, and fatigue
Core strain analysis

20
Corrosion Considerations
Source: Sridharan, Anderson, et al - University of Wisconsin, sCO2 Power Cycle Symposium, Boulder, CO 2011
• Oxidation • Scale evaporation with high temperature
and/or humidity addition • Ni and Cr basic protection • Rare-earth additions to stabilize scale • Aluminum addition for very low volatile
Al2O3 scale over chromia • >20% Cr is key to oxidation resistance
at 650⁰C according to Sridharan et al.

21
Pint (ORNL) and Rakowski (Allegheny Ludlum), Effect of Water Vapor on the Oxidation Resistance of Stainless Steel
1. 0.25 mg/cm2 gain in sCO2 vs. 0.045 in laboratory air after 1,000 hours 2. Aluminum addition with addition of humidity?
Sridharan, Anderson, University of Wisconsin, et al, sCO2 Power Cycle Symposium, Boulder, CO 2011
Type 310SS 650⁰C Oxidation sCO2 vs. Air

22
Testing As Configured/Processed Material
This final batch of heat exchanger cells were of high quality, leak tight and suitable for creep tests
Tube ends during assembly of SN073 thru SN089
EXAMPLE • Example: If pressure is the steady load dominating creep or fatigue, pressure is used in characterization
• Includes all configuration and processing effects
• Avoids interpretation of ‘like’ data and loading.
• sCO2 pressurization for possible corrosion interaction

23
Thermo-Mechanical Fatigue Testing
Radiant (High Flux) Test Rig
• If high radiant flux loads produce damage, material is characterized accordingly
• Burner rig or furnace is appropriate for characterization under cyclic convective loading
High Temperature Furnace


25
Hydraulic Design – Supercritical Fluids
∆𝑷𝑷𝒊𝒊𝒊𝒊𝒊𝒊𝒊𝒊𝒊𝒊𝒊𝒊𝒊𝒊𝒊𝒊 𝒇𝒇𝒊𝒊𝒇𝒇𝒇𝒇= 𝒇𝒇 𝑳𝑳𝑫𝑫𝒉𝒉
𝟏𝟏𝟐𝟐
𝝆𝝆 𝑽𝑽𝟐𝟐
𝑽𝑽 = �̇�𝒎𝝆𝝆 𝑨𝑨𝒇𝒇
𝒇𝒇 = 𝒇𝒇 𝒊𝒊,𝑫𝑫𝒉𝒉,𝑽𝑽,𝝆𝝆,𝝁𝝁 Geometric parameters Fluid properties and mass flow
∆𝑷𝑷𝒊𝒊𝒇𝒇𝒊𝒊𝒊𝒊𝒊𝒊 = ∆𝑷𝑷𝒊𝒊𝒊𝒊𝒊𝒊𝒊𝒊𝒊𝒊 𝒎𝒎𝒊𝒊𝒊𝒊𝒊𝒊𝒇𝒇𝒇𝒇𝒊𝒊𝒎𝒎 + ∆𝑷𝑷𝒊𝒊𝒊𝒊𝒊𝒊𝒊𝒊𝒊𝒊𝒊𝒊𝒆𝒆𝒊𝒊 + ∆𝑷𝑷𝒊𝒊𝒊𝒊𝒊𝒊𝒊𝒊𝒊𝒊𝒊𝒊𝒊𝒊𝒊𝒊 𝒇𝒇𝒊𝒊𝒇𝒇𝒇𝒇 + ∆𝑷𝑷𝒊𝒊𝒆𝒆𝒊𝒊𝒊𝒊 + ∆𝑷𝑷𝒇𝒇𝒐𝒐𝒊𝒊𝒊𝒊𝒊𝒊𝒊𝒊 𝒎𝒎𝒊𝒊𝒊𝒊𝒊𝒊𝒇𝒇𝒇𝒇𝒊𝒊𝒎𝒎

26
• The non-linear behavior of supercritical fluids – particularly near the critical point – makes endpoint calculations risky – Finite difference or integrated methods necessary to
capture non-intuitive property behavior
• The strong property dependence on pressure makes sensible heat calculations risky – Use enthalpy change ∆h(T,P) to calculate energy gain or
loss, instead of �̇�𝑚𝑐𝑐𝑝𝑝
Hydraulic Design – Modeling Considerations

27
• Internal Flow – f may be derived from:
• Moody Chart • Kays and London (NB: friction factor f = 4*Fanning Friction Factor) • empirical correlation
• Porous Media
• Wire-Mesh • CFD
Hydraulic Design – Correlations and Calculations
∆𝑷𝑷 = 𝒇𝒇 𝑳𝑳𝑫𝑫𝒉𝒉
𝟏𝟏𝟐𝟐
𝝆𝝆 𝑽𝑽𝟐𝟐
G = internal mass velocity β = surface area/volume ε = porosity
∆𝑷𝑷 =𝑸𝑸𝝁𝝁𝑳𝑳 𝒌𝒌𝑨𝑨𝒇𝒇
Q = volumetric flow rate κ = permeability

Hydraulic Design – Flow Distribution • Headered or unheadered, the net pressure loss
along any given flow path will be the same • Uniform flow may be imposed by tailoring the area ratio to
account for differences in density and velocity profile • Headered channels may impose unequal flow resistances,
resulting in unequal passage flows • Performance must be assessed on a mass-averaged basis


2
Fluid property effects near the critical point allow for less approximations in heat exchanger sizing
Tem
pera
ture
, T
Entropy, S
Supercritical region
Tcrit
Pcrit
Liquidregion
Gasregion
Liquid + vaporregion

3
Fluid property effects near the critical point allow for less approximations in heat exchanger sizing
1
10
100
200 250 300 350 400
Cp
[J/k
g/K
]
Temperature [K]
4 MPa
8 MPa
12 MPa 16 MPa
20 MPa

4
Real gas properties or phase change can create ‘pinch’ points in the temperature profile
Results in a poor design because little-to-no heat is transferred when ∆T becomes very small
Distance along Heat Exchanger
Counter-Flow heat exchanger
Th,i
Th,o
Tc,i
Tc,o
Pinch Point
Tem
pera
ture

The calculated UA value can be used as a target value through the preliminary design process
5
Approximate the steady-state heat transfer path using thermal resistances
Cold
Hot
UA =1
ℎ𝐴𝐴 𝑐𝑐𝑐𝑐𝑐𝑐𝑐𝑐+𝑙𝑙𝑙𝑙 𝑅𝑅𝑖𝑖 𝑅𝑅𝑐𝑐⁄
2𝜋𝜋𝑘𝑘+
1ℎ𝐴𝐴 ℎ𝑐𝑐𝑜𝑜
−1
Th
(1/hA)cold (1/hA)hot
ln(Ri,OD/Ri,ID)/2πk
Tc

6
Typical approximations for heat exchanger sizing are not valid for near-critical sCO2
1𝑈𝑈𝐴𝐴 =
1ℎ𝐴𝐴 𝑖𝑖
+𝑙𝑙𝑙𝑙 𝐷𝐷𝑐𝑐
𝐷𝐷𝑖𝑖�
2𝜋𝜋𝑘𝑘𝑘𝑘 +1ℎ𝐴𝐴 𝑐𝑐
Overall heat transfer coefficient
Heat transfer 𝑄𝑄 = 𝑤𝑤 𝑖𝑖𝑐𝑐,𝑐𝑐 − 𝑖𝑖𝑐𝑐,𝑖𝑖 𝑄𝑄 = 𝑤𝑤𝐶𝐶𝑝𝑝 𝑇𝑇𝑐𝑐 − 𝑇𝑇𝑖𝑖
ℎ = 𝑓𝑓 𝑁𝑁𝑁𝑁 = 𝐶𝐶𝑅𝑅𝑅𝑅𝑥𝑥𝑃𝑃𝑃𝑃𝑦𝑦
Typical approximation General equation
𝑄𝑄 = 𝑈𝑈𝐴𝐴∆𝑇𝑇𝐿𝐿𝐿𝐿
𝑄𝑄 = 𝜀𝜀𝐶𝐶𝑚𝑚𝑖𝑖𝑚𝑚 𝑇𝑇ℎ,𝑖𝑖 − 𝑇𝑇𝑐𝑐,𝑖𝑖 𝜀𝜀 = 𝑓𝑓 𝑁𝑁𝑇𝑇𝑈𝑈,𝐶𝐶𝑚𝑚𝑖𝑖𝑚𝑚 𝐶𝐶𝑚𝑚𝑖𝑖𝑚𝑚 = 𝑚𝑚𝑖𝑖𝑙𝑙 𝑤𝑤𝐶𝐶𝑝𝑝 𝑐𝑐
, 𝑤𝑤𝐶𝐶𝑝𝑝 ℎ

7
Typical correlations based on average fluid properties are not applicable near the critical point
ThAQ ∆=
= yxPReLkfh r
Assume: x=4/5, y=1/3
ℎ = 𝑓𝑓𝑙𝑙𝑓𝑓 𝑘𝑘𝜈𝜈−𝑥𝑥𝑃𝑃𝑃𝑃𝑦𝑦
1,000
10,000
100,000
200 400 600 800 1000 1200
kPr1/3
ν4/5
Temperature [K]
4.0 MPa
8.0 MPa
12 MPa
16 MPa

8
Dittus-Boelter type correlations with property variation are valid when buoyancy is negligible
[Values from Jackson 2013]
m4
bp
pm3
b
wm2b
m1bb C
CPrCReNu
=
ρρ
b = bulk w = wall
Test data screened for buoyancy
0%10%20%30%40%50%60%70%80%90%
100%±20% CO2 Data±25% CO2 Data

Discretizing the heat exchanger accounts for property differences that affect fluid temperature
Operating conditions and geometry from: Pitla, S., Groll, E., and Ramadhyani, S., 2001, “Convective Heat Transfer from In-Tube Cooling of Turbulent Supercritical Carbon Dioxide: Part 2—Experimental Data and Numerical Predictions,” HVAC&R Research, 7(4), pp. 367–382.
280
300
320
340
360
380
400
0 5 10 15
Tem
pera
ture
[K]
Distance Along Heat Exchanger [m]
Discretization: CO2
e-NTU: CO2
Discretization: Water
e-NTU: Water
CO2
H2O
9

1D prediction methods match well with experimental measurements when the HX is discretized
Pitla, S., Groll, E., and Ramadhyani, S., 2001, “Convective Heat Transfer from In-Tube Cooling of Turbulent Supercritical Carbon Dioxide: Part 2—Experimental Data and Numerical Predictions,” HVAC&R Research, 7(4), pp. 367–382.
280
300
320
340
360
380
400
0 5 10 15
Tem
pera
ture
[K]
Distance Along Heat Exchanger [m]
Water temperature
Wall temperature
CO2
H2O
10

Detailed simulations may be needed for unconventional designs
11
Thermal modeling to inform 1D sizing models
Courtesy Thar Energy, DE-FE0026273

CHT simulations can be used to check the validity of assumptions in the 1D design process
Courtesy Thar Energy, DE-FE0026273
A modification factor ~0.75 should be used for the approximate UA value
Approximated value
CHT Model Results
Elliptical flow passages assumed for HTC
12

13
Questions?

14
Jackson, J.D., Hall, W.B., 1979a, “Influences of Buoyancy on Heat Transfer to Fluids Flowing in Vertical Tubes under Turbulent Conditions,” In: Kakac, S., Spalding, D.B. (Eds.), Turbulent Forced Convection in Channels and Bundles V2, Hemisphere Publishing Corporation, Washington, pp. 613-640. Jackson, J.D., Hall, W.B., 1979b, “Force Convection Heat Transfer to Fluids at Supercritical Pressure,” In: Kakac, S., Spalding, D.B. (Eds.), Turbulent Forced Convection in Channels and Bundles V2, Hemisphere Publishing Corporation, Washington, pp. 613-640. Jackson, J.D., “Progress in Developing an Improved Empirical Heat transfer Equation for use in Connection with Advanced Nuclear Reactors Cooled by Water at Supercritical Pressure,” Proceedings Int. Conf. Nucl. Eng., ICONE17-76022, 2009. Jackson, J.D., "Fluid Flow and Convective Heat Transfer to Fluids at Supercritical Pressure," Nucl. Eng. Des., 2013, http://dx.doi.org/10.1016/j.nucengdes.2012.09.040. Kim, W.S., He, S., Jackson, J.D., "Assessment by Comparison with DNS Data of Turbulence Models used in Simulations of Mixed Convection," Int. J. Heat Mass Transfer, 51, pp. 1293-1312, 2008. Mikielewixz, D.P., Shehata, A.M., Jackson, J.D., McEligot, D.M., “Temperature, Velocity and Mean Turbulence Structure in Strongly Heated Internal Gas Flows Comparison of Numerical Predictions with Data,” Int J Heat Mass Transfer, 45, pp. 4333-4352, 2002. Kruizenga, A., Anderson, M., Fatima, R., Corradini, M., Towne, A., Ranjan, D., "Heat Transfer of Supercritical Carbon Dioxide in Printed Circuit Heat Exchanger Geometries," J. Thermal Sci. Eng. Applications, 3, 2011. Le Pierres, R., Southall, D., Osborne, S., 2011, "Impact of Mechanical Deisng Issues on Printed Circuit Heat Exchangers," Supercritical CO2 Power Cycle Symposium. Liao, S.M., Zhao, T.S., "An Experimental Investigation of Convection Heat Transfer to Supercritical Carbon Dioxide in Miniature Tubes," Int. J. Heat Mass Transfer, 45, pp. 5025-5034, 2002. Musgrove, G.O., Rimpel, A.M., Wilkes, J.C., “Tutorial: Applications of Supercritical CO2 Power Cycles: Fundamentals and Design Considerations,” presented at International Gas Turbine and Aeroengine Congress and Exposition, Copenhagen, 2012. Pitla, S.S., Groll, E.A., Ramadhyani, S., “Convective Heat Transfer from In-Tube Cooling of Turbulent Supercritical Carbon Dioxide: Part 2 – Experimental Data and Numerical Predictions,” HVAC&R Research, 7(4), pp. 367-382, 2001. Nehrbauer, J., 2011, "Heat Exchanger Testing For Closed, Brayton Cycles Using Supercritical CO2 as the Working Fluid," Supercritical CO2 Power Cycle Symposium. Shiralkar, B., Griffith, P., “The Effect of Swirl, Inlet Conditions, Flow Direction and Tube Diameter on the Heat Transfer to Fluids at Supercritical Pressure,” ASME Proceedings, 69-WA/HT-1, also J. Heat Transfer, 92, pp. 465-474, 1970. Utamura, M., 2007, “Thermal-Hydraulic Characteristics of Microchannel Heat Exchanger and its Application to Solar Gas Turbines,” Proc. ASME Turbo Expo, GT2007-27296.

15
Backup Slides

16
Sandia Heat Exchangers used • HT Recuperator
- 2.27 MW - 482°C (900°F) - 17.24 MPa (2500 psig)
• LT Recuperator - 1.6 MW - 454°C (849°F) - 17.24 MPa (2500 psig)
• Gas Chiller - 0.53 MW - 149°C (300°F) - 19.31 MPa (2800 psig)
• 6 ‘Shell and Tube’ heaters - U tubes contained resistance wire heaters
Conboy et al

17
S-CO2 flow in vertical tubes indicates local heat transfer is a strong function of fluid properties
[Jackson 2013]
Inlet fluid temperature affects the axial location of the wall temperature peak
Flow direction and heat flux affect wall temperature distribution
Tem
pera
ture
°C
Normalised distance along heated section X/D
110
100
90
80
70
60
50
40
30
20
10120100806040200
[Jackson 2013]

18
S-CO2 flow conditions can reduce the effect of fluid property changes on local heat transfer
[Jackson 2013]
The upward flow direction produces a peak wall temperature at a low mass flow (Re~4x10⁴)
Upward and downward flow directions produce similar wall temperatures at high mass flow (Re~2.5x10⁵)
[Jackson 2013]

Materials Selection
19
0
5
10
15
20
25
30
35
40
45
50
55
60
65
70
75
300 350 400 450 500 550 600 650 700 750 800 850 900 950 1000
Stres
s (ks
i)
Temperature (°C)
H740 Allow
H282 Alow
H230 Allow
H625 Allow
Sanicro 25 Allow
316 SS Allow
740 CR 10K hr
282 CR 10K hr
230 CR 10K hr
625 CR 10K hr
Sanicro25 CR 10K hr
316 SS CR 10K hr
610°C
• Usually material selection is from ASME code cases • Material cost, strength, creep, corrosion allowance are factors in selection • Material availability is also important:
• Can the material be obtained in the desired form? (i.e. tubes, sheets, plates)
CO
ST
Material Strength
Required Material
Thickness Courtesy Thar Energy, DE-FE0026273

Corrosion
20
Corrosion occurs over a long period of time to build an oxide layer on the heat transfer surfaces
Time
Wei
ght G
ain Protective oxide formation curve
Courtesy Thar Energy, DE-FE0026273
Miller, 2016, “Comparative Testing of High Temperature Alloys for Supercritical CO2 Applications: A Preliminary Evaluation”, sCO2 Symposium, San Antonio, TX.

Corrosion
21
Corrosion of heat transfer surfaces • Caused by water or process fluids that oxidize the heat exchanger
material • Corrosion allowance should be accounted for during design • Careful material selection is important to reduce corrosion allowance
Image from Premier Separator Services Limited
Cao, G., Firouzdor, V., Sridharan, K., Anderson, M., and Allen, T. R., 2012, “Corrosion of austenitic alloys in high temperature supercritical carbon dioxide,” Corrosion Science, 60, pp. 246–255.

Design conditions should include margin on top of the operating conditions
Condition Temperature Pressure Comment Operating 400°C 15 bar Expected Operating Conditions Design 430°C 17.25 bar Add 30C margin and 5% for PSV
Guidance is available in ASME BPVC and in NORSOK P-001
The design temperature and pressure will allow some margin for the actual operation of the heat exchanger The design conditions may significantly affect the material selection and containment thickness

UA
Heat Exchanger Design Approach
𝑁𝑁𝑇𝑇𝑈𝑈 = 𝑓𝑓𝑙𝑙𝑓𝑓(𝜀𝜀,𝐶𝐶) 𝑈𝑈𝐴𝐴 = 𝑁𝑁𝑇𝑇𝑈𝑈 ∙ 𝐶𝐶𝑚𝑚𝑖𝑖𝑚𝑚
Requirements for heat exchanger
Heat exchanger layout, sizing
• Fluid inlet conditions • Thermal duty (Q)
• Fluid Inlet Conditions • Fluid Outlet Conditions
Use the LMTD Approach to get UA 𝑄𝑄 = 𝑈𝑈𝐴𝐴∆𝑇𝑇𝐿𝐿𝐿𝐿= �̇�𝑚 ℎℎ,𝑖𝑖 − ℎℎ,𝑐𝑐
Use the ε-NTU Method to get UA 𝑄𝑄 = 𝜀𝜀𝑄𝑄𝑚𝑚𝑚𝑚𝑥𝑥
No matter which approach is used, the same UA value will be calculated

24
Log Mean Temperature Difference (LMTD)
Tem
pera
ture
Distance along Heat Exchanger
Parallel flow heat exchanger
Th,i
Th,o
Tc,i
Tc,o
Adapted from Incropera & DeWitt, Introduction to Heat Transfer, 4th Ed., 2002.
dq
The LMTD method is derived from integrating the heat transfer along the heat exchanger
dq= 𝑈𝑈∆𝑇𝑇𝑇𝑇𝐴𝐴
Q= 𝑈𝑈𝐴𝐴 ∆𝑇𝑇2−∆𝑇𝑇1𝑐𝑐𝑚𝑚 ∆𝑇𝑇2 ∆𝑇𝑇1⁄

25
Log Mean Temperature Difference (LMTD)
Tem
pera
ture
Distance along Heat Exchanger
Counter-Flow heat exchanger
Th,i
Th,o
Tc,i
Tc,o
Adapted from Incropera & DeWitt, Introduction to Heat Transfer, 4th Ed., 2002.
The LMTD method is derived from integrating the heat transfer along the heat exchanger
dq= 𝑈𝑈∆𝑇𝑇𝑇𝑇𝐴𝐴
Q= 𝑈𝑈𝐴𝐴 ∆𝑇𝑇2−∆𝑇𝑇1𝑐𝑐𝑚𝑚 ∆𝑇𝑇2 ∆𝑇𝑇1⁄
dq

26
Calculating UA by the LMTD Method
Q= 𝑈𝑈𝐴𝐴 ∆𝑇𝑇2−∆𝑇𝑇1𝑐𝑐𝑚𝑚 ∆𝑇𝑇2 ∆𝑇𝑇1⁄
Counter-Flow
Parallel-Flow
𝑄𝑄 = �̇�𝑚 ℎℎ,𝑖𝑖 − ℎℎ,𝑐𝑐
UA
∆𝑇𝑇1= ∆𝑇𝑇ℎ,𝑖𝑖-∆𝑇𝑇𝑐𝑐,𝑖𝑖 ∆𝑇𝑇2= ∆𝑇𝑇ℎ,𝑐𝑐-∆𝑇𝑇𝑐𝑐,𝑐𝑐
∆𝑇𝑇1= ∆𝑇𝑇ℎ,𝑖𝑖-∆𝑇𝑇𝑐𝑐,𝑐𝑐 ∆𝑇𝑇2= ∆𝑇𝑇ℎ,𝑐𝑐-∆𝑇𝑇𝑐𝑐,𝑖𝑖
𝑇𝑇ℎ,𝑖𝑖
𝑇𝑇ℎ,𝑖𝑖
𝑇𝑇ℎ,𝑐𝑐
𝑇𝑇ℎ,𝑐𝑐
𝑇𝑇𝑐𝑐,𝑖𝑖
𝑇𝑇𝑐𝑐,𝑖𝑖
𝑇𝑇𝑐𝑐,𝑐𝑐
𝑇𝑇𝑐𝑐,𝑐𝑐

27
Variations on parallel-flow and counter-flow require a correction Factor 𝑄𝑄 = 𝐹𝐹𝑈𝑈𝐴𝐴∆𝑇𝑇𝐿𝐿𝐿𝐿
Figures from Incropera & DeWitt, Introduction to Heat Transfer, 4th Ed., 2002.

The effectiveness (ε) -NTU Method
28
• Fluid inlet conditions • Thermal duty (Q)
𝜀𝜀 =𝑄𝑄
𝑄𝑄𝑚𝑚𝑚𝑚𝑥𝑥
Qmax • Maximum heat transfer possible between the two fluids • Limited by the fluid with the least thermal capacitance
𝐶𝐶ℎ = �̇�𝑚ℎ𝐶𝐶𝑝𝑝,ℎ
𝑄𝑄𝑚𝑚𝑚𝑚𝑥𝑥 = 𝑚𝑚𝑖𝑖𝑙𝑙 𝐶𝐶𝑐𝑐 ,𝐶𝐶ℎ ∗ 𝑇𝑇ℎ,𝑖𝑖 − 𝑇𝑇𝑐𝑐,𝑖𝑖
𝐶𝐶𝑐𝑐 = �̇�𝑚𝑐𝑐𝐶𝐶𝑝𝑝,𝑐𝑐
𝑁𝑁𝑇𝑇𝑈𝑈 = 𝑓𝑓𝑙𝑙𝑓𝑓(𝜀𝜀,𝐶𝐶) 𝑈𝑈𝐴𝐴 = 𝑁𝑁𝑇𝑇𝑈𝑈 ∙ 𝐶𝐶𝑚𝑚𝑖𝑖𝑚𝑚 𝑄𝑄 = 𝜀𝜀𝑄𝑄𝑚𝑚𝑚𝑚𝑥𝑥

The effectiveness (ε) -NTU Method
29
• Fluid inlet conditions • Thermal duty (Q)
NTU = Net Transfer Units • Derivation provided in most heat transfer textbooks • Calculated from ε and ratio of Cmin/Cmax
𝑁𝑁𝑇𝑇𝑈𝑈 =−𝑙𝑙𝑙𝑙 1 − 𝜀𝜀 1 + 𝐶𝐶𝑟𝑟
1 + 𝐶𝐶𝑟𝑟
𝑁𝑁𝑇𝑇𝑈𝑈 = 𝑓𝑓𝑙𝑙𝑓𝑓(𝜀𝜀,𝐶𝐶) 𝑈𝑈𝐴𝐴 = 𝑁𝑁𝑇𝑇𝑈𝑈 ∙ 𝐶𝐶𝑚𝑚𝑖𝑖𝑚𝑚 𝑄𝑄 = 𝜀𝜀𝑄𝑄𝑚𝑚𝑚𝑚𝑥𝑥
𝑁𝑁𝑇𝑇𝑈𝑈 = 𝑓𝑓𝑙𝑙𝑓𝑓(𝜀𝜀,𝐶𝐶)
Cr = Cmin/Cmax
𝑁𝑁𝑇𝑇𝑈𝑈 =1
1 − 𝐶𝐶𝑟𝑟𝑙𝑙𝑙𝑙
𝜀𝜀 − 1𝜀𝜀𝐶𝐶𝑟𝑟 − 1
Cr < 1
Counter-Flow Parallel-Flow

The effectiveness (ε) -NTU Method
30
• Fluid inlet conditions • Thermal duty (Q) 𝑁𝑁𝑇𝑇𝑈𝑈 = 𝑓𝑓𝑙𝑙𝑓𝑓(𝜀𝜀,𝐶𝐶)
𝑈𝑈𝐴𝐴 = 𝑁𝑁𝑇𝑇𝑈𝑈 ∙ 𝐶𝐶𝑚𝑚𝑖𝑖𝑚𝑚 𝑄𝑄 = 𝜀𝜀𝑄𝑄𝑚𝑚𝑚𝑚𝑥𝑥
𝑈𝑈𝐴𝐴 = 𝑁𝑁𝑇𝑇𝑈𝑈 ∙ 𝐶𝐶𝑚𝑚𝑖𝑖𝑚𝑚 UA

0.00.10.20.30.40.50.60.70.80.91.0
0 2 4 6 8 10 12 14 16
Eff
ectiv
enes
s (ε)
NTU
Concentric Tube, CounterflowCrossFlow (both unmixedCross Flow (Hot Mixed)Cross Flow (Cold Mixed)Shell and Tube - One Shell (TEMA E)Concentric Tube, Parallel flow
The ε-NTU method is a good way to quickly identify heat exchanger types
31 Courtesy Thar Energy, DE-FE0026273

32
Validation is based on test data from [Pitla 2001]
An example counter-flow heat exchanger is used to illustrate calculation methods
Assumptions: •one-dimensional •steady-state •frictionless flow
CO2
H2O ṁ = 0.04011 kg/s Tin = 293.8 K
ṁ = 0.01963 kg/s Tin = 394.2 K

33
The test data is trans-critical

34
Water and CO2 wall temperature is used for validation
280
300
320
340
360
380
400
0 5 10 15
Tem
pera
ture
[K]
Distance Along Heat Exchanger [m]
Pitla 2001: Run 1, WaterPitla 2001: Run 1, Wall

35
Conventional heat exchanger calculation methods can be compared to a discretized enthalpy method
( ) ( ) ( ) 1inc,nh,
c
1i1nc,
inc, T-T
mUAhh −−
− += &
A 1st order, backward difference discretization of the energy equation (100 elements):
n = node i = iteration h = hot stream c = cold stream
ε-NTU Method (average fluid properties):
minCUANTU = [ ]
[ ])C-NTU(1-expC-1)C-NTU(1-exp-1
rr
r=ε
pCmC &=
ε = Q/Qmax = 32.5%
ε = Q/Qmax = 98.6%
ṁ = 0.04011 kg/s Tin = 293.8 K
ṁ = 0.01963 kg/s Tin = 394.2 K CO2
H2O

The heat exchanger should be discretized to accurately account for fluid property variations
Note: The heater is removed from the calculation
0
2
4
6
8
10
12
0 5 10 15
Spec
ific
Hea
t Cap
acity
(Cp)
[kJ/
kg/K
]
Distance Along Heat Exchanger [m]
Discretization: CO2e-NTU: CO2Discretization: Watere-NTU: Water

37
280
300
320
340
360
380
400
0 5 10 15
Tem
pera
ture
[K]
Distance Along Heat Exchanger [m]
Pitla 2001: Run 1, WallKrasnoshchekov: CO2 WallDittus-Boelter: CO2 WallPitla 2001: Run 1, WaterKrasnoshchekov: WaterDittus-Boelter: Water
Heat transfer variations from correlations can be negligible on temperature prediction
Approaching critical region

38
0
2000
4000
6000
8000
10000
12000
14000
16000
0 5 10 15
Hea
t Tra
nsfe
r Coe
ffici
ent [
W/m
2/K
]
Distance Along Heat Exchanger [m]
Pitla 2001: Run1Prediction: KrasnoshchekovPrediction: Dittus-Boelter
Property changes in the critical region cause heat transfer variations between correlations
Note: 30% uncertainty bars applied to correlations
Approaching critical region

39
CO2 density decreases near the critical point, which can induce buoyancy effects
REFPROP (2007)

40
Heat transfer deteriorates and recovers due to buoyancy effects near the wall
Wall heating reduces the fluid density near the wall to cause buoyant flow near the wall Growth of the buoyant wall layer causes the wall shear stress to decrease Turbulence production reduces as the shear stress decreases – causing a ‘laminarization’ of the flow Turbulence production is restored when the buoyant layer is thick enough to exert an upward force on the core flow
[1]
[2]
[3]
[4]
[1]
[2]
[3]
[4]
[Jackson 2013]
[Jackson 2013]

41
Temp
eratu
re °C
Normalised distance along heated section X/D
110
100
90
80
70
60
50
40
30
20
10120100806040200
Flow direction and heat flux affect the wall temperature distribution
Figures from [Jackson 2013]

42
Upward and downward flow produces similar wall temperatures at high Reynolds number
Figures from [Jackson 2013]
Temp
eratu
re °C
Normalised distance along heated section X/D
110
100
90
80
70
60
50
40
30
20
10120100806040200

43
Temp
eratu
re °C
Normalised distance along heated section X/D
110
100
90
80
70
60
50
40
30
20
10120100806040200
Upward flow produces a peak wall temperature at low Reynolds number
Figures from [Jackson 2013]

44
Inlet fluid temperature affects the axial location of the wall temperature peak
Figures from [Jackson 2013]
Temp
eratu
re °C
Normalised distance along heated section X/D
110
100
90
80
70
60
50
40
30
20
10120100806040200

45
Heat transfer deteriorates and recovers due to buoyancy effects near the wall
Figures from [Jackson 2013]
Flow direction

46
Heat transfer deteriorates and recovers due to buoyancy effects near the wall
[1]
Figures from [Jackson 2013]
Flow direction
Wall heating reduces the fluid density near the wall to cause buoyant flow near the wall

47
Heat transfer deteriorates and recovers due to buoyancy effects near the wall
[1]
[2]
Figures from [Jackson 2013]
Flow direction
[3]
Growth of the buoyant wall layer causes the wall shear stress to decrease

48
Heat transfer deteriorates and recovers due to buoyancy effects near the wall
[1]
[2]
[3]
[4]
Figures from [Jackson 2013]
Flow direction
Turbulence production is restored when the buoyant layer is thick enough to exert an upward force on the core flow

49
Buoyancy reduces or increases heat transfer in upward flow
Nu0 = Nusselt number for forced convection
51/2
w
b
b
w2.7
b
b 10Re
Gr −>
ρρ
µµ
The onset of buoyant effects in upward flow: [Jackson 1979a]
[Jackson 2013]

50
Buoyancy in downward flow increases heat transfer by increasing the shear stress
Nu0 = Nusselt number for forced convection [Jackson 2013]

51
Jackson, J.D., Hall, W.B., 1979a, “Influences of Buoyancy on Heat Transfer to Fluids Flowing in Vertical Tubes under Turbulent Conditions,” In: Kakac, S., Spalding, D.B. (Eds.), Turbulent Forced Convection in Channels and Bundles V2, Hemisphere Publishing Corporation, Washington, pp. 613-640.
Jackson, J.D., Hall, W.B., 1979b, “Force Convection Heat Transfer to Fluids at Supercritical Pressure,” In: Kakac, S., Spalding, D.B. (Eds.), Turbulent Forced Convection in Channels and Bundles V2, Hemisphere Publishing Corporation, Washington, pp. 613-640.
Jackson, J.D., “Progress in Developing an Improved Empirical Heat transfer Equation for use in Connection with Advanced Nuclear Reactors Cooled by Water at Supercritical Pressure,” Proceedings Int. Conf. Nucl. Eng., ICONE17-76022, 2009.
Jackson, J.D., "Fluid Flow and Convective Heat Transfer to Fluids at Supercritical Pressure," Nucl. Eng. Des., 2013, http://dx.doi.org/10.1016/j.nucengdes.2012.09.040.
Kim, W.S., He, S., Jackson, J.D., "Assessment by Comparison with DNS Data of Turbulence Models used in Simulations of Mixed Convection," Int. J. Heat Mass Transfer, 51, pp. 1293-1312, 2008.
Mikielewixz, D.P., Shehata, A.M., Jackson, J.D., McEligot, D.M., “Temperature, Velocity and Mean Turbulence Structure in Strongly Heated Internal Gas Flows Comparison of Numerical Predictions with Data,” Int J Heat Mass Transfer, 45, pp. 4333-4352, 2002.
Kruizenga, A., Anderson, M., Fatima, R., Corradini, M., Towne, A., Ranjan, D., "Heat Transfer of Supercritical Carbon Dioxide in Printed Circuit Heat Exchanger Geometries," J. Thermal Sci. Eng. Applications, 3, 2011.
Le Pierres, R., Southall, D., Osborne, S., 2011, "Impact of Mechanical Deisng Issues on Printed Circuit Heat Exchangers," Supercritical CO2 Power Cycle Symposium.
Liao, S.M., Zhao, T.S., "An Experimental Investigation of Convection Heat Transfer to Supercritical Carbon Dioxide in Miniature Tubes," Int. J. Heat Mass Transfer, 45, pp. 5025-5034, 2002.
Musgrove, G.O., Rimpel, A.M., Wilkes, J.C., “Tutorial: Applications of Supercritical CO2 Power Cycles: Fundamentals and Design Considerations,” presented at International Gas Turbine and Aeroengine Congress and Exposition, Copenhagen, 2012.
Pitla, S.S., Groll, E.A., Ramadhyani, S., “Convective Heat Transfer from In-Tube Cooling of Turbulent Supercritical Carbon Dioxide: Part 2 – Experimental Data and Numerical Predictions,” HVAC&R Research, 7(4), pp. 367-382, 2001.
Nehrbauer, J., 2011, "Heat Exchanger Testing For Closed, Brayton Cycles Using Supercritical CO2 as the Working Fluid," Supercritical CO2 Power Cycle Symposium.
Shiralkar, B., Griffith, P., “The Effect of Swirl, Inlet Conditions, Flow Direction and Tube Diameter on the Heat Transfer to Fluids at Supercritical Pressure,” ASME Proceedings, 69-WA/HT-1, also J. Heat Transfer, 92, pp. 465-474, 1970.
Utamura, M., 2007, “Thermal-Hydraulic Characteristics of Microchannel Heat Exchanger and its Application to Solar Gas Turbines,” Proc. ASME Turbo Expo, GT2007-27296.