tutorial: finding hotspots with intel ... - software.intel.com · get software tools you need the...
TRANSCRIPT

Tutorial: Finding Hotspots with Intel®VTune™ Amplifier - Windows*

Contents
Chapter 1: Navigation Quick Start
Chapter 2: Finding Hotspots (C++) Tutorial Use CaseVisual Studio* IDE: Choose Project and Build Application................................7Standalone GUI: Build Application and Create New Project ............................ 12Run Hotspots Analysis.............................................................................. 17Interpret Result Data ............................................................................... 19Analyze Code.......................................................................................... 23Tune Algorithms ...................................................................................... 25Compare with Previous Result ................................................................... 27
Chapter 3: Summary
Chapter 4: Key TermsLegal Information .............................................................................. 33
Tutorial: Finding Hotspots with Intel® VTune™ Amplifier - Windows*
2

Navigation Quick Start 1 Intel® VTune™ Amplifier provides information on code performance for users developing serial and
multithreaded applications on Windows*, Linux*, Android*, and macOS* operating systems. VTune Amplifierhelps you analyze algorithm choices and identify where and how your application can benefit from availablehardware resources.
VTune Amplifier AccessTo access the VTune Amplifier in the Visual Studio* IDE: From the Windows* Start menu, chooseIntel_Studio_version > Launch VS_version. For example: Intel® Parallel Studio 2019 > LaunchVS2015.
NOTEFor more details on the Visual Studio integration, refer to the Microsoft Visual Studio Integration help.
To access the standalone VTune Amplifier GUI, do one of the following:
• For Intel System Studio users: open the Intel® System Studio Eclipse* IDE and select VTune Amplifierfrom the Tools menu.
• For VTune Amplifier standalone version: search for Intel VTune Amplifer version.
To launch the VTune Amplifier from the command line, set up the environment variable by running the<install-dir>\amplxe-vars.bat file, where <install-dir> is [Program Files]\IntelSWTools\VTune Amplifier version.
Navigation Quick Start 1
3

Standalone VTune Amplifier GUI
Toolbar. Use the toolbar to configure and control data collection. Click the button to open/closethe Project Navigator. Use the Configure Analysis toolbar button to access an analysisconfiguration.
Menu. Use the VTune Amplifier menu to control data collection, define and view project properties,and set various options:
Project Navigator. Use to manage your project and collected analysis results.
Analysis type and viewpoint. View the correlation of the analysis result and a viewpoint used todisplay the collected data. The viewpoint is a pre-set configuration of windows/panes for an analysisresult. For most of analysis types, you can click the down arrow to switch among several viewpointsand focus on particular performance metrics.
Analysis Windows. Switch between window tabs to explore the analysis type configuration optionsand collected data provided by the selected viewpoint.
Grouping. Use the Grouping drop-down menu to choose a granularity level for grouping data in thegrid. Available groupings are based on the hierarchy of the program units and let you analyze thecollected data from different perspectives; for example, if you are developing specific modules in anapplication and interested only in their performance, you may select the Module/Function/CallStack grouping and view aggregated data per module functions.
1 Tutorial: Finding Hotspots with Intel® VTune™ Amplifier - Windows*
4
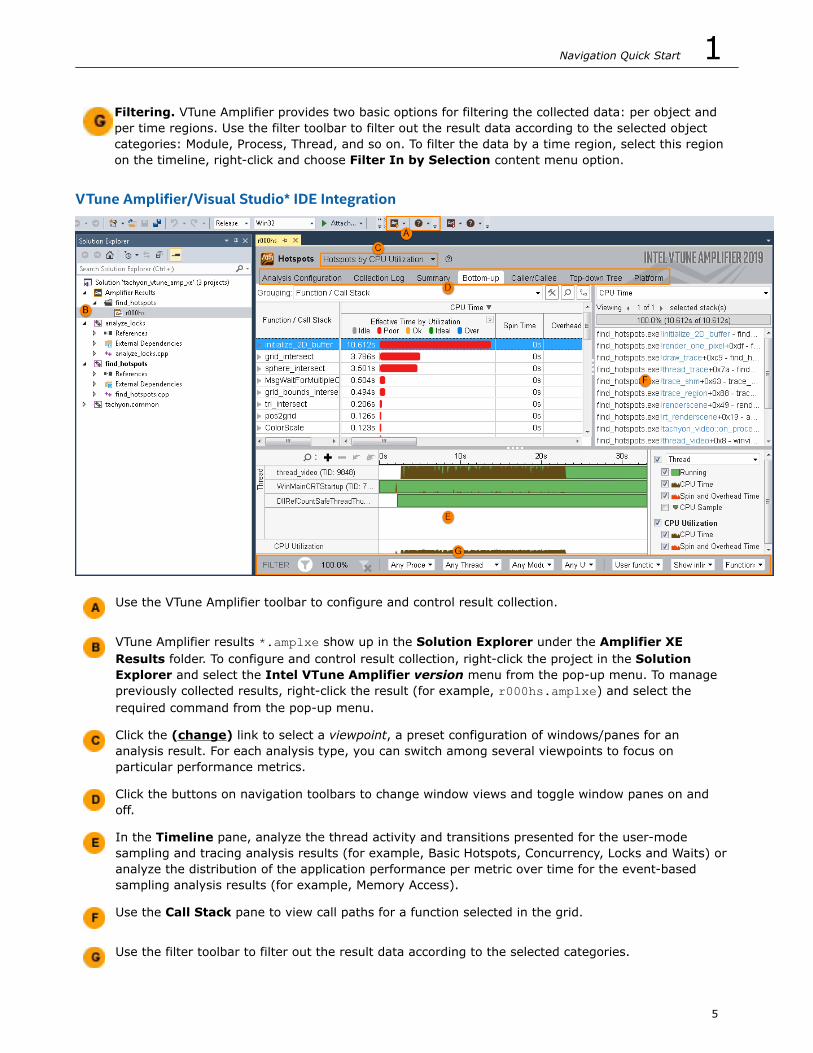
Filtering. VTune Amplifier provides two basic options for filtering the collected data: per object andper time regions. Use the filter toolbar to filter out the result data according to the selected objectcategories: Module, Process, Thread, and so on. To filter the data by a time region, select this regionon the timeline, right-click and choose Filter In by Selection content menu option.
VTune Amplifier/Visual Studio* IDE Integration
Use the VTune Amplifier toolbar to configure and control result collection.
VTune Amplifier results *.amplxe show up in the Solution Explorer under the Amplifier XEResults folder. To configure and control result collection, right-click the project in the SolutionExplorer and select the Intel VTune Amplifier version menu from the pop-up menu. To managepreviously collected results, right-click the result (for example, r000hs.amplxe) and select therequired command from the pop-up menu.
Click the (change) link to select a viewpoint, a preset configuration of windows/panes for ananalysis result. For each analysis type, you can switch among several viewpoints to focus onparticular performance metrics.
Click the buttons on navigation toolbars to change window views and toggle window panes on andoff.
In the Timeline pane, analyze the thread activity and transitions presented for the user-modesampling and tracing analysis results (for example, Basic Hotspots, Concurrency, Locks and Waits) oranalyze the distribution of the application performance per metric over time for the event-basedsampling analysis results (for example, Memory Access).
Use the Call Stack pane to view call paths for a function selected in the grid.
Use the filter toolbar to filter out the result data according to the selected categories.
Navigation Quick Start 1
5

Finding Hotspots (C++) TutorialUse Case 2
You can use the Intel® VTune™ Amplifier to identify and analyze hotspot functions in your serial orparallel application by performing a series of steps in a workflow. This tutorial guides you through theseworkflow steps while using a sample ray-tracer application named tachyon.
Step 1: Preparefor analysis
Do one of the following:
• In the Visual Studio* IDE: Choose a project, verify settings, build application,and create a baseline
• In the standalone Intel VTune Amplifier GUI: Build an application to analyze forhotspots, create a baseline, and create a new VTune Amplifier project
Step 2: Findhotspots
• Choose and run the Hotspots analysis.• Interpret the result data.• View and analyze code of the performance-critical function.
Step 3: Eliminatehotspots
Modify the code to tune the algorithms or rebuild the code with Intel® C++Compiler.
Step 4: Checkyour work
Re-build the target, re-run the Hotspots analysis, and compare the result databefore and after optimization.
2 Tutorial: Finding Hotspots with Intel® VTune™ Amplifier - Windows*
6
Visual Studio* IDE: Choose Project and Build Application
Before you start analyzing your application target for hotspots, do the following:
1. Get software tools.2. Choose a project.3. Configure the Microsoft* symbol server.4. Verify optimal compiler/linker options.5. Build the target in the release mode.6. Create a performance baseline.7. Launch the VTune Amplifier from Microsoft Visual Studio.
NOTE
• The steps below are provided for Microsoft Visual Studio 2013. They may slightly differ for otherversions of Visual Studio.
• Steps provided by this tutorial are generic and applicable to any application. You may choose tofollow the proposed workflow using your own application.
Get Software ToolsYou need the following tools to try tutorial steps yourself using the tachyon sample application:
• Intel® VTune™ Amplifier (Standalone or packaged with Intel® Parallel Studio XE or Intel® System Studio)• zip file extraction utility• Supported compiler (see Release Notes for more information); optionally, Intel® C++ Compiler
Acquire VTune Amplifier
If you do not already have access to the VTune Amplifier, you can download an evaluation copy from https://software.intel.com/en-us/intel-vtune-amplifier-xe.
Install and Set Up VTune Amplifier Sample Applications
1. Copy the tachyon_vtune_amp_xe.zip file from the <install-dir>\samples\locale\C++ to awriteable directory or share on your system.
NOTEThe default installation path for Intel VTune Amplifier is [Program Files]\IntelSWTools\VTuneAmplifier <version>.
2. Extract the sample from the .zip file.
NOTE
• Samples are non-deterministic. Your screens may vary from the screen captures shown throughoutthis tutorial.
• Samples are designed only to illustrate the VTune Amplifier features; they do not represent bestpractices for creating code.
Choose a ProjectChoose a project with the analysis target in the Visual Studio IDE as follows:
Finding Hotspots (C++) Tutorial Use Case 2
7

1. From the Visual Studio menu, select File > Open > Project/Solution....
The Open Project dialog box opens.2. In the Open Project dialog box, browse to the location you used to extract the
tachyon_vtune_amp_xe.zip file and select the tachyon_vtune_amp_xe.sln file.
The solution is added to Visual Studio IDE and shows up in the Solution Explorer.3. In the Solution Explorer, right-click the find_hotspots project and select Set as StartUp Project.
find_hotspots appears in bold in the Solution Explorer.
When you choose a project in Visual Studio IDE, the VTune Amplifier automatically creates theconfig.amplxeproj project file and sets the find_hotspots application as an analysis target in the projectproperties.
Configure the Microsoft* Symbol ServerConfigure the Visual Studio environment to download the debug information for system libraries so that theVTune Amplifier can properly identify system functions and classify/attribute functions.
1. Go to Tools > Options....
The Options dialog box opens.2. From the left pane, select Debugging > Symbols.3. In the Symbol file (.pdb) locations field, make sure the Microsoft Symbol Servers location is
selected. Otherwise, click the Add button, specify the following address: http://msdl.microsoft.com/download/symbols, and make sure the added address is checked.
4. In the Cache symbols in this directory field, specify a directory where the downloaded symbol fileswill be stored.
2 Tutorial: Finding Hotspots with Intel® VTune™ Amplifier - Windows*
8

5. Click OK.
Verify Optimal Compiler/Linker OptionsConfigure Visual Studio project properties to generate the debug information for your application so that theVTune Amplifier can open the source code.
1. Select the find_hotspots project and go to Project > Properties.2. From the find_hotspots Property Pages dialog box, select Configuration Properties > General
and make sure the selected Configuration (top of the dialog) is Release.3. From the find_hotspots Property Pages dialog box, select C/C++ > General pane and specify the
Debug Information Format as Program Database (/Zi).
Finding Hotspots (C++) Tutorial Use Case 2
9

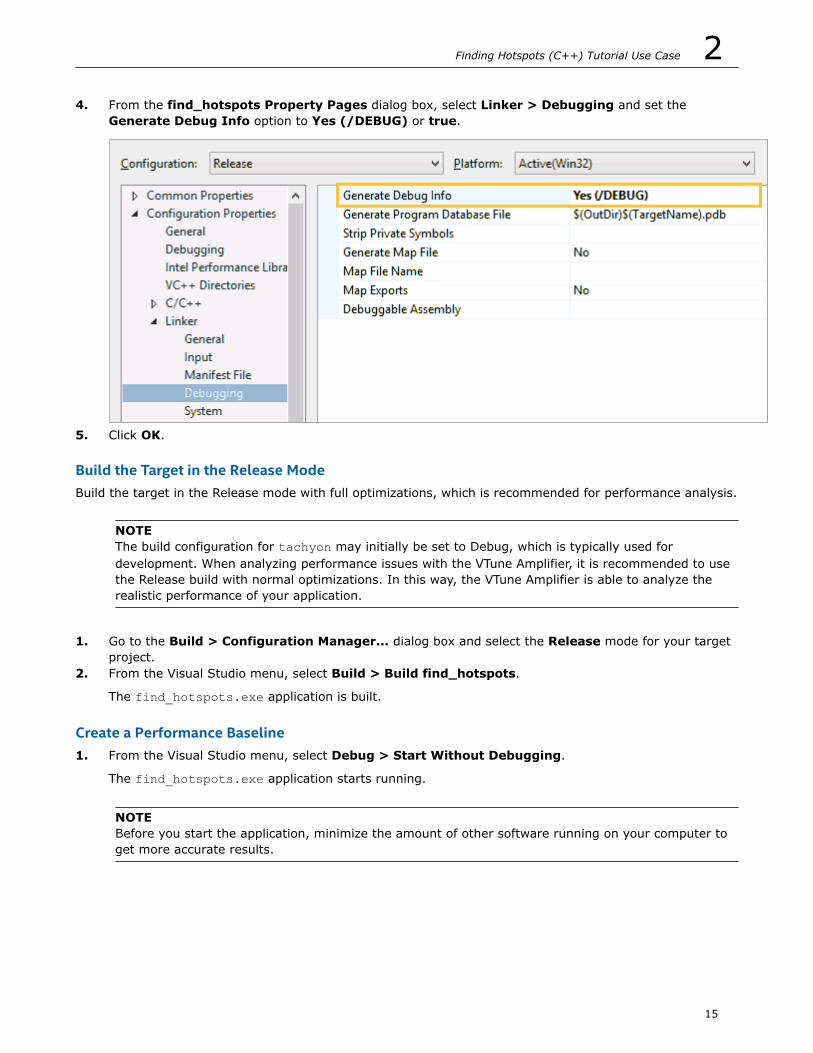
4. From the find_hotspots Property Pages dialog box, select Linker > Debugging and set theGenerate Debug Info option to Yes (/DEBUG) or true.
5. Click OK.
Build the Target in the Release ModeBuild the target in the Release mode with full optimizations, which is recommended for performance analysis.
NOTEThe build configuration for tachyon may initially be set to Debug, which is typically used fordevelopment. When analyzing performance issues with the VTune Amplifier, it is recommended to usethe Release build with normal optimizations. In this way, the VTune Amplifier is able to analyze therealistic performance of your application.
1. Go to the Build > Configuration Manager... dialog box and select the Release mode for your targetproject.
2. From the Visual Studio menu, select Build > Build find_hotspots.
The find_hotspots.exe application is built.
Create a Performance Baseline1. From the Visual Studio menu, select Debug > Start Without Debugging.
The find_hotspots.exe application starts running.
NOTEBefore you start the application, minimize the amount of other software running on your computer toget more accurate results.
2 Tutorial: Finding Hotspots with Intel® VTune™ Amplifier - Windows*
10

2. Note the execution time displayed in the window. For the find_hotspots.exe executable in the figureabove, the execution time is 15.484 seconds. The total execution time is the baseline against which youwill compare subsequent runs of the application.
NOTERun the application several times, note the execution time for each run, and use the average number.This helps to minimize skewed results due to transient system activity.
Launch the VTune Amplifier from Microsoft Visual Studio
To run an analysis from the Visual Studio IDE, click the button on the VTune Amplifier toolbar. TheVTune Amplifier uses your current project as the target application and the tachyon directory as the workingdirectory where the analysis results will be stored.
Key Terms• Baseline• Hotspot
Finding Hotspots (C++) Tutorial Use Case 2
11
• Target
Next StepRun Hotspots Analysis
Optimization Notice
Intel's compilers may or may not optimize to the same degree for non-Intel microprocessors foroptimizations that are not unique to Intel microprocessors. These optimizations include SSE2, SSE3, andSSSE3 instruction sets and other optimizations. Intel does not guarantee the availability, functionality, oreffectiveness of any optimization on microprocessors not manufactured by Intel. Microprocessor-dependent optimizations in this product are intended for use with Intel microprocessors. Certainoptimizations not specific to Intel microarchitecture are reserved for Intel microprocessors. Please refer tothe applicable product User and Reference Guides for more information regarding the specific instructionsets covered by this notice.
Notice revision #20110804
Standalone GUI: Build Application and Create New Project
Before you start analyzing your target application for hotspots, do the following:
1. Get software tools.2. Build application.
If you build the code in Visual Studio*, make sure to:
• Configure the Microsoft* symbol server.• Verify optimal compiler/linker options.• Build the target in the release mode.
3. Run the application without debugging to create a performance baseline.4. Create a VTune Amplifier project.
Get Software ToolsYou need the following tools to try tutorial steps yourself using the tachyon sample application:
• Intel® VTune™ Amplifier (Standalone or packaged with Intel® Parallel Studio XE or Intel® System Studio)• zip file extraction utility• Supported compiler (see Release Notes for more information); optionally, Intel® C++ Compiler
Acquire VTune Amplifier
If you do not already have access to the VTune Amplifier, you can download an evaluation copy from https://software.intel.com/en-us/intel-vtune-amplifier-xe.
Install and Set Up VTune Amplifier Sample Applications
1. Copy the tachyon_vtune_amp_xe.zip file from the <install-dir>\samples\<locale>\C++ to awriteable directory or share on your system.
NOTEThe default installation path for Intel VTune Amplifier is [Program Files]\IntelSWTools\VTuneAmplifier <version>.
2. Extract the sample from the zip file to a writeable directory or share on your system.
2 Tutorial: Finding Hotspots with Intel® VTune™ Amplifier - Windows*
12

NOTE
• Samples are non-deterministic. Your screens may vary from the screen captures shown throughoutthis tutorial.
• Samples are designed only to illustrate the VTune Amplifier features; they do not represent bestpractices for creating code.
Configure the Microsoft* Symbol ServerConfigure the Visual Studio environment to download the debug information for system libraries so that theVTune Amplifier can properly identify system functions and classify/attribute functions.
NOTEThe steps below are provided for Microsoft Visual Studio* 2013. They may differ slightly for otherversions of Visual Studio.
1. Go to Tools > Options....
The Options dialog box opens.2. From the left pane, select Debugging > Symbols.3.
In the Symbol file (.pdb) locations field, click the button and specify the following address:http://msdl.microsoft.com/download/symbols.
4. Make sure the added address is checked.5. In the Cache symbols in this directory field, specify a directory where the downloaded symbol files
will be stored.
Finding Hotspots (C++) Tutorial Use Case 2
13
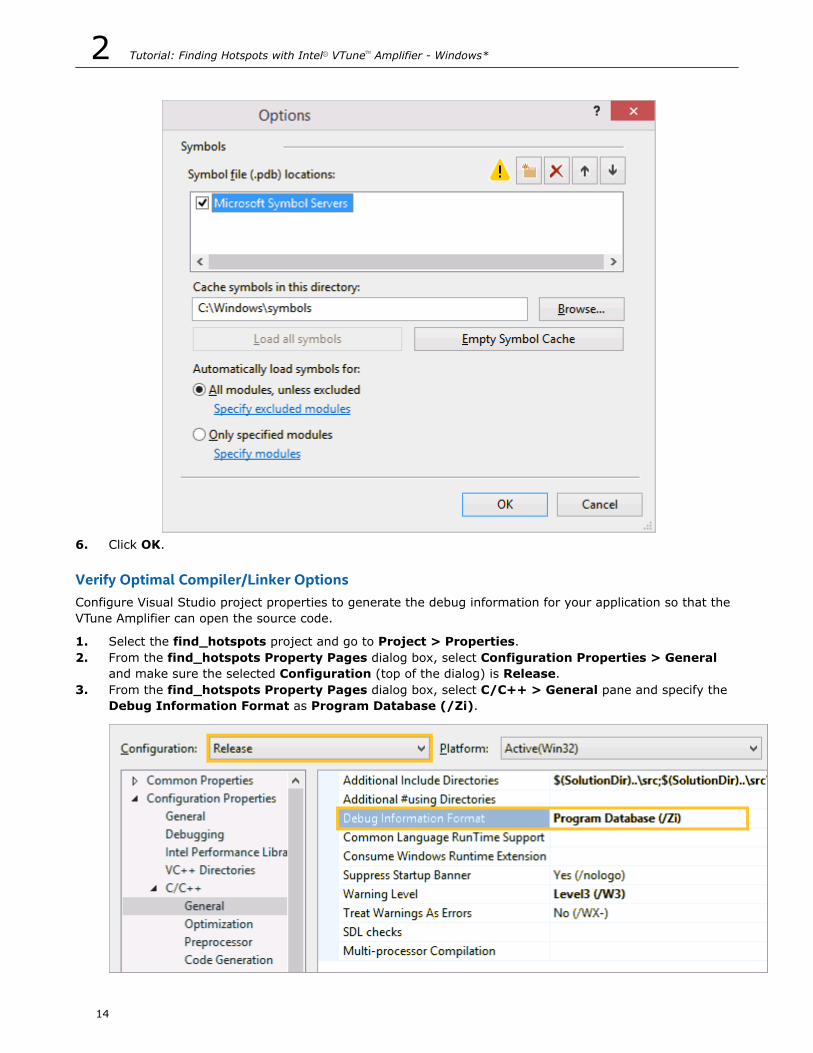
6. Click OK.
Verify Optimal Compiler/Linker OptionsConfigure Visual Studio project properties to generate the debug information for your application so that theVTune Amplifier can open the source code.
1. Select the find_hotspots project and go to Project > Properties.2. From the find_hotspots Property Pages dialog box, select Configuration Properties > General
and make sure the selected Configuration (top of the dialog) is Release.3. From the find_hotspots Property Pages dialog box, select C/C++ > General pane and specify the
Debug Information Format as Program Database (/Zi).
2 Tutorial: Finding Hotspots with Intel® VTune™ Amplifier - Windows*
14
4. From the find_hotspots Property Pages dialog box, select Linker > Debugging and set theGenerate Debug Info option to Yes (/DEBUG) or true.
5. Click OK.
Build the Target in the Release ModeBuild the target in the Release mode with full optimizations, which is recommended for performance analysis.
NOTEThe build configuration for tachyon may initially be set to Debug, which is typically used fordevelopment. When analyzing performance issues with the VTune Amplifier, it is recommended to usethe Release build with normal optimizations. In this way, the VTune Amplifier is able to analyze therealistic performance of your application.
1. Go to the Build > Configuration Manager... dialog box and select the Release mode for your targetproject.
2. From the Visual Studio menu, select Build > Build find_hotspots.
The find_hotspots.exe application is built.
Create a Performance Baseline1. From the Visual Studio menu, select Debug > Start Without Debugging.
The find_hotspots.exe application starts running.
NOTEBefore you start the application, minimize the amount of other software running on your computer toget more accurate results.
Finding Hotspots (C++) Tutorial Use Case 2
15

2. Note the execution time displayed in the window. For the find_hotspots.exe executable in the figureabove, the execution time is 15.484 seconds. The total execution time is the baseline against which youwill compare subsequent runs of the application.
NOTERun the application several times, note the execution time for each run, and use the average number.This helps to minimize skewed results due to transient system activity.
Create a ProjectTo analyze your target in the VTune Amplifier, you need to create a project, which is a container for ananalysis target configuration and data collection results.
1. From the Start menu, launch Intel VTune Amplifier version standalone GUI.2.
Click the menu button and select New > Project... to create a new project.
The Create a Project dialog box opens.3. Specify the project name tachyon that will be used as the project directory name, browse to a location
for the project files to be stored and click Create Project.
2 Tutorial: Finding Hotspots with Intel® VTune™ Amplifier - Windows*
16

VTune Amplifier creates the tachyon project directory under the specified directory.
Key Terms• Baseline• Target
Next StepRun Hotspots Analysis
Optimization Notice
Intel's compilers may or may not optimize to the same degree for non-Intel microprocessors foroptimizations that are not unique to Intel microprocessors. These optimizations include SSE2, SSE3, andSSSE3 instruction sets and other optimizations. Intel does not guarantee the availability, functionality, oreffectiveness of any optimization on microprocessors not manufactured by Intel. Microprocessor-dependent optimizations in this product are intended for use with Intel microprocessors. Certainoptimizations not specific to Intel microarchitecture are reserved for Intel microprocessors. Please refer tothe applicable product User and Reference Guides for more information regarding the specific instructionsets covered by this notice.
Notice revision #20110804
Run Hotspots Analysis
In this tutorial, you run the Hotspots analysis with user-mode sampling to identify the hotspots thattook much time to execute.
To run an analysis:
1.Click Configure Analysis to begin a new analysis.
The default analysis is pre-configured for the entry-level Hotspots analysis to profile an application ofyour choice on the local system.
2. Specify your application as follows:
• In the WHAT pane, browse to <sample_code_dir>\find_hotspots.exe, for example: C:\samples\tachyon\vc14\find_hotspots_Win32_Release\find_hotspots.exe.
• For the Application parameters field, enter <sample_code_dir>\dat\balls.dat.
Finding Hotspots (C++) Tutorial Use Case 2
17

3. Click the Start button to run the analysis.
Intel® VTune™ Amplifier launches the find_hotspots application that takes the balls.dat as input andrenders an image displaying the execution time before exiting. VTune Amplifier finalizes the collected resultsand opens the Hotspots viewpoint.
To make sure the performance of the application is repeatable, go through the entire tuning process on thesame system with a minimal amount of other software executing.
NOTEThis tutorial explains how to run an analysis from the VTune Amplifier graphical user interface (GUI).You can also use the VTune Amplifier command-line interface (amplxe-cl command) to run ananalysis. A simple way to get the appropriate command syntax is by clicking the Command Linebutton at the bottom of the window. For more details, check the Intel VTune Amplifier Command LineInterface section of the VTune Amplifier User Guide.
Key Terms• Elapsed time• Finalization• Hotspot• Hotspots analysis• Viewpoint
2 Tutorial: Finding Hotspots with Intel® VTune™ Amplifier - Windows*
18
Next StepInterpret Result Data
Interpret Result Data
When the sample application exits, the Intel® VTune™ Amplifier finalizes the results and opens theHotspots by CPU Utilization viewpoint where each window or pane is configured to display code regionsthat consumed a lot of CPU time. To interpret the data on the sample code performance, do the following:
• Understand the basic performance metrics provided by the Hotspots analysis.• Analyze the most time-consuming functions and CPU usage.• Analyze performance per thread.
NOTEThe screenshots and execution time data provided in this tutorial are created on a system with 4 CPUcores. Your data may vary depending on the number and type of CPU cores on your system.
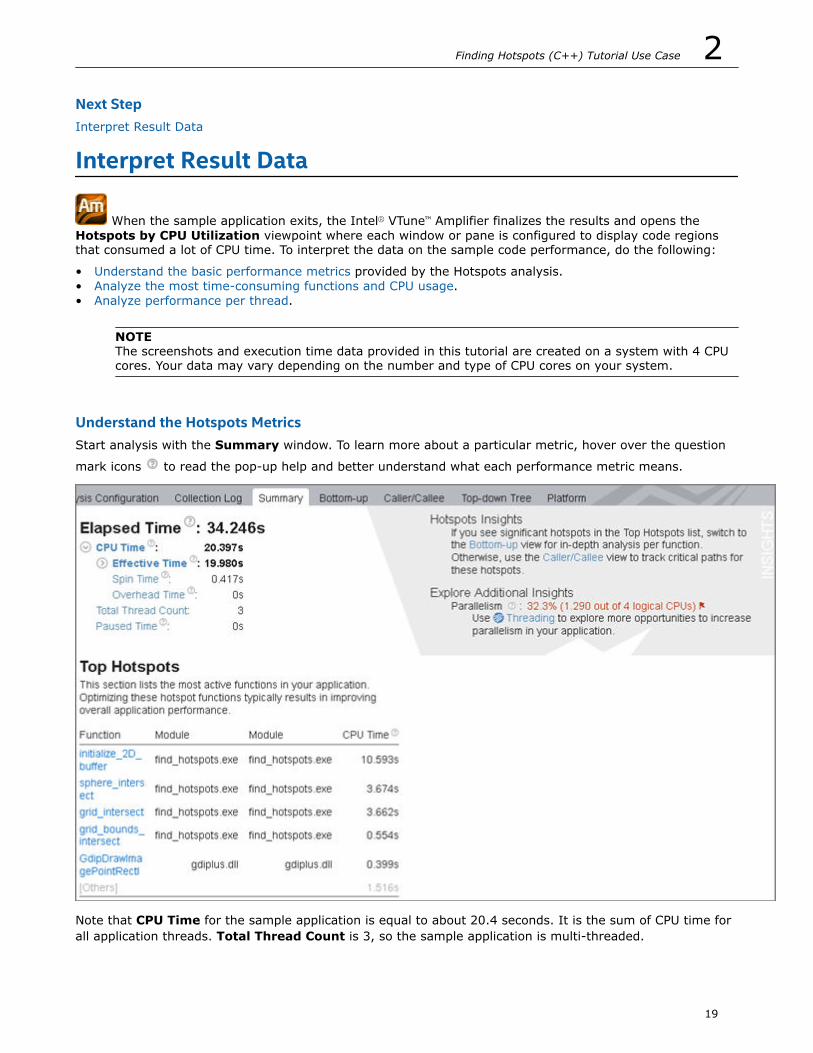
Understand the Hotspots MetricsStart analysis with the Summary window. To learn more about a particular metric, hover over the question
mark icons to read the pop-up help and better understand what each performance metric means.
Note that CPU Time for the sample application is equal to about 20.4 seconds. It is the sum of CPU time forall application threads. Total Thread Count is 3, so the sample application is multi-threaded.
Finding Hotspots (C++) Tutorial Use Case 2
19

The Top Hotspots section provides data on the most time-consuming functions (hotspot functions) sortedby CPU time spent on their execution.
For the sample application, the initialize_2D_buffer function, which took 10.593 seconds to execute,shows up at the top of the list as the hottest function.
The [Others] entry at the bottom shows the sum of CPU time for all functions not listed in the table.
The Insights pane offers tips on where to start looking for issues. For the sample application, it recommendsimproving parallelism. The Effective CPU Utilization Histogram lower on the Summary windowrepresents the Elapsed Time and usage level for the available logical processors and provides a graphical lookat how many logical processors were used during the application execution. Ideally, the highest bar of yourchart should match the Target Utilization level.
The find_hotspots application ran mostly on one logical CPU. If you hover over the highest bar, you seethat it spent 19.569 seconds using one core only, which is classified by the VTune Amplifier as a Poorutilization for a multicore system. To understand what prevented the application from using all availablelogical CPUs effectively, explore the Bottom-up pane.
Analyze the Most Time-consuming FunctionsClick the Bottom-up tab to explore the Bottom-up pane. By default, the data in the grid is sorted byFunction. You may change the grouping level using the Grouping drop-down menu at the top of the grid.
Analyze the CPU Time column values. Functions that took most CPU time to execute are listed on top.
The initialize_2D_buffer function took the maximum time to execute, 10.593 seconds, and had the
longest poor CPU utilization (red bars). This means that the processor cores were underutilized most ofthe time spent on executing this function.
2 Tutorial: Finding Hotspots with Intel® VTune™ Amplifier - Windows*
20

To get the detailed CPU usage information per function, use the Expand button in the Bottom-up pane toexpand the CPU Time column.
Click the arrow sign at the initialize_2D_buffer function to expand the stacks calling this function.You see that it was called only by the render_one_pixel function.
Tip
You may change the stack representation to a "tree" style by clicking the Change Stack Layoutbutton.
Select the initialize_2D_buffer function in the grid and explore the data provided in the Call Stackpane on the right. The Call Stack pane displays full stack data for each hotspot function, which enables youto navigate between function call stacks and understand the impact of each stack to the function CPU time.The stack functions in the Call Stack pane are represented in the following format:
<module>!<function> - <file>:<line number>, where the line number corresponds to the line calling thenext function in the stack.
Finding Hotspots (C++) Tutorial Use Case 2
21
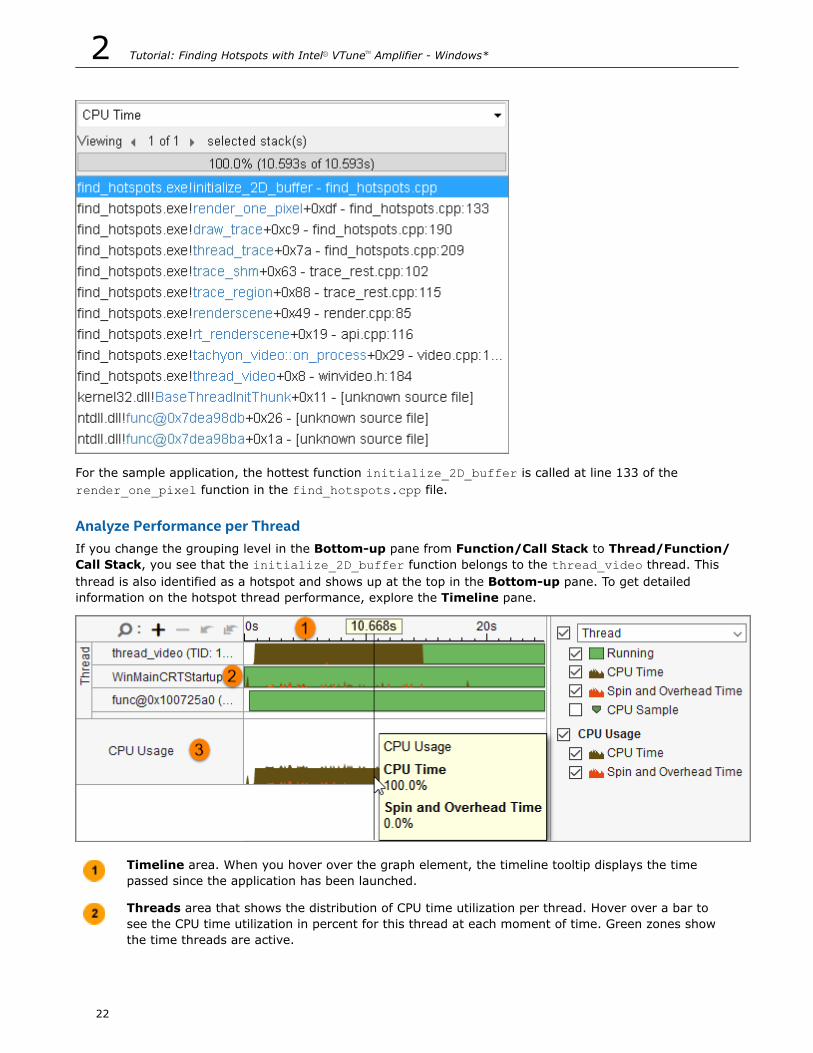
For the sample application, the hottest function initialize_2D_buffer is called at line 133 of therender_one_pixel function in the find_hotspots.cpp file.
Analyze Performance per ThreadIf you change the grouping level in the Bottom-up pane from Function/Call Stack to Thread/Function/Call Stack, you see that the initialize_2D_buffer function belongs to the thread_video thread. Thisthread is also identified as a hotspot and shows up at the top in the Bottom-up pane. To get detailedinformation on the hotspot thread performance, explore the Timeline pane.
Timeline area. When you hover over the graph element, the timeline tooltip displays the timepassed since the application has been launched.
Threads area that shows the distribution of CPU time utilization per thread. Hover over a bar tosee the CPU time utilization in percent for this thread at each moment of time. Green zones showthe time threads are active.
2 Tutorial: Finding Hotspots with Intel® VTune™ Amplifier - Windows*
22
CPU Usage area that shows the distribution of CPU time utilization for the whole application. Hoverover a bar to see the application-level CPU time utilization in percent at each moment of time.
VTune Amplifier calculates the overall CPU Usage metric as the sum of CPU time per each threadof the Threads area. Maximum CPU Usage value is equal to [number of processor cores] x100%.
The Timeline analysis also identifies the thread_video thread as the most active. The CPU Usage tooltipshows that CPU time values are about 100% whereas the maximum CPU time value for a system with 4 CPUcores is 400%. This means that the processor cores were under-utilized for most of the time spent onexecuting the find_hotspots application.
Key Terms• CPU time• CPU usage• Elapsed time• Basic Hotspots analysis• Viewpoint
Next StepAnalyze Code
Analyze Code
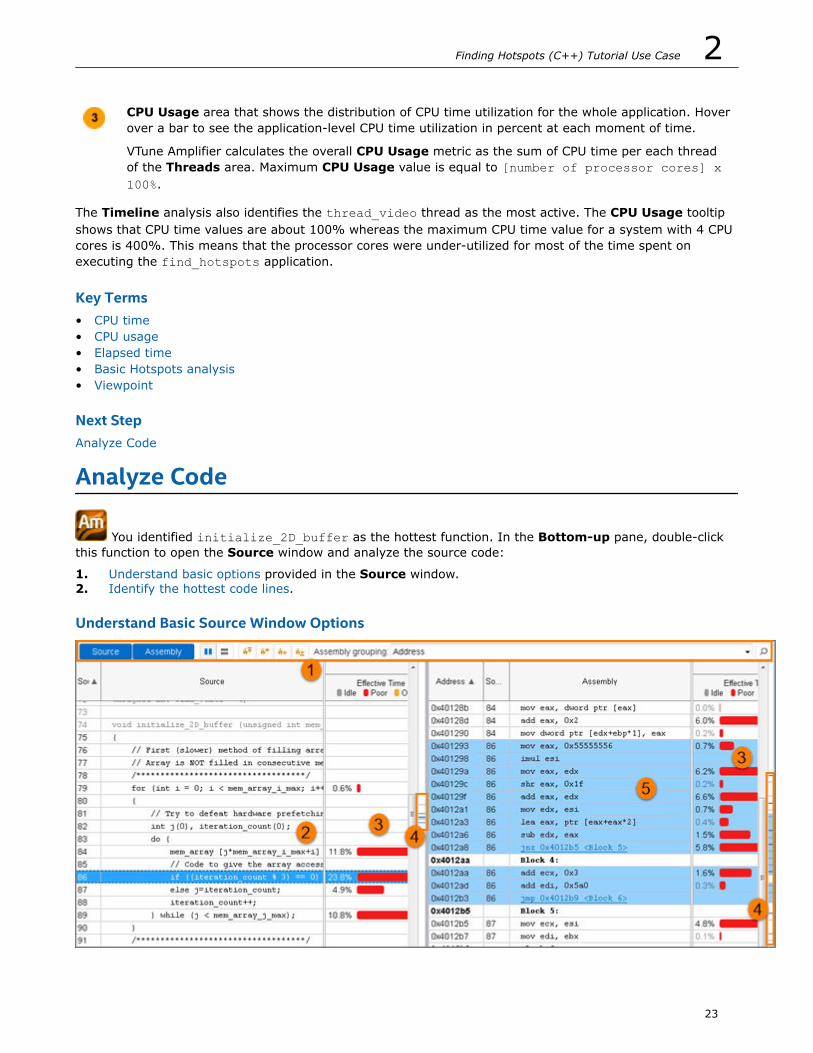
You identified initialize_2D_buffer as the hottest function. In the Bottom-up pane, double-clickthis function to open the Source window and analyze the source code:
1. Understand basic options provided in the Source window.2. Identify the hottest code lines.
Understand Basic Source Window Options
Finding Hotspots (C++) Tutorial Use Case 2
23
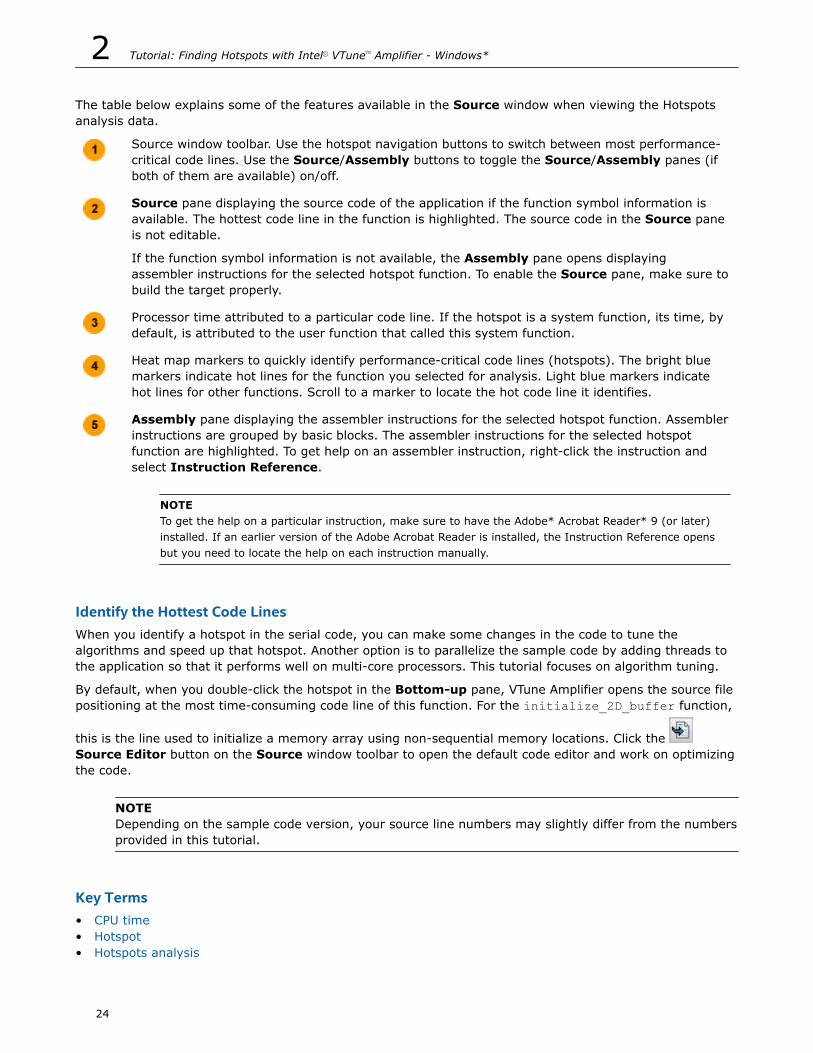
The table below explains some of the features available in the Source window when viewing the Hotspotsanalysis data.
Source window toolbar. Use the hotspot navigation buttons to switch between most performance-critical code lines. Use the Source/Assembly buttons to toggle the Source/Assembly panes (ifboth of them are available) on/off.
Source pane displaying the source code of the application if the function symbol information isavailable. The hottest code line in the function is highlighted. The source code in the Source paneis not editable.
If the function symbol information is not available, the Assembly pane opens displayingassembler instructions for the selected hotspot function. To enable the Source pane, make sure tobuild the target properly.
Processor time attributed to a particular code line. If the hotspot is a system function, its time, bydefault, is attributed to the user function that called this system function.
Heat map markers to quickly identify performance-critical code lines (hotspots). The bright bluemarkers indicate hot lines for the function you selected for analysis. Light blue markers indicatehot lines for other functions. Scroll to a marker to locate the hot code line it identifies.
Assembly pane displaying the assembler instructions for the selected hotspot function. Assemblerinstructions are grouped by basic blocks. The assembler instructions for the selected hotspotfunction are highlighted. To get help on an assembler instruction, right-click the instruction andselect Instruction Reference.
NOTETo get the help on a particular instruction, make sure to have the Adobe* Acrobat Reader* 9 (or later)installed. If an earlier version of the Adobe Acrobat Reader is installed, the Instruction Reference opensbut you need to locate the help on each instruction manually.
Identify the Hottest Code LinesWhen you identify a hotspot in the serial code, you can make some changes in the code to tune thealgorithms and speed up that hotspot. Another option is to parallelize the sample code by adding threads tothe application so that it performs well on multi-core processors. This tutorial focuses on algorithm tuning.
By default, when you double-click the hotspot in the Bottom-up pane, VTune Amplifier opens the source filepositioning at the most time-consuming code line of this function. For the initialize_2D_buffer function,
this is the line used to initialize a memory array using non-sequential memory locations. Click the Source Editor button on the Source window toolbar to open the default code editor and work on optimizingthe code.
NOTEDepending on the sample code version, your source line numbers may slightly differ from the numbersprovided in this tutorial.
Key Terms• CPU time• Hotspot• Hotspots analysis
2 Tutorial: Finding Hotspots with Intel® VTune™ Amplifier - Windows*
24

Next StepTune Algorithms
Tune Algorithms
In the Source window, you identified a code line in the initialize_2D_buffer hotspot function thattook the most CPU time. Focus on this line and do the following:
1. Open the code editor.2. Resolve the performance problem using any of these options:
• Optimize the algorithm used in this code section.• Recompile the code with the Intel® C++ Compiler.
Open the Code Editor
NOTEDepending on the sample code version, your source line numbers may slightly differ from the numbersprovided in this tutorial.
In the Source window, click the Source Editor button to open the find_hotspots.cpp file in thedefault code editor at the hotspot line:
Finding Hotspots (C++) Tutorial Use Case 2
25

Hotspot line 85 is used to initialize a memory array using non-sequential memory locations. Fordemonstration purposes, the code lines are commented as a slower method of filling the array.
Resolve the ProblemTo resolve this issue, use one of the following methods:
Option 1: Optimize your algorithm
1. Edit 79 deleting the ending forward slash (/). This action comments out code lines 80-92 marked as a"First (slower) method".
2. Edit line 98 by adding a forward slash (/) at the end of the line. This action uncomments code lines99-105 marked as a "Faster method".
In this step, you interchange the for loops to initialize the code in sequential memory locations.3. From the Microsoft Visual Studio* menu, select Build > Rebuild find_hotspots.
The project is rebuilt.4. From Visual Studio Debug menu, select Start Without Debugging to run the application.
2 Tutorial: Finding Hotspots with Intel® VTune™ Amplifier - Windows*
26
Visual Studio runs the find_hotspots.exe. Note that execution time has reduced.
Option 2: Recompile the code with Intel® C++ Compiler
This option assumes that you have Intel C++ Compiler installed. By default, the Intel C++ Compiler usespowerful optimization switches, which typically provides some gain in performance. For more details, see theIntel C++ Compiler documentation.
As an alternative, you may consider running the default Microsoft Visual Studio* compiler applying moreaggressive optimization switches.
To recompile the code with the Intel compiler:
1. From Visual Studio Project menu, select Intel Compiler > Use Intel C++....2. In the Confirmation window, click OK to confirm your choice.3. From the Visual Studio menu, select Build > Rebuild find_hotspots.
The project is rebuilt with the Intel compiler.4. From the Visual Studio menu, select Debug > Start Without Debugging.
Visual Studio runs the find_hotspots.exe. Note that the execution time has reduced.
Key TermsHotspot
Next StepCompare with Previous Result
Optimization Notice
Intel's compilers may or may not optimize to the same degree for non-Intel microprocessors foroptimizations that are not unique to Intel microprocessors. These optimizations include SSE2, SSE3, andSSSE3 instruction sets and other optimizations. Intel does not guarantee the availability, functionality, oreffectiveness of any optimization on microprocessors not manufactured by Intel. Microprocessor-dependent optimizations in this product are intended for use with Intel microprocessors. Certainoptimizations not specific to Intel microarchitecture are reserved for Intel microprocessors. Please refer tothe applicable product User and Reference Guides for more information regarding the specific instructionsets covered by this notice.
Notice revision #20110804
Compare with Previous Result
You optimized your code to apply a loop interchange mechanism that gave you several seconds ofimprovement in the application execution time. To understand whether you got rid of the hotspot and whatkind of optimization you got per function, re-run the Hotspots analysis on the optimized code and compareresults:
1. Compare results before and after optimization.2. Identify the performance gain.
Compare Results Before and After Optimization1. Run the Hotspots analysis on the modified code.
VTune Amplifier collects data and opens the result in the Result tab. Make sure to close the resultsbefore comparison.
2. Select the result in the Solution Explorer/Project Navigator, right-click and choose CompareResults from the context menu.
Finding Hotspots (C++) Tutorial Use Case 2
27

The Compare Results window opens.3. Specify the Hotspots analysis results you want to compare and click the Compare button:
The Hotspots Summary window opens, providing a high-level picture of performance improvements inthe following format: <result 1 value> - <result 2 value>.
Identify the Performance GainIn the Summary window, you see that the Elapsed Time shows 10.814 seconds of optimization for the wholeapplication execution:
The Top Hotspots section shows the gain in performance for the most critical functions:
Notice that the initialize_2D_buffer function has a value of undefined for the CPU time in theoptimized code. This happens when the code runs too quickly to record the method due to the removal of ahotspot or the function being available in the LLC cache.
Switch to the Bottom-up window to compare the two results and see the differences per metrics side byside.
2 Tutorial: Finding Hotspots with Intel® VTune™ Amplifier - Windows*
28

Key Terms• CPU time• Elapsed time• Hotspot
See AlsoSummary
Finding Hotspots (C++) Tutorial Use Case 2
29
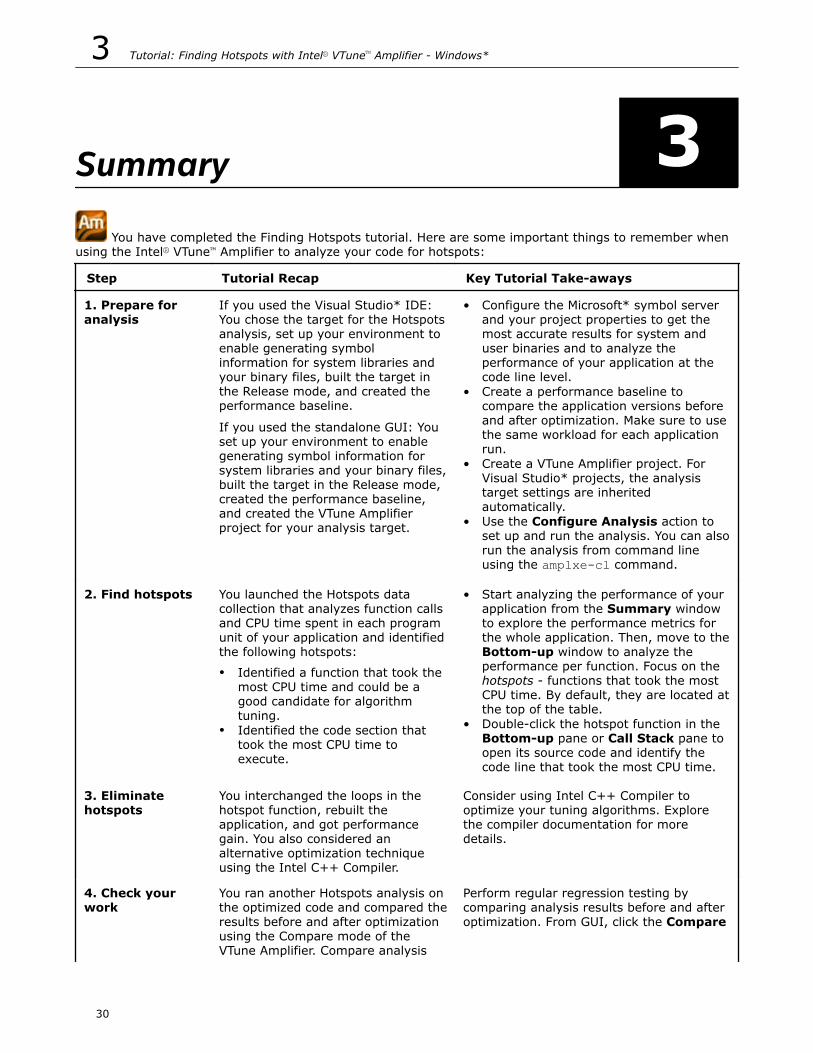
Summary 3 You have completed the Finding Hotspots tutorial. Here are some important things to remember when
using the Intel® VTune™ Amplifier to analyze your code for hotspots:
Step Tutorial Recap Key Tutorial Take-aways
1. Prepare foranalysis
If you used the Visual Studio* IDE:You chose the target for the Hotspotsanalysis, set up your environment toenable generating symbolinformation for system libraries andyour binary files, built the target inthe Release mode, and created theperformance baseline.
If you used the standalone GUI: Youset up your environment to enablegenerating symbol information forsystem libraries and your binary files,built the target in the Release mode,created the performance baseline,and created the VTune Amplifierproject for your analysis target.
• Configure the Microsoft* symbol serverand your project properties to get themost accurate results for system anduser binaries and to analyze theperformance of your application at thecode line level.
• Create a performance baseline tocompare the application versions beforeand after optimization. Make sure to usethe same workload for each applicationrun.
• Create a VTune Amplifier project. ForVisual Studio* projects, the analysistarget settings are inheritedautomatically.
• Use the Configure Analysis action toset up and run the analysis. You can alsorun the analysis from command lineusing the amplxe-cl command.
2. Find hotspots You launched the Hotspots datacollection that analyzes function callsand CPU time spent in each programunit of your application and identifiedthe following hotspots:• Identified a function that took the
most CPU time and could be agood candidate for algorithmtuning.
• Identified the code section thattook the most CPU time toexecute.
• Start analyzing the performance of yourapplication from the Summary windowto explore the performance metrics forthe whole application. Then, move to theBottom-up window to analyze theperformance per function. Focus on thehotspots - functions that took the mostCPU time. By default, they are located atthe top of the table.
• Double-click the hotspot function in theBottom-up pane or Call Stack pane toopen its source code and identify thecode line that took the most CPU time.
3. Eliminatehotspots
You interchanged the loops in thehotspot function, rebuilt theapplication, and got performancegain. You also considered analternative optimization techniqueusing the Intel C++ Compiler.
Consider using Intel C++ Compiler tooptimize your tuning algorithms. Explorethe compiler documentation for moredetails.
4. Check yourwork
You ran another Hotspots analysis onthe optimized code and compared theresults before and after optimizationusing the Compare mode of theVTune Amplifier. Compare analysis
Perform regular regression testing bycomparing analysis results before and afteroptimization. From GUI, click the Compare
3 Tutorial: Finding Hotspots with Intel® VTune™ Amplifier - Windows*
30

Step Tutorial Recap Key Tutorial Take-aways
results regularly to look forregressions and to track howincremental changes to the codeaffect its performance. You may alsowant to use the VTune Amplifiercommand-line interface and run theamplxe-cl command to test yourcode for regressions. For moredetails, see the Command-lineInterface Support section in theVTune Amplifier online help.
Results button on the VTune Amplifiertoolbar. From command line, use theamplxe-cl command.
Next step: Prepare your own application(s) for analysis. Then use the VTune Amplifier to find and eliminatehotspots.
Optimization Notice
Intel's compilers may or may not optimize to the same degree for non-Intel microprocessors foroptimizations that are not unique to Intel microprocessors. These optimizations include SSE2, SSE3, andSSSE3 instruction sets and other optimizations. Intel does not guarantee the availability, functionality, oreffectiveness of any optimization on microprocessors not manufactured by Intel. Microprocessor-dependent optimizations in this product are intended for use with Intel microprocessors. Certainoptimizations not specific to Intel microarchitecture are reserved for Intel microprocessors. Please refer tothe applicable product User and Reference Guides for more information regarding the specific instructionsets covered by this notice.
Notice revision #20110804
See AlsoClick here for more Getting Started Tutorials
Summary 3
31

Key Terms 4baseline: A performance metric used as a basis for comparison of the application versions before and afteroptimization. Baseline should be measurable and reproducible.
CPU time: The amount of time a thread spends executing on a logical processor. For multiple threads, theCPU time of the threads is summed. The application CPU time is the sum of the CPU time of all the threadsthat run the application.
CPU usage: A performance metric when the VTune Amplifier identifies a processor utilization scale,calculates the target CPU usage, and defines default utilization ranges depending on the number of processorcores.
Utilization Type
Defaultcolor
Description
Idle All CPUs are waiting - no threads are running.
Poor Poor usage. By default, poor usage is when the number of simultaneouslyrunning CPUs is less than or equal to 50% of the target CPU usage.
OK Acceptable (OK) usage. By default, OK usage is when the number ofsimultaneously running CPUs is between 51-85% of the target CPU usage.
Ideal Ideal usage. By default, Ideal usage is when the number of simultaneouslyrunning CPUs is between 86-100% of the target CPU usage.
Elapsed time:The total time your target ran, calculated as follows: Wall clock time at end of application– Wall clock time at start of application.
finalization: A process during which the Intel® VTune™ Amplifier converts the collected data to a database,resolves symbol information, and pre-computes data to make further analysis more efficient and responsive.
hotspot: A section of code that took a long time to execute. Some hotspots may indicate bottlenecks andcan be removed, while other hotspots inevitably take a long time to execute due to their nature.
Hotspots analysis: An analysis type used to understand the application flow and identify hotspots. VTuneAmplifier creates a list of functions in your application ordered by the amount of time spent in a function. Italso detects the call stacks for each of these functions so you can see how the hot functions are called. VTuneAmplifier uses a low overhead (about 5%) user-mode sampling and tracing collection that gets you theinformation you need without slowing down the application execution significantly.
target: An executable file you analyze using Intel® VTune™ Amplifier.
viewpoint: A preset result tab configuration that filters out the data collected during a performance analysisand enables you to focus on specific performance problems. When you select a viewpoint, you select a set ofperformance metrics the VTune Amplifier shows in the windows/panes of the result tab. To select therequired viewpoint, click the (change) link and use the drop-down menu at the top of the result tab.
See AlsoClick here for more Getting Started Tutorials
4 Tutorial: Finding Hotspots with Intel® VTune™ Amplifier - Windows*
32

Legal InformationNo license (express or implied, by estoppel or otherwise) to any intellectual property rights is granted by thisdocument.
Intel disclaims all express and implied warranties, including without limitation, the implied warranties ofmerchantability, fitness for a particular purpose, and non-infringement, as well as any warranty arising fromcourse of performance, course of dealing, or usage in trade.
This document contains information on products, services and/or processes in development. All informationprovided here is subject to change without notice. Contact your Intel representative to obtain the latestforecast, schedule, specifications and roadmaps.
The products and services described may contain defects or errors which may cause deviations frompublished specifications. Current characterized errata are available on request.
Intel processor numbers are not a measure of performance. Processor numbers differentiate features withineach processor family, not across different processor families. Go to: Learn About Intel® Processor Numbers
Intel, the Intel logo, Intel Atom, Intel Core, Intel Xeon Phi, VTune and Xeon are trademarks of IntelCorporation in the U.S. and/or other countries.
*Other names and brands may be claimed as the property of others.
Microsoft, Windows, and the Windows logo are trademarks, or registered trademarks of Microsoft Corporationin the United States and/or other countries.
Java is a registered trademark of Oracle and/or its affiliates.
OpenCL and the OpenCL logo are trademarks of Apple Inc. used by permission by Khronos.
Copyright 2011-2018 Intel Corporation.
This software and the related documents are Intel copyrighted materials, and your use of them is governedby the express license under which they were provided to you (License). Unless the License providesotherwise, you may not use, modify, copy, publish, distribute, disclose or transmit this software or therelated documents without Intel's prior written permission.
This software and the related documents are provided as is, with no express or implied warranties, otherthan those that are expressly stated in the License.
Legal Information
33