tutorial: finding hotspots - intel amplifier/visual studio* ide integration use the vtune amplifier...
TRANSCRIPT

Tutorial: Finding HotspotsIntel® VTune™ Amplifier for Windows* OS
Fortran Sample Application Code
Legal Information

ContentsLegal Information................................................................................ 3Overview..............................................................................................4
Chapter 1: Navigation Quick Start
Chapter 2: Finding HotspotsVisual Studio* IDE: Choose Project and Build Application.............................. 10Standalone GUI: Build Application and Create New Project............................ 14Run Basic Hotspots Analysis...................................................................... 18Interpret Results......................................................................................19Resolve Issue.......................................................................................... 22Run Concurrency Analysis......................................................................... 24Interpret Concurrency Results................................................................... 25Run Locks and Waits Analysis.................................................................... 28Interpret Locks and Waits Results...............................................................29Remove Locks......................................................................................... 31Compare with Previous Result....................................................................32
Chapter 3: Summary
Chapter 4: Key Terms
Tutorial: Finding Hotspots
2

Legal InformationNo license (express or implied, by estoppel or otherwise) to any intellectual property rights is granted by thisdocument.
Intel disclaims all express and implied warranties, including without limitation, the implied warranties ofmerchantability, fitness for a particular purpose, and non-infringement, as well as any warranty arising fromcourse of performance, course of dealing, or usage in trade.
This document contains information on products, services and/or processes in development. All informationprovided here is subject to change without notice. Contact your Intel representative to obtain the latestforecast, schedule, specifications and roadmaps.
The products and services described may contain defects or errors which may cause deviations frompublished specifications. Current characterized errata are available on request.
Intel processor numbers are not a measure of performance. Processor numbers differentiate features withineach processor family, not across different processor families. Go to: Learn About Intel® Processor Numbers
Software and workloads used in performance tests may have been optimized for performance only on Intelmicroprocessors. Performance tests, such as SYSmark and MobileMark, are measured using specificcomputer systems, components, software, operations and functions. Any change to any of those factors maycause the results to vary. You should consult other information and performance tests to assist you in fullyevaluating your contemplated purchases, including the performance of that product when combined withother products.
Cilk, Intel, the Intel logo, Intel Atom, Intel Core, Intel Inside, Intel NetBurst, Intel SpeedStep, Intel vPro,Intel Xeon Phi, Intel XScale, Itanium, MMX, Pentium, Thunderbolt, Ultrabook, VTune and Xeon aretrademarks of Intel Corporation in the U.S. and/or other countries.
*Other names and brands may be claimed as the property of others.
Microsoft, Windows, and the Windows logo are trademarks, or registered trademarks of Microsoft Corporationin the United States and/or other countries.© 2016, Intel Corporation.
3

Overview
Discover how to use the Basic Hotspots, Concurrency, and Locks and Waits analysis types of the Intel®VTune™ Amplifier to identify hotspots - the most time-consuming program units, understand how effectivelyyour code is using available cores, and discover causes of ineffective utilization.
About ThisTutorial
This tutorial uses the sample nqueens_parallel application and guides you throughbasic workflow steps required to analyze the code for hotspots, parallelism, and locks.
EstimatedDuration
10-15 minutes.
LearningObjectives
After you complete this tutorial, you should be able to:
• Choose an analysis target.• Choose an analysis type.• Run the Basic Hotspots analysis to locate most time-consuming functions in an
application.• Analyze the function call flow and threads.• Analyze the source code to locate the most time-critical code lines.• Run the Concurrency analysis to identify function candidates for parallelization.• Run the Locks and Waits analysis to identify where synchronization objects spent
too much CPU time waiting.• Compare results before and after optimization.
More Resources • Intel VTune Amplifier tutorials (HTML, PDF): https://software.intel.com/en-us/articles/intel-vtune-amplifier-tutorials/
• Intel VTune Amplifier support page: https://software.intel.com/en-us/intel-vtune-amplifier-xe-support/
• Intel Parallel Studio XE support page: https://software.intel.com/en-us/intel-parallel-studio-xe/
Tutorial: Finding Hotspots
4

Navigation Quick Start 1 Intel® VTune™ Amplifier provides information on code performance for users developing serial and
multithreaded applications on Windows*, Linux*, and OS X* operating systems. VTune Amplifier helps youanalyze algorithm choices and identify where and how your application can benefit from available hardwareresources.
VTune Amplifier XE AccessTo access the VTune Amplifier in the Visual Studio* IDE: From the Windows* Start menu, choose IntelParallel Studio XE version > Parallel Studio XE version with [VS2012 | VS2013 | VS2015].
To access the Standalone VTune Amplifier GUI, do one of the following:
• From the Windows* Start menu, choose Intel Parallel Studio XE version > Intel VTune Amplifier XEversion.
• From the Windows* Start menu, choose Intel Parallel Studio XE version > Command Prompt >Parallel Studio XE > IA-32 Visual Studio [2012 | 2013 | 2015] mode to set your environment, thentype amplxe-gui. You can also set the environment manually by running the <install-dir>\amplxe-vars.bat file.
5
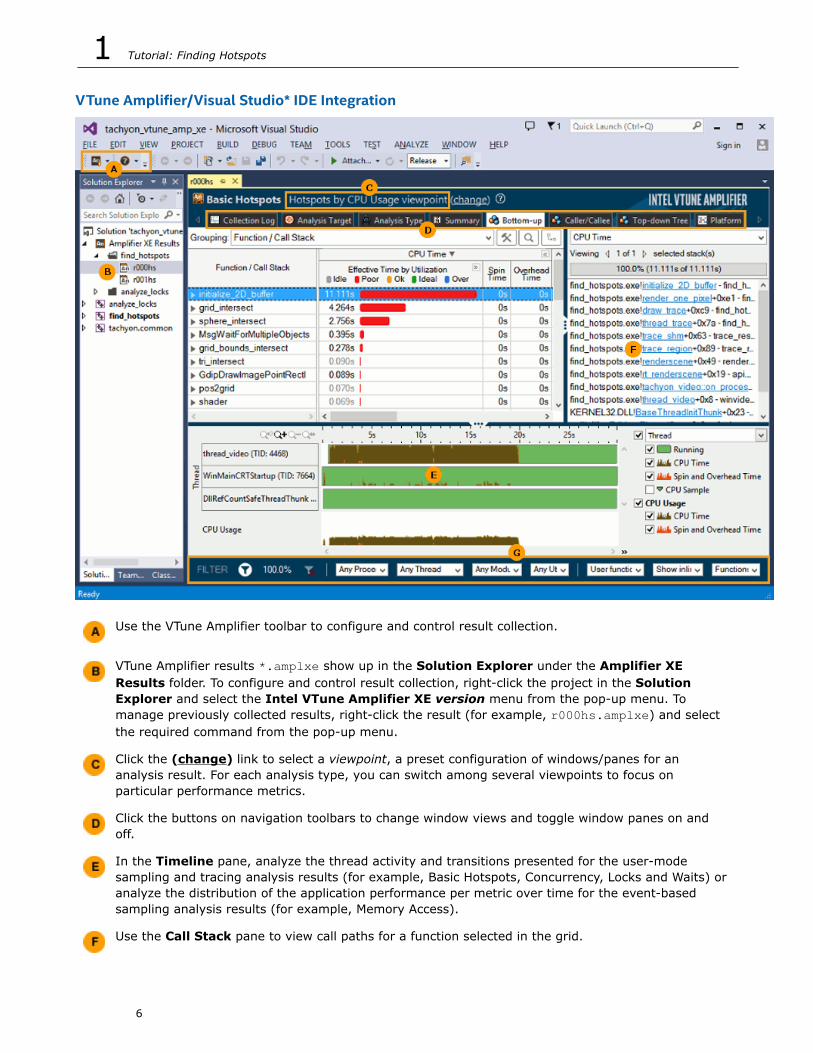
VTune Amplifier/Visual Studio* IDE Integration
Use the VTune Amplifier toolbar to configure and control result collection.
VTune Amplifier results *.amplxe show up in the Solution Explorer under the Amplifier XEResults folder. To configure and control result collection, right-click the project in the SolutionExplorer and select the Intel VTune Amplifier XE version menu from the pop-up menu. Tomanage previously collected results, right-click the result (for example, r000hs.amplxe) and selectthe required command from the pop-up menu.
Click the (change) link to select a viewpoint, a preset configuration of windows/panes for ananalysis result. For each analysis type, you can switch among several viewpoints to focus onparticular performance metrics.
Click the buttons on navigation toolbars to change window views and toggle window panes on andoff.
In the Timeline pane, analyze the thread activity and transitions presented for the user-modesampling and tracing analysis results (for example, Basic Hotspots, Concurrency, Locks and Waits) oranalyze the distribution of the application performance per metric over time for the event-basedsampling analysis results (for example, Memory Access).
Use the Call Stack pane to view call paths for a function selected in the grid.
1 Tutorial: Finding Hotspots
6

Use the filter toolbar to filter out the result data according to the selected categories.
Standalone VTune Amplifier GUI
Configure and manage projects and results, and launch new analyses from the primary toolbar. Clickthe Configure Project button on this toolbar and use the Analysis Target tab to manage result filelocations. Newly completed and opened analysis results along with result comparisons appear in theresults tab for easy navigation.
Use the VTune Amplifier menu to control result collection, define and view project properties, and setvarious options.
The Project Navigator provides an iconic representation of your projects and analysis results. Clickthe Project Navigator button on the toolbar to enable/disable the Project Navigator.
Click the (change) link to select a viewpoint, a preset configuration of windows/panes for ananalysis result. For each analysis type, you can switch among several viewpoints to focus onparticular performance metrics. Click the yellow question mark icon to read the viewpointdescription.
Switch between window tabs to explore the analysis type configuration options and collected dataprovided by the selected viewpoint.
Use the Grouping drop-down menu to choose a granularity level for grouping data in the grid.
Navigation Quick Start 1
7

Use the filter toolbar to filter out the result data according to the selected categories.
See AlsoClick here for more Getting Started Tutorials
1 Tutorial: Finding Hotspots
8

Finding Hotspots 2 You can use the Intel® VTune™ Amplifier to identify and analyze hotspot functions in your serial or
parallel application by performing a series of steps in a workflow. This tutorial guides you through theseworkflow steps while using a sample multithreaded application named nqueens_parallel.
Step 1: Preparefor analysis
Do one of the following:
• In the Visual Studio* IDE: Choose a project, verify settings, and build application• In the Standalone Intel VTune Amplifier GUI: Build an application to analyze for
hotspots and create a new VTune Amplifier project
Step 2: Findhotspots
• Choose and run the Basic Hotspots analysis.• Interpret the result data.• Resolve issue.
Step 3: Analyzeparallelism
• Choose and run the Concurrency analysis.• Interpret the result data.
Step 4: Identifylocks
• Choose and run the Locks and Waits analysis.• Interpret the result data.• Remove lock.
Step 5: Checkyour work
Re-build the target, re-run the Locks and Waits analysis, and compare the resultdata before and after optimization.
9

Visual Studio* IDE: Choose Project and Build Application
Before you start analyzing your application target for hotspots, do the following:
1. Get software tools.2. Choose a project.3. Verify optimal compiler/linker options.4. Configure target properties.5. Build the target in the release mode.6. Create a performance baseline.7. Launch the VTune Amplifier from Microsoft Visual Studio
NOTE:
• The steps below are provide for Microsoft Visual Studio 2013. They may slightly differ for otherversions of Visual Studio.
• Steps provided in this tutorial are generic and applicable to any application. You may choose tofollow the proposed workflow using your own application.
Get Software ToolsYou need the following tools to try tutorial steps yourself using the nqueens_fortran sample application:
• Intel® VTune™ Amplifier, including sample applications• .zip file extraction utility• Supported Fortran compiler (see Release Notes for more information)
Acquire Intel VTune Amplifier
If you do not already have access to the VTune Amplifier, you can download an evaluation copy from http://software.intel.com/en-us/articles/intel-software-evaluation-center/.
NOTE:
This document focuses on using the VTune™ Amplifier in Intel® Parallel Studio XE Professional Edition.You may see minor differences if you installed a different Intel product. For more information onproduct capabilities in your installed product, see the product-specific supplemental documentation in<install-dir>/<Intel_product>/documentation/.
Install and Set Up VTune Amplifier Sample Applications
1. Copy the nqueens_fortran.zip file from the <install-dir>\samples\<locale>\Fortran\directory to a writable directory or share on your system.
NOTE:
The default installation path for the VTune Amplifier XE is [Program Files]\IntelSWTools\VTuneAmplifier XE <version>. For the VTune Amplifier for Systems, the default <install_dir> is[Program Files]\IntelSWTools\system_studio_<version>\VTune Amplifier for Systems.
2. Extract the sample from the .zip file.
2 Tutorial: Finding Hotspots
10

NOTE:
• Samples are non-deterministic. Your screens may vary from the screen captures shown throughoutthis tutorial.
• Samples are designed only to illustrate the VTune Amplifier features; they do not represent bestpractices for creating code.
Choose a ProjectChoose a project with the analysis target in the Visual Studio IDE as follows:
1. From the Visual Studio menu, select File > Open > Project/Solution....
The Open Project dialog box opens.2. In the Open Project dialog box, browse to the location you used to extract the nqueens_fortran.zip
file and select the nqueens_fortran.sln file from the nqueens_fortran\vf12 directory.
The solution is added to Visual Studio IDE and shows up in the Solution Explorer.
NOTE: If you are using a recent version of Visual Studio, a message may appear directing you toupgrade the project. Click OK and the project will be automatically upgraded to be compatible withyour version of Visual Studio.
3. In the Solution Explorer, right-click the nqueens_parallel project and select Set as StartUp Project.
nqueens_parallel appears in bold in the Solution Explorer.
NOTE:
nqueens_serial project provides a single-threaded version of the sample application. This project isprovided for your reference only and not described in this tutorial.
When you choose a project in Visual Studio IDE, the VTune Amplifier automatically creates theconfig.amplxeproj project file and sets the nqueens_parallel application as an analysis target in theproject properties.
Finding Hotspots 2
11

Verify Optimal Compiler/Linker OptionsConfigure Visual Studio project properties to generate the debug information for your application so that theVTune Amplifier can open the source code.
1. Select the nqueens_parallel project and go to Project > Properties.
The nqueens_parallel Property Pages dialog box opens.2. Select Configuration Properties > General and make sure the selected Configuration (top of the
dialog) is Release.3. Select Fortran > General pane and specify the Debug Information Format as Full (/debug:full) .
4. Select Fortran > Optimization pane and set the Optimization to Maximize Speed.
5. Select Linker > Debugging and set the Generate Debug Info option to Yes (/DEBUG).6. Click OK.
Configure Target Properties1. Right-click the nqueens_parallel project and select Properties from the context menu.
The nqueens_parallel Property Pages dialog box opens.2. In the nqueens_parallel Property Pages dialog box, select Configuration Properties >
Debugging.3. In the right pane, specify the Command Arguments as 15.4. Click OK.
Build the Target in the Release ModeBuild the target in the Release mode with full optimizations, which is recommended for performance analysis.
2 Tutorial: Finding Hotspots
12

1. Go to the Build > Configuration Manager... dialog box and select the Release mode for your targetproject.
2. Click Close.3. From the Visual Studio menu, select Build > Build nqueens_parallel.
The nqueens_parallel.exe application is built with your default Fortran compiler. For this tutorial,Intel Visual Fortran Compiler is used.
NOTE:
The build configuration for nqueens_parallel may initially be set to Debug, which is typically usedfor development. When analyzing performance issues with the VTune Amplifier, you are recommendedto use the Release build with normal optimizations. In this way, the VTune Amplifier is able to analyzethe realistic performance of your application.
Create a Performance BaselineRun the application to create a performance baseline that will be used to identify optimization you achieveduring performance tuning with the VTune Amplifier.
NOTE:
Before you start the application, minimize the amount of other software running on your computer toget more accurate results.
1. From the Visual Studio menu, select Debug > Start Without Debugging.
The nqueens_parallel.exe application starts running.
2. Note the execution time displayed in the window caption. In the example above, the execution time is127336 milliseconds.
NOTE:
• Run the application several times, note the execution time for each run, and use the averagenumber. This helps to minimize skewed results due to transient system activity.
• The screenshots and execution time data provided in this tutorial are created on a system with 4CPU cores. Your data may vary depending on the number and type of CPU cores on your system.
Launch the VTune Amplifier from Microsoft Visual Studio
To run the Basic Hotspots analysis from Visual Studio IDE, click the New Analysis button on the VTuneAmplifier toolbar. VTune Amplifier uses your current project as the target application and thenqueens_fortran directory as the working directory where the analysis results will be stored.
Finding Hotspots 2
13

RecapYou chose the target for the Basic Hotspots analysis, set up your environment to enable generating symbolinformation for your binary files, built the target in the Release mode, created the performance baseline, andlaunched the VTune Amplifier. Your application is ready for analysis.
Key Terms• Baseline• Basic Hotspots analysis• Target
Next StepRun Basic Hotspots Analysis
Optimization Notice
Intel's compilers may or may not optimize to the same degree for non-Intel microprocessors foroptimizations that are not unique to Intel microprocessors. These optimizations include SSE2, SSE3, andSSSE3 instruction sets and other optimizations. Intel does not guarantee the availability, functionality, oreffectiveness of any optimization on microprocessors not manufactured by Intel. Microprocessor-dependent optimizations in this product are intended for use with Intel microprocessors. Certainoptimizations not specific to Intel microarchitecture are reserved for Intel microprocessors. Please refer tothe applicable product User and Reference Guides for more information regarding the specific instructionsets covered by this notice.
Notice revision #20110804
Standalone GUI: Build Application and Create New Project
Before you start analyzing your application target for hotspots, do the following:
1. Get software tools.2. Build application.
If you build the code in Visual Studio*, make sure to:
• Verify optimal Fortran compiler options.• Build the target in the release mode.
3. Create a performance baseline.4. Create a VTune Amplifier project.
Get Software ToolsYou need the following tools to try tutorial steps yourself using the nqueens_fortran sample application:
• Intel® VTune™ Amplifier, including sample applications• .zip file extraction utility• Supported Fortran compiler (see Release Notes for more information)
Acquire Intel VTune Amplifier
If you do not already have access to the VTune Amplifier, you can download an evaluation copy from http://software.intel.com/en-us/articles/intel-software-evaluation-center/.
Install and Set Up VTune Amplifier Sample Applications
1. Copy the nqueens_fortran.zip file from the <install-dir>\samples\<locale>\Fortran\directory to a writable directory or share on your system.
2 Tutorial: Finding Hotspots
14

NOTE:
The default installation path for the VTune Amplifier XE is [Program Files]\IntelSWTools\VTuneAmplifier XE <version>. For the VTune Amplifier for Systems, the default <install_dir> is[Program Files]\IntelSWTools\system_studio_<version>\VTune Amplifier for Systems.
2. Extract the sample from the zip file.
NOTE:
• Samples are non-deterministic. Your screens may vary from the screen captures shown throughoutthis tutorial.
• Samples are designed only to illustrate the VTune Amplifier features; they do not represent bestpractices for creating code.
Verify Optimal Compiler/Linker OptionsConfigure Visual Studio project properties to generate the debug information for your application so that theVTune Amplifier can open the source code.
1. Select the nqueens_parallel project and go to Project > Properties.
The nqueens_parallel Property Pages dialog box opens.2. Select Configuration Properties > General and make sure the selected Configuration (top of the
dialog) is Release.3. Select Fortran > General pane and specify the Debug Information Format as Full (/debug:full).
4. Select Fortran > Optimization pane and set the Optimization to Maximize Speed.
Finding Hotspots 2
15

5. Select Linker > Debugging and set the Generate Debug Info option to Yes (/DEBUG).6. Click OK.
Configure Target Properties1. Right-click the nqueens_parallel project and select Properties from the context menu.
The nqueens_parallel Property Pages dialog box opens.2. In the nqueens_parallel Property Pages dialog box, select Configuration Properties >
Debugging.3. In the right pane, specify the Command Arguments as 15.4. Click OK.
Build the Target in the Release ModeBuild the target in the Release mode with full optimizations, which is recommended for performance analysis.For this tutorial, Intel® Fortran Compiler is used to build the application.
1. Go to the Build > Configuration Manager... dialog box and select the Release mode for your targetproject.
2. From the Visual Studio menu, select Build > Build nqueens_parallel.
The nqueens_parallel.exe application is built with your default Fortran compiler.
NOTE:
The build configuration for nqueens_parallel may initially be set to Debug, which is typically usedfor development. When analyzing performance issues with the VTune Amplifier, you are recommendedto use the Release build with normal optimizations. In this way, the VTune Amplifier is able to analyzethe realistic performance of your application.
Create a Performance BaselineRun the application to create a performance baseline that will be used to identify optimization you achieveduring performance tuning with the VTune Amplifier.
NOTE:
Before you start the application, minimize the amount of other software running on your computer toget more accurate results.
1. From the Visual Studio menu, select Debug > Start Without Debugging.
The nqueens_parallel.exe application starts running.
2. Note the execution time displayed in the shell window caption. In the example above, the executiontime is 127336 milliseconds.
2 Tutorial: Finding Hotspots
16

NOTE:
• Run the application several times, note the execution time for each run, and use the averagenumber. This helps to minimize skewed results due to transient system activity.
• The screenshots and execution time data provided in this tutorial are created on a system with 4CPU cores. Your data may vary depending on the number and type of CPU cores on your system.
Create a VTune Amplifier Project1. From the Start menu launch Intel VTune Amplifier version standalone GUI.2. Create a new project via New > Project....
The Create a Project dialog box opens.3. Specify the project name nqueens that will be used as the project directory name and click Create
Project.
VTune Amplifier creates the tachyon project directory under the %USERPROFILE%\My Documents\Amplifier XE\Projects (for VTune Amplifier XE) or %USERPROFILE%\My Documents\Amplifierfor Systems\Projects (for VTune Amplifier for Systems) directory and opens the Choose Targetand Analysis Type window with the Analysis Target tab active.
4. From the left pane, select the local target system from the Accessible Targets group. From the rightpane select the Launch Application target type.
5. Specify and configure your target as follows:
• For the Application field, browse to: <sample_code_dir>, for example: C:\samples\nqueens_fortran\vf12\nqueens_parallel\Release\nqueens_parallel.exe.
• In the Application parameters field, specify the task size for this target: 15.6. Click Choose Analysis to select an analysis type.
RecapYou set up your environment to enable generating symbol information for your binary files, built the target inthe Release mode, created the performance baseline, and created the VTune Amplifier project for youranalysis target. Your application is ready for analysis.
Key Terms• Baseline• Target
Next StepRun Basic Hotspots Analysis
Optimization Notice
Intel's compilers may or may not optimize to the same degree for non-Intel microprocessors foroptimizations that are not unique to Intel microprocessors. These optimizations include SSE2, SSE3, andSSSE3 instruction sets and other optimizations. Intel does not guarantee the availability, functionality, oreffectiveness of any optimization on microprocessors not manufactured by Intel. Microprocessor-dependent optimizations in this product are intended for use with Intel microprocessors. Certainoptimizations not specific to Intel microarchitecture are reserved for Intel microprocessors. Please refer tothe applicable product User and Reference Guides for more information regarding the specific instructionsets covered by this notice.
Notice revision #20110804
Finding Hotspots 2
17

Run Basic Hotspots Analysis
In this tutorial, you run the Basic Hotspots analysis to identify the hotspots that took much time toexecute.
To run an analysis:
1. From the VTune Amplifier toolbar, click the New Analysis button.
The New Amplifier Result tab opens with the Analysis Type window active.2. On the left pane of the Analysis Type window, locate the analysis tree and select Algorithm Analysis
> Basic Hotspots.
The right pane is updated with the predefined settings for the Basic Hotspots analysis.3. From the right pane, select the Analyze OpenMP regions checkbox.4. Click the Start button on the right command bar.
VTune Amplifier launches the nqueens_parallel application that makes calculations, displays the executiontime, and exits. VTune Amplifier finalizes the collected results and opens the analysis results in the Hotspotsby CPU Usage viewpoint.
To make sure the performance of the application is repeatable, go through the entire tuning process on thesame system with a minimal amount of other software executing.
NOTE:
This tutorial explains how to run an analysis from the VTune Amplifier graphical user interface (GUI).You can also use the VTune Amplifier command-line interface (amplxe-cl command) to run ananalysis. If you run the example program from the VTune Amplifier command-line interface, specify 15as a command argument. For more details, check the Command-line Interface Support section of theVTune Amplifier Help.
Key Terms• Elapsed time• Finalization• Hotspot• Viewpoint
Next StepInterpret Results
2 Tutorial: Finding Hotspots
18

Interpret Results
When the sample application exits, the Intel® VTune™ Amplifier finalizes the results and opens theHotspots by CPU Usage viewpoint where each window or pane is configured to display code regions thatconsumed a lot of CPU time. To interpret the data on the sample code performance, do the following:
1. Explore application-level performance.2. Analyze the most time-consuming functions.3. Identify the hotspot code region.
NOTE:
The screenshots and execution time data provided in this tutorial are created on a system with 4 CPUcores. Your data may vary depending on the number and type of CPU cores on your system.
Explore Application-level PerformanceStart analysis with the Summary window that opens by default when data collection completes. To interpret
the data, hover over the question mark icons to read the pop-up help and better understand what eachperformance metric means.
The Elapsed Time metric shows the duration of the collection including Paused Time. You may use thismetric as one of the basic performance indicators.
Note that CPU Time for the sample application is equal to 226.047 seconds. It is the sum of CPU time for allapplication threads. Total Thread Count is 16, so the sample application is multi-threaded.
The nqueens_parallel.exe application uses the OpenMP* threading model. VTune Amplifier analyzesperformance in OpenMP parallel regions as well as serial code performance. The OpenMP Analysis sectionprovides metrics based on the Collection Time , which is the wall time from the beginning to the end ofcollection, excluding Paused Time. The nqueens_parallel.exe application ran serially only 0.887 seconds,which is 0.8% of Collection Time. According to the provided estimates, you can improve the efficiency of yourcode in parallel regions and get 27.931 seconds of performance gain (maximum estimate), which is 25.6% ofCollection Time.
Finding Hotspots 2
19

The Top OpenMP Regions by Potential Gain section displays the parallel region in thenqueens_parallel.exe application that should be optimized.
Clicking this region opens the Bottom-up window with the data grouped by OpenMP Region and detailedstatistics for the hot regions.
The Top Hotspots section of the Summary window provides data on the most time-consuming functions(hotspot functions) sorted by CPU time spent on their execution.
For the sample application, the NQUEENS_ip_SETQUEEN function, which took 119.613 seconds to execute,shows up at the top of the list as the hottest function.
The [Others] entry at the bottom shows the sum of CPU time for all functions not listed in the table.
Analyze the Most Time-consuming FunctionsClick the NQUEENS_ip_SETQUEEN function to view detailed statistics for the hotspot function in the Bottom-up window. By default, the data in the grid is grouped by Function/Call Stack.
Analyze the CPU Time column values. Functions that took most CPU time to execute are listed on top.
The NQUEENS_ip_SETQUEEN function took 119.613 seconds to execute, ineffectively using CPU resourcesduring all this time.
2 Tutorial: Finding Hotspots
20

Double-click the hotspot function to open the source and identify the most time-critical code lines.
Identify the Hotspot Code Region
The table below explains some of the features available in the Source window when viewing the BasicHotspots analysis data.
Source pane displaying the source code of the application if the function symbol information isavailable. The hottest code line is highlighted. The source code in the Source pane is not editable.
If the function symbol information is not available, the Assembly pane opens displayingassembler instructions for the selected hotspot function. To enable the Source pane, make sure tobuild the target properly.
Processor time attributed to a particular code line. If the hotspot is a system function, its time, bydefault, is attributed to the user function that called this system function.
Finding Hotspots 2
21

Source window toolbar. Use the hotspot navigation buttons to switch between most performance-critical code lines. Hotspot navigation is based on the metric column selected as a Data of Interest.For the Basic Hotspots analysis, this is CPU Time . Use the Source /Assembly buttons to togglethe Source /Assembly panes (if both of them are available) on/off.
Heat map markers to quickly identify performance-critical code lines (hotspots). The bright bluemarkers indicate hot lines for the function you selected for analysis. Light blue markers indicatehot lines for other functions. Scroll to a marker to locate the hot code line it identifies.
By default, when you double-click the hotspot in the Bottom-up pane, the VTune Amplifier opens the sourcefile related to this function with the hottest code line highlighted. For the NQUEENS_ip_SETQUEEN function,
this is the code line that is used to create a local copy of the queens array to avoid a data race. Click the Source Editor button on the Source window toolbar to open the default code editor and work on optimizingthe code.
NOTE:
Depending on the sample code version, your source line numbers may slightly differ from the numbersprovided in this tutorial.
Key Terms• CPU time• Viewpoint
Next StepResolve Issue
Resolve Issue
You identified that the most time-consuming function is NQUEENS_ip_SETQUEEN. If you click the Source Editor button from the Source pane, the VTune Amplifier opens the sourcenqueens_parallel.f90 file at the hotspot line in the default code editor. You see that the OpenMP* cycle iscalling the recursive setQueen function that initializes the queens array. To avoid a data race, this array iscopied in each thread (see line 127):
NOTE:
Depending on the sample code version, your source line numbers may slightly differ from the numbersprovided in this tutorial.
2 Tutorial: Finding Hotspots
22

This means that the number of local copies is equal to the number of threads. Since the function is recursive,the array is also copied in every function call, which is unnecessary and creates a big overhead.
To resolve this issue, you may enable OpenMP to make a copy of the array per thread. To do this:
1. Comment out lines 124 and 127.
2. Search and replace all lcl_queens entries with queens.3. Edit line 159 to add the PRIVATE(queens) directive.
This enables the OpenMP run-rime to create a private copy of the array for each thread.
4. Save the changes made in the source file.5. From the Visual Studio Build menu, select Rebuild nqueens_parallel.
The project is rebuilt.6. From Visual Studio Debug menu, select Start Without Debugging to run the application.
Visual Studio runs nqueens_parallel.exe. Note that the execution time has reduced from 127336 msto 46975 ms. This means that the proposed solution gives 80361 ms of CPU time reduction.
Finding Hotspots 2
23
To identify other possible performance issues, you may run the Concurrency analysis and see how effectivelyyour application is parallelized.
Next StepRun Concurrency Analysis
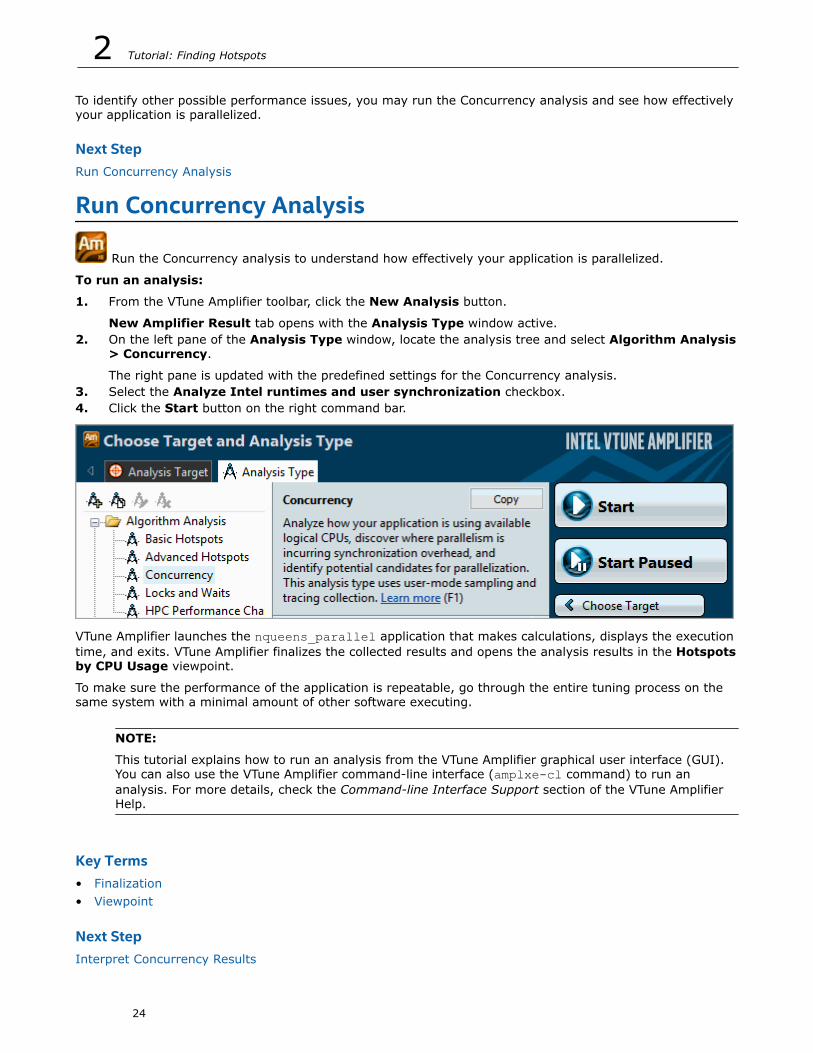
Run Concurrency Analysis
Run the Concurrency analysis to understand how effectively your application is parallelized.
To run an analysis:
1. From the VTune Amplifier toolbar, click the New Analysis button.
New Amplifier Result tab opens with the Analysis Type window active.2. On the left pane of the Analysis Type window, locate the analysis tree and select Algorithm Analysis
> Concurrency.
The right pane is updated with the predefined settings for the Concurrency analysis.3. Select the Analyze Intel runtimes and user synchronization checkbox.4. Click the Start button on the right command bar.
VTune Amplifier launches the nqueens_parallel application that makes calculations, displays the executiontime, and exits. VTune Amplifier finalizes the collected results and opens the analysis results in the Hotspotsby CPU Usage viewpoint.
To make sure the performance of the application is repeatable, go through the entire tuning process on thesame system with a minimal amount of other software executing.
NOTE:
This tutorial explains how to run an analysis from the VTune Amplifier graphical user interface (GUI).You can also use the VTune Amplifier command-line interface (amplxe-cl command) to run ananalysis. For more details, check the Command-line Interface Support section of the VTune AmplifierHelp.
Key Terms• Finalization• Viewpoint
Next StepInterpret Concurrency Results
2 Tutorial: Finding Hotspots
24

Interpret Concurrency Results
When the sample application exits, the Intel® VTune™ Amplifier finalizes the results and opens theHotspots by CPU Usage viewpoint where each window or pane is configured to display data on applicationparallelism and usage of processor cores. To interpret the data on the sample code performance, do thefollowing:
1. Explore application-level concurrency2. Identify the most time-consuming function.
NOTE:
The screenshots and execution time data provided in this tutorial are created on a system with 4 CPUcores. Your data may vary depending on the number and type of CPU cores on your system.
Explore Application-level ConcurrencyStart analysis with the Summary window that opens by default when data collection completes. To interpret
the data, hover over the question mark icons to read the pop-up help and better understand what eachperformance metric means.
You see that after optimization the Elapsed time has reduced from 108.967 seconds to 99.564 seconds.
NOTE:
The Concurrency analysis adds an overhead to the application execution. The overhead often dependson the number of threads and synchronization objects used in the application. This is the reason whyElapsed time data provided in the Summary window may differ from the data reported after theapplication launch outside of the VTune Amplifier.
The CPU Usage Histogram shows that the average concurrency level of the sample application is less than1 while the target concurrency level for this application on the 4-core system is 4. If you hover over thehighest bar, you see that this application has run 1 threads for almost 64 seconds, which is categorized bythe VTune Amplifier as Poor processor utilization on this system.
Finding Hotspots 2
25

Identify the Most Time-consuming FunctionClick the Bottom-up tab to switch to the Bottom-up window and analyze application performance byfunction. By default, the grid is sorted by the CPU Time metric in the descending order. Select the Process/Function/Thread/Call Stack grouping level from the Grouping menu. This granularity enables you tovisualize threads where the hotspots functions were executed.
After initial optimization, the NQUEENS_ip_SETQUEEN function is still a bottleneck. Click the arrow sign atthe NQUEENS_ip_SETQUEEN function. You see that this function's execution was parallelized among fifteenthreads.
2 Tutorial: Finding Hotspots
26

Select these threads in the grid, right-click and choose the Filter In by Selection context menu option. TheTimeline pane below is updated to display data for the selected threads only.
Timeline area. When you hover over the graph element, the timeline tooltip displays the timepassed since the application has been launched.
Threads area that shows the distribution of CPU time utilization per thread. Hover over a bar tosee the CPU time utilization in percent for this thread at each moment of time. Dark green zonesshow the time threads are active. Light-green zones show the time threads were waiting.
Performance metric area that shows application performance over time by a performancemetric. In the Hotspots by CPU Usage viewpoint, CPU Usage and Thread Concurrencymetrics are used.
The CPU Usage chart shows the distribution of CPU time utilization for the whole application. Hoverover a bar to see the application-level CPU time utilization in percent at the particular moment.VTune Amplifier calculates the overall CPU Usage metric as the sum of CPU time per each threadof the Threads area. Maximum CPU Usage value is equal to [number of processor cores] x 100%.
The Thread Concurrency chart shows the application-level thread concurrency at each momentof time. Hover over a bar to see an exact concurrency level at the particular moment.
Transitions . The execution flow between threads where one thread signals to another threadwaiting to receive that signal. You may zoom in to a time region to get more detailed view of thetransitions. To do this, drag and drop to select the region and right-click to select the Zoom In onSelection option from the context menu.
The Timeline pane for the sample application shows a large number of transitions between threads, whichmeans that the threads spent noticeable time transferring execution to each other. If you uncheck theTransitions display option on the right, you see that workload balance is also poor since many of thethreads were waiting for OMP Worker Thread #7 to complete execution.
Run the Locks and Waits analysis to understand what prevents the sample code from effective threadconcurrency and processor utilization.
Key Terms• Thread concurrency• Viewpoint
Next StepRun Locks and Waits Analysis
Finding Hotspots 2
27

Run Locks and Waits Analysis
Run the Locks and Waits analysis to identify synchronization objects that caused contention and fix theproblem in the source.
To run an analysis:
1. From the VTune Amplifier toolbar, click the New Analysis button.
VTune Amplifier result tab opens with the Choose Analysis Type window active.2. From the analysis tree on the left, select Algorithm Analysis > Locks and Waits.
The right pane is updated with the default options for the Locks and Waits analysis.3. Select the Analyze Intel runtimes and user synchronization checkbox.4. Click the Start button on the right command bar.
VTune Amplifier launches the nqueens_parallel executable that makes calculations, displays the executiontime, and exits. VTune Amplifier finalizes the collected data and opens the results in the Locks and Waitsviewpoint.
NOTE:
• To make sure the performance of the application is repeatable, go through the entire tuningprocess on the same system with a minimal amount of other software executing.
• This tutorial explains how to run an analysis from the VTune Amplifier graphical user interface(GUI). You can also use the VTune Amplifier command-line interface (amplxe-cl command) to runan analysis. For more details, check the Command-line Interface Support section of the VTuneAmplifier Help.
Key Terms• Finalization• Viewpoint
Next StepInterpret Locks and Waits Results
2 Tutorial: Finding Hotspots
28

Interpret Locks and Waits Results
When the sample application exits, the Intel® VTune™ Amplifier finalizes the results and opens theLocks and Waits viewpoint that is configured to display synchronization objects sorted by Wait time. Tointerpret the data on the sample code performance, do the following:
1. Identify locks.2. Analyze source code.
Identify LocksClick the Bottom-up tab to open the Bottom-up pane.
The table below explains the type of data provided in the Bottom-up pane:
Synchronization objects that control threads in the application. The hash (unique number) appendedto some names of the objects identify the stack creating this synchronization object.
The utilization of the processor time when a given thread waited for some event to occur. By default,the synchronization objects are sorted by Poor processor utilization type. Bars showing OK or Idealutilization (orange and green) are utilizing the processors well. You should focus your optimization
efforts on functions with the longest poor CPU utilization (red bars if the bar format is selected).
Next, search for the longest over-utilized time (blue bars).
This is the Data of Interest column for the Locks and Waits analysis results that is used for differenttypes of calculations, for example: call stack contribution, percentage value on the filter toolbar.
Number of times the corresponding system wait API was called. For a lock, it is the number of timesthe lock was contended and caused a wait. Usually you are recommended to focus your tuning effortson the waits with both high Wait Time and Wait Count values, especially if they have poor utilization.
Wait time, during which the CPU is busy. This often occurs when a synchronization API causes theCPU to poll while the software thread is waiting. Some Spin time may be preferable to the alternativeof the increased thread context switches. However, too much Spin time can reflect lost opportunityfor productive work.
Finding Hotspots 2
29

In the nqueens_parallel sample code, there are two critical wait objects, OMPCritical_NQUEENS_ip_SETQUEEN and OMP Join Barrier_NQUEENS_ip_SOLVE, that caused redundantsynchronization and took the longest Wait time and highest Wait count. The bar indicators in the Wait Timecolumn indicate that most of the time for these objects processor cores were overutilized.
Analyze Source CodeExplore the source of the critical synchronization objects that caused significant Wait time and poor processorutilization. Double-click the NQUEENS_ip_SETQUEEN object to analyze the source of the
NQUEENS_ip_SETQUEEN wait function. Click the button on the Source pane toolbar to go to the biggesthotspot code line in the function. VTune Amplifier highlights line 142 protected by the OpenMP* criticalsection.
The NQUEENS_ip_SETQUEEN function was waiting for 31.991 seconds while this code line was executing.During this time, this operation was contended 48,345 times.
Hover over any transition line in the Timeline pane below to explore the infotip and make sure that all thetransitions are caused by the OMP Critical_NQUEENS_ip_SETQUEEN critical section.
The OMP Critical_NQUEENS_ip_SETQUEEN section is the place where the application is serializing. Eachthread has to wait for the critical section to be available before it can proceed. Only one thread can be in thecritical section at a time.
2 Tutorial: Finding Hotspots
30

You need to optimize the code to make it more concurrent. Click the Source Editor button on the Sourcewindow toolbar to open the code editor and optimize the code.
Key Terms• Elapsed time• Wait time
Next StepRemove Lock
Remove Locks
In the Source window, you located the synchronization objects that caused significant waits while theprocessor cores were underutilized . To resolve the issue, do the following:
1. Open the code editor.2. Modify the code to remove locks.3. Recompile the project and check the result.
Open the Code Editor
NOTE:
Depending on the sample code version, your source line numbers may slightly differ from the numbersprovided in this tutorial.
Click the Source Editor button to open the nqueens_parallel.f90 file in your default editor:
Remove LocksThe critical section introduced in line 141 protects the global variable from a race condition in amultithreaded application but it spawns a redundant synchronization. To resolve this issue, you may replacethe critical section with an atomic operation as follows:
1. Edit like 141 to replace the OMP CRITICAL with the OMP ATOMIC directive.2. Comment out or remove line 143.
Finding Hotspots 2
31

3. Save your changes.
Recompile the Project and Check the Result1. From the Build menu, select Rebuild nqueens_parallel.
The project is rebuilt.2. From the Debug menu, select Start Without Debugging to run the application.
Visual Studio runs the nqueens_parallel.exe. Note that execution time reduced from 46975 ms to21315 ms.
Key Terms• Wait time
Next StepCompare with Previous Result
Compare with Previous Result
You made sure that removing the critical section gave you 25660 ms of optimization in the applicationexecution time. To understand the impact of your changes and how the CPU utilization has changed, re-runthe Locks and Waits analysis on the optimized code and compare results:
1. Compare results before and after optimization.2. Identify the performance gain by metrics.3. Compare timeline data.
Compare Results Before and After Optimization1. Run the Locks and Waits analysis on the modified code.2.
Click the Compare Results button on the VTune Amplifier toolbar. If you are using VTune Amplifierwithin Microsoft* Visual Studio, select Tools > Intel VTune Amplifier <version> > Compare.
The Compare Results window opens.3. Specify the Locks and Waits analysis results you want to compare:
2 Tutorial: Finding Hotspots
32

The Summary window opens providing the statistics for the difference between collected results.
Identify the Performance Gain by MetricsThe Result Summary section of the Summary window shows that after optimization all critical metricvalues has reduced significantly. The Elapsed Time data shows the optimization of 23.368 seconds for thewhole application. Wait Time decreased by 90.243 seconds, Wait Count - by 48,344.
NOTE:
The Locks and Waits analysis adds an overhead to the application execution. The overhead oftendepends on the number of threads and synchronization objects used in the application. This is thereason why Elapsed time data provided in the Summary window may differ from the data reportedafter the application launch outside of the VTune Amplifier.
In the Bottom-up pane, locate the OpenMP* critical section you identified as a bottleneck in your code.Since you removed it during optimization, the optimized result does not show any performance data for thissynchronization object. If you collapse the Wait Time: Difference column by clicking the button, you seethat with the optimized result you got 31.991 seconds of optimization in Wait time.
Finding Hotspots 2
33

Compare Timeline DataOpen the optimized result of the Locks and Waits analysis, open the Bottom-up tab, and analyze theTimeline pane.
The optimized result does not have multiple transitions anymore. Though the threads are not fully balanced,the wait regions have reduced.
Compare analysis results regularly to look for regressions and to track how incremental changes to the codeaffect its performance. You may also want to use the VTune Amplifier command-line interface and run theamplxe-cl command to test your code for regressions. For more details, see the Command-line InterfaceSupport section in the VTune Amplifier online help.
Key Terms• Elapsed time• Thread concurrency• Wait time
2 Tutorial: Finding Hotspots
34

Summary 3 You have completed the Finding Hotspots tutorial. Here are some important things to remember when
using the Intel® VTune™ Amplifier to analyze your code for hotspots:
Step Tutorial Recap Key Tutorial Take-Aways
1. Prepare foranalysis
If you used the Visual Studio*IDE: You chose the target forthe Basic Hotspots analysis,configured Visual Studio togenerate symbol informationfor your binary files, built thetarget in the Release mode,and created the performancebaseline.
If you used the standaloneGUI: You set up yourenvironment to enablegenerating symbol informationfor your binary files, built thetarget in the Release mode,created the performancebaseline, and created theVTune Amplifier project foryour analysis target.
• Configure your project properties to get themost accurate results for user binaries and toanalyze the performance of your application atthe code line level.
• Create a performance baseline to compare theapplication versions before and afteroptimization. Make sure to use the sameworkload for each application run.
• Use the New Amplifier Result tab to chooseand configure your analysis target. For VisualStudio* projects, the analysis target settingsare inherited automatically.
• Use the Analysis Type configuration windowto choose, configure, and run the analysis. Youcan also run the analysis from command lineusing the amplxe-cl command.
2. Find hotspots You launched the BasicHotspots data collection thatanalyzed function calls andCPU time spent in eachprogram unit of yourapplication and identified thefollowing hotspots:
• A function that took themost CPU time and couldbe a good candidate foralgorithm tuning.
• The code section that tookthe most CPU time toexecute.
• Start analyzing the performance of yourapplication from the Summary window toexplore the performance metrics for the wholeapplication. Then, move to the Bottom-upwindow to analyze the performance perfunction. Focus on the hotspots - functionsthat took the most CPU time. By default, theyare located at the top of the table.
• Double-click the hotspot function in theBottom-up pane or Call Stack pane to openits source code and navigate between hotspotsusing the Source window navigation buttons.
3. Eliminatehotspots
You optimized the algorithmby enabling the OpenMP*library create a private copy ofthe array. You rebuilt theapplication and gotperformance gain of 80361ms.
Click the Source Editor button to open yourdefault source editor directly from the VTuneAmplifier Source window.
35

Step Tutorial Recap Key Tutorial Take-Aways
4. Analyzeconcurrency
You launched the Concurrencyanalysis and identified poorthread concurrency for thewhole application execution.You analyzed the timeline andidentified poor thread balance:all OpenMP threads wereconstantly transferringexecution to each other andwere waiting for all threads tocomplete execution.
• Start your analysis with the Summarywindow. Consider the Target concurrencymetric specified in the CPU Usage Histogramas your optimization goal. The Average metricis calculated as CPU time / Elapsed time. Usethis number as another baseline for yourperformance measurements. The closer thisnumber to the number of cores, the better.
• In the Bottom-up window, use the Filter Inby Selection context menu option to focus onthe performance-critical functions in the gridand analyze their performance over time in theTimeline pane.
5. Find lock You ran the Locks and Waitsanalysis and identified twosynchronization objects withthe high Wait Time and WaitCount values and poor CPUutilization that could be locksaffecting applicationparallelism. Your next step isto analyze the code of theirwait functions.
• Use the Analysis Type configuration windowto choose, configure, and run the analysis. Forrecently used analysis types, you may use theshortcuts to run a recent analysis:
• In the standalone interface: From the Filemenu, select New >[recent_analysis_type].
• In Visual Studio: Click the down arrow next
to the New Analysis button on theVTune Amplifier toolbar and select therequired analysis type from the drop-downlist.
• In the Bottom-up window, focus on thesynchronization objects that under- or over-utilized the available logical CPUs and have thehighest Wait time and Wait Count values. Bydefault, the objects with the highest Wait timevalues show up at the top of the window.
6. Remove lock You optimized the applicationexecution time by removingthe unnecessary criticalsection that caused redundantsynchronization .
Double-click the most time-criticalsynchronization object in the Bottom-up pane.This opens the source code for the wait function itbelongs to. Use the hotspot navigation buttons toidentify the most time-critical code lines.
7. Check yourwork
You ran the Locks and Waitsanalysis on the optimized codeand compared the resultsbefore and after optimizationusing the Compare mode ofVTune Amplifier.
Perform regular regression testing by comparinganalysis results before and after optimization.
Click the Compare Results button on theVTune Amplifier toolbar. From command line, usethe amplxe-cl command.
Next step: Prepare your own application(s) for analysis. Then use the VTune Amplifier to find and eliminatehotspots.
3 Tutorial: Finding Hotspots
36

Key Terms 4baseline: A performance metric used as a basis for comparison of the application versions before and afteroptimization. Baseline should be measurable and reproducible.
CPU time: The amount of time a thread spends executing on a logical processor. For multiple threads, theCPU time of the threads is summed. The application CPU time is the sum of the CPU time of all the threadsthat run the application.
Elapsed time : The total time your target ran, calculated as follows: Wall clock time at end ofapplication - Wall clock time at start of application.
finalization: A process during which the VTune Amplifier converts the collected data to a database, resolvessymbol information, and pre-computes data to make further analysis more efficient and responsive.
hotspot: A section of code that took a long time to execute. Some hotspots may indicate bottlenecks andcan be removed, while other hotspots inevitably take a long time to execute due to their nature.
target: A target is an executable file you analyze using the VTune Amplifier.
thread concurrency: A performance metric that helps identify how an application utilizes the processors inthe system by comparing the application concurrency level (the number of active threads) and targetconcurrency level (by default, equal to the number of physical cores). Thread concurrency may be higherthan CPU usage if threads are in the runnable state and not consuming CPU time.
Utilization Type
Defaultcolor
Description
Idle All threads in the program are waiting - no threads are running. There can beonly one node in the Summary chart indicating idle utilization.
Poor Poor utilization. By default, poor utilization is when the number of threads is upto 50% of the target concurrency.
OK Acceptable (OK) utilization. By default, OK utilization is when the number ofthreads is between 51-85% of the target concurrency.
Ideal Ideal utilization. By default, ideal utilization is when the number of threads isbetween 86-115% of the target concurrency.
Over Over-utilization. By default, over-utilization is when the number of threads ismore than 115% of the target concurrency.
viewpoint : A preset result tab configuration that filters out the data collected during a performance analysisand enables you to focus on specific performance problems. When you select a viewpoint, you select a set ofperformance metrics the VTune Amplifier shows in the windows/panes of the result tab. To select therequired viewpoint, click the (change) link and use the drop-down menu at the top of the result tab.
Wait time: The amount of time that a given thread waited for some event to occur, such as: synchronizationwaits and I/O waits.
37