turnover - texas a&m university - human...
TRANSCRIPT

Staff Workforce Analytics and Trends Report Series
TURNOVER
Fiscal Year 2013
Produced by Texas A&M University, Human Resources, April 2013

Staff Workforce Analytics and Trends April 6, 2013 Turnover FY2013 Page 2
Contents
Executive Summary .......................................................................................................................................... 3 University Staff Workforce...............................................................................................................................6 Turnover Analytics and Analyses Total Separations and Turnover ........................................................................................................ 7 Voluntary Terminations .....................................................................................................................9 Involuntary Terminations ................................................................................................................ 10 Separations by EEO Job Category ................................................................................................... 11 Separations by Years of Service ........................................................................................................ 13 Separations by First Year Employees .............................................................................................. 15 Separations by Gender ...................................................................................................................... 16 Separations by Race/Ethnicity ......................................................................................................... 17 Unemployment Compensation Claims ............................................................................................ 19 Appendix 1: Overview, Scope and Methodology ........................................................................................... 21 Appendix 2: Detail Data for University Staff Workforce ............................................................................. 22 Appendix 3: Modified Terminations and Turnover .................................................................................... 23 Appendix 4: Detail Data by Executive Level:
Item 1: Number of Total Separations FY2010 – FY2012 ......................................................................25 Item 2: Number of Voluntary Terminations FY2010 – FY2012 .......................................................... 26 Item 3: Number of Involuntary Terminations FY2010 – FY2012 ........................................................ 27 Item 4: Number of Separations by EEO Job Category FY2010 – FY2012 .......................................... 28 Item 5: Number of Separations by Years of Service FY2010 – Fy2012 ............................................... 29 Item 6: Number of Separations by Gender FY2010 – FY2012 ............................................................ 30 Item 7: Number of Separations by Race/Ethnicity FY2010 – FY2012 ................................................. 31
Appendix 5: Supplemental Data for Academic Affairs:
Item 1: Number of Total Separations FY2010 – FY2012 ..................................................................... 32 Item 2: Number of Voluntary Terminations FY2010 – FY2012 .......................................................... 33 Item 3: Number of Separations by EEO Job Category FY2010 – FY2012 .......................................... 34

Staff Workforce Analytics and Trends April 6, 2013 Turnover FY2013 Page 3
Executive Summary
Introduction The health of an organization depends in large part on the recruitment, retention and leadership of its single most-valuable resource: its employees. To that effort, the Staff Workforce and Analytics Trends report series is designed to put informative data and analyses into the hands of Texas A&M University management. Nine periodic reports provide human resource-related information on budgeted staff employees and include relevant metrics, trends and commentary. Information in this Turnover report – second in the series - focuses on employee separations from Texas A&M University and the effect on unemployment compensation claims. Turnover, expressed as a percentage of the number of separations over total employment, occurs when employees leave the university through their own voluntary termination actions such as finding a job with another organization, going back to school or retiring from the workforce, or through an employer’s actions in the form of involuntary terminations such as dismissals or layoffs. In basic terms turnover measures the number of employees who have left an organization in relation to those who have stayed with the organization. Some turnover is healthy and essential. Understanding the factors that precipitate uncontrollable departures such as loss of employees because of spousal relocation, illness in the family, etc. can lead to development of policies and procedures that can help lower or mitigate the effects of such losses. Similarly, investigating trends in separations might help the organization identify areas in which working conditions do not support talent retention. Turnover can be a costly process affecting both the financial and cultural health of an organization. Cost of turnover includes separation processing costs, replacement hiring costs, training new hire costs, and lost productivity - as well as the intangible cost of low employee morale. Analyzing and responding to turnover rates can be tricky and management should be aware of the potential message in both high and low turnover. High voluntary turnover may indicate an organization is unable to move forward because it is playing catch up with training and recruiting, is not paying competitive salaries, or is not providing a challenging atmosphere for developing employees. Low voluntary turnover may indicate the organization is stagnant, no opportunities for growth, and there is a lack of ideas from new blood. Separations occurring in the first years of employment may indicate a poor match between the expectations/qualifications of the new employee and the expectation of the organization. Bottom line, comparing preventable turnover versus unavoidable turnover can reveal reasons behind turnover and help to develop appropriate and effective strategies to retain a quality workforce. Overall Observations Employee separation data contained in this report reflect a general upward trend in terminations and turnover over the past three fiscal years. There was a total loss of 1,928 employees in FY2012, sharply increasing the overall turnover rate from 14.8% in FY 2011 to 29.3% in FY2012. As a comparison, the statewide turnover rate for classified employees at state agencies for FY2012 was 17.3% and the Systemwide turnover rate for the Texas A&M University System for FY2012 was 19.3%.
Texas A&M University has 170
departments with 4,800
budgeted staff employees and
2,600 faculty supporting the
core teaching, research and
service mission of the university.

Staff Workforce Analytics and Trends April 6, 2013 Turnover FY2013 Page 4
The primary driver of this spike upward between FY2011 and FY2012 was the outsourcing action that took place in August 2012. While not considered a formal reduction-in-force (RIF), the involuntary terminations that took place as a result of the outsourcing action were coded as a RIF since this termination code most accurately reflected the reason for termination of those employees. This event significantly affected all turnover statistics contained in this report and the reported FY2012 turnover rate is not truly indicative of A&M’s workplace culture or retention success inasmuch as the loss of nearly 1,100 positions to an outside vendor was not preventable. As such, Appendix 3 presents modified analytics for separations and turnover without the involuntary terminations attributable to the outsourcing action. The modified analytics reflect a 14.7% increase in terminations and an overall turnover rate of 14.9% Voluntary terminations increased by 9.5% in FY2012 as compared to FY2011 and represented 46.8% of all separations in FY2012. Involuntary terminations dramatically increased by 602.7% in FY2012 largely due to the outsourcing action, and represented 53.2% of all separations. The voluntary turnover rate increased slightly from 12.6% in FY2011 to 13.7% in FY2012. The involuntary turnover rate increased significantly from 2.2% in FY2011 to 15.6% in FY2012. Separations within the EEO job categories increased across all six categories with the greatest number of separations seen in the Service/Maintenance category, as one might expect as a result of the outsourcing action. The highest turnover rate by EEO job category was 78.9% for Service/Maintenance employees. Years of service time separations increased across all service year ranges with the greatest number of separations for employees with 2 to 5 years of service. Separations for Female continued to outpace those of Male, even though separations for Male more than doubled in FY2012. The turnover rate in FY2012 by gender was 36.8% for Female and 23.5% for Male. Separations by race/ethnicity increased across all groups, with the greatest impact seen in White, Black or African American and Hispanic. The proportion of separations by Minority employees rose from about 35% in FY2011 to nearly 51% in FY2012. Total Unemployment Compensation Insurance (UCI) claims received and reviewed through the Texas Workforce Commission’s adjudication process increased between FY2010 and FY2011 however; there was a 33% drop in claims processed in FY2012. This decrease is likely due to fewer non-outsourcing related RIF actions in FY 2012 as compared to previous fiscal years and the phasing out of several federally funded UCI benefit programs (see appendix 3). Data in this report reflects the University’s actions over the last three years to meet budget targets and increase efficiencies and suggests the need to continue to track turnover and strive to better understand the reasons why employees voluntarily stay or leave. The August 2012 outsourcing action has skewed the data for FY2012. Our FY2013 turnover report should be more representative of real turnover. Report Content This report’s primary emphasis is to display total separations, further viewing both voluntary versus involuntary termination types, and by various demographics of separating employees. These data are purposely intended to present terminations and turnover at the highest levels of the university, and do not include transfers by employees from one department to another within the university.
The university’s turnover rate in
FY2012 was 29.3%, a dramatic
increase from the previous
year’s rate of 14.8% and
primarily driven by the
outsourcing of some campus
functions in August 2012.

Staff Workforce Analytics and Trends April 6, 2013 Turnover FY2013 Page 5
Information is first presented about the university’s staff workforce during the fall of FY2011, FY2012 and FY2013 as a reference point from which to view data specific to this report. There are nine sets of data included in the Analytics and Analyses portion of the report on the following pages: Total Separations, Voluntary Terminations, Involuntary Terminations, Separations by EEO Job Category, Separations by Years of Service, Separations by First Year Employees, Separations by Gender, Separations by Race/Ethnicity, and Unemployment Compensation Claims. These categories are reported at the university level for three fiscal years, 2010 through 2012. Following the nine data sets and discussion is Appendix 1 which describes the data sources and scope, Appendix 2 which provides a snapshot of the university’s workforce, Appendix 3 which provides separations and turnover without the involuntary terminations from the outsourcing action, and Appendix 4 which provides selected detail data by executive level.

Staff Workforce Analytics and Trends April 6, 2013 Turnover FY2013 Page 6
5949 5860
4834
0
1000
2000
3000
4000
5000
6000
7000
2011 2012 2013
# Em
plo
yee
s
Fiscal Year
Headcount Trend
19% reduction in 3 years
University Staff Workforce Budgeted staff employees make up approximately 65% of the university’s total budgeted workforce, and are generally employees who do not perform teaching responsibilities in their primary duties. Staff employees include a vast array of positions, from administrative assistant to nurse, police officer to lab technician, student development specialist to director. These employees daily provide the administrative, accounting, maintenance, and other support functions in nearly 170 departments that enable the university to fulfill its core mission of teaching, research and public service. The university’s budgeted staff workforce declined from 5,949 employees in FY2011 to 4,834 by FY2013. The loss of 1,115 employees was a 19% reduction in the staff workforce in three years. A significant portion of the total loss was due to the outsourcing of dining, maintenance, custodial and landscape services, and the administrative staff to manage those services, at the end of FY2012, although there had been a general downward trend in employee headcount for several years. The outsourcing had a significant impact on the types of jobs at the university as a majority of eliminated positions did not require formal degrees and many involved manual skilled labor with on the job education or training. As the workforce size changed, the proportion of employees in jobs with administrative, technical or office-based duties and formal education increased. Considering only the current reporting period in FY2013, Professional Non-Faculty is the largest single group of employees by EEO job categories, one in which employees must generally possess post-secondary degrees or a combination of formal education and experience. Skilled Craft and Service/Maintenance represent the smallest two of six job categories.
Executive/Administrative/Managerial and Professional Non-Faculty combined total 3,363 employees, and represents nearly 70% of staff positions at the university.
Secretarial/Clerical and Technical/Paraprofessional are the third and fourth largest groups with about 14% and 7% of the workforce respectively.
The two smallest groups combined, Service/Maintenance and Skilled Craft, represent just over 9% of the workforce.
Staff Workforce Analytics and Trends April 6, 2013 Turnover FY2013 Page 7
857970
1928
0
500
1000
1500
2000
2500
2010 2011 2012
# Se
par
atio
ns
Fiscal Year
Total Separations
125% increase in 3 years
81146
1026
776824
902
0
200
400
600
800
1000
1200
2010 2011 2012
# Te
rmin
atio
ns
Fiscal Year
Voluntary vs Involuntary Terminations
Involuntary Voluntary
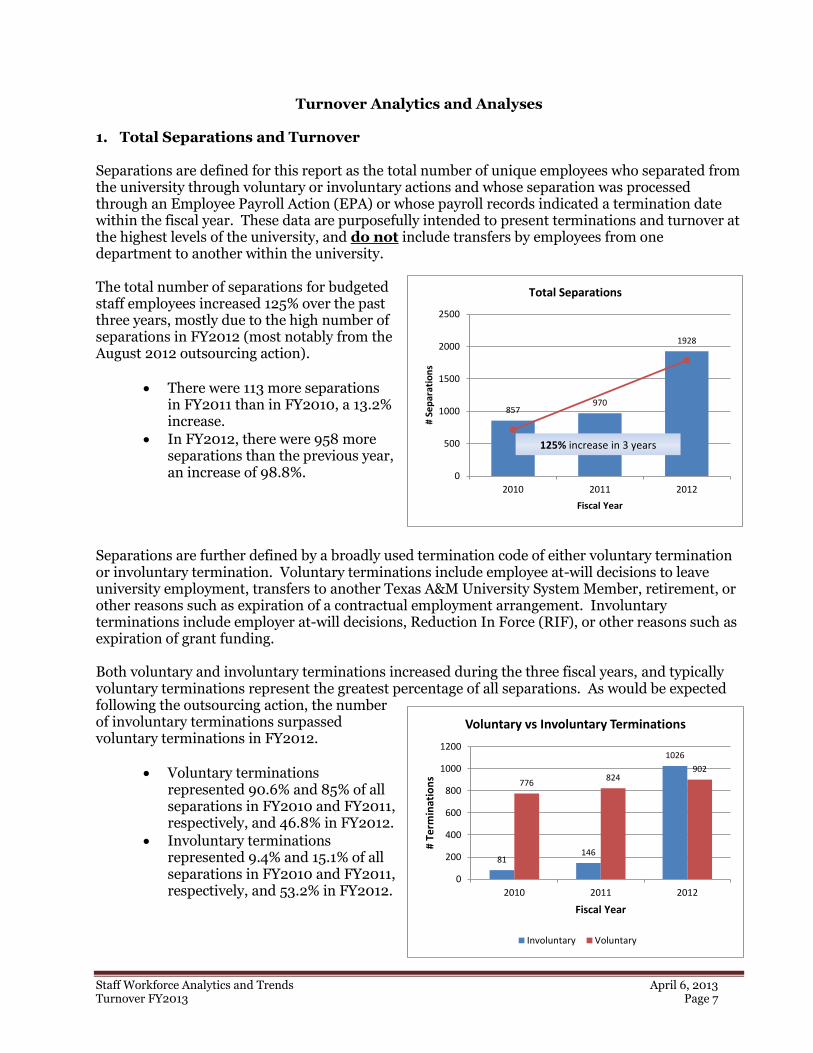
Turnover Analytics and Analyses 1. Total Separations and Turnover Separations are defined for this report as the total number of unique employees who separated from the university through voluntary or involuntary actions and whose separation was processed through an Employee Payroll Action (EPA) or whose payroll records indicated a termination date within the fiscal year. These data are purposefully intended to present terminations and turnover at the highest levels of the university, and do not include transfers by employees from one department to another within the university. The total number of separations for budgeted staff employees increased 125% over the past three years, mostly due to the high number of separations in FY2012 (most notably from the August 2012 outsourcing action).
There were 113 more separations in FY2011 than in FY2010, a 13.2% increase.
In FY2012, there were 958 more separations than the previous year, an increase of 98.8%.
Separations are further defined by a broadly used termination code of either voluntary termination or involuntary termination. Voluntary terminations include employee at-will decisions to leave university employment, transfers to another Texas A&M University System Member, retirement, or other reasons such as expiration of a contractual employment arrangement. Involuntary terminations include employer at-will decisions, Reduction In Force (RIF), or other reasons such as expiration of grant funding. Both voluntary and involuntary terminations increased during the three fiscal years, and typically voluntary terminations represent the greatest percentage of all separations. As would be expected following the outsourcing action, the number of involuntary terminations surpassed voluntary terminations in FY2012.
Voluntary terminations represented 90.6% and 85% of all separations in FY2010 and FY2011, respectively, and 46.8% in FY2012.
Involuntary terminations represented 9.4% and 15.1% of all separations in FY2010 and FY2011, respectively, and 53.2% in FY2012.

Staff Workforce Analytics and Trends April 6, 2013 Turnover FY2013 Page 8
166264
148215 223 219191 191
277285 292
1284
0
200
400
600
800
1000
1200
1400
2010 2011 2012
Fiscal Year
Separations By Fiscal Year Quarter
Q1: Sep-Nov Q2: Dec-Feb Q3: Mar-May Q4: Jun-Aug
12.8%14.8%
29.3%
0%
5%
10%
15%
20%
25%
30%
35%
2010 2011 2012
Fiscal Year
Turnover Rate of Total Separations
The timing of separations allows management to examine their processes and staffing needs. As would be expected at an academic institution that operates most activities along academic semester periods, separations during the fiscal year fluctuates each quarter. The last fiscal quarter (June, July, August) had the highest number of separations each year and highest percent of total separations.
Quarter 4 represented 33.3% and 30.1% of all separations during FY2010 and FY2011, respectively, and 66.6% during FY2012.
The average number of separations per quarter was 214 and 243 during FY2010 and FY2011, respectively, and 482 in FY2012.
Turnover rate is a method of evaluating the frequency by which a position is vacated and filled during the year. Turnover rate is calculated from the total number of separations divided by the total number of budgeted staff positions which had an occupant for any portion of the fiscal year. The overall turnover rate increased each of the three past years and nearly doubled in FY2012 to 29.3%, largely in part due to the outsourcing action.
Turnover for all separations was 12.8% in FY2010 and increased 2% to 14.8% in FY2011.
Turnover was 29.3% in FY2012, an increase of 14.5% from FY2011.
As a comparison, the Systemwide turnover rate for the A&M System was 15.87% in FY2011 and 19.26% in FY2012 and the statewide turnover rate for state agencies in FY2012 was 17.3% as reported by the State Auditor’s Office.

Staff Workforce Analytics and Trends April 6, 2013 Turnover FY2013 Page 9
FY2010 FY2011 FY2012
Voluntary Termination 776 824 902
Total Separations 857 970 1928
Percentage Voluntary 90.5% 84.9% 46.8%
Total Separations Attributed to Voluntary Terminations
585618
669
31 2381
139 138 134
21 45180
100
200
300
400
500
600
700
2010 2011 2012
# Te
rmin
atio
ns
Fiscal Year
Voluntary Termination Reason
At Will Transf Out Retire Other
2. Voluntary Terminations Voluntary terminations are the subset of total separations for which employees were identified as voluntarily terminating from the university, further disaggregated by several broad thematic reasons for the separations. Voluntary terminations include employee at-will decisions to leave university employment, transfers to another Texas A&M University System Member, retirement, or other reasons such as expiration of a contractual employment arrangement. The number of voluntary terminations increased each year between FY2010 and FY2012.
There were 48 more voluntary terminations in FY2011 than in FY2010, a 6.2% increase.
In FY2012, there were 78 more voluntary terminations over the previous year, an increase of 9.5%.
The proportion of separations attributable to voluntary terminations decreased from 90.5% in FY2010 to 46.8% by FY2012.
Four thematic reasons categorize why employees voluntarily separated from university employment: 1) employees taking advantage of the at-will employment relationship to terminate their employment for professional or personal decisions; 2) employees transferring employment to another A&M System Member; 3) retiring from state employment; and 4) Other reasons, which includes contractual expiration and death of the employee. At will decisions continued to be the most often cited reason for voluntary terminations.
At-will decisions represented 75% of voluntary terminations in FY2010 and FY2011, and 74.2% in FY2012.
Transfer out decisions represented about 3% of voluntary terminations during the first two years and 9% in FY2012.
Retirement was about 17% of all voluntary terminations in FY2010 and FY2011, and 14.9 % in FY2012.
Voluntary turnover was 11.6% in FY2010, 12.6% in FY2011 and 13.7% in FY2012.
Separation Type
Number of
Separations Total Pool
Turnover
Rate
Number of
Separations Total Pool
Turnover
Rate
Number of
Separations Total Pool
Turnover
Rate
At Will Decisions 585 6715 8.7% 618 6546 9.4% 669 6579 10.2%
Transfer Out 31 6715 0.5% 23 6546 0.4% 81 6579 1.2%
Retirement 139 6715 2.1% 138 6546 2.1% 134 6579 2.0%
Other 21 6715 0.3% 45 6546 0.7% 18 6579 0.3%
Total Voluntary 776 6715 11.6% 824 6546 12.6% 902 6579 13.7%
Voluntary Turnover Rate for Staff Employees FY2010 - FY2012
FY2010 FY2011 FY2012

Staff Workforce Analytics and Trends April 6, 2013 Turnover FY2013 Page 10
FY2010 FY2011 FY2012
Involuntary Terminations 81 146 1026
Total Separations 857 970 1928
Percentage Involuntary 9.5% 15.1% 53.2%
Total Separations Attributed to Involuntary Terminations
61 55 65
7
81
950
13 10 110
100
200
300
400
500
600
700
800
900
1000
2010 2011 2012
# Te
rmin
atio
ns
Fiscal Year
Involuntary Termination Reason
At Will RIF Other
3. Involuntary Terminations Involuntary terminations are the subset of total separations for which employees were identified as involuntarily terminating from the university, further disaggregated by several broad thematic reasons for the separations. Involuntary terminations include employer at-will decisions, Reduction in Force (RIF), or other reasons such as expiration of grant funding. While not considered a RIF action, involuntary terminations that took place as a result of the August 2012 outsourcing action were coded as RIF since that code most accurately reflected the reason for the termination. (See Appendix 3 for a view of turnover without the involuntary terminations from outsourcing.) The number of involuntary terminations increased each fiscal year between FY2010 and FY2012, with the most dramatic increase in FY2012 driven by the outsourcing action.
There were 65 more involuntary terminations in FY2011 than in FY2010, an 80.2% increase.
In FY2012, there were 880 more involuntary terminations than FY2011, a 602.7% increase.
The proportion of separations attributable to involuntary terminations increased from 9.5% in FY2010 to 53.2% by FY2012.
Three thematic reasons categorize why employees involuntarily terminate from university employment: 1) employers using the at-will employment relationship to terminate employment; 2) a formal RIF process by the employer; and, 3) Other reasons, which include the expiration of grant funding. Involuntary terminations attributed to RIF actions do not include employees who retired or transferred to another position within the university or system before the RIF effective date. Typically the number of at-will decisions is greatest for involuntary terminations however, during FY2011 and FY2012 RIF actions far outnumbered at-will decisions.
During FY2010 and FY2011, at-will decisions represented 75.3% and 37.7%, respectively, of all involuntary terminations, and 6.3% in FY2012.
RIF actions increased in the three years from 8.6% of involuntary terminations in FY2010, to 55.5% in FY2011 and 92.6% in FY2012.
Involuntary turnover was 1.2% in FY2010, 2.2% in FY2011 and 15.6% in FY2012.
Separation Type
Number of
Separations Total Pool
Turnover
Rate
Number of
Separations Total Pool
Turnover
Rate
Number of
Separations Total Pool
Turnover
Rate
At Will Decisions 61 6715 0.9% 55 6546 0.8% 65 6579 1.0%
Reduction in Force 7 6715 0.1% 81 6546 1.2% 950 6579 14.4%
Other 13 6715 0.2% 10 6546 0.2% 11 6579 0.2%
Total Involuntary 81 6715 1.2% 146 6546 2.2% 1026 6579 15.6%
Involuntary Turnover Rate for Staff Employees FY2010 - FY2012
FY2010 FY2011 FY2012

Staff Workforce Analytics and Trends April 6, 2013 Turnover FY2013 Page 11
47 57 61
399443
544
136 159207
65 62 7668 97
215142 152
825
0
100
200
300
400
500
600
700
800
900
2010 2011 2012
# Se
par
atio
ns
Fiscal Year
Separations by EEO Job Category
Exec Prof Secr Cler Tech Para Skilled Service
FY2010 FY2011 FY2012
Executive/Admin/Mgr 5.5% 5.9% 3.2%
Professional Non-Faculty 46.6% 45.7% 28.2%
Secretarial/Clerical 15.9% 16.4% 10.8%
Technical/Paraprof. 7.6% 6.4% 3.9%
Skilled Craft 7.9% 10.0% 11.2%
Service/Maintenance 16.6% 15.7% 42.8%
Total Separations 100.0% 100.0% 100.0%
Percentage of Separations by EEO Job Category
4. Separations by EEO Job Category Separations by Equal Employment Opportunity (EEO) job category are the number of separating employees as viewed within the six staff-related job groupings using the EEO definitions assigned to each position’s title. The number of separations within all but one of the six EEO job categories increased during each of the three fiscal years. Although several job groups were affected by the outsourcing action, the Service/Maintenance group had the highest increase in number and percentage of all separations.
Professional Non-Faculty had 44 more separations in FY2011, an 11% increase, and 100 more in FY2012, a 22.6% increase over the previous year.
Secretarial/Clerical had 23 more separations between FY2010 and FY2011, and 49 more (30.8% increase) separations in FY2012.
Skilled Craft had 29 more separations in FY2011, a 43% increase, and 118 more in FY2012, a 121.6% increase.
Service/Maintenance had 10 more separations in FY2011, a 21.3% increase, and 673 more in FY2012, a 442.8% increase.
Professional Non-Faculty typically represents the greatest percentage of separating employees by job category as the group is also the largest job category at the university. In FY2012, separations by employees in the Service/Maintenance group surpassed all other job categories.
Professional Non-Faculty represented about 46% of all separations in FY2010 and FY2011, and 28.2% in FY2012.
Service/Maintenance represented about 16% of all separations in FY2010 and FY2011, and 42.8% in FY2012.

Staff Workforce Analytics and Trends April 6, 2013 Turnover FY2013 Page 12
Turnover by EEO job category increased significantly in FY2012 within some EEO job categories, most notably being Service/Maintenance which went from a 15.1% turnover rate in FY2011 to 78.9% in FY2012.
EEO Job Category
Number of
Separations Total Pool
Turnover
Rate
Number of
Separations Total Pool
Turnover
Rate
Number of
Separations Total Pool
Turnover
Rate
Executive/Admin/Mgr 47 589 8.0% 57 596 9.6% 61 612 10.0%
Professional Non-Faculty 399 3201 12.5% 443 3178 13.9% 543 3268 16.6%
Secretarial/Clerical 136 991 13.7% 159 936 17.0% 208 851 24.4%
Technical/Paraprof. 65 412 15.8% 62 403 15.4% 76 399 19.0%
Skilled Craft 68 510 13.3% 97 429 22.6% 215 403 53.3%
Service/Maintenance 142 1012 14.0% 152 1004 15.1% 825 1046 78.9%
Total Separations 857 6715 12.8% 970 6546 14.8% 1928 6579 29.3%
FY2010 FY2011 FY2012
Turnover Rate by EEO Job Category FY2010 - FY2012

Staff Workforce Analytics and Trends April 6, 2013 Turnover FY2013 Page 13
238 245
389
211252
547
178 191
333
91124
218
35 44
173
104 114
268
0
100
200
300
400
500
600
2010 2011 2012
# Se
par
atio
ns
Fiscal Year
Separations by Years of Service
Less than 2 2 to 5 6 to 10 11 to 15 16 to 20 More than 20
FY2010 FY2011 FY2012
Less than 2 Years 27.8% 25.3% 20.2%
2 to 5 24.6% 26.0% 28.4%
6 to 10 20.8% 19.7% 17.3%
11 to 15 10.6% 12.8% 11.3%
16 to 20 4.1% 4.5% 9.0%
20 or more Years 12.1% 11.8% 13.9%
Total Separations 100.0% 100.0% 100.0%
Percentage of Separations by Years of Service
5. Separations by Years of Service Separations by years of service are the number of separating employees as viewed within six range groups defining the years of employment accumulated by an employee and recorded as Longevity Months in employee personnel records. Longevity months include employment at the university as well as other Texas state agencies and represents the total institutional knowledge that an employee takes with them upon separation. The number of separations by years of service increased for all groups in FY2012, with the greatest increase being those with two to five years of service.
Employees with less than two years of service had little change between FY2010 and FY2011, however the number of separations increased 144 in FY2012, a 58.8% increase.
Employees with two to five years of service had 41 more (19.4% increase) separations in FY2011 and 295 more (117.1% increase) in FY2012.
Employees with 16 to 20 years of service had 9 more (25.7% increase) separations in FY2011, and 129 more in FY2012, a 293.2% increase.
Employees with more than 20 years of service, had 10 more (9.6% increase) separations in FY2011 and increased another 154 (135.1%) in FY2012.
Employees with two to five years of service represented the largest group of separations during FY2011 and FY2012. It is worth noting that an average of 68.8% of separations during the three last fiscal years was for employees with 10 or fewer years of service.
Employees with less than two years of service represented 25% to 27% of separations in FY2010 and FY2011, and 20.2% in FY2012.
Employees with two to five years of service were 24% to 26% of separations in FY2010 and FY2011, and 28.4% FY2012.
The percentage of separations by employees with 16 to 20 years of service doubled from 4.5% in FY2011 to 9% in FY2012.

Staff Workforce Analytics and Trends April 6, 2013 Turnover FY2013 Page 14
Turnover by years of service increased for all service ranges during FY2012, most notably for employees with less than 2 years of service, with 2 to 5 years, and those with 16 to 20 years.
Years of Service Range
Number of
Separations Total Pool
Turnover
Rate
Number of
Separations Total Pool
Turnover
Rate
Number of
Separations Total Pool
Turnover
Rate
Less than 2 238 909 26.2% 245 755 32.5% 389 832 46.8%
2 to 5 211 1285 16.4% 252 1253 20.1% 547 1437 38.1%
6 to 10 178 1403 12.7% 191 1321 14.5% 333 1239 26.9%
11 to 15 81 1133 7.1% 107 1197 8.9% 218 1179 18.5%
16 to 20 45 794 5.7% 61 787 7.8% 173 642 26.9%
More than 20 104 1191 8.7% 114 1233 9.2% 268 1250 21.4%
Total Separations 857 6715 12.8% 970 6546 14.8% 1928 6579 29.3%
Turnover Rate by Years of Service FY2010 - FY2012
FY2010 FY2011 FY2012

Staff Workforce Analytics and Trends April 6, 2013 Turnover FY2013 Page 15
FY2010 FY2011 FY2012
Separations Within First Year 131 121 233
Total Separations 857 970 1928
Percentage First Year 15.3% 12.5% 12.1%
Total Separations Attributed to First Year Employees
1422
106117
99
127
0
20
40
60
80
100
120
140
2010 2011 2012
# Se
par
atio
ns
Fiscal Year
Separations for First Year Employees
Involuntary Voluntary
6. Separations by First Year Employees Separations by first year employees are the number of employees with 12 or fewer months of service at separation. The first 12 months of an employee’s experience at the university can be critical to the long-term success of the employee. Following sound hiring procedures and providing for a high-quality orientation process can help assure the right hire for the organization and the right start for an employee. There was a sharp increase in the number of separations by first year employees in FY2012, although the percentage of all separations attributable to first year employees actually decreased due to the large number of separations university-wide.
Employees within their first year of service had 112 more separations in FY2012 than FY2011, a 92.6% increase.
Separations by first year employees represented 12.1% of all separations in FY2012.
Viewing the voluntary versus involuntary termination reasons under which a first year employee separates from the university can provide insight to whether the job fit was right for either the new employee or the employer, or possibly both parties. Typically first year employees separate more often for voluntary reasons. During the past three fiscal years, the number of involuntary separations by first year employees sharply increased, driven most by the RIFs in FY2011 and the outsourcing action in FY2012.
As a proportion of separations by first year employees, the percentage attributable to involuntary terminations were 10.7% and 18.2% in FY2010 and FY2011, respectively, and 45.5% in FY2012.
Voluntary terminations for employees separating within the first year were 89.3% and 81.8% in FY2010 and FY2011, respectively, and 54.5% in FY2012.

Staff Workforce Analytics and Trends April 6, 2013 Turnover FY2013 Page 16
FY2010 FY2011 FY2012
Separations by Female 458 540 1057
Total Separations 857 970 1928
Percentage Female 53.4% 55.7% 54.8%
Total Separations Attributed to Female Employees
458540
1057
399 430
871
0
200
400
600
800
1000
1200
2010 2011 2012
# Se
par
atio
ns
Fiscal Year
Separations by Gender
Female Male
7. Separations by Gender Separations by gender are the number of separating employees as viewed by either Female or Male gender categories identified from employee personnel records. Gender identification, as well as race and/or ethnicity shown on the next page, are demographics self-reported by each employee within their personnel records in the A&M System’s HRConnect online application. The number of separations by both Male and Female increased during the three year period although the number of Female separations was greater in each fiscal year.
The number of separations attributed to Female employees increased by 82 (17.9%) in FY2011 and another 517 in FY2012, a 95.7% increase.
The number of separations by Male was 31 more (7.8% increase) in FY2011, and 441 more in FY2012, a 102.6% increase.
The proportion of separations by Female remained relatively the same during the three year period.
The proportion of separations by Female ranged between 53.4% and 55.7% during the three year period.
Turnover by gender increased for both Male and Female in FY2012. As a comparison, the turnover rate by gender for the A&M System in FY2012 was 18.42% for Male and 20.08% for Female.
Gender
Number of
Separations Total Pool
Turnover
Rate
Number of
Separations Total Pool
Turnover
Rate
Number of
Separations Total Pool
Turnover
Rate
Female 458 3762 12.2% 540 3686 14.7% 1057 2869 36.8%
Male 399 2953 13.5% 430 2860 15.0% 871 3710 23.5%
Total Separations 857 6715 12.8% 970 6546 14.8% 1928 6579 29.3%
Turnover Rate by Gender FY2010 - FY2012
FY2010 FY2011 FY2012
Staff Workforce Analytics and Trends April 6, 2013 Turnover FY2013 Page 17
548605
920
79 97
365
111 142
492
96 90 100
4 10 1819 26 33
0
100
200
300
400
500
600
700
800
900
1000
2010 2011 2012
# Se
par
atio
ns
Fiscal Year
Separations by Race/Ethnicity
White Black Hispanic Asian Other Not Specified
FY2010 FY2011 FY2012
White 63.9% 62.4% 47.7%
Black or African American 9.2% 10.0% 18.9%
Hispanic 13.0% 14.6% 25.5%
Asian 11.2% 9.3% 5.2%
Amer Indian or Alaskan Nat 0.2% 0.7% 0.3%
Hawaiian Or Other Pac Isl 0.1% 0.0% 0.1%
Two Or More Races 0.1% 0.3% 0.5%
Not Specified 2.2% 2.7% 1.7%
Total Separations 100.0% 100.0% 100.0%
Percentage of Separations by Race/Ethnicity
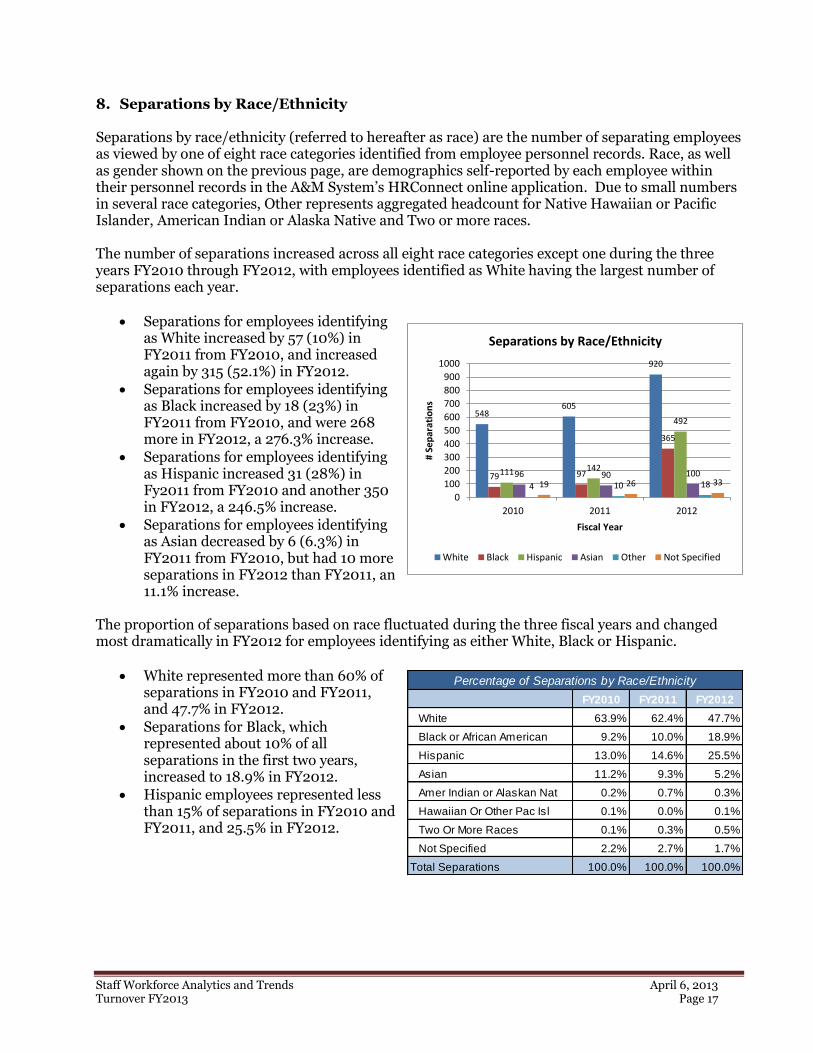
8. Separations by Race/Ethnicity Separations by race/ethnicity (referred to hereafter as race) are the number of separating employees as viewed by one of eight race categories identified from employee personnel records. Race, as well as gender shown on the previous page, are demographics self-reported by each employee within their personnel records in the A&M System’s HRConnect online application. Due to small numbers in several race categories, Other represents aggregated headcount for Native Hawaiian or Pacific Islander, American Indian or Alaska Native and Two or more races. The number of separations increased across all eight race categories except one during the three years FY2010 through FY2012, with employees identified as White having the largest number of separations each year.
Separations for employees identifying as White increased by 57 (10%) in FY2011 from FY2010, and increased again by 315 (52.1%) in FY2012.
Separations for employees identifying as Black increased by 18 (23%) in FY2011 from FY2010, and were 268 more in FY2012, a 276.3% increase.
Separations for employees identifying as Hispanic increased 31 (28%) in Fy2011 from FY2010 and another 350 in FY2012, a 246.5% increase.
Separations for employees identifying as Asian decreased by 6 (6.3%) in FY2011 from FY2010, but had 10 more separations in FY2012 than FY2011, an 11.1% increase.
The proportion of separations based on race fluctuated during the three fiscal years and changed most dramatically in FY2012 for employees identifying as either White, Black or Hispanic.
White represented more than 60% of separations in FY2010 and FY2011, and 47.7% in FY2012.
Separations for Black, which represented about 10% of all separations in the first two years, increased to 18.9% in FY2012.
Hispanic employees represented less than 15% of separations in FY2010 and FY2011, and 25.5% in FY2012.

Staff Workforce Analytics and Trends April 6, 2013 Turnover FY2013 Page 18
290339
975
548605
920
19 26 33
0
200
400
600
800
1000
1200
2010 2011 2012#
Sep
arat
ion
s
Fiscal Year
Separations by Minority/Non-Minority
Minority Non-Minority Not Specified
FY2010 FY2011 FY2012
Separations by Minority 290 339 975
Total Separation 857 970 1928
Percentage Minority 33.8% 34.9% 50.6%
Total Separations Attributed to Minority Employees
In addition to specific race categories, another view of separations is to group race categories into Non-Minority and Minority to provide a broader representation of diversity changes at the university. For this view, Minority represents aggregated data for employees who self-identified as Black, Hispanic, Asian, American Indian, or Two or More Races; Non-Minority represents employees who self-identified as White. The number of separations for Minority surpassed those for Non-Minority in FY2012, reversing a trend that had been seen during the past several years.
Separations by Minority increased by 49 (16.9%) in FY2011 and by 636 in FY2012, a 187.6% increase.
Separations by Non-Minority increased by 57 (10.4%) in FY2011 and by 315 in FY2012, a 52.1% increase.
The proportion of total separations attributed to Minority was about one-third of all separations in the first two years and just over half in FY2012.
Separations attributable to Minority
represented between 33% and 34% of
all separations during FY2010 and
FY2012, respectively, and 50.6% in
FY2012.
Turnover by race increased across all race groups in FY2012. As a comparison, turnover for the A&M System in FY2012 was 16.2% White, 27.35% Black, 25.35% Hispanic, 20.85% Asian, 17.92 % American Indian, 22.02% Two or More Races, and 33.58% Not Specified.
Years of Service Range
Number of
Separations Total Pool
Turnover
Rate
Number of
Separations Total Pool
Turnover
Rate
Number of
Separations Total Pool
Turnover
Rate
White 548 4560 12.0% 605 4410 13.7% 920 4393 20.9%
Black or African American 79 630 12.5% 97 639 15.2% 365 700 52.1%
Hispanic 111 1012 11.0% 142 1014 14.0% 492 1006 48.9%
Asian 96 368 26.1% 90 358 25.1% 100 342 29.2%
Amer Indian or Alaskan Nat 2 31 6.5% 7 30 23.3% 6 25 24.0%
Hawaiian Or Other Pac Isl 1 4 25.0% 0 3 0.0% 2 3 66.7%
Two Or More Races 1 19 5.3% 3 21 14.3% 10 28 35.7%
Not Specified 19 91 20.9% 26 71 36.6% 33 82 40.2%
Total Separations 857 6715 12.8% 970 6546 14.8% 1928 6579 29.3%
Turnover Rate by Race/Ethnicity FY2010 - FY2012
FY2010 FY2011 FY2012

Staff Workforce Analytics and Trends April 6, 2013 Turnover FY2013 Page 19
206
354
236
0
50
100
150
200
250
300
350
400
2010 2011 2012
# C
laim
s
Fiscal Year
UCI Claims Received
15% increase in 3 years
9. Unemployment Compensation Claims There is a direct cost to the university beyond turnover costs for some involuntary terminations known as unemployment compensation insurance (UCI). The UCI cost is in the form of reimbursement payments made to the Texas Workforce Commission (TWC) from the university’s self-funded UCI benefits process. In general, involuntary terminations not due to misconduct associated with the work, e.g., a RIF, could meet the requirements to receive UCI benefits. UCI claims are submitted by former employees directly to TWC and receive individual handling and adjudication by the TWC. Unemployment benefit payments to recipients can last up to 26 weeks if the individual maintains eligibility. Federally funded unemployment benefit programs can allow an individual, if eligible, to remain on benefits for additional periods of time. Reflective of strategic decisions at the university during the last three years to reduce departmental budgets, which typically included the costs of salaries and wages, there was an overall 15% increase in the number of UCI claims received and reviewed.
In FY2011, the number of UCI claims processed was 148 more than the previous year, a 72% increase. Most likely the result of RIF actions and federal UCI extension programs that were in effect in FY 2011.There were 118 fewer UCI claims processed in FY2012 than in FY2011, a 33% decrease, although the number of claims processed was still more than those processed in FY2010.
Although the number of separations significantly increased during FY2012 due to the outsourcing action, any increase in UCI claims, or benefits expense on same paid out, will not be seen until the completion of FY2013; however, there may not a significant increase in claims from outsourced employees since all outsourced employees were offered positions with the vendor. Total UCI benefits paid to TWC on behalf of former employees had an overall 49% increase during the last three years. The spike in claims received and ultimately approved by TWC during FY2011 is generally reflected in the benefits paid in the same year. This three year increase in UCI benefits expense is attributable to the increase in involuntary separations (i.e. RIF and outsourcing) and that typically professional/non-faculty separations represent the greatest percentage of separating employees (higher salaries and higher UCI payments).

Staff Workforce Analytics and Trends April 6, 2013 Turnover FY2013 Page 20
$270,206
$633,131
$401,763
-
100,000
200,000
300,000
400,000
500,000
600,000
700,000
2010 2011 2012
Do
llars
Fiscal Year
UCI Benefits Expense
49% increase in 3 years
$33,308
$90,979
$67,114$78,806
$101,076
$209,435 $214,545
$108,075$115,836
$124,221
$79,846 $81,860
-
50,000
100,000
150,000
200,000
250,000
Q1: Sep-Nov Q2: Dec-Feb Q3: Mar-May Q4: Jun-Aug
Do
llars
UCI Benefits Expense by Fiscal Year Quarters
2010 2011 2012
In FY2011, benefits paid out grew by $362,925 (a 134% increase) from FY2010.
FY2012 benefits expense was $231,368 less than the prior year, a 36.5% decrease, although the total expense was still more than was paid in FY2010.
The potential cost per involuntary termination for UCI claims that cannot be defended through the TWC adjudication process can significantly increase the total cost of turnover. The cost of UCI claims during the past three years ranged from $4,094 to $6,377. Although each UCI claim is paid based on individual salary and wage rates of the former employee, being aware of the potential average cost provides insight to management of additional risks of poor employment practices beyond employee morale, productivity or EEO complaints. Payments to TWC for UCI benefits are expensed during a particular university fiscal year quarter, but may actually be for benefits paid to a former employee during the previous fiscal year quarter. Viewing the quarterly payment schedule reflects the increase and decrease in UCI benefits costs as former employees entered and exited the UCI benefits process.
During FY2010 and FY2011, benefits expense increased dramatically in Quarter 2, and remained high in Quarter 3.
In FY2012, benefits expense was greatest in the first two quarters, most likely due to lagging payments from claims at the end of FY2011.

Staff Workforce Analytics and Trends April 6, 2013 Turnover FY2013 Page 21
APPENDIX 1 Overview Texas A&M University is the flagship institution of The Texas A&M University System, with $1 billion budget and an endowment that typically ranks in the top five nationally among public universities. Playing a key role in the day-to-day operations of the university are about 4,800 staff that provide administrative service and support to future, current and former students, as well as faculty, researchers and campus visitors. The Staff Workforce Analytics and Trends is a series of reports developed by the Texas A&M University Human Resources organization to provide human resource-related information on budgeted staff employees at Texas A&M University–College Station and Qatar. The reports include metrics on a variety of demographic and position-related data, relevant metrics, trends and commentary, and are provided to university management to increase awareness of the make-up of their organization, recognize efficiencies and take advantage of opportunities to build a productive and successful organization. The focus of these reports is on those employees considered to be budgeted staff employees; however the university also employs thousands of faculty, student employees, graduate assistants and seasonal employees. The report series include: Climate; Compensation; Demographics; Generations in the Workplace; Leave Benefits; Recruitment; Retirement; Training; and, Turnover. The reports are disseminated to selected university leadership and posted online on the Human Resources website. Scope of Turnover Report Data are transactional activity during the twelve months of fiscal years 2010, 2011 and 2012.
Data are for active budgeted staff (non-faculty) positions in Part 02 ADLOCs and the current reporting executive and division/college levels.
Data for employee and position-related data are from The Texas A&M University System DataWarehouse.
Separations included in this report were compiled from Employee Payroll Actions (EPA) processed with an occupant action code of IT-Involuntary Termination, VT-Voluntary Termination, TO-Transfer Out or RE-Retire, and for employees with a termination date during the reported fiscal years.
Employees transferring between departments within Part 02 are beyond the scope of this report.
System-wide turnover rates are from The Texas A&M University System Employee Turnover report for Fiscal Year 2012.
Data for employee, position, title, organizational hierarchy and any other relevant data are from The Texas A&M University System DataWarehouse.
Data presented in this report are for the university as a total and further displayed for numerical counts by Executive-level reporting units and, if shown, Division/College level units.
Executive-level reporting units include the colleges, divisions, departments, centers and/or other units that organizationally report directly to one of the eight units listed below: 1) President 2) Executive Vice President and Provost – Academic Affairs 3) Vice President – Administration 4) Vice President – Marketing & Communications 5) Vice President – Research 6) Vice President – Student Affairs 7) Vice President & CFO – Finance 8) University Accounts (temporary executive level as a result of FY2012 outsourcing of dining, maintenance,
custodial and landscape services) Division/College level reporting includes all the departments, centers and/or other units that organizationally report
directly to the Division/College. Methodology for Turnover Report Turnover Rate was calculated by dividing the total number of staff employee separations in a fiscal year by the total
number of budgeted staff positions which had an occupant for any portion of the fiscal year, the result multiplied by 100.
Turnover rates for various characteristics of a person or the position were calculated by a pool of corresponding descriptors, e.g. female employees were counted in the total pool for female turnover rate. In cases where a single position was filled and vacated multiple times during a year, the characteristics, e.g., race, gender, EEO job category, etc., of the last employee in the budgeted position were used.

Staff Workforce Analytics and Trends April 6, 2013 Turnover FY2013 Page 22
APPENDIX 2 - Detail Data for University Staff Workforce
Headcount FY2011 – FY2013 by EEO Job Category and Executive Level
EEO Job Category President
Exec V.P. &
Provost -
Acad Affairs V.P. - Admin
V.P. - Mar &
Comm
V.P. -
Research
V.P. -
Student
Affairs
V.P. & Cfo -
Finance
Univ
Accounts Total
FY2011 241 3140 1434 29 143 674 288 5949
Exec/Admin/Mgr 33 330 33 16 19 84 38 553
Prof Non-Faculty 173 1895 199 13 91 310 145 2826
Secr/Clerical 21 582 108 4 82 84 881
Tech/Paraprof 1 287 37 21 23 6 375
Skilled Craft 8 14 331 44 397
Service/Maint 5 32 726 8 131 15 917
FY2012 245 3050 1468 27 137 659 274 5860
Exec/Admin/Mgr 32 330 35 16 17 87 34 551
Prof Non-Faculty 178 1892 225 11 84 303 142 2835
Secr/Clerical 21 511 111 4 71 80 798
Tech/Paraprof 1 274 33 23 21 3 355
Skilled Craft 8 12 306 46 372
Service/Maint 5 31 758 9 131 15 949
FY2013 248 3087 542 24 141 489 262 41 4834
Exec/Admin/Mgr 34 340 29 12 22 96 35 1 569
Prof Non-Faculty 184 1965 123 12 89 281 139 1 2794
Secr/Clerical 19 459 34 4 74 71 2 663
Tech/Paraprof 1 283 26 18 19 3 1 351
Skilled Craft 6 12 152 9 6 185
Service/Maint 4 28 178 8 10 14 30 272

Staff Workforce Analytics and Trends April 6, 2013 Turnover FY2013 Page 23
857
970 983
0
200
400
600
800
1000
1200
2010 2011 2012
# Se
par
atio
ns
Fiscal Year
Separations (1)
14.7% increase in 3 years
290339
364
548605 599
19 26 20
0
100
200
300
400
500
600
700
2010 2011 2012
# Se
par
atio
ns
Fiscal Year
Separations by Minority/Non-Minority (1)
Minority Non-Minority Not Specified
81146
81
776824
902
0
100
200
300
400
500
600
700
800
900
1000
2010 2011 2012
# Te
rmin
atio
ns
Fiscal Year
Involuntary vs Voluntary Terminations (1)
Involuntary Voluntary
APPENDIX 3 – Modified Terminations and Turnover
Separations FY2010 – FY2012 without Involuntary Terminations Attributed to the Outsourcing Action of FY2012
(1) Chart or table separation data excludes the outsourcing action of August 2012.
585618
669
31 2381
139 138 134
21 45 180
100
200
300
400
500
600
700
800
2010 2011 2012
# Te
rmin
atio
ns
Fiscal Year
Voluntary Termination Reason (1)
At Will Transf Out Retire Other
6155
65
7
81
5
13 10 11
0
10
20
30
40
50
60
70
80
90
2010 2011 2012
# Te
rmin
atio
ns
Fiscal Year
Involuntary Termination Reason (1)
At Will RIF Other
458
540 555
399430 428
0
100
200
300
400
500
600
2010 2011 2012
# Se
par
atio
ns
Fiscal Year
Separations by Gender (1)
Female Male

Staff Workforce Analytics and Trends April 6, 2013 Turnover FY2013 Page 24
12.8%
14.8%14.9%
12%
12%
13%
13%
14%
14%
15%
15%
16%
2010 2011 2012
Fiscal Year
Turnover Rate of Total Separations (1)
1.2%2.2%
1.2%
11.6%12.6%
13.7%
0%
2%
4%
6%
8%
10%
12%
14%
16%
2010 2011 2012
Fiscal Year
Turnover Rate Involuntary vs Voluntary (1)
Involuntary Voluntary
APPENDIX 3 – Modified Terminations and Turnover
Separations FY2010 – FY2012 without Involuntary Terminations Attributed to the Outsourcing Action of FY2012
(1) Chart or table separation data excludes the outsourcing action of August 2012.
Separation Type
Number of
Separations Total Pool
Turnover
Rate
Number of
Separations Total Pool
Turnover
Rate
Number of
Separations Total Pool
Turnover
Rate
At Will Decisions 61 6715 0.9% 55 6546 0.8% 65 6579 1.0%
Reduction in Force 7 6715 0.1% 81 6546 1.2% 5 6579 0.1%
Other 13 6715 0.2% 10 6546 0.2% 11 6579 0.2%
Total Involuntary 81 6715 1.2% 146 6546 2.2% 81 6579 1.2%
At Will Decisions 585 6715 8.7% 618 6546 9.4% 669 6579 10.2%
Transfer Out 31 6715 0.5% 23 6546 0.4% 81 6579 1.2%
Retirement 139 6715 2.1% 138 6546 2.1% 134 6579 2.0%
Other 21 6715 0.3% 45 6546 0.7% 18 6579 0.3%
Total Voluntary 776 6715 11.6% 824 6546 12.6% 902 6579 13.7%
All Separations 857 6715 12.8% 970 6546 14.8% 983 6579 14.9%
Turnover Rate for Staff Employees FY2010 - FY2012 (1)
FY2010 FY2011 FY2012

Staff Workforce Analytics and Trends April 6, 2013 Turnover FY2013 Page 25
APPENDIX 4 - Detail Data
Item 1 Number of Total Separations FY2010 – FY2012
Termination headcount above is for informational purposes only as to number of separations from university employment by an employee within the shown executive level reporting unit and does not include the number of employees who transferred out from one unit to another within the university. The data above should not be used or inferred to calculate turnover rate for any executive, college, division or departmental reporting unit.
Separation Type President
Exec V.P. &
Provost -
Acad Affairs V.P. - Admin
V.P. - Mar &
Comm
V.P. -
Research
V.P. -
Student
Affairs
V.P. & Cfo -
Finance
Univ
Accounts Total
FY2010 35 480 214 1 27 67 33 857
Involuntary 5 34 33 1 6 2 81
Voluntary 30 446 181 1 26 61 31 776
FY2011 29 533 258 23 103 24 970
Involuntary 3 52 69 6 9 7 146
Voluntary 26 481 189 17 94 17 824
FY2012 62 518 1053 5 27 226 24 13 1928
Involuntary 30 26 829 4 135 2 1026
Voluntary 32 492 224 5 23 91 22 13 902

Staff Workforce Analytics and Trends April 6, 2013 Turnover FY2013 Page 26
APPENDIX 4 - Detail Data
Item 2 Number of Voluntary Terminations FY2010 – FY2012
Termination headcount above is for informational purposes only as to number of separations from university employment by an employee within the shown executive level reporting unit and does not include the number of employees who transferred out from one unit to another within the university. The data above should not be used or inferred to calculate turnover rate for any executive, college, division or departmental reporting unit.
Voluntary
Terminations President
Exec V.P. &
Provost -
Acad Affairs V.P. - Admin
V.P. - Mar &
Comm
V.P. -
Research
V.P. -
Student
Affairs
V.P. & Cfo -
Finance
Univ
Accounts Total
FY2010 30 446 181 1 26 61 31 776
At Will Decisions 29 349 117 1 22 46 21 585
Transfer Out 23 2 3 2 1 31
Retirement 1 58 59 1 13 7 139
Other 16 3 2 21
FY2011 26 481 189 17 94 17 824
At Will Decisions 22 358 138 14 76 10 618
Transfer Out 15 3 1 2 2 23
Retirement 4 65 46 2 16 5 138
Other 43 2 45
FY2012 32 492 224 5 23 91 22 13 902
At Will Decisions 29 380 165 3 12 64 9 7 669
Transfer Out 1 45 13 2 9 7 4 81
Retirement 2 51 46 2 18 9 6 134
Other 16 2 18

Staff Workforce Analytics and Trends April 6, 2013 Turnover FY2013 Page 27
APPENDIX 4 - Detail Data
Item 3 Number of Involuntary Terminations FY2010 – FY2012
Termination headcount above is for informational purposes only as to number of separations from university employment by an employee within the shown executive level reporting unit and does not include the number of employees who transferred out from one unit to another within the university. The data above should not be used or inferred to calculate turnover rate for any executive, college, division or departmental reporting unit.
Involuntary
Terminations President
Exec V.P. &
Provost -
Acad Affairs V.P. - Admin
V.P. - Mar &
Comm
V.P. -
Research
V.P. -
Student
Affairs
V.P. & Cfo -
Finance
Univ
Accounts Total
FY2010 5 34 33 1 6 2 81
At Will Decisions 2 21 32 1 5 61
Reduction in Force 4 1 2 7
Other 3 9 1 13
FY2011 3 52 69 6 9 7 146
At Will Decisions 1 17 27 2 7 1 55
Reduction in Force 29 41 3 2 6 81
Other 2 6 1 1 10
FY2012 30 26 829 4 135 2 1026
At Will Decisions 1 18 32 4 8 2 65
Reduction in Force 23 3 797 127 950
Other 6 5 11

Staff Workforce Analytics and Trends April 6, 2013 Turnover FY2013 Page 28
APPENDIX 4 - Detail Data
Item 4 Number of Separations by EEO Job Category FY2010 – FY2012
Termination headcount above is for informational purposes only as to number of separations from university employment by an employee within the shown executive level reporting unit and does not include the number of employees who transferred out from one unit to another within the university. The data above should not be used or inferred to calculate turnover rate for any executive, college, division or departmental reporting unit.
EEO Job Category President
Exec V.P. &
Provost -
Acad Affairs V.P. - Admin
V.P. - Mar &
Comm
V.P. -
Research
V.P. -
Student
Affairs
V.P. & Cfo -
Finance
Univ
Accounts Total
FY2010 35 480 214 1 27 67 33 857
Exec/Admin/Mgr 5 25 3 5 4 5 47
Prof Non-Faculty 27 294 19 1 11 32 15 399
Secr/Clerical 3 105 11 2 7 8 136
Tech/Paraprof 45 7 6 7 65
Skilled Craft 5 62 1 68
Service/Maint 6 112 3 16 5 142
FY2011 29 533 258 23 103 24 970
Exec/Admin/Mgr 4 34 5 3 9 2 57
Prof Non-Faculty 19 332 16 12 51 13 443
Secr/Clerical 3 114 18 3 14 7 159
Tech/Paraprof 46 5 1 8 2 62
Skilled Craft 1 1 89 6 97
Service/Maint 2 6 125 4 15 152
FY2012 62 518 1053 5 27 226 24 13 1928
Exec/Admin/Mgr 4 35 10 3 3 5 1 61
Prof Non-Faculty 31 331 116 2 11 39 13 1 544
Secr/Clerical 3 100 76 1 19 8 207
Tech/Paraprof 1 45 15 7 6 1 1 76
Skilled Craft 5 2 167 35 6 215
Service/Maint 18 5 669 5 122 1 5 825

Staff Workforce Analytics and Trends April 6, 2013 Turnover FY2013 Page 29
APPENDIX 4 - Detail Data
Item 5 Number of Separations by Years of Service FY2010 – FY2012
Termination headcount above is for informational purposes only as to number of separations from university employment by an employee within the shown executive level reporting unit and does not include the number of employees who transferred out from one unit to another within the university. The data above should not be used or inferred to calculate turnover rate for any executive, college, division or departmental reporting unit.
Years of Service President
Exec V.P. &
Provost -
Acad Affairs V.P. - Admin
V.P. - Mar &
Comm
V.P. -
Research
V.P. -
Student
Affairs
V.P. & Cfo -
Finance
Univ
Accounts Total
FY2010 35 480 214 1 27 67 33 857
Less than 2 3 139 71 4 14 7 238
2 to 5 16 121 31 1 7 25 10 211
6 to 10 6 110 33 11 14 4 178
11 to 15 5 43 31 3 5 4 91
16 to 20 1 17 12 3 2 35
More than 20 4 50 36 2 6 6 104
FY2011 29 533 258 23 103 24 970
Less than 2 3 131 78 5 26 2 245
2 to 5 11 141 59 3 35 3 252
6 to 10 7 116 42 4 16 6 191
11 to 15 4 69 31 4 12 4 124
16 to 20 19 13 2 7 3 44
More than 20 4 57 35 5 7 6 114
FY2012 62 518 1053 5 27 226 24 13 1928
Less than 2 7 116 233 1 6 25 1 389
2 to 5 23 204 241 1 8 64 6 547
6 to 10 15 89 172 2 5 48 2 333
11 to 15 4 39 130 1 6 32 4 2 218
16 to 20 6 23 121 17 3 3 173
More than 20 7 47 156 2 40 8 8 268

Staff Workforce Analytics and Trends April 6, 2013 Turnover FY2013 Page 30
APPENDIX 4 - Detail Data
Item 6 Number of Separations by Gender FY2011 – FY2013
Termination headcount above is for informational purposes only as to number of separations from university employment by an employee within the shown executive level reporting unit and does not include the number of employees who transferred out from one unit to another within the university. The data above should not be used or inferred to calculate turnover rate for any executive, college, division or departmental reporting unit.
Gender President
Exec V.P. &
Provost -
Acad Affairs V.P. - Admin
V.P. - Mar &
Comm
V.P. -
Research
V.P. -
Student
Affairs
V.P. & Cfo -
Finance
Univ
Accounts Total
FY2010 35 480 214 1 27 67 33 857
Female 10 295 70 16 48 19 458
Male 25 185 144 1 11 19 14 399
FY2011 29 533 258 23 103 24 970
Female 9 336 97 13 70 15 540
Male 20 197 161 10 33 9 430
FY2012 62 518 1053 5 27 226 24 13 1928
Female 21 325 530 1 16 140 20 4 1057
Male 41 193 523 4 11 86 4 9 871

Staff Workforce Analytics and Trends April 6, 2013 Turnover FY2013 Page 31
APPENDIX 4 - Detail Data
Item 7 Number of Separations by Race/Ethnicity FY2010 – FY2012
Termination headcount above is for informational purposes only as to number of separations from university employment by an employee within the shown executive level reporting unit and does not include the number of employees who transferred out from one unit to another within the university. The data above should not be used or inferred to calculate turnover rate for any executive, college, division or departmental reporting unit.
Race/Ethnicity President
Exec V.P. &
Provost -
Acad Affairs V.P. - Admin
V.P. - Mar &
Comm
V.P. -
Research
V.P. -
Student
Affairs
V.P. & Cfo -
Finance
Univ
Accounts Total
FY2010 35 480 214 1 27 67 33 857
White 28 305 122 1 23 45 24 548
Black 2 18 45 1 8 5 79
Hispanic 2 56 41 10 2 111
Asian 2 85 1 3 3 2 96
American Ind 2 2
Hawaiian 1 1
Two or More 1 1
Not Specified 13 5 1 19
FY2011 29 533 258 23 103 24 970
White 26 339 140 16 71 13 605
Black 3 22 47 2 19 4 97
Hispanic 70 58 1 9 4 142
Asian 80 4 2 2 2 90
American Ind 2 2 1 1 1 7
Hawaiian
Two or More 1 2 3
Not Specified 19 5 1 1 26
FY2012 62 518 1053 5 27 226 24 13 1928
White 37 325 403 5 25 95 21 9 920
Black 10 25 254 73 1 2 365
Hispanic 14 65 360 1 49 1 2 492
Asian 1 80 16 1 2 100
American Ind 2 3 1 6
Hawaiian 1 1 2
Two or More 6 2 1 1 10
Not Specified 14 15 4 33

Staff Workforce Analytics and Trends April 6, 2013 Turnover FY2013 Page 32
APPENDIX 5 - Supplemental Data for Academic Affairs
Item 1 Number of Total Separations FY2010 – FY2012
Termination headcount above is for informational purposes only as to number of separations from university employment by an employee within the shown college or division reporting unit and does not include the number of employees who transferred out from one unit to another within the university. The data above should not be used or inferred to calculate turnover rate for any executive, college, division or departmental reporting unit.
Executive VP & Provost / Colleges
Separation Type
Col:
Agriculture
And Life
Sciences
Col: Archi-
tecture
Col: Bush
School Of
Gov't &
Public Srv
Col:
Education
Col:
Engineering
Col: Geo-
sciences
Col: Liberal
Arts
Col: Mays
Business
School Col: Science
Col: Tamu
Qatar
Col:
Veterinary
Medicine Total
FY2010 25 32 6 21 49 33 33 7 97 17 64 384
Involuntary 2 5 2 1 6 1 2 6 1 5 31
Voluntary 23 27 4 20 43 32 31 7 91 16 59 353
FY2011 28 53 2 20 34 34 43 16 102 17 69 418
Involuntary 2 8 3 6 4 3 3 2 9 40
Voluntary 26 45 2 20 31 28 39 13 99 15 60 378
FY2012 12 31 7 20 40 28 27 20 96 17 75 373
Involuntary 1 2 2 1 10 3 19
Voluntary 12 31 7 19 38 28 25 20 95 7 72 354
Executive VP & Provost / Non-College Divisions
Separation Type
Div: AA
Admin-
istration
Div: Asso
Prov
Undergrad
Pgm & Acad
Srv
Div: Assoc
Prov & Dean
Of Faculties
Div: Assoc
Prov-Grad
Studies
Div: Assoc
Vp External
Affairs
Div: Assoc
Vp For Acad
Services Div: Library
Div: Vice
Provost For
Acad Affairs
Div: Vp &
Assoc Prov -
Instit
Diversity
Div: Vp &
Assoc Prov-
Info
Technology Total
FY2010 6 5 3 2 3 28 13 13 23 96
Involuntary 1 1 1 3
Voluntary 6 5 2 2 3 27 12 13 23 93
FY2011 9 17 5 4 1 45 11 6 1 16 115
Involuntary 5 1 1 2 2 1 12
Voluntary 9 12 4 3 1 43 11 4 1 15 103
FY2012 5 9 4 5 2 59 20 8 33 145
Involuntary 4 1 2 7
Voluntary 5 9 4 5 2 55 19 8 31 138

Staff Workforce Analytics and Trends April 6, 2013 Turnover FY2013 Page 33
APPENDIX 5 - Supplemental Data for Academic Affairs
Item 2 Number of Voluntary Terminations FY2010 – FY2012
Termination headcount above is for informational purposes only as to number of separations from university employment by an employee within the shown college or division reporting unit and does not include the number of employees who transferred out from one unit to another within the university. The data above should not be used or inferred to calculate turnover rate for any executive, college, division or departmental reporting unit.
Executive VP & Provost / Colleges
Voluntary Terminations
Col:
Agriculture
And Life
Sciences
Col: Archi-
tecture
Col: Bush
School Of
Gov't &
Public Srv
Col:
Education
Col:
Engineering
Col: Geo-
sciences
Col: Liberal
Arts
Col: Mays
Business
School Col: Science
Col: Tamu
Qatar
Col:
Veterinary
Medicine Total
FY2010 23 27 4 20 43 32 31 7 91 16 59 353
At Will Decisions 14 21 4 14 28 26 21 6 82 14 49 279
Transfer Out 5 8 1 1 1 2 3 21
Retirement 3 2 6 6 2 9 4 2 5 39
Other 1 4 1 3 3 2 14
FY2011 26 45 2 20 31 28 39 13 99 15 60 378
At Will Decisions 18 20 2 16 18 17 33 9 83 12 52 280
Transfer Out 1 5 2 2 10
Retirement 7 3 8 7 5 4 5 2 5 46
Other 1 25 4 1 9 1 1 42
FY2012 12 31 7 19 38 28 25 20 95 7 72 354
At Will Decisions 6 31 6 12 27 22 19 13 82 6 61 285
Transfer Out 3 2 10 3 6 3 1 4 32
Retirement 3 1 2 2 4 7 6 25
Other 3 1 1 6 1 12
Executive VP & Provost / Non-College Divisions
Voluntary Terminations
Div: AA
Admin-
istration
Div: Asso
Prov
Undergrad
Pgm & Acad
Srv
Div: Assoc
Prov & Dean
Of Faculties
Div: Assoc
Prov-Grad
Studies
Div: Assoc
Vp External
Affairs
Div: Assoc
Vp For Acad
Services Div: Library
Div: Vice
Provost For
Acad Affairs
Div: Vp &
Assoc Prov -
Instit
Diversity
Div: Vp &
Assoc Prov-
Info
Technology Total
FY2010 6 5 2 2 3 27 12 13 23 93
At Will Decisions 1 4 2 1 1 21 8 13 19 70
Transfer Out 2 2
Retirement 3 1 1 2 6 4 2 19
Other 2 2
FY2011 9 12 4 3 1 43 11 4 1 15 103
At Will Decisions 5 9 2 1 1 32 9 3 1 15 78
Transfer Out 2 2 1 5
Retirement 4 1 2 10 2 19
Other 1 1
FY2012 5 9 4 5 2 55 19 8 31 138
At Will Decisions 2 8 2 2 40 13 6 22 95
Transfer Out 2 1 1 6 1 1 1 13
Retirement 3 1 2 1 6 5 1 7 26
Other 3 1 4

Staff Workforce Analytics and Trends April 6, 2013 Turnover FY2013 Page 34
APPENDIX 5 - Supplemental Data for Academic Affairs
Item 3 Number of Separations by EEO Job Category FY2010 – FY2012
Termination headcount above is for informational purposes only as to number of separations from university employment by an employee within the shown college or division reporting unit and does not include the number of employees who transferred out from one unit to another within the university. The data above should not be used or inferred to calculate turnover rate for any executive, college, division or departmental reporting unit.
Executive VP & Provost / Colleges
EEO Job Category
Col:
Agriculture
And Life
Sciences
Col: Archi-
tecture
Col: Bush
School Of
Gov't &
Public Srv
Col:
Education
Col:
Engineering
Col: Geo-
sciences
Col: Liberal
Arts
Col: Mays
Business
School Col: Science
Col: Tamu
Qatar
Col:
Veterinary
Medicine Total
FY2010 25 32 6 21 49 33 33 7 97 17 64 384
Exec/Admin/Mgr 3 1 2 1 1 3 11
Prof Non-Faculty 15 12 3 16 36 29 18 4 81 13 21 248
Secr/Clerical 8 20 4 5 1 13 2 10 9 72
Tech/Paraprof 1 7 1 5 1 27 42
Skilled Craft 1 1 1 1 1 5
Service/Maint 6 6
FY2011 28 53 2 20 34 34 43 16 102 17 69 418
Exec/Admin/Mgr 1 1 1 2 2 1 2 5 15
Prof Non-Faculty 20 8 2 18 23 26 34 11 89 11 24 266
Secr/Clerical 2 44 1 7 6 7 3 7 1 7 85
Tech/Paraprof 4 2 1 6 32 45
Skilled Craft 1 1
Service/Maint 6 6
FY2012 12 31 7 20 40 28 27 20 96 17 75 373
Exec/Admin/Mgr 2 3 1 5 3 2 1 17
Prof Non-Faculty 11 4 5 14 33 23 18 13 87 15 24 247
Secr/Clerical 27 3 6 2 8 2 3 9 60
Tech/Paraprof 1 1 3 3 34 42
Skilled Craft 2 2
Service/Maint 5 5
Executive VP & Provost / Non-College Divisions
EEO Job Category
Div: AA
Admin-
istration
Div: Asso
Prov
Undergrad
Pgm & Acad
Srv
Div: Assoc
Prov & Dean
Of Faculties
Div: Assoc
Prov-Grad
Studies
Div: Assoc
Vp External
Affairs
Div: Assoc
Vp For Acad
Services Div: Library
Div: Vice
Provost For
Acad Affairs
Div: Vp &
Assoc Prov -
Instit
Diversity
Div: Vp &
Assoc Prov-
Info
Technology Total
FY2010 6 5 3 2 3 28 13 13 23 96
Exec/Admin/Mgr 2 2 2 4 3 1 14
Prof Non-Faculty 3 3 1 2 3 8 7 19 46
Secr/Clerical 1 16 13 3 33
Tech/Paraprof 3 3
Skilled Craft
Service/Maint
FY2011 9 17 5 4 1 45 11 6 1 16 115
Exec/Admin/Mgr 6 2 2 1 6 2 19
Prof Non-Faculty 2 12 3 2 25 3 3 1 15 66
Secr/Clerical 1 3 1 1 14 8 1 29
Tech/Paraprof 1 1
Skilled Craft
Service/Maint
FY2012 5 9 4 5 2 59 20 8 33 145
Exec/Admin/Mgr 4 1 1 1 6 1 4 18
Prof Non-Faculty 1 6 3 2 2 36 6 7 21 84
Secr/Clerical 2 2 17 14 5 40
Tech/Paraprof 3 3
Skilled Craft
Service/Maint