turning the page webinar - fhlbny
TRANSCRIPT

FHLBNY
FHLBNY
Presentation from the FHLBNY to:
© 2021 FEDERAL HOME LOAN BANK OF NEW YORK • 101 PARK AVENUE • NEW YORK, NY 10178 • WWW.FHLBNY.COM
Turning the Page: The U.S. and
Local Economic Outlook
Brian Jones, Vice President & Financial Economist, FHLBNY
February 11, 2021

FHLBNY
FHLBNY
Recent Data Continue to Eclipse Economists’ Expectations
Note: Shaded areas denote recessions. Sources: Citi Investment Research, Bureau of Labor Statistics, U.S. Commerce Department,
Federal Reserve System, Institute for Supply Management
93.495.0
96.7
105.8
106.3
116.7
103.5
118.8
70
80
90
100
110
120
130
70
80
90
100
110
120
130
Jan Feb Mar Apr May Jun Jul Aug Sep Oct Nov Dec Jan
Recent Performances of Key Economic Variables(Index February Cycle Peak = 100)
Nonfarm Payrolls Total Hours Worked Industrial ProductionControl Retail Sales Nondefense Capital Goods Shipments Ex Aircraft ISM ManufacturingISM Non-Manufacturing Building Permits
-150
-100
-50
0
50
100
150
200
250
2003 2004 2005 2006 2007 2008 2009 2010 2011 2012 2013 2014 2015 2016 2017 2018 2019 2020 2021
Citi U.S. Economic Surprise Index(end of month observations)
2

FHLBNY
FHLBNY
Consensus Projections Imply That Output Lost to the
Pandemic Will Be Recovered By Mid Year
Source: Bureau of Economic Analysis
3
2.3
1.3 2.2 2.5 2.3 1.7
2.9 3.93.8 2.7 2.1 1.3
2.9 1.5
2.6 2.4
-5.0
-31.4
33.4
4.0
2.3
4.1 4.9 3.8
-35
-30
-25
-20
-15
-10
-5
0
5
10
15
20
25
30
35
2016 2017 2018 2019 2020 2021
Net Contributions to Real GDP Growth(quarterly percentage change at seasonally adjusted annual rate)
Consumer Spending Business Fixed Investment Residential Investment Inventories
Net Exports Government Outlays Real GDP
8,000
10,000
12,000
14,000
16,000
18,000
20,000
1990 1992 1994 1996 1998 2000 2002 2004 2006 2008 2010 2012 2014 2016 2018 2020
Real Gross Domestic Product, Billions of Chained 2012 Dollars, Quarterly, Seasonally Adjusted Annual Rate
FHLBNY
FHLBNY
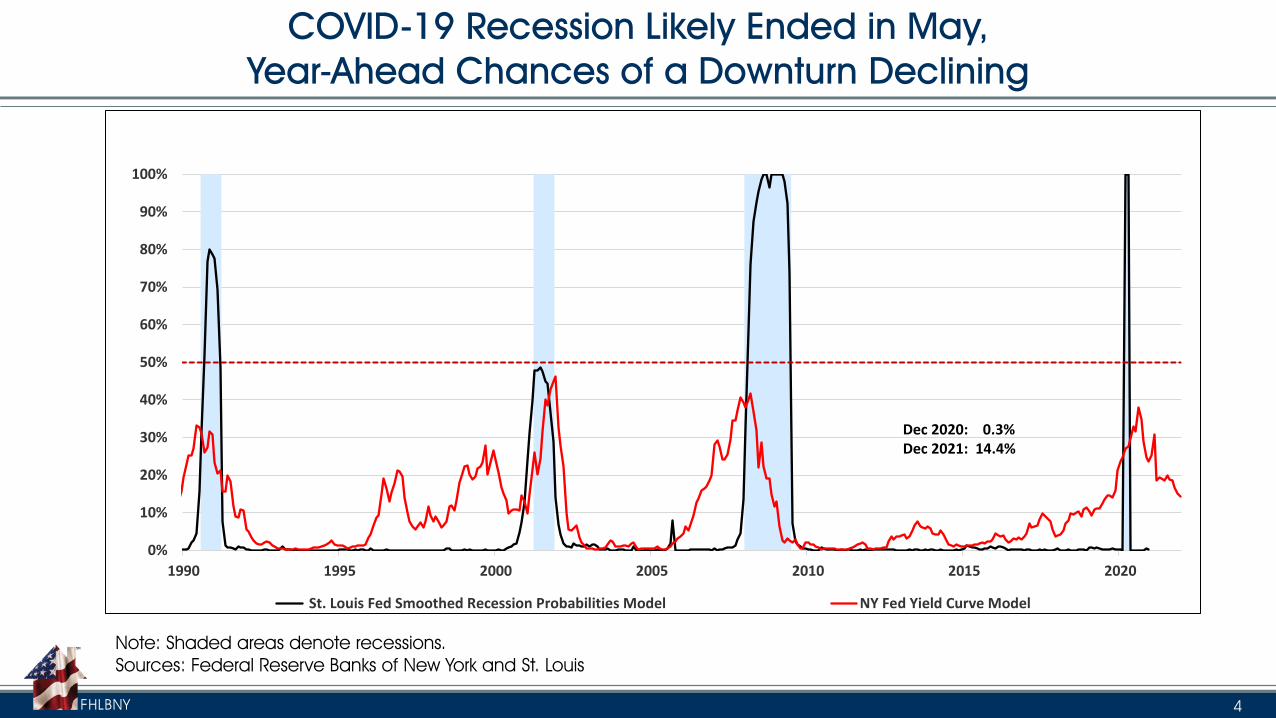
COVID-19 Recession Likely Ended in May,
Year-Ahead Chances of a Downturn Declining
Note: Shaded areas denote recessions.
Sources: Federal Reserve Banks of New York and St. Louis
4
0%
10%
20%
30%
40%
50%
60%
70%
80%
90%
100%
1990 1995 2000 2005 2010 2015 2020
St. Louis Fed Smoothed Recession Probabilities Model NY Fed Yield Curve Model
Dec 2020: 0.3%Dec 2021: 14.4%

FHLBNY
FHLBNY
Economy’s Near-Term Progress Will Depend on
Stemming Renewed COVID-19 Outbreak
Source: COVID Tracking Project
2%
4%
6%
8%
10%
12%
14%
16%
400,000
600,000
800,000
1,000,000
1,200,000
1,400,000
1,600,000
1,800,000
2,000,000
2,200,000
2,400,000
U.S. COVID-19 Tests Results Per Day
Tests Conducted (scale left) 7-Day Moving Avg (scale left)Percent Positive (scale right) 7-Day Moving Avg (scale right)
0
2,000
4,000
6,000
8,000
10,000
12,000
14,000
16,000
18,000
Mar-20 Apr-20 May-20 Jun-20 Jul-20 Aug-20 Sep-20 Oct-20 Nov-20 Dec-20 Jan-21 Feb-21
Positive COVID-19 Test Results(7-Day Moving Averages)
New Jersey New York
5

FHLBNY
FHLBNY
And Progress in Distributing COVID-19 Vaccines
Source: Bloomberg
Doses Administered Daily Rate of Doses Administered % of Supply Used
1+ Dose 2 Doses
United States 44,413,509 10.2 3.1 1,528,618 70.6
FHLBNY District:
New York 2,513,387 9.7 3.2 76,921 73.3
New York City 1,032,158 9.3 3.0 29,784 69.9
New Jersey 1,096,789 9.6 2.7 37,172 74.1
Puerto Rico 321,965 7.4 2.4 21,783 51.0
Virgin Islands 10,064 6.9 2.6 479 46.8
% of Population Given
6

FHLBNY
FHLBNY
U.S. Railroad Traffic Well Off Pandemic Lows
7
Source: Calculated Risk

FHLBNY
FHLBNY
Resurgence in COVID-19 Infections Impacting Service-Sector Activity
Source: Calculated Risk
8

FHLBNY
FHLBNY
Office Occupancy Rising in Major Metro Areas,
But Still Well Below Pre-Pandemic Levels
Source: Kastle Systems
9

FHLBNY
FHLBNY
With Less Than 15% of Workers Back in the Office,
Subway Usage Well Below Normal
10
Source: Calculated Risk
Daily Turnstile Entries

FHLBNY
FHLBNY
Other Service-Producing Segments Continue to Struggle
Source: Calculated Risk
11

FHLBNY
FHLBNY
Labor Market Conditions Will Remain Challenging
for the Foreseeable Future
Note: Shaded areas denote recessions. Source: U.S. Department of Labor
12
1,000,000
4,000,000
7,000,000
10,000,000
13,000,000
16,000,000
19,000,000
22,000,000
25,000,000
28,000,000
100,000
1,100,000
2,100,000
3,100,000
4,100,000
5,100,000
6,100,000
7,100,000
2009 2011 2013 2015 2017 2019 2021
Initial Claims (scale left) Continuing Claims (scale right)
Jobless Claims Remain Well Above Pre-Pandemic Levels

FHLBNY
FHLBNY
Roughly 11% of the Civilian Labor Force Receiving Assistance
13
0
5,000,000
10,000,000
15,000,000
20,000,000
25,000,000
30,000,000
35,000,000
Jan-20 Feb-20 Mar-20 Apr-20 May-20 Jun-20 Jul-20 Aug-20 Sep-20 Oct-20 Nov-20 Dec-20 Jan-21
Unemployment Assistance Recipients Under Various Programs
Total Pandemic Unemployment Assistance Regular State Pandemic Emergency Unemployment Compensation Extended Benefits
Note: Shaded area denote recession. Source: U.S. Department of Labor

FHLBNY
FHLBNY
Nonfarm Payrolls Rose Modestly in January;
59.9% of Private Jobs Lost Have Been Recovered
Source: Bureau of Labor Statistics
49
6
-4 -3-10
9 10 14
-38-28
1
168
97
-7
-61
7
43
-75
-50
-25
0
25
50
75
100
January Changes in Nonfarm Payrolls(thousands, seasonally adjusted)
0
5,000
10,000
15,000
20,000
25,000
Still a Considerable Way to Go to Recover COVID-19 Job Losses(thousands, seasonally adjusted)
Jobs Lost (Mar 20-Apr 20) Jobs Recovered (May 20-Jan 21)
14

FHLBNY
FHLBNY
Hiring Breadth Gauges Retreated Across the Board in January
Note: Shaded areas denote recessions. Source: Bureau of Labor Statistics
0
10
20
30
40
50
60
70
80
90
2001 2003 2005 2007 2009 2011 2013 2015 2017 2019 2021
Diffusion Indexes of Nonfarm Payrolls(% increase plus one half those unchanged)
One Month Three Months Six Months
15

FHLBNY
FHLBNY
Unemployment Measures Remained Elevated at Beginning of New Year
Note: Shaded areas denote recessions. Source: Bureau of Labor Statistics
2
4
6
8
10
12
14
16
18
20
22
24
1995 1997 1999 2001 2003 2005 2007 2009 2011 2013 2015 2017 2019 2021
Unemployment Rates(percent)
Conventional Unemployment Rate (U-3)
Plus marginally attached workers & those on part time for eco reasons (U-6)
NAIRU (Non-Accelerating Inflation Rate of Unemployment)
16

FHLBNY
FHLBNY
Core Consumer Inflation Gauges Likely Will
Remain Below Fed Target Until the Spring
Notes: Light blue shaded areas denote recessions. Pink shaded area denotes projections. Sources: Bureau of Labor Statistics and FHLBNY
0.5
1.0
1.5
2.0
2.5
3.0
3.5
2001 2003 2005 2007 2009 2011 2013 2015 2017 2019 2021
Core Consumer Price Index Core PCE Chain Price Index Federal Reserve Target
%
Core Consumer Inflations Measures(percentage change from year ago)
17

FHLBNY
FHLBNY
Financial Conditions Have Returned to Pre-Pandemic Levels
Note: Shaded areas denote recessions. Source: Bloomberg
-10
-8
-6
-4
-2
0
2
Bloomberg U.S. Financial Conditions Index
Std Dev
18
24-Mar-20 10-Feb-21 Change
US Financial Conditions -6.34 0.80 7.13
Money Market Spreads:
TED Spread 127.05 16.98 -110.07
Libor/OIS Spread 112.05 13.11 -98.94
Com Paper/T-Bill Spread 205.64 9.20 -196.44
Bond Market Spreads:
Baa/10-Yr Treasury Spread 456.37 98.71 -357.66
High-Yield/10-Yr Treas Spread 11.00 3.28 -7.72
Muni/10-Yr Spread 235.89 -44.14 -280.03
Swaption Volatility Index 118.27 63.78 -54.49
Equity Market:
S&P 500 2447.33 3903.24 1455.91
VIX S&P Volatility Index 61.67 22.68 -38.99

FHLBNY
FHLBNY
Fed Officials Expect No Change in Fed Funds
Target Range Over Next Three Years
19
Percent Percent
3.375 3.375
3.25 l 3.25
3.125 3.125
3 l ll ll ll 3
2.875 ll 2.875
2.75 ll l l l 2.75
2.625 ll 2.625
2.5 llllllll llllllll llllllll llllllll 2.5
2.375 lll llll l l l l 2.375
2.25 ll lll lll lll 2.25
2.125 lllll lll 2.125
2 l l l l 2
1.875 llll lllll 1.875
1.75 1.75
1.625 lllll l 1.625
1.5 1.5
1.375 l 1.375
1.25 1.25
1.125 l l 1.125
1 1
0.875 0.875
0.75 0.75
0.625 l l l 0.625
0.5 0.5
0.375 l l ll lll 0.375
0.25 0.25
0.125 lllllllllllllllll lllllllllllllllll lllllllllllllllll lllllllllllllll llllllllllllllll llllllllllllllll lllllllllllll llllllllllll 0.1250 0
Dec '19 Jun '20 Sep '20 Dec' 20 Dec '19 Jun '20 Sep '20 Dec' 20 Sep '20 Dec' 20 Dec ' 19 Jun '20 Sep '20 Dec' 20
2021 2022 2023 Longer Run
Source: Federal Reserve Board

FHLBNY
FHLBNY
Policymakers Revised Forecasts at December FOMC Meeting
Source: Federal Reserve Board
2.0 1.9 1.8 1.9
-6.5
5.0
3.5
1.8
-3.7
4.03.0
2.51.9
-2.4
4.23.2
2.41.8
-8.0
-6.0
-4.0
-2.0
0.0
2.0
4.0
6.0
2020 2021 2022 2023 Longer Run
Real GDP Growth(percentage change Q4/Q4)
Dec-19 Jun-20 Sep-20 Dec-20
3.5 3.6 3.7
9.3
6.5
5.5
4.1
7.6
5.5
4.64.0
6.7
5.0
4.23.7
2.0
4.0
6.0
8.0
10.0
2020 2021 2022 2023 Longer Run
Unemployment Rate(average level in Q4 of inciated year)
Dec-19 Jun-20 Sep-20 Dec-20
1.92.0 2.0
0.8
1.61.7
1.2
1.71.8
2.0
1.81.9
2.0
0.6
0.8
1.0
1.2
1.4
1.6
1.8
2.0
2.2
2020 2021 2022 2023 Longer Run
PCE Inflation(percentage change Q4/Q4)
Dec-19 Jun-20 Sep-20 Dec-20
1.92.0 2.0
1.0
1.5
1.7
1.5
1.71.8
2.0
1.4
1.81.9
0.6
0.8
1.0
1.2
1.4
1.6
1.8
2.0
2.2
2020 2021 2022 2023
Core PCE Inflation(percentage change Q4/Q4)
Dec-19 Jun-20 Sep-20 Dec-20
20
FHLBNY
FHLBNY
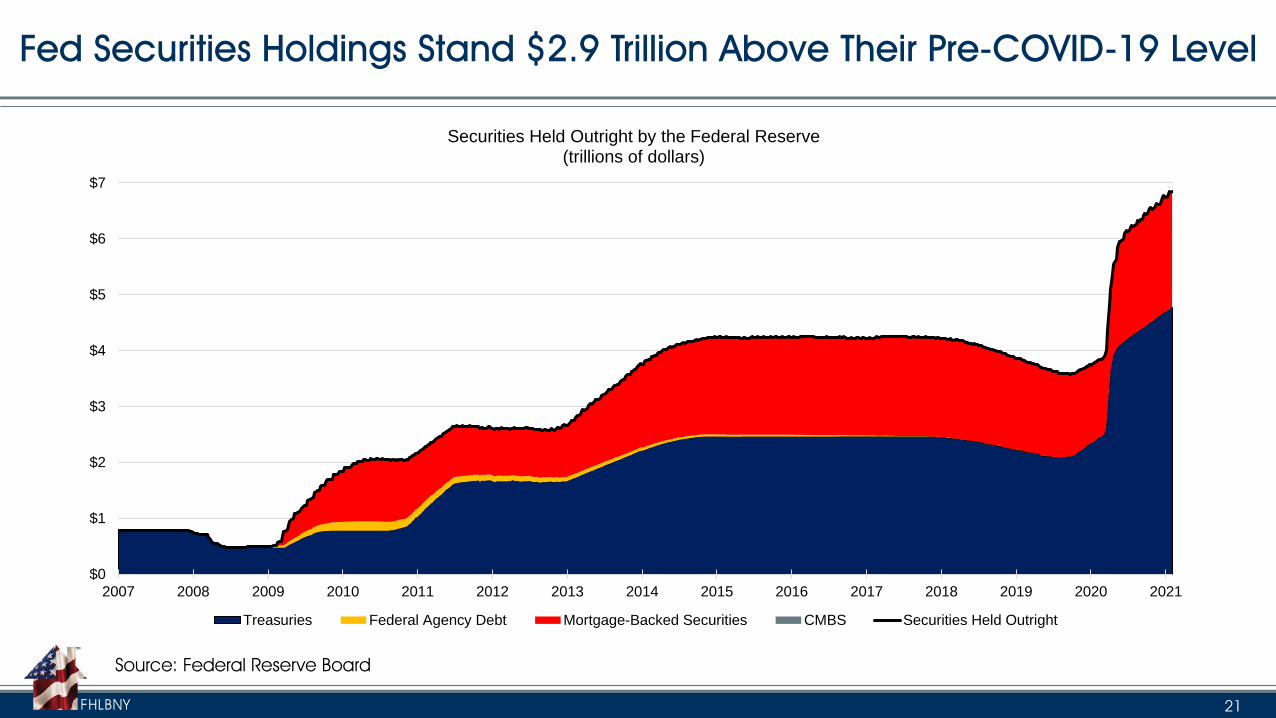
Fed Securities Holdings Stand $2.9 Trillion Above Their Pre-COVID-19 Level
Source: Federal Reserve Board
21
$0
$1
$2
$3
$4
$5
$6
$7
2007 2008 2009 2010 2011 2012 2013 2014 2015 2016 2017 2018 2019 2020 2021
Securities Held Outright by the Federal Reserve(trillions of dollars)
Treasuries Federal Agency Debt Mortgage-Backed Securities CMBS Securities Held Outright

FHLBNY
FHLBNY
Massive Federal Deficits in the Wake of the COVID-19 Outbreak
Will Require Record Treasury Debt Issuance
22

FHLBNY
FHLBNY
Consensus Projections Call for Steady Rise in
Treasury Rates Through Spring of 2022
Sources: Bloomberg, Blue Chip Consensus
0.13
0.04 0.05 0.07 0.11
0.46
1.13
1.93
0.10.2 0.2
0.3
0.4
0.8
1.5
2.2
0.00
0.25
0.50
0.75
1.00
1.25
1.50
1.75
2.00
2.25
2.50
Fed Funds 3-Month 6-Month 1-Year 2-Year 5-Year 10-Year 30-Year
2/10/2021 2Q21 3Q21 4Q21 1Q22 2Q22
23

FHLBNY
FHLBNY
NY Factory Activity Rose Modestly in January;
Firms More Hopeful About the Future
Note: Shaded areas denote recessions. Sources: Federal Reserve Bank of New York, FHLBNY estimates
10
20
30
40
50
60
70
80
Empire State Manufacturing Survey(diffusion indexes, 50 = no change from prior month)
Composite New Orders Employment
25
30
35
40
45
50
55
60
65
70
Empire State Manufacturing Composite Indexes(diffusion indexes, 50 = no change from prior month)
Present Future
24

FHLBNY
FHLBNY
Local Service-Producing Activity Weakened,
Yet Firms More Optimistic About the Future
Note: Shaded areas denote recession. Sources: Federal Reserve Bank of New York, FHLBNY estimates
0
10
20
30
40
50
60
70
80
90
2005 2006 2007 2008 2009 2010 2011 2012 2013 2014 2015 2016 2017 2018 2019 2020 2021
New York Fed Business Leaders Survey(diffusion indexes, 50 = no change from prior month)
Business Activity Business Climate Employment Wages
0
10
20
30
40
50
60
70
80
New York Fed Business Leaders Survey(diffusion indexes, 50 = no change from prior month)
Future Business Activity Future Business Climate
25

FHLBNY
FHLBNY
Small Business in the FHLBNY District Have
Suffered More Than Others Amidst Healthcare Crisis
Source: U.S. Census Bureau
26
43.9%
17.8%
29.0% 30.1%
24.1%
32.8%
5.2%
29.9%
13.7%
20.7% 22.2%
14.0%
26.5%
52.5%
30.1%
60.7%64.9%
44.0%
0%
10%
20%
30%
40%
50%
60%
70%
Firms Experiencing a Large Negative Impact From COVID-19 By Industry
Average 30.7%
30.7%
44.3%
18.7%
5.0%
1.4%
35.9%
42.6%
12.2%
7.0%
2.4%
40.3% 40.8%
12.8%
4.5%1.7%
28.6%
51.4%
16.7%
0.0% 0.0%0%
10%
20%
30%
40%
50%
60%
Large Negative Impact Moderate Negative Impact Little or No Effect Moderate Positive Impact Large Positive Impact
Overall, how has business been effected by the COVID-19 pandemic?
National New Jersey New York Puerto Rico

FHLBNY
FHLBNY
FHLBNY District Added Jobs Over May-December Span,
But Payrolls Remain Well Below Pre-Pandemic Levels
Note: Shaded areas denote recessions. Source: Bureau of Labor Statistics
12,000
12,500
13,000
13,500
14,000
14,500
15,000
15,500
1990 1992 1994 1996 1998 2000 2002 2004 2006 2008 2010 2012 2014 2016 2018 2020
FHLBNY Nonfarm Payrolls(thousands, seasonally adjusted)
New York New Jersey Puerto Rico Virgin Islands FHLB-NY DistrictJobs Lost (March-April), thous -1,944.9 -831.3 -119.6 -2.7 -2,898.5Jobs Recovered (May-December) 886.6 479.4 46.4 0.2 1,412.6
% Recovered 45.6% 57.7% 38.8% 7.4% 48.7%
-1000
-800
-600
-400
-200
0
200
400
600
Private Payroll Changes By Industry in the FHLBNY District
March-April May-December
Thous
43.8%
76.1%
61.0% 54.0%
71.1%
57.6%12.1%
33.9%40.4%
38.2%
44.4%
27

FHLBNY
FHLBNY
FHLBNY District Has a Considerable Way to Go to
Recoup COVID-19 Job Losses
Source: Bureau of Labor Statistics
Jobs Lost (thous) Jobs Recovered (thous) Percent
United States -22,160 12,321 55.6%
FHLBNY District -2,899 1,413 48.7%
New York State -1,944.9 886.6 45.6%
Albany-Schenectady-Troy, NY -74.9 29.3 39.1%
Binghamton, NY -14.2 7.6 53.5%
Buffalo-Cheektowaga-Niagara Falls, NY -111.7 66.3 59.4%
Dutchess County-Putnam County, NY Metropolitan Division -26.0 11.2 43.1%
Elmira, NY -4.6 2.2 47.8%
Glens Falls, NY -10.5 5.8 55.2%
I thaca, NY -9.7 7.3 75.3%
Kingston, NY -9.6 6.4 66.7%
Nassau County-Suffolk County, NY Metropolitan Division -296.4 187.5 63.3%
New York-Jersey City-White Plains, NY-NJ Metropolitan Division -1,478.2 683.0 46.2%
New York-Newark-Jersey City, NY-NJ-PA -2,036.2 986.7 48.5%
Rochester, NY -100.0 43.1 43.1%
Syracuse, NY -59.9 25.4 42.4%
Utica-Rome, NY -19.6 9.3 47.4%
Watertown-Fort Drum, NY -7.3 3.3 45.2%
New York City, NY -944.1 360.9 38.2%
Orange-Rockland-Westchester, NY -149.7 85.3 57.0%
Jobs Lost (thous) Jobs Recovered (thous) Percent
New Jersey -831.3 479.4 57.7%
Atlantic City-Hammonton, NJ -44.5 25.3 56.9%
Camden, NJ Metropolitan Division -89.7 54.4 60.6%
Newark, NJ-PA Metropolitan Division -225.8 105.4 46.7%
Ocean City, NJ -11.1 9.1 82.0%
Trenton, NJ -38.1 22.5 59.1%
Vineland-Bridgeton, NJ -8.3 4.2 50.6%
Bergen-Hudson-Passaic, NJ -185.5 108.8 58.7%
Middlesex-Monmouth-Ocean, NJ -195.1 128.0 65.6%
Puerto Rico -119.6 46.4 38.8%
Aguadilla-Isabela -7.9 4.0 50.6%
Arecibo -4.9 3.7 75.5%
Guayama -1.6 0.9 56.3%
Mayaguez -3.9 0.6 15.4%
Ponce -10.2 5.3 52.0%
San German -2.7 1.7 63.0%
San Juan-Carolina-Caguas -91.8 24.5 26.7%
Virgin Islands -2.7 0.2 7.4%
28

FHLBNY
FHLBNY
District Jobless Rates Have Generally Moved Lower,
But Remain Well Above National Average
Note: Shaded areas denote recessions. Source: Bureau of Labor Statistics
2
4
6
8
10
12
14
16
18
1990 1992 1994 1996 1998 2000 2002 2004 2006 2008 2010 2012 2014 2016 2018 2020
Unemployment Rates(percent)
United States FHLBNY District NAIRU New Jersey New York Puerto Rico
Pandemic Peak Dec ChangeUnited States: 14.7% 6.7% -8.0%
FHLBNY: 15.2% 8.1% -7.1%New York: 15.9% 8.2% -7.7%New Jersey: 16.8% 7.6% -9.2%Puerto Rico: 9.0% 9.1% 0.1%
29

FHLBNY
FHLBNY
Income Inequality Rising Across U.S. and Majority of FHLBNY District
30
46.7
46.3
49.8
48.2 48.1
51.4
43
44
45
46
47
48
49
50
51
52
United States New Jersey New York
2006-2010 2014-2018
Note: The Gini Index is a summary measure of income inequality. A value of 0 indicates perfect equality while a value of 1 (or 100)
indicates perfect inequality. Source: Population Research Bureau

FHLBNY
FHLBNY
Record Low Mortgage Rates Are Boosting
Home-Purchase Mortgage Applications
Note: Shaded areas denote recessions. Sources: Mortgage Bankers Association
100
150
200
250
300
350
400
450
500
1991 1993 1995 1997 1999 2001 2003 2005 2007 2009 2011 2013 2015 2017 2019 2021
Home-Purchase Mortgage Applications
2.00
2.50
3.00
3.50
4.00
4.50
5.00
5.50
2014 2015 2016 2017 2018 2019 2020 2021
Mortgage Interest Rates
5-Yr ARM 15-Yr Fixed 30-Yr Fixed
31
FHLBNY
FHLBNY
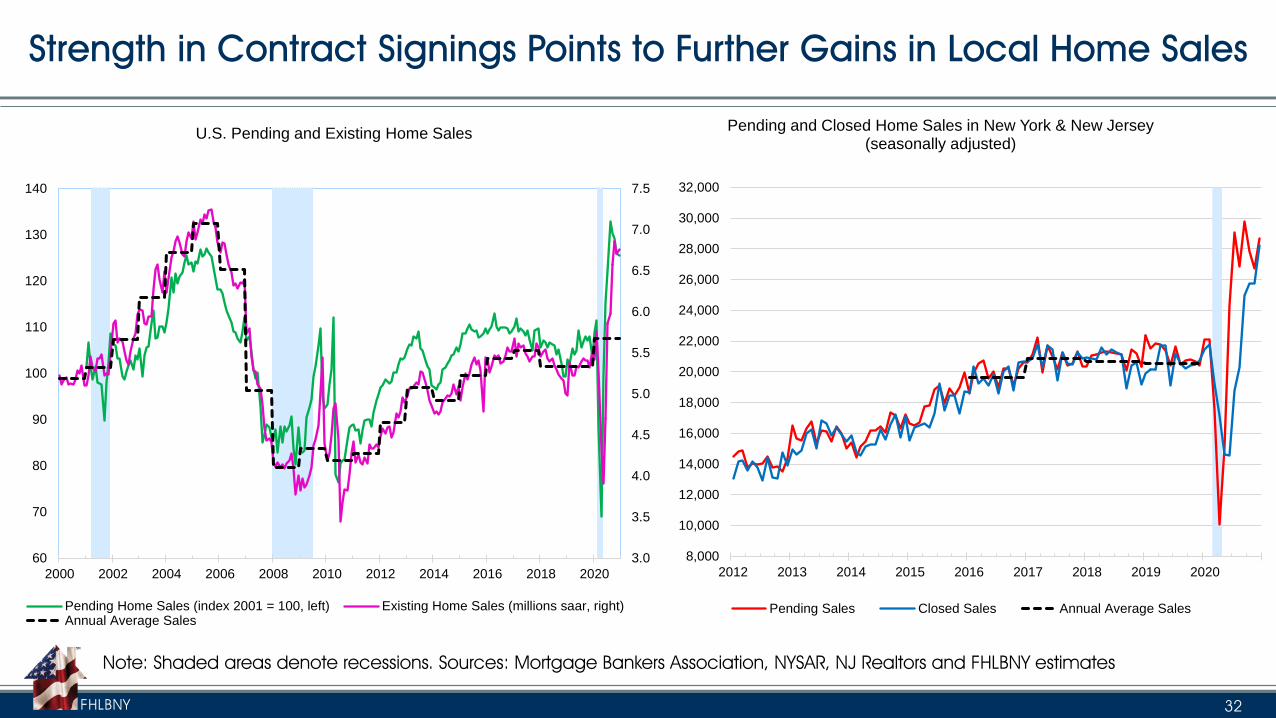
Strength in Contract Signings Points to Further Gains in Local Home Sales
Note: Shaded areas denote recessions. Sources: Mortgage Bankers Association, NYSAR, NJ Realtors and FHLBNY estimates
3.0
3.5
4.0
4.5
5.0
5.5
6.0
6.5
7.0
7.5
60
70
80
90
100
110
120
130
140
2000 2002 2004 2006 2008 2010 2012 2014 2016 2018 2020
U.S. Pending and Existing Home Sales
Pending Home Sales (index 2001 = 100, left) Existing Home Sales (millions saar, right)Annual Average Sales
8,000
10,000
12,000
14,000
16,000
18,000
20,000
22,000
24,000
26,000
28,000
30,000
32,000
2012 2013 2014 2015 2016 2017 2018 2019 2020
Pending and Closed Home Sales in New York & New Jersey(seasonally adjusted)
Pending Sales Closed Sales Annual Average Sales
32

FHLBNY
FHLBNY
Historically Low Homes on the Market Will
Continue to Support Local Median Prices
Note: Shaded areas denote recession. Sources: NYSAR, NJ Realtors and FHLBNY estimates
20,000
40,000
60,000
80,000
100,000
120,000
140,000
160,000
180,000
2012 2013 2014 2015 2016 2017 2018 2019 2020
Homes Available for Sale(seasonally adjusted)
NY & NJ New York New Jersey
$200,000
$225,000
$250,000
$275,000
$300,000
$325,000
$350,000
$375,000
$400,000
2012 2013 2014 2015 2016 2017 2018 2019 2020
Median Selling Prices (seasonally adjusted)
NY & NJ New York New Jersey
33

FHLBNY
FHLBNY
Mortgage Delinquencies Dipped in November;
Forbearances Edging Lower
34
Note: Shaded areas denote recessions Source: Mortgage Bankers Association
3.9%
2.0%
0.3%
1.0%
0.4%
6.1%
1.4%
0.6%0.8%
3.3%
0.3%
5.9%
3.1%
0%
1%
2%
3%
4%
5%
6%
7%
30+ Days PastDue
30-59 Days PastDue
60-89 Days PastDue
90-119 DaysPast Due
120+ Days PastDue
In Foreclosure
Mortgage Delinquency Rates
Nov-19 Oct-20 Nov-20

FHLBNY
FHLBNY
Commercial Segment Drove Nonresidential
Building Projects Higher at Beginning of 2021
35
Note: Shaded areas denote recessions. Source: Dodge Data & Analytics
40
60
80
100
120
140
160
180
200
220
2002 2003 2004 2005 2006 2007 2008 2009 2010 2011 2012 2013 2014 2015 2016 2017 2018 2019 2020 2021
Dodge Momentum Index(2000 = 100, seasonally adjusted)
Dodge Momentum Index Commercial Building Planning Index Institutional Building Planning Index

FHLBNY
FHLBNY
Risks to Commercial Real Estate Will Remain High
In contrast to the residential sector, commercial real estate likely will face significant headwinds in the future:
▪ $10,000 cap on state and local tax deductions in the Tax Cuts and Jobs Act of 2018 put the New York City
metropolitan area at a competitive disadvantage as people and then businesses moved to lower tax
states.
▪ The City’s population growth, which turned negative for the first time in 2017, suffered accelerated declines
over the past two years, falling from a peak of 8.47 million in 2016 to 8.34 million in 2019.
▪ Financial problems at co-working firms – the largest consumers of office space during the past several years
– have further reduced demand.
▪ In addition, the ability to operate successfully from a remote posture in the wake of the COVID-19
pandemic has prompted many companies to question the need for physical office space.
▪ Finally, new competitive construction will weigh on existing properties, resulting in a rise in vacancy rates.
36

FHLBNY
FHLBNY
101 PARK AVENUE • NEW YORK, NY 10178 • WWW.FHLBNY.COM
Advancing Housing and Community Growth
The information provided by the Federal Home Loan Bank of New York (FHLBNY) in this communication is set forth for informational purposes only. The information should not be construed as an opinion,
recommendation or solicitation regarding the use of any financial strategy and/or the purchase or sale of any financial instrument. All customers are advised to conduct their own independent due diligence
before making any financial decisions. Please note that the past performance of any FHLBNY service or product should not be viewed as a guarantee of future results. Also, the information presented here and/or
the services or products provided by the FHLBNY may change at any time without notice.
Brian M. Jones
FHLBNY, Financial Economist
Office: (212) 441- 6802; Mobile (914) 351-8994