turning a potential disruption into a competitive advantage · turning a potential disruption into...
TRANSCRIPT
TURNING A POTENTIAL DISRUPTION INTO A COMPETITIVE ADVANTAGEAN INNOVATION JOURNEY
DHL Customer Solutions & Innovation
Tobias LarssonDirector DHL Resilience360DHL Customer Solutions & Innovation
2
Why Should We Look Into Trends? The Frog’s Dilemma
Inability or unwillingness of people to react to significant changes that occur gradually
3
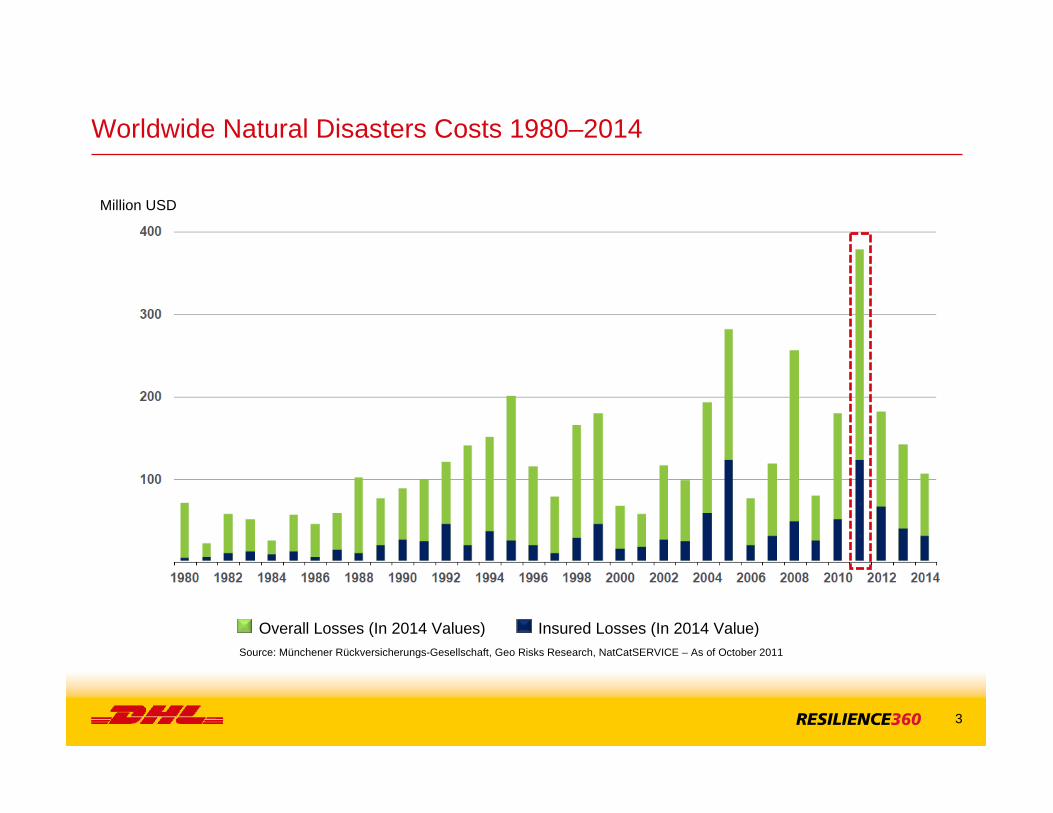
Worldwide Natural Disasters Costs 1980–2014
Overall Losses (In 2014 Values) Insured Losses (In 2014 Value)
Million USD
Source: Münchener Rückversicherungs-Gesellschaft, Geo Risks Research, NatCatSERVICE – As of October 2011
4
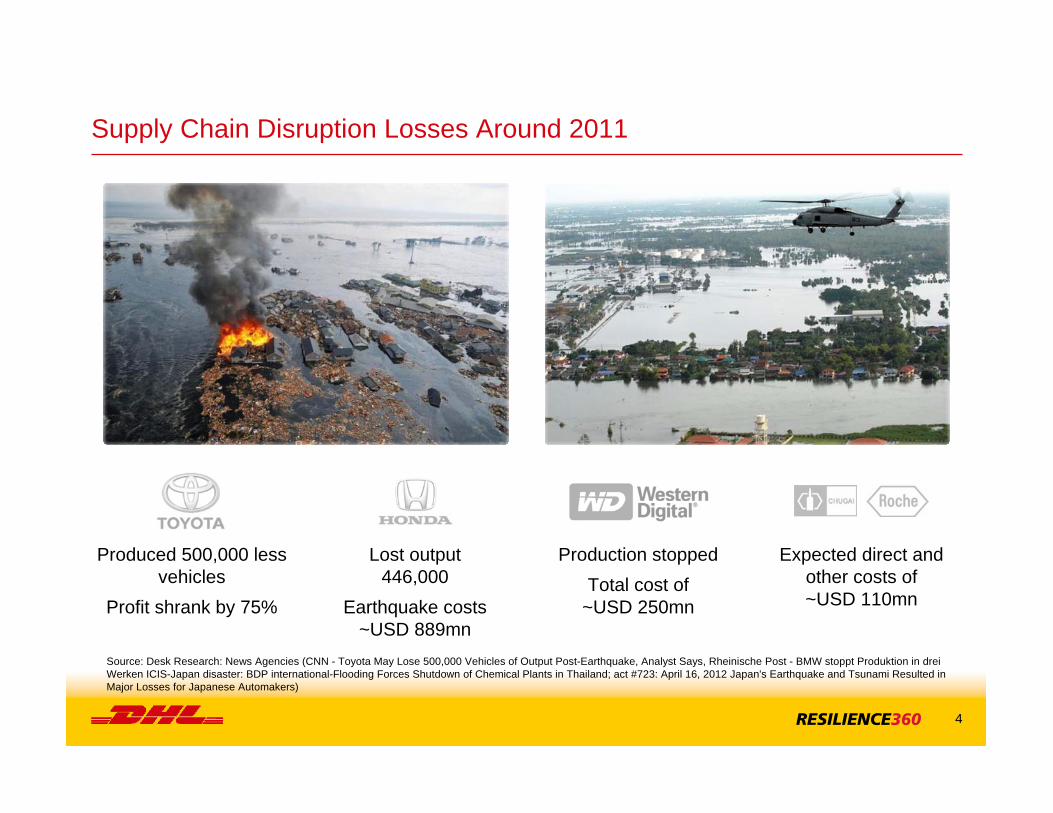
Supply Chain Disruption Losses Around 2011
Produced 500,000 less vehicles
Profit shrank by 75%
Production stoppedTotal cost of
~USD 250mn
Lost output446,000
Earthquake costs~USD 889mn
Expected direct and other costs of ~USD 110mn
Source: Desk Research: News Agencies (CNN - Toyota May Lose 500,000 Vehicles of Output Post-Earthquake, Analyst Says, Rheinische Post - BMW stoppt Produktion in drei Werken ICIS-Japan disaster: BDP international-Flooding Forces Shutdown of Chemical Plants in Thailand; act #723: April 16, 2012 Japan's Earthquake and Tsunami Resulted in Major Losses for Japanese Automakers)
5
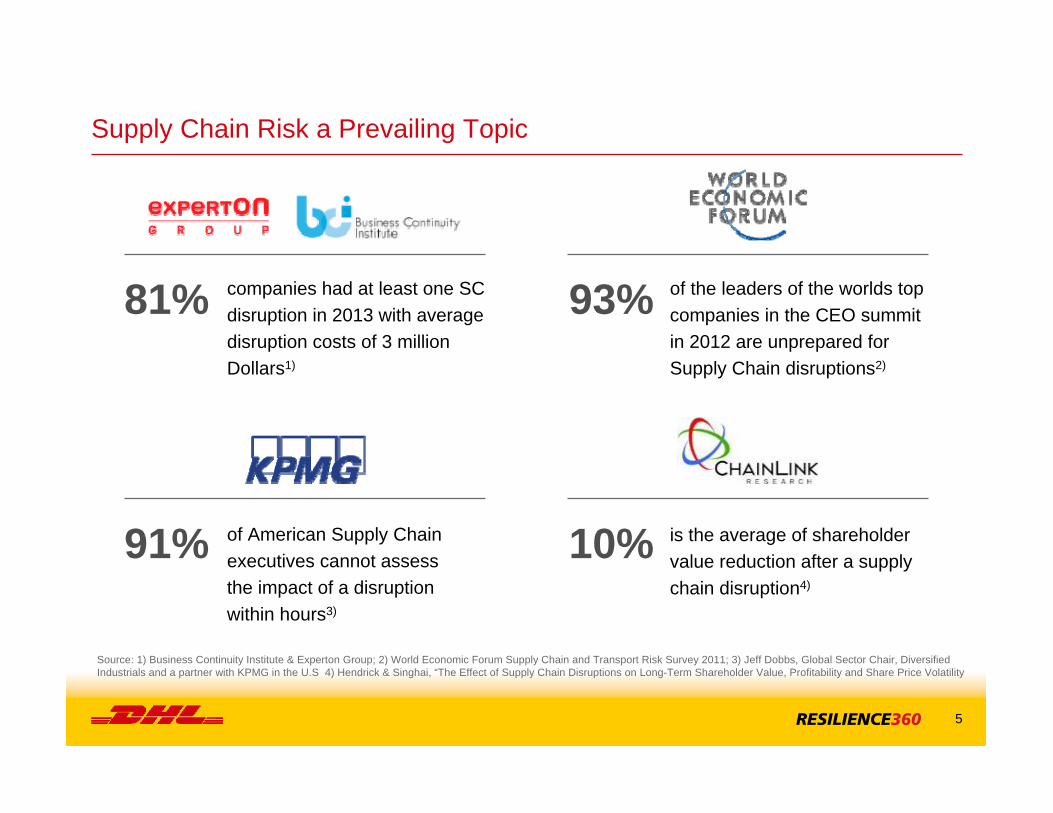
Supply Chain Risk a Prevailing Topic
companies had at least one SC disruption in 2013 with average disruption costs of 3 million Dollars1)
of the leaders of the worlds top companies in the CEO summit in 2012 are unprepared for Supply Chain disruptions2)
is the average of shareholder value reduction after a supply chain disruption4)
of American Supply Chain executives cannot assess the impact of a disruption within hours3)
81% 93%
91% 10%
Source: 1) Business Continuity Institute & Experton Group; 2) World Economic Forum Supply Chain and Transport Risk Survey 2011; 3) Jeff Dobbs, Global Sector Chair, Diversified Industrials and a partner with KPMG in the U.S 4) Hendrick & Singhai, “The Effect of Supply Chain Disruptions on Long-Term Shareholder Value, Profitability and Share Price Volatility
6
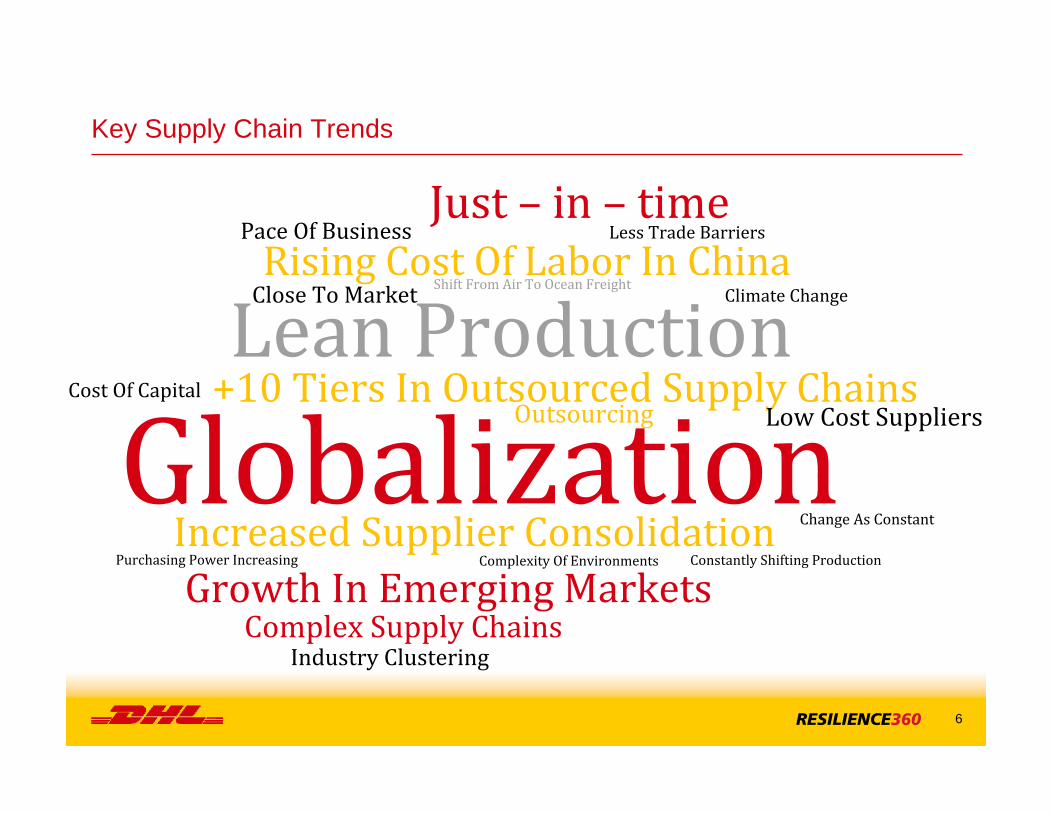
Key Supply Chain Trends
Lean ProductionPace Of Business
Just – in – time Less Trade Barriers
Rising Cost Of Labor In ChinaClose To Market Climate Change
Shift From Air To Ocean Freight
+10 Tiers In Outsourced Supply ChainsCost Of CapitalLow Cost SuppliersOutsourcing
Change As Constant
Purchasing Power Increasing Complexity Of Environments Constantly Shifting ProductionIncreased Supplier ConsolidationGrowth In Emerging Markets
Complex Supply ChainsIndustry Clustering

7
Weather
Tropical Cyclone
Wildfire
Lightning
TsunamiFlood
VolcanoEarthquake
TornadoHail
Ice Storm
Source: © Copyright by DPDHL
Law Enforcement War
Terrorism Corruption
Corporate Social Responsibility
Civil UnrestPublic Holidays
Outbreak of Disease
Public Health
Delay due to Unrest
Infrastructure
Port Congestion
Airport Closure
Train Derailment
Roadway Closure
Piracy
Runway Maintenance
Flight Delays
Delay in Berthing of Vessels
Supplier Financial Stress
Industrial Fire
Utility FailureRegulatory
Telecom Outage
Gas Leaks
Illicit Trade
Illegal Cargo Introduction
Customs Efficiency
Cargo Theft
8
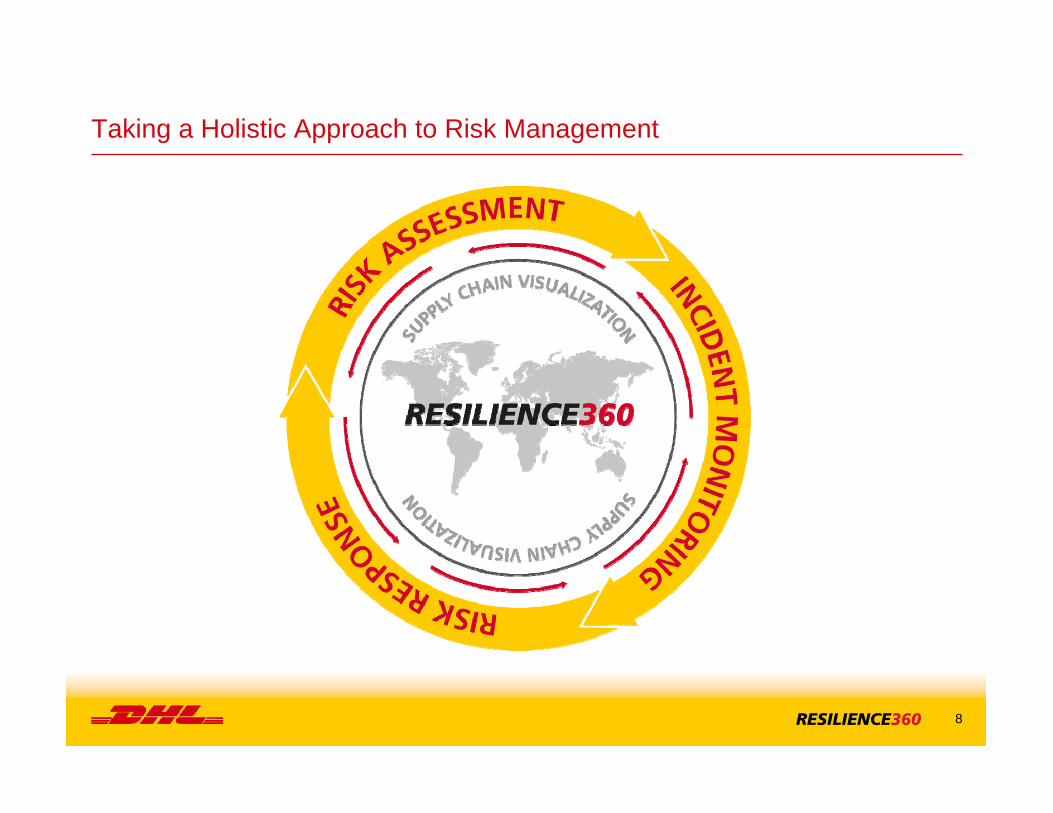
Taking a Holistic Approach to Risk Management
9
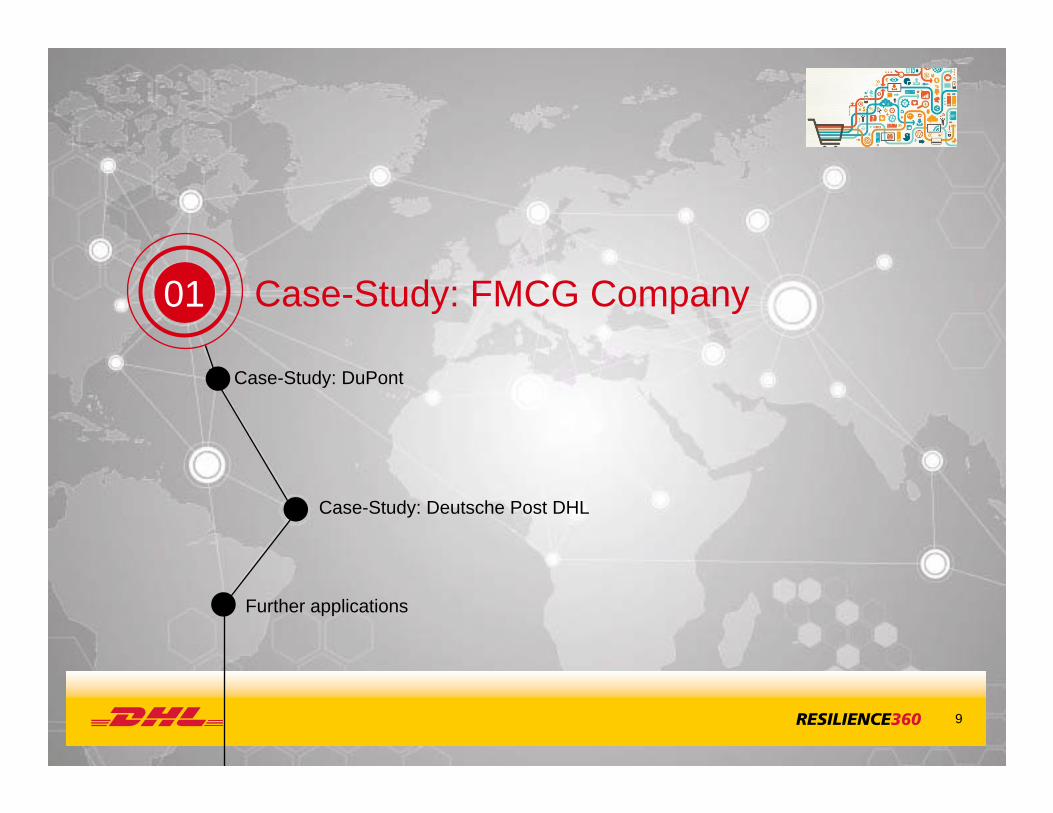
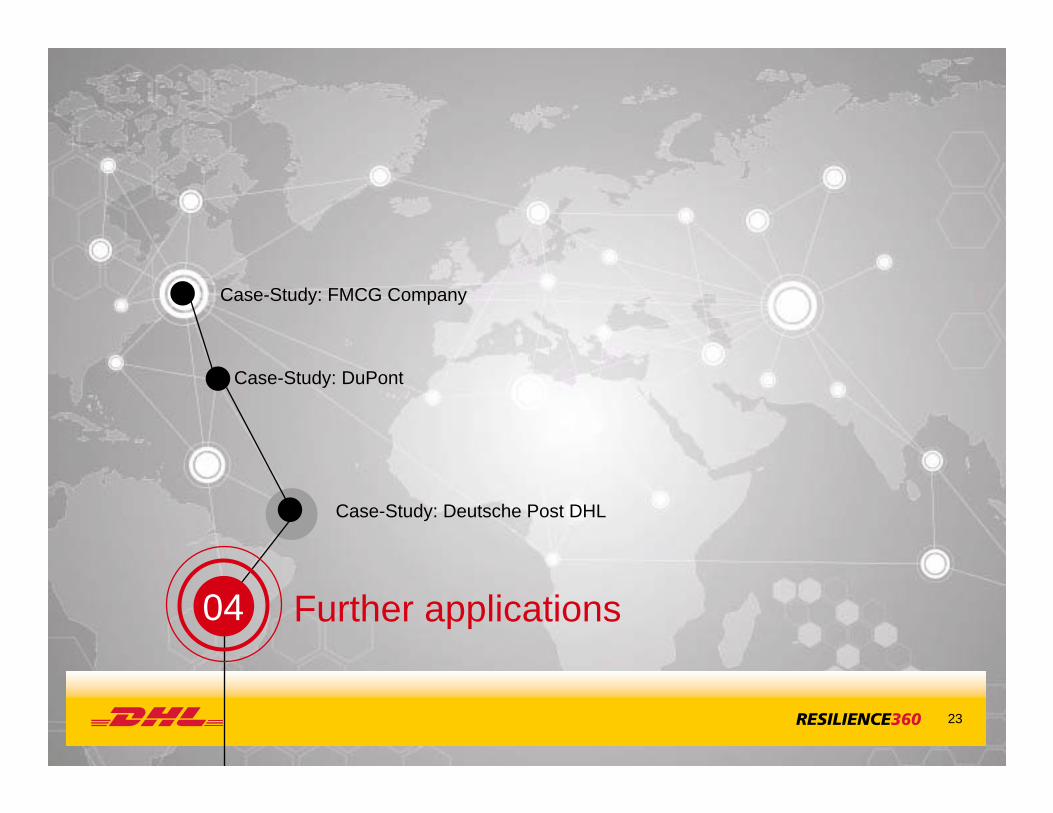
01 Case-Study: FMCG Company
Case-Study: DuPont
Case-Study: Deutsche Post DHL
Further applications
10
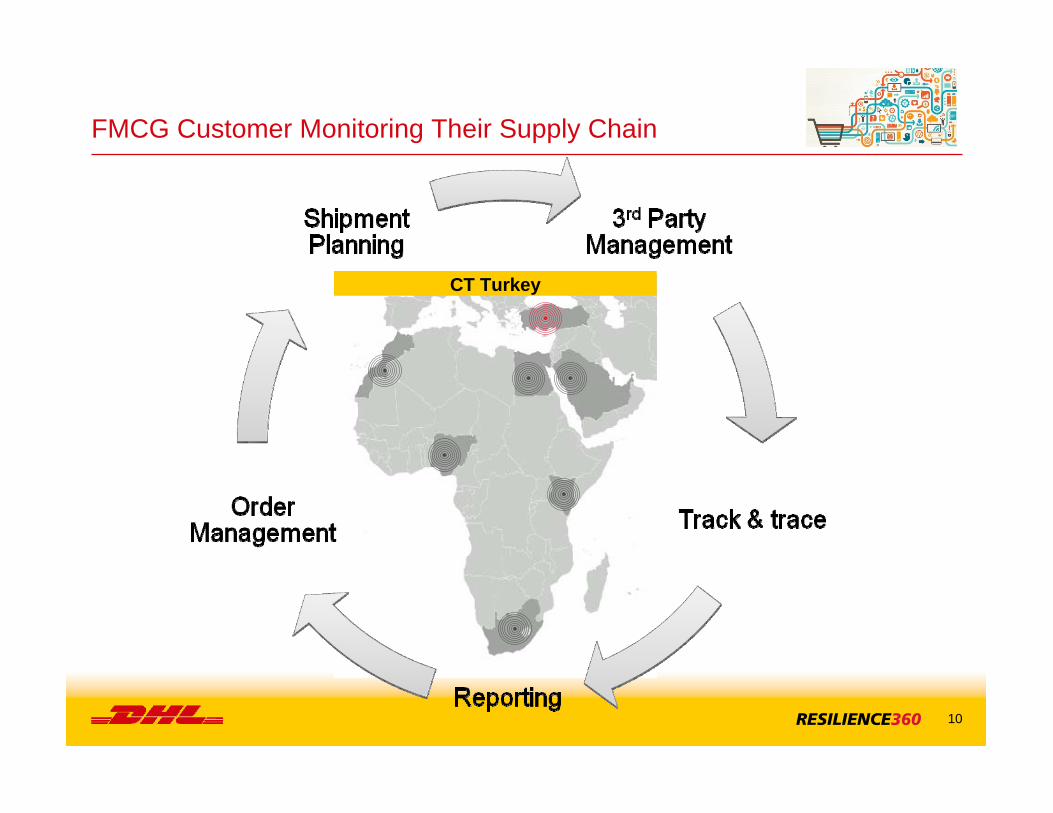
FMCG Customer Monitoring Their Supply Chain
CT Turkey
11
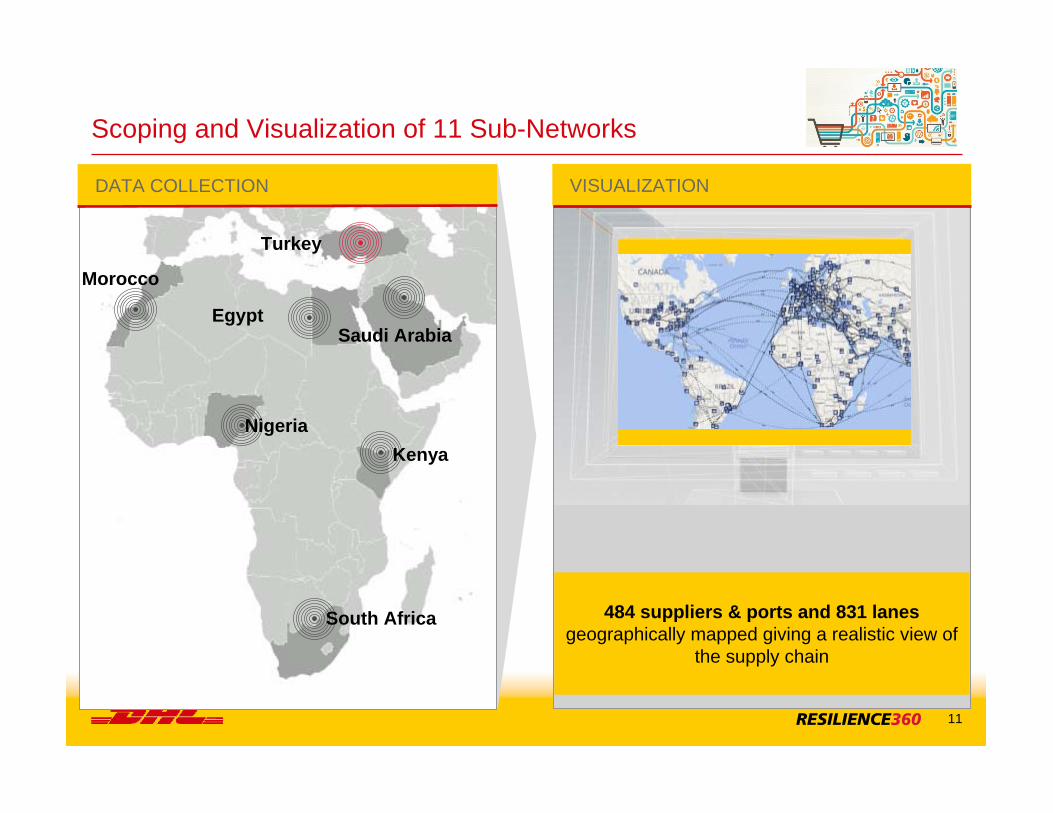
Scoping and Visualization of 11 Sub-Networks
484 suppliers & ports and 831 lanes geographically mapped giving a realistic view of
the supply chain
DATA COLLECTION VISUALIZATION
Morocco
Turkey
EgyptSaudi Arabia
Kenya
South Africa
Nigeria
12
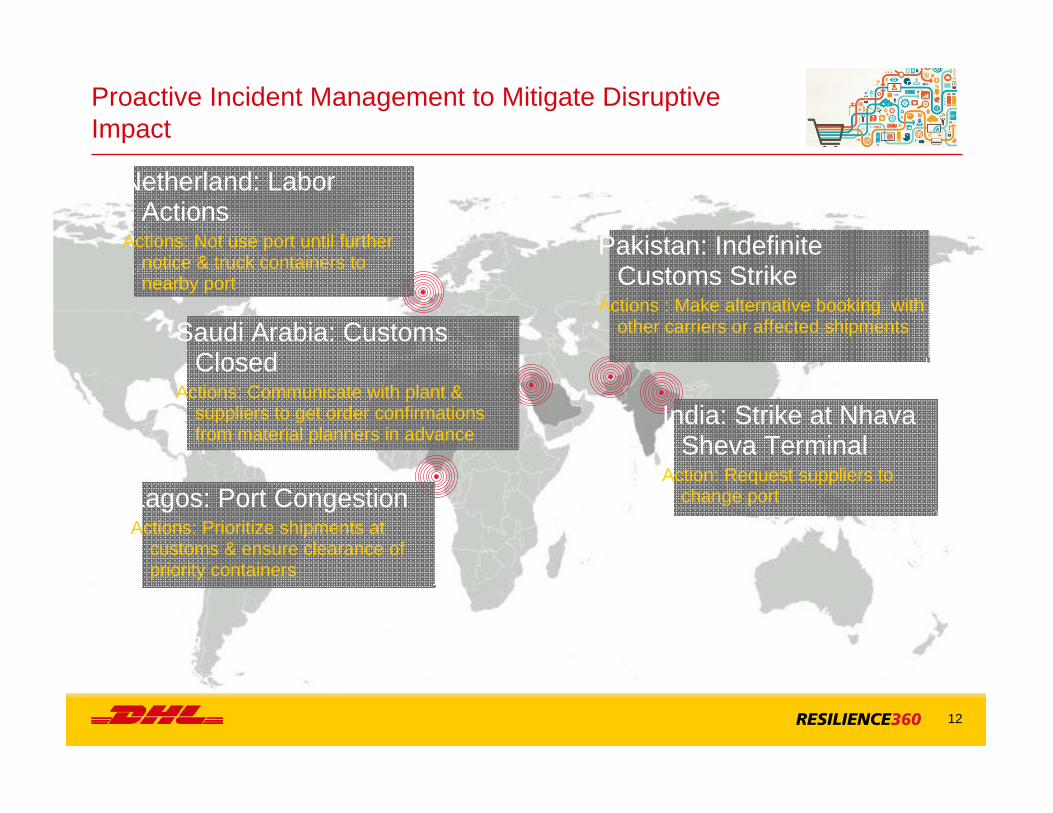
Proactive Incident Management to Mitigate Disruptive Impact
Netherland: Labor Actions
Actions: Not use port until further notice & truck containers to nearby port
India: Strike at Nhava Sheva Terminal
Action: Request suppliers to change port
Pakistan: Indefinite Customs Strike
Actions : Make alternative booking with other carriers or affected shipmentsSaudi Arabia: Customs
ClosedActions: Communicate with plant &
suppliers to get order confirmations from material planners in advance
Lagos: Port CongestionActions: Prioritize shipments at
customs & ensure clearance of priority containers
13
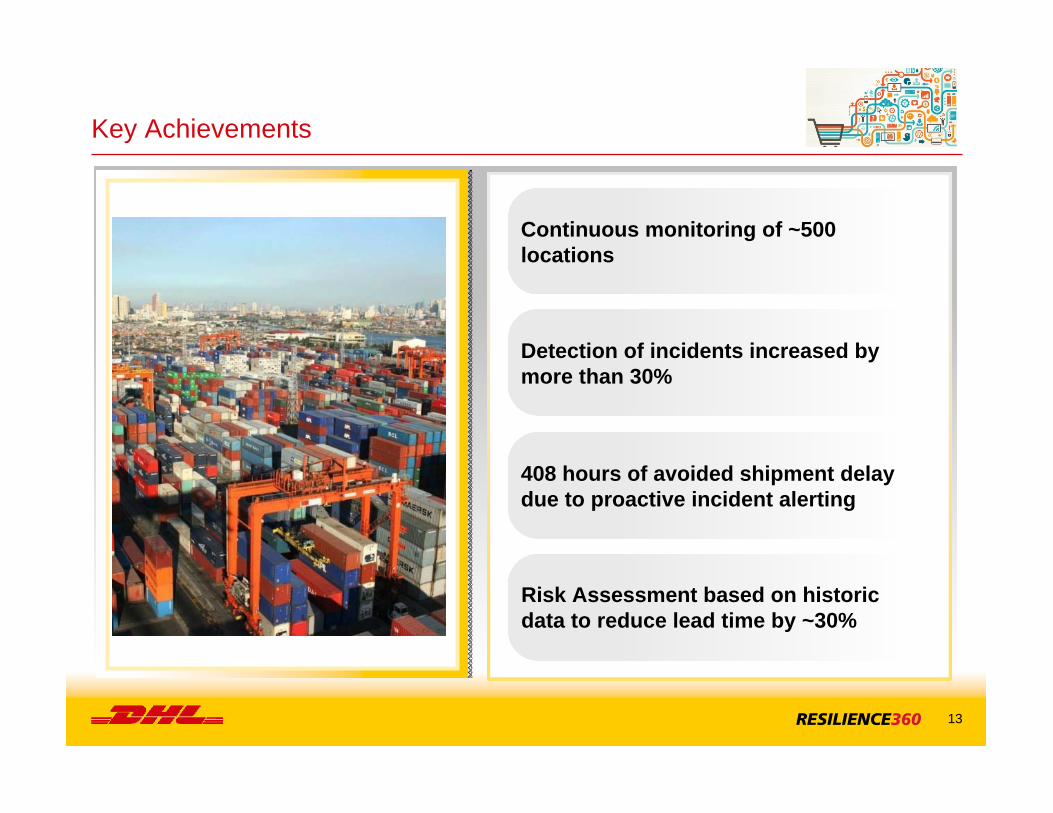
Key Achievements
Continuous monitoring of ~500 locations
Detection of incidents increased by more than 30%
408 hours of avoided shipment delay due to proactive incident alerting
Risk Assessment based on historic data to reduce lead time by ~30%
14
02 Case-Study: DuPont
Case-Study: FMCG Company
Case-Study: Deutsche Post DHL
Further applications
15
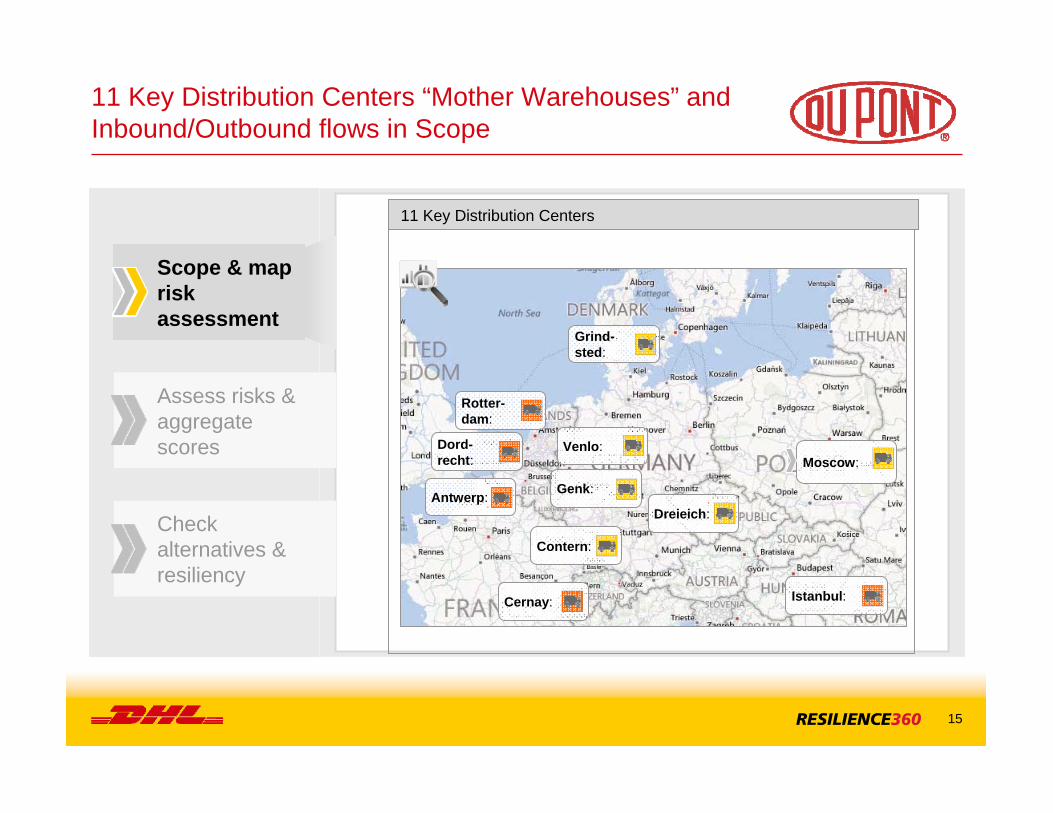
11 Key Distribution Centers “Mother Warehouses” andInbound/Outbound flows in Scope
Scope & map risk assessment
Assess risks & aggregate scores
Check alternatives & resiliency
Rotter-dam:
Dord-recht:
Antwerp: Genk:
Contern:
Cernay:
Dreieich:
Grind-sted:
Moscow:Venlo:
Istanbul:
11 Key Distribution Centers
16
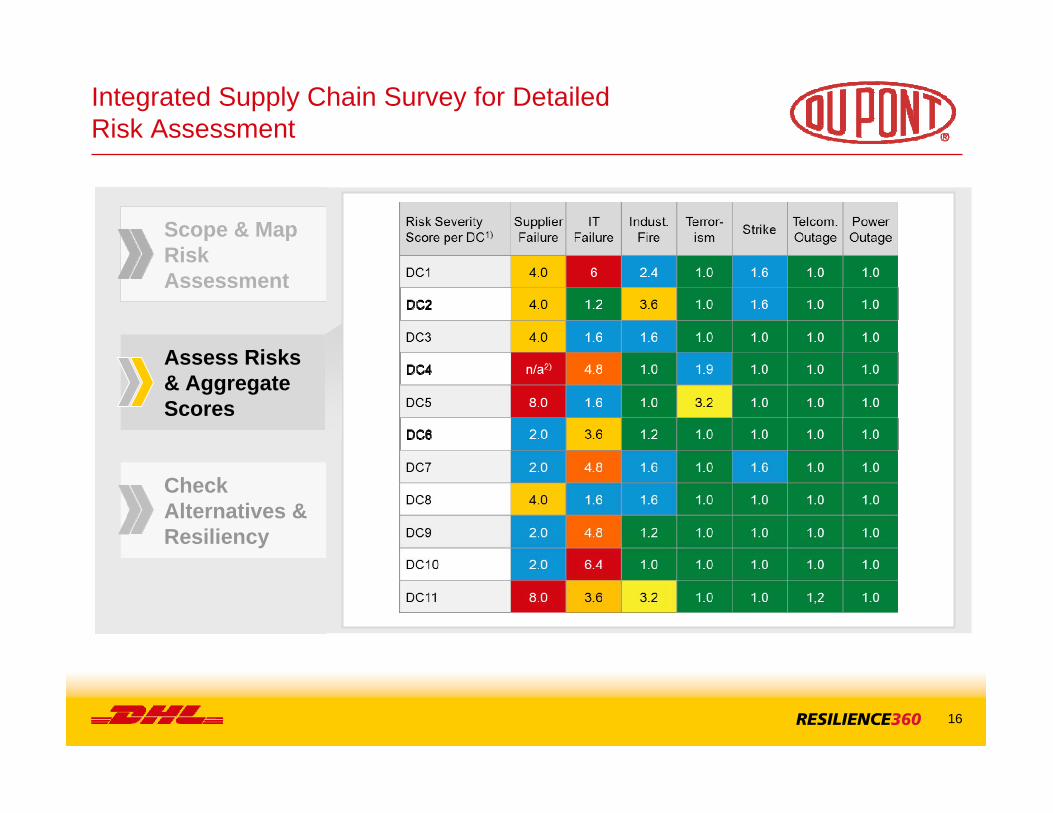
Integrated Supply Chain Survey for Detailed Risk Assessment
Scope & Map Risk Assessment
Check Alternatives & Resiliency
Assess Risks& Aggregate Scores
17
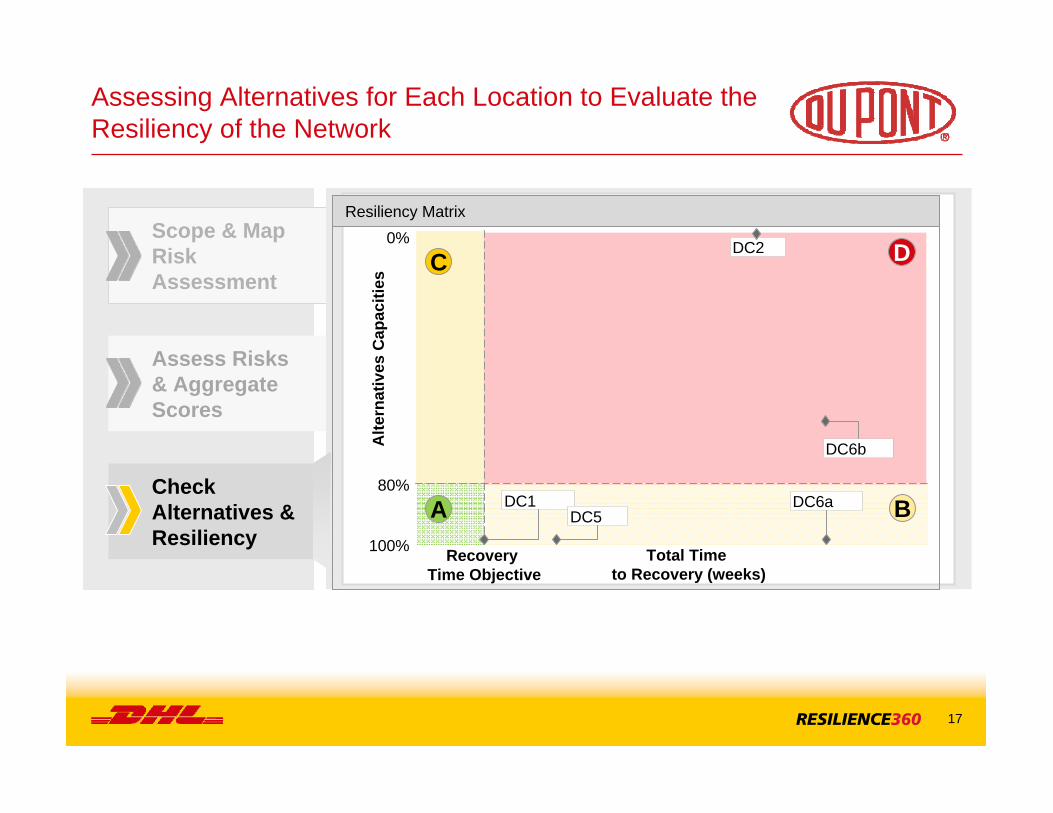
Assessing Alternatives for Each Location to Evaluate the Resiliency of the Network
Scope & Map Risk Assessment
Check Alternatives & Resiliency
Alte
rnat
ives
Cap
aciti
es
0%
80%
100%
DC
BA
Total Time to Recovery (weeks)
Recovery Time Objective
DC2
DC6aDC1
DC6b
DC5
Resiliency Matrix
Assess Risks& Aggregate Scores
18
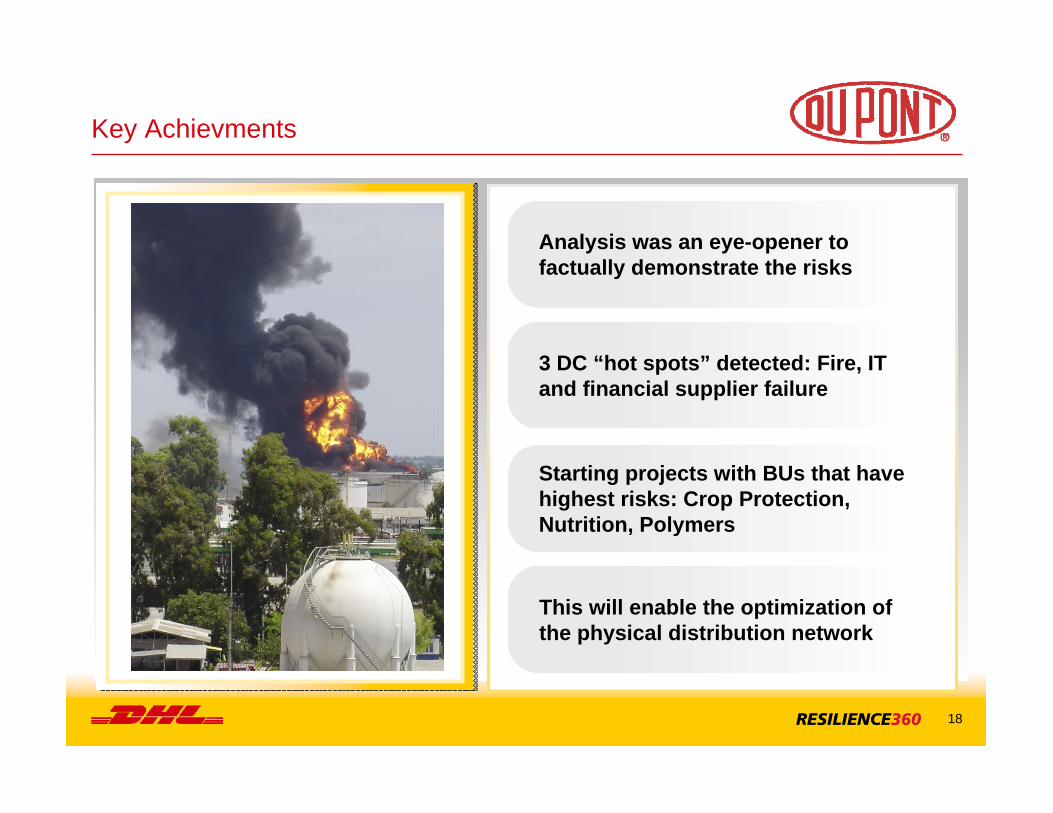
Key Achievments
Analysis was an eye-opener to factually demonstrate the risks
3 DC “hot spots” detected: Fire, IT and financial supplier failure
Starting projects with BUs that have highest risks: Crop Protection, Nutrition, Polymers
This will enable the optimization of the physical distribution network
19
Case-Study: FMCG Company
Case-Study: DuPont
Case-Study: Deutsche Post DHL
Further applications
03
20
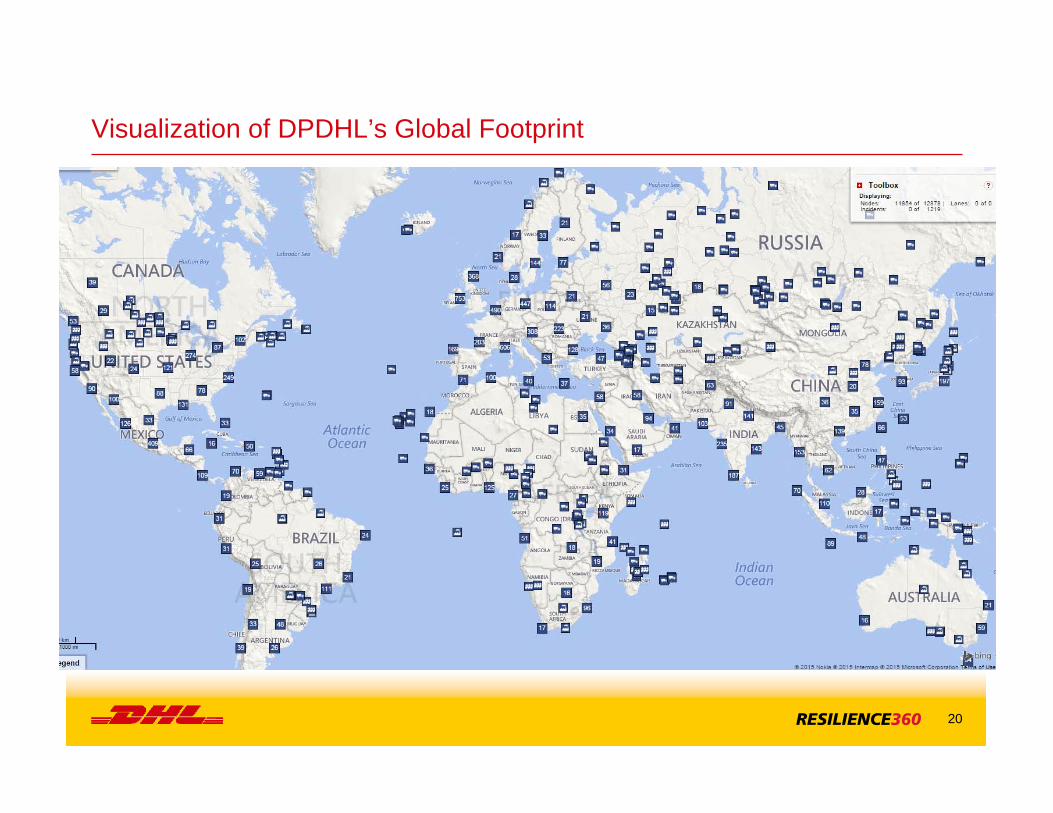
Visualization of DPDHL’s Global Footprint
21
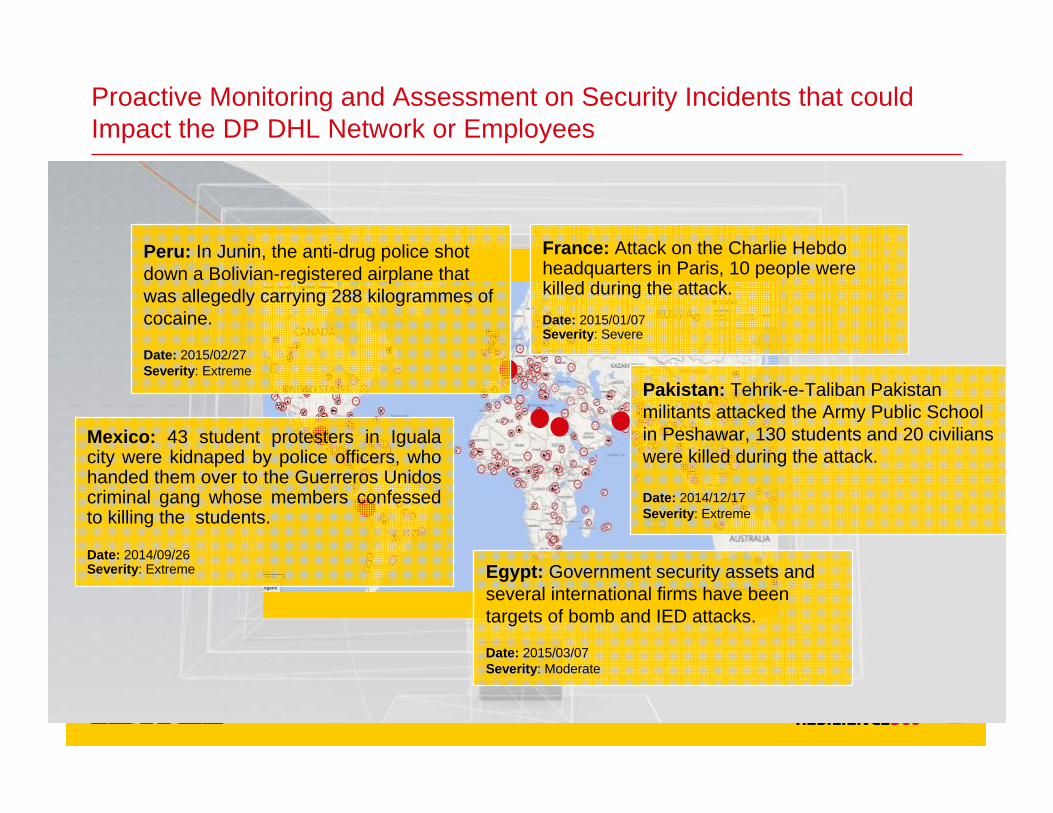
Proactive Monitoring and Assessment on Security Incidents that could Impact the DP DHL Network or Employees
Pakistan: Tehrik-e-Taliban Pakistan militants attacked the Army Public School in Peshawar, 130 students and 20 civilians were killed during the attack.
Date: 2014/12/17Severity: Extreme
Egypt: Government security assets and several international firms have been targets of bomb and IED attacks.
Date: 2015/03/07Severity: Moderate
Peru: In Junin, the anti-drug police shot down a Bolivian-registered airplane that was allegedly carrying 288 kilogrammes of cocaine.
Date: 2015/02/27Severity: Extreme
France: Attack on the Charlie Hebdo headquarters in Paris, 10 people were killed during the attack.Date: 2015/01/07Severity: Severe
Mexico: 43 student protesters in Iguala city were kidnaped by police officers, who handed them over to the Guerreros Unidos criminal gang whose members confessed to killing the students.
Date: 2014/09/26Severity: Extreme
22
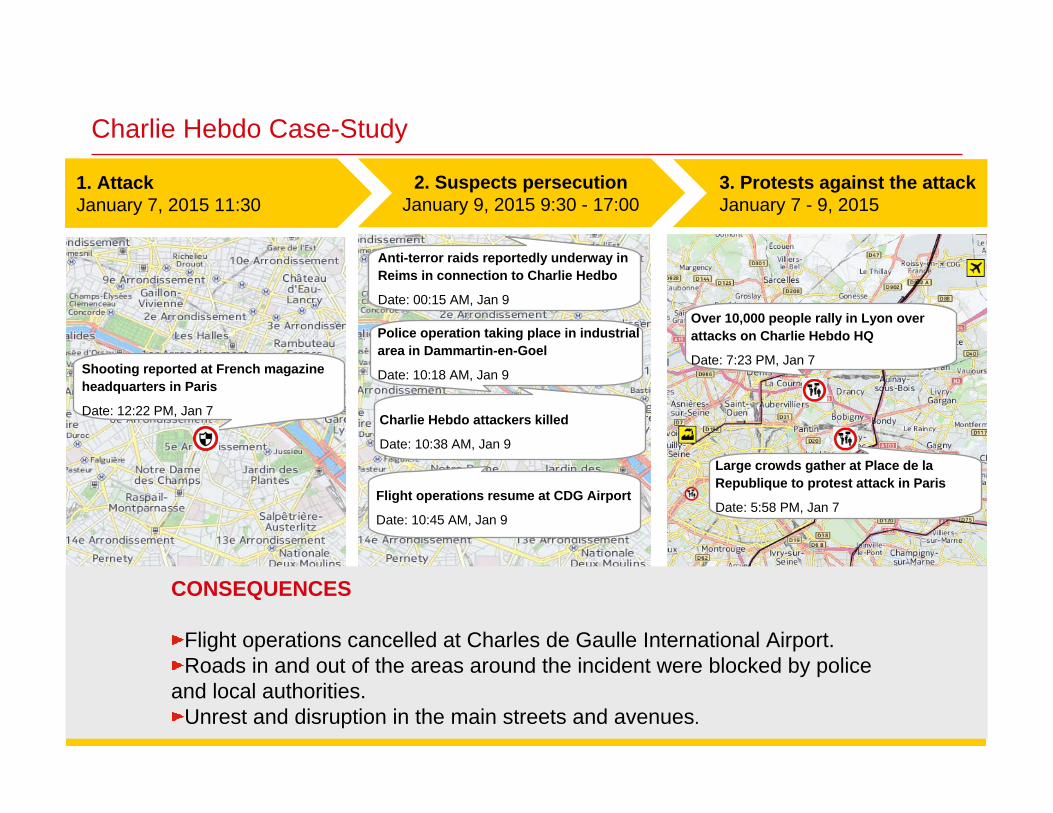
Charlie Hebdo Case-Study
CONSEQUENCES
Flight operations cancelled at Charles de Gaulle International Airport.Roads in and out of the areas around the incident were blocked by police
and local authorities.Unrest and disruption in the main streets and avenues.
3. Protests against the attackJanuary 7 - 9, 2015
1. AttackJanuary 7, 2015 11:30
2. Suspects persecutionJanuary 9, 2015 9:30 - 17:00
Shooting reported at French magazine headquarters in Paris
Date: 12:22 PM, Jan 7
Anti-terror raids reportedly underway in Reims in connection to Charlie Hedbo
Date: 00:15 AM, Jan 9
Police operation taking place in industrial area in Dammartin-en-Goel
Date: 10:18 AM, Jan 9
Charlie Hebdo attackers killed
Date: 10:38 AM, Jan 9
Flight operations resume at CDG Airport
Date: 10:45 AM, Jan 9
Over 10,000 people rally in Lyon over attacks on Charlie Hebdo HQ
Date: 7:23 PM, Jan 7
Large crowds gather at Place de la Republique to protest attack in Paris
Date: 5:58 PM, Jan 7
23
Case-Study: FMCG Company
Case-Study: DuPont
Case-Study: Deutsche Post DHL
Further applications04
24
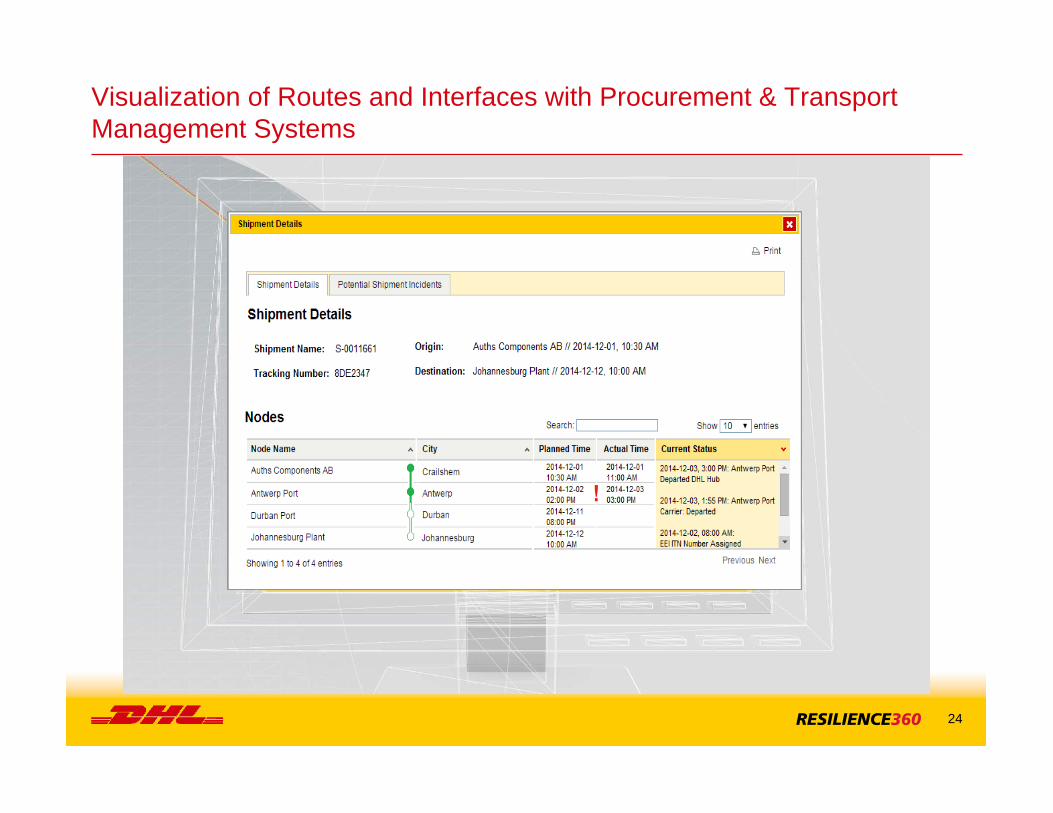
Visualization of Routes and Interfaces with Procurement & Transport Management Systems
25
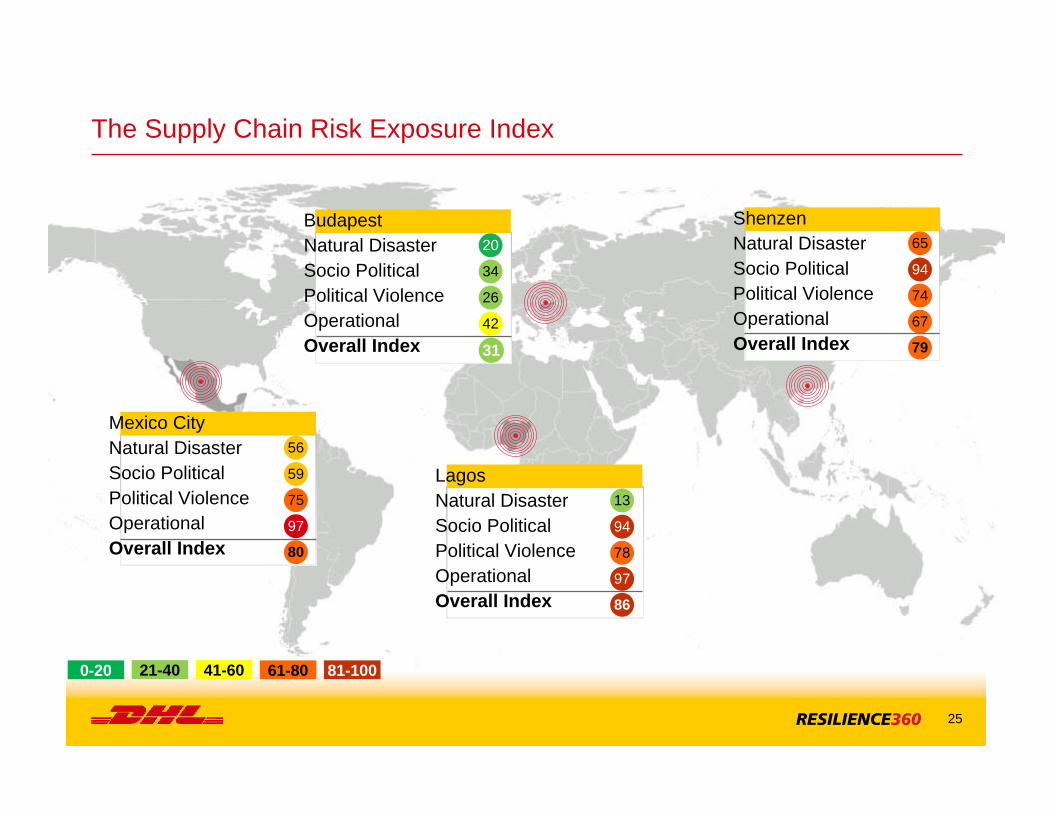
The Supply Chain Risk Exposure Index
Mexico City56
59
75
97
80
Mexico CityNatural DisasterSocio PoliticalPolitical ViolenceOperationalOverall Index
20
34
26
42
31
0-20 21-40 41-60 61-80 81-100
BudapestNatural DisasterSocio PoliticalPolitical ViolenceOperationalOverall Index
13
94
78
97
86
LagosNatural DisasterSocio PoliticalPolitical ViolenceOperationalOverall Index
65
94
74
67
79
ShenzenNatural DisasterSocio PoliticalPolitical ViolenceOperationalOverall Index
26
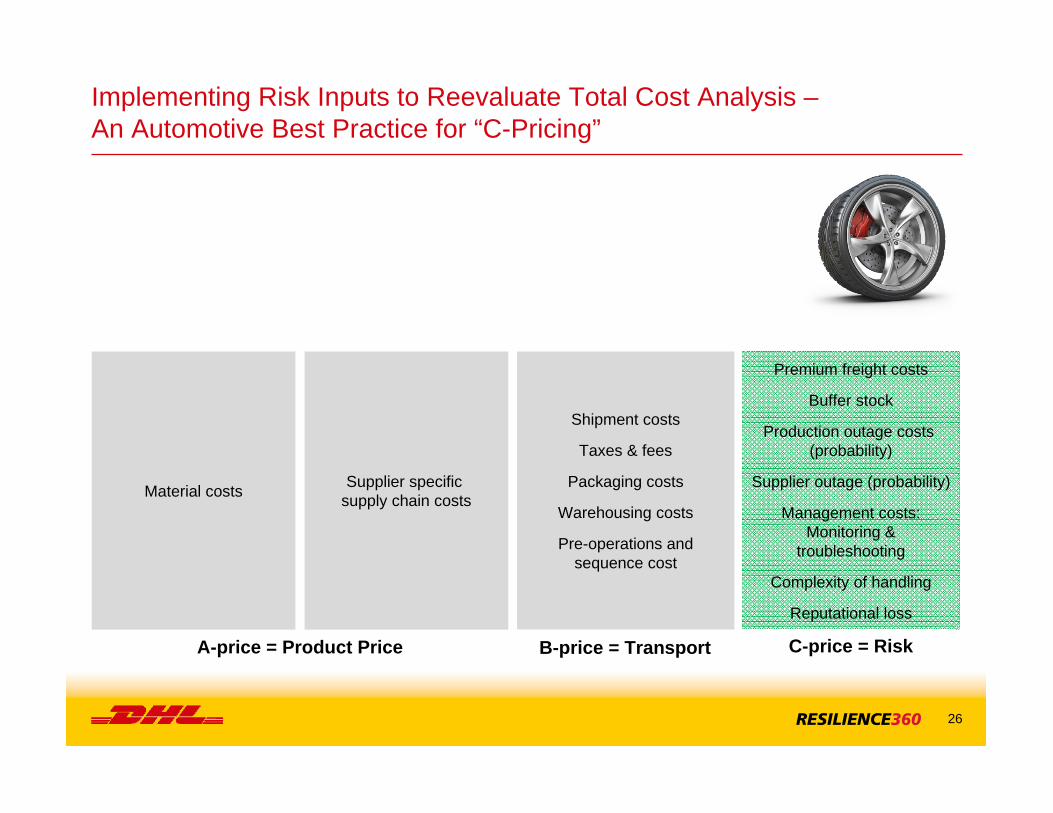
Implementing Risk Inputs to Reevaluate Total Cost Analysis –An Automotive Best Practice for “C-Pricing”
Material costs Supplier specific supply chain costs
A-price = Product Price
Shipment costs
Taxes & fees
Packaging costs
Warehousing costs
Pre-operations andsequence cost
B-price = Transport
Premium freight costs
Buffer stock
Production outage costs (probability)
Supplier outage (probability)
Management costs:Monitoring &
troubleshooting
Complexity of handling
Reputational loss
C-price = Risk
27
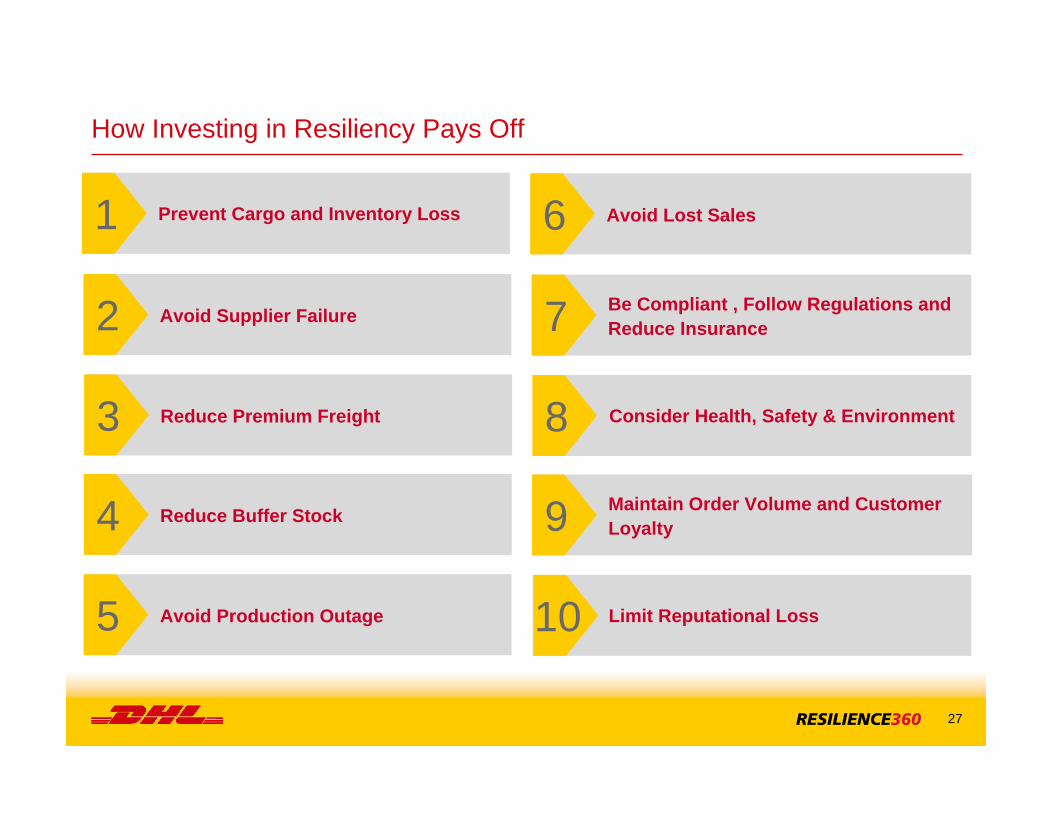
How Investing in Resiliency Pays Off
Prevent Cargo and Inventory Loss1
Avoid Supplier Failure2
Reduce Premium Freight3
Reduce Buffer Stock4
Avoid Production Outage5
Avoid Lost Sales6
Be Compliant , Follow Regulations and Reduce Insurance7
Consider Health, Safety & Environment8
Maintain Order Volume and Customer Loyalty9
Limit Reputational Loss10
28
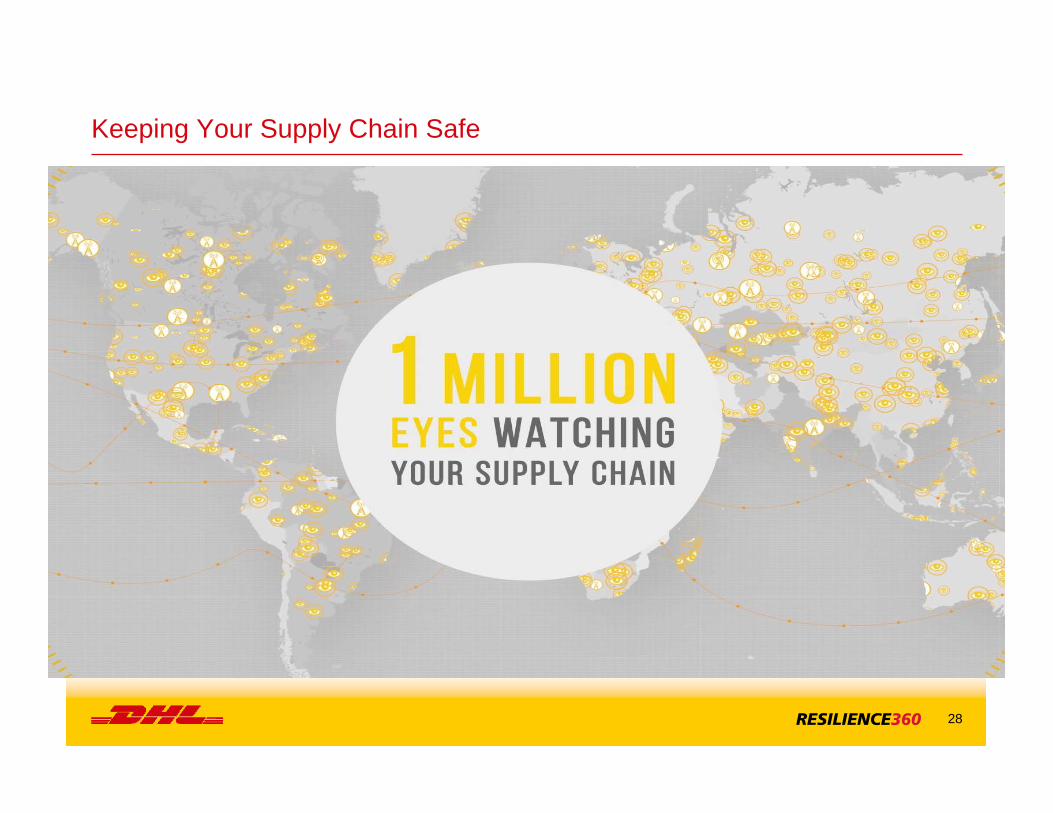
Keeping Your Supply Chain Safe
29
„What gets measured, gets managed“- Peter Ferdinand Drucker
31
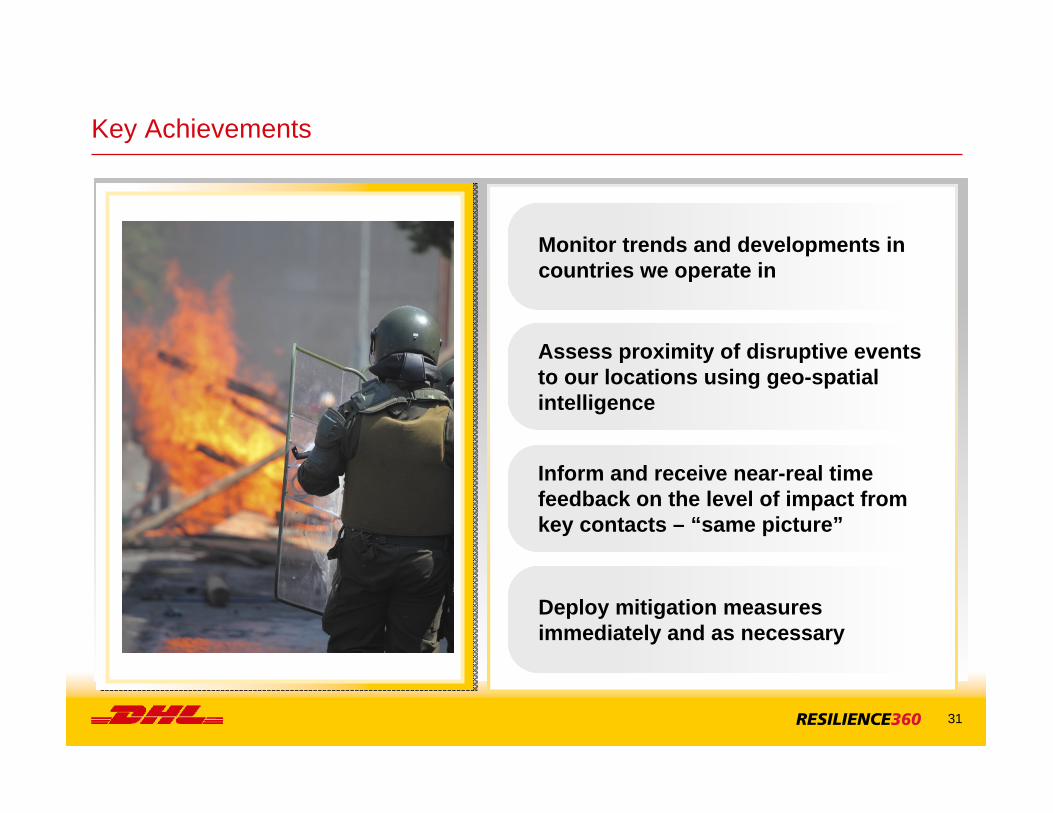
Key Achievements
Inform and receive near-real time feedback on the level of impact from key contacts – “same picture”
Deploy mitigation measures immediately and as necessary
Assess proximity of disruptive events to our locations using geo-spatial intelligence
Monitor trends and developments in countries we operate in