turkey’s competitiveness in the eu … the sperman rank correlation and mann-whitney-wilcoxan...
TRANSCRIPT
TURKEY’S COMPETITIVENESS IN THE EU MARKET:
A COMPARISON OF DIFFERENT TRADE MEASURES
by
Nevzat Şimşek Dilek Seymen Utku Utkulu
(Dokuz Eylül University, Economics Department, İzmir)
- FIRST DRAFT–
ABSTRACT: The paper basically explores the competitiveness of the Turkish firms
in the EU Market by employing different trade measures such as the
Balassa’s Revealed Comparative Advantage Index (RCA), Vollrath’s
Revealed Competitiveness Index, Trade Entropy Index, Trade Overlap
Index, Grubel-Lloyd Index, and Brülhart B Marginal Intra-Industry
Trade Index. The main drawback of the existing empirical literature is
that various RCA indices are widely used to explain the
competitiveness of a country. This paper however not only focus on
various RCA indices but some additional and complementary measures
of competitiveness are also applied since they underline different
aspects/dimensions of competitiveness.
Consistency of the results of various trade measures are then compared
by using the Sperman Rank Correlation and Mann-Whitney-Wilcoxan
tests etc. Based on the empirical results, some policy implications are
drawn.
Keywords: Competitiveness, Different trade measures, Consistency
JEL Classification: F14
I. INTRODUCTION
The Customs Union (CU) agreement signed between Turkey and the European Union
(EU) that came into force in 1996 (a unique country example of the application of the CU
without any form of active participation in Brussels, ie without full membership) has led to a
trade liberalisation and increased competitive pressure for both sides. Turkey has started
negotiations for full-membership with the EU in 2005 after the acknowledgement of country’s
fulfilment of the pre-conditions by the EU such as the well known “political criteria” on the
one hand, and “economic criteria” which includes the establishing of a well-functioning
market economy, existence of free and functioning competition (so called the Copenhagen
“economic” criteria), on the other. The beginning of negotiations has opened the door of a
new era and paved the way for full-membership
The enlargement of the EU resulted in the inclusion of the ten countries in May 2004
and the two countries in January 2007. The EU now consists of twenty seven countries.
Turkey’s accession to the EU is anticipated by 2020. In the meantime, relative
competitiveness will play a crucial role in shaping changes in trade flows and patterns
between Turkey, members and third countries. It is thus important to explore the trade
patterns and trade specialization.
The paper examine the relative competitiveness of the Turkish firms and compare the
patterns of specialisation in trade vis-à-vis the EU by employing different trade measures
such as the Balassa’s Revealed Comparative Advantage (RCA) Index, Vollrath’s Revealed
Competitiveness Index (VRC), Trade Entropy Index (TE), Trade Overlap Index (TO),
Grubel-Lloyd Index (G-L), and Brülhart B Marginal Intra-Industry Trade Index (Brülhart-B).
The main drawback of the existing empirical literature is that various RCA indices are widely
used to explain the competitiveness of a country. The definition and empirical adaptation of
RCA indices are however subject to some controversies. Thus the paper in hand focuses not
only in various RCA indices but some additional and complementary measures of
competitiveness are also applied since they underline different aspects/dimensions as regards
competitiveness. Consistency of the results of various trade measures are then compared by
using the Sperman Rank Correlation and Mann-Whitney-Wilcoxan tests etc.
The plan of the paper is as follows. The following section focuses on the
measurement of competitiveness by reviewing different trade measures. Section 3 outlines
Turkey’s trade and the trade relations between Turkey and the EU. Section 4 reports the data
and the empirical findings. The final section draws some conclusions and policy
implications.
II. ON THE TRADE MEASURES OF COMPETITIVENESS: a selective review
In recent years, trade theories and their empirical practices have followed two main
directions. First, “inter-industry trade” (based on comparative advantage) represented by the
Heckscher-Ohlin (H-O) model, and second, “intra-industry trade” represented by the New
Trade Theory. The H-O model relies on factor endowment differences to explain trade.
Recent years have witnessed the modification of the H-O by dropping some of its simplifying
assumptions and acknowledging differences in consumption, productivity, production
technology, multiple cones of trade, and factor price differences. What if factor endowments
of the trading countries are similar? The line of “intra-industry trade” assumes various forms
of imperfect competition with production differentiation, economies of scale, consumer
preferences, trade mark, and consequent specialization. There is little doubt that the two lines
of models (ie. inter-industry versus intra-industry trade models) are not rival but
complementary.
Taking the above introductory information into consideration, trade measures are
preferred to be divided into three categories in this paper, namely i) measure of
concentration/dispersion of trade flows, ii) trade measures of inter-industry trade, and iii)
trade measures of intra-industry trade.
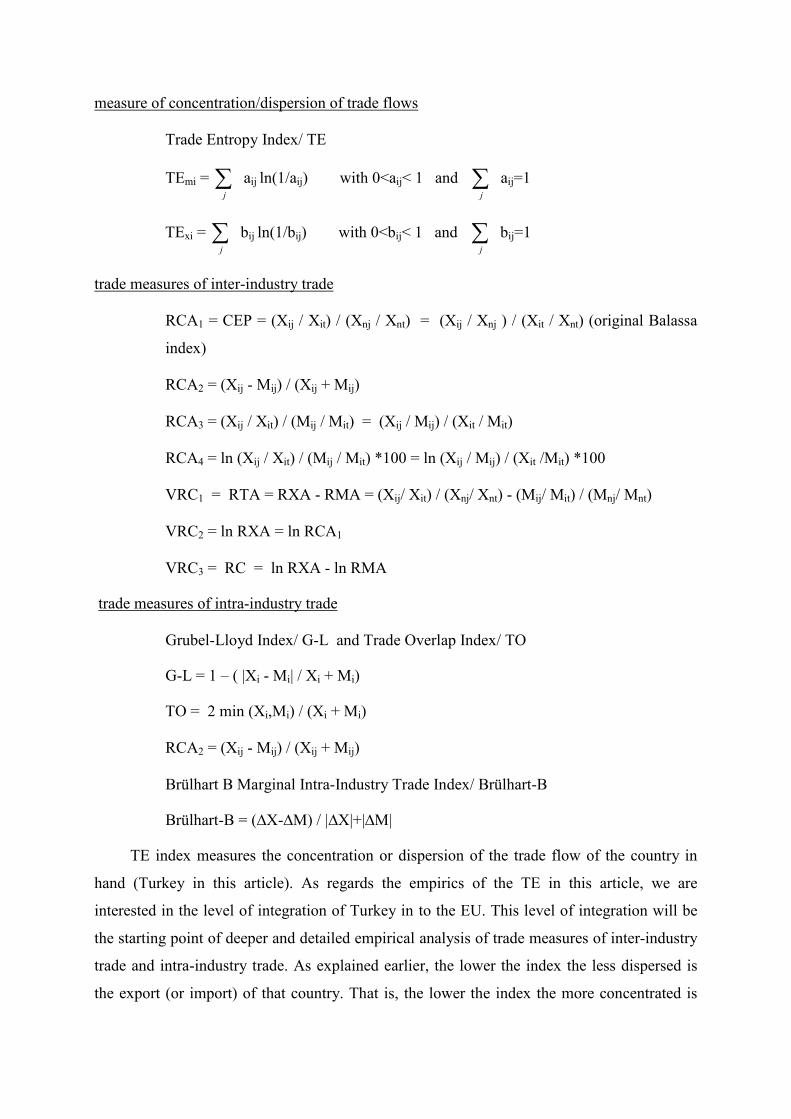
i) measure of concentration/dispersion of trade flows: Trade Entropy Index/ TE
Whether a country trading with others is considered to be deeply integrated with these
countries or not is an important matter. Thus TE index is employed to measure the
concentration or dispersion of the trade flow of the country in hand (Turkey in this article). As
regards the empirics of the TE in this article, we are interested in the level of integration of
Turkey in to the EU. This level of integration will be the starting point of deeper and detailed
empirical analysis of trade measures of inter-industry trade and intra-industry trade (Laaser
and Schrader 2002: 17).
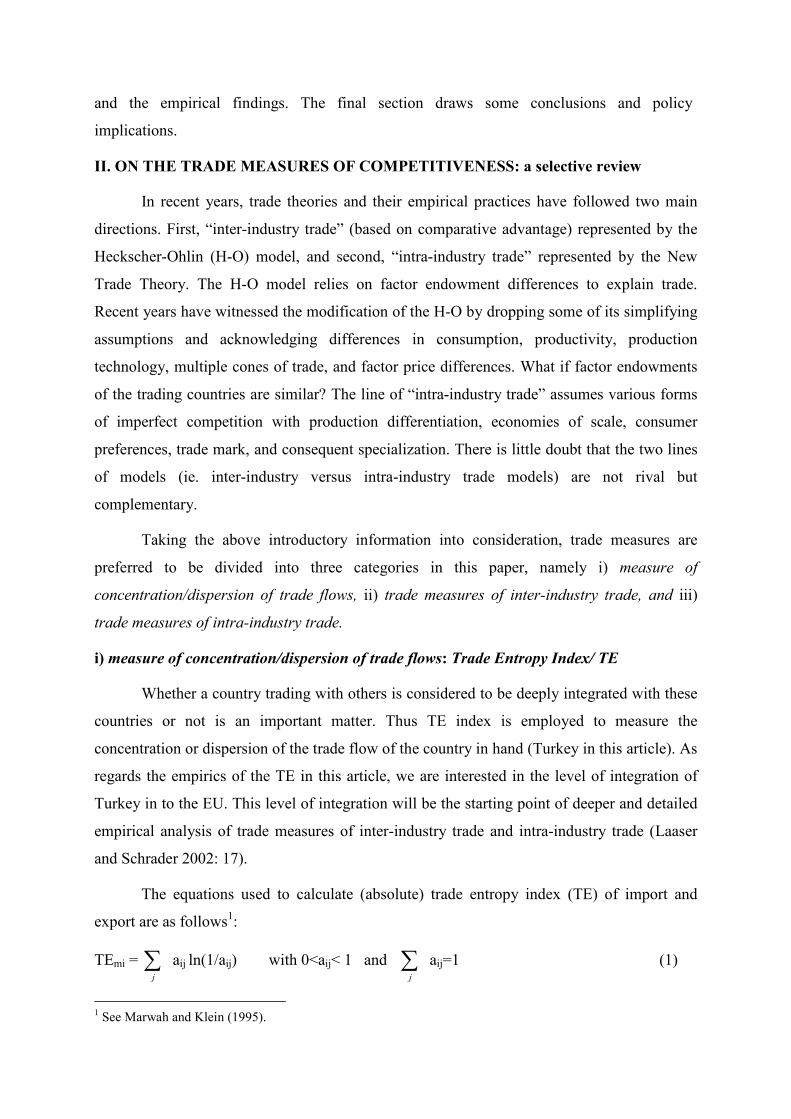
The equations used to calculate (absolute) trade entropy index (TE) of import and
export are as follows1:
TEmi = ∑j
aij ln(1/aij) with 0<aij< 1 and ∑j
aij=1 (1)
1 See Marwah and Klein (1995).
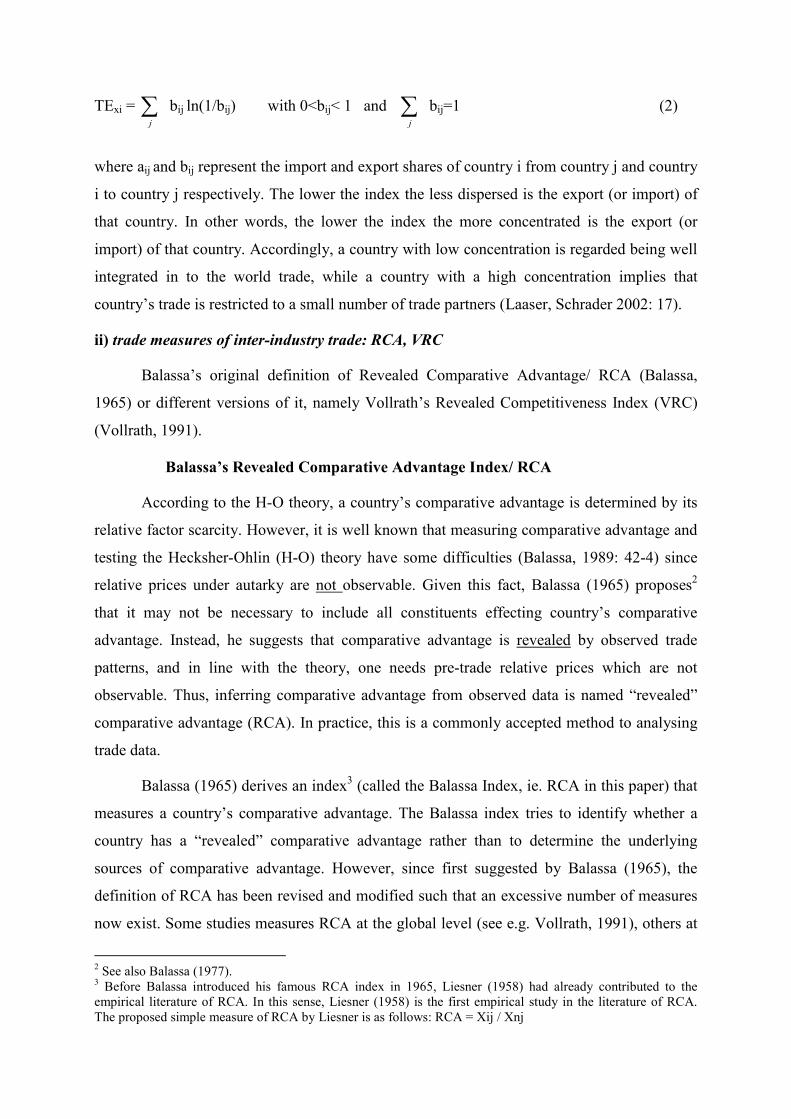
TExi = ∑j
bij ln(1/bij) with 0<bij< 1 and ∑j
bij=1 (2)
where aij and bij represent the import and export shares of country i from country j and country
i to country j respectively. The lower the index the less dispersed is the export (or import) of
that country. In other words, the lower the index the more concentrated is the export (or
import) of that country. Accordingly, a country with low concentration is regarded being well
integrated in to the world trade, while a country with a high concentration implies that
country’s trade is restricted to a small number of trade partners (Laaser, Schrader 2002: 17).
ii) trade measures of inter-industry trade: RCA, VRC
Balassa’s original definition of Revealed Comparative Advantage/ RCA (Balassa,
1965) or different versions of it, namely Vollrath’s Revealed Competitiveness Index (VRC)
(Vollrath, 1991).
• Balassa’s Revealed Comparative Advantage Index/ RCA
According to the H-O theory, a country’s comparative advantage is determined by its
relative factor scarcity. However, it is well known that measuring comparative advantage and
testing the Hecksher-Ohlin (H-O) theory have some difficulties (Balassa, 1989: 42-4) since
relative prices under autarky are not observable. Given this fact, Balassa (1965) proposes2
that it may not be necessary to include all constituents effecting country’s comparative
advantage. Instead, he suggests that comparative advantage is revealed by observed trade
patterns, and in line with the theory, one needs pre-trade relative prices which are not
observable. Thus, inferring comparative advantage from observed data is named “revealed”
comparative advantage (RCA). In practice, this is a commonly accepted method to analysing
trade data.
Balassa (1965) derives an index3 (called the Balassa Index, ie. RCA in this paper) that
measures a country’s comparative advantage. The Balassa index tries to identify whether a
country has a “revealed” comparative advantage rather than to determine the underlying
sources of comparative advantage. However, since first suggested by Balassa (1965), the
definition of RCA has been revised and modified such that an excessive number of measures
now exist. Some studies measures RCA at the global level (see e.g. Vollrath, 1991), others at
2 See also Balassa (1977). 3 Before Balassa introduced his famous RCA index in 1965, Liesner (1958) had already contributed to the empirical literature of RCA. In this sense, Liesner (1958) is the first empirical study in the literature of RCA. The proposed simple measure of RCA by Liesner is as follows: RCA = Xij / Xnj
a sub-global / regional level (see Balassa’s original index), and while some others evaluates
the measurement as bilateral trade between two countries or trading partners (see e.g. Dimelis
and Gatsios, 1995).
The original RCA index of Balassa is as follows4:
RCA1 = CEP = (Xij / Xit) / (Xnj / Xnt) = (Xij / Xnj ) / (Xit / Xnt) (3)
where X represents exports, i is a country, j is a commodity (or industry), t is a set of
commodities (or industries) and n is a set of countries. RCA1 measures a country’s exports of
a commodity (or industry) relative to its total exports and to the corresponding exports of a set
of countries, e.g. the EU. A comparative advantage is “revealed”, if RCA1 >1. If RCA1 is less
than unity, the country is said to have a comparative disadvantage in the commodity /
industry. It is argued that the RCA1 index is biased due to the omission of imports especially
when country-size is important (Greenaway and Milner, 1993).
An alternative RCA index is computed in order to make reference to the “own”
country trade performance only. This type of measurement of a country’s RCA recognizes the
possibility of simultaneous exports and imports within a particular commodity / industry.
RCA2 = (Xij - Mij) / (Xij + Mij) (4)
In the case of Equation 4, the index ratio ranges from -1 (Xij = 0 and revealed
comparative disadvantage) to +1 (Mij = 0 and revealed comparative advantage). However,
regarding RCA2, there exist ambiguities around zero values (Greenaway and Milner, 1993)5.
One can derive another version of RCA from Balassa (1965). The equation is as
follows:
RCA3 = (Xij / Xit) / (Mij / Mit) = (Xij / Mij) / (Xit / Mit) (4)
where X and M represents exports and imports respectively. i is a country, j is a commodity
(or industry), t is a set of commodities (or industries). A similar version of Equation 4 derived
from Balassa (1965) is the following:
RCA4 = ln (Xij / Xit) / (Mij / Mit) *100 = ln (Xij / Mij) / (Xit /Mit) *100 (5)
• Vollrath’s Revealed Competitiveness Index (VRC)
4 In the relevant literature some studies (eg Yılmaz and Ergun, 2003; Yılmaz, 2002; Erlat and Erlat, 2005; Akgüngör et.al., 2002) name the original Balassa RCA index, ie RCA1 here, as the Comparative Export Performance Index (CEP). These two indices are identical. Thus in this paper we employ RCA1 only. 5 This index shows the share of inter-industry trade within the total trade.
Vollrath (1991) offered mainly three alternative ways of measurement of a country’s
RCA. These alternative specifications of RCA are called the relative trade advantage (RTA),
the logarithm of the relative export advantage (ln RXA), and the revealed competitiveness
(RC). In this study, for the sake of being systematic, we call them as VRC1, VRC2, and VRC3
respectively. It is clear that the advantage of presenting latter two indices (i.e. VRC2 and
VRC3) is that they become symmetric through the origin. Positive values of Vollrath’s three
alternative measures of revealed comparative advantage reveal a comparative/competitive
advantage whereas negative values indicate comparative /competitive disadvantage.
However, a problem of implementing these or similar RCA indices is that real
(observed) trade patterns may be distorted by government interventions, thus causing
misrepresentation of underlying comparative advantage. It is thus a concern that import
restrictions, export subsidies and other protectionist policies of governments, to an extent,
may distort RCA indices. Fertö and Hubbard (2003), in this respect, uses nominal assistance
coefficients (NACs) estimated by the OECD by country and commodity to filter the effects of
possible distortions in measuring Hungarian Agri-food sector RCAs vis-à-vis the EU.
Greenaway and Milner (1993), on the other hand, suggests the employment of a price-based
measure of RCA called “implicit revealed comparative advantage” to get rid of the distortion
caused by the post-policy intervention.
Vollrath (1991) suggests that the RC index (RCA6 in the present paper) is preferable
since supply and demand balance embodied in the index. Evaluating the shortcomings of
Vollrath’s three indices, Vollrath acknowledges that the RXA (relative export advantage)
index which reduces the distortion effects is more commonly used in practice. It is important
to point out that Balassa and Vollrath indices are based on different concepts and thus are not
strictly comparable.
The relative trade advantage (RTA) (here RCA4) is calculated as the difference
between relative export advantage (RXA), which is the equivalent to the original Balassa
index (RCA1), and its counterpart, relative import advantage (RMA). It is important to note
that the main difference of Vollrath’s RXA from Balassa’s original RCA1 index is that it
prevents from double-counting. In the present paper, the indices used are hybrids, in that the
set of countries (n) is restricted to the EU whereas the set of commodities (t) refers to all
trade.
VRC1 = RTA = RXA - RMA
where RXA = RCA1 = CEP = (Xij/ Xit) / (Xnj/ Xnt) and
RMA = (Mij/ Mit) / (Mnj/ Mnt)
where M accounts for imports. In consequence;
VRC1 = RTA = RXA - RMA = (Xij/ Xit) / (Xnj/ Xnt) - (Mij/ Mit) / (Mnj/ Mnt) (6)
Vollrath’s second RCA measure is the logarithm of the relative export advantage (here
as VRC2):
VRC2 = ln RXA = ln RCA1= ln CEP (7)
The third measure of Vollrath is the revealed competitiveness (RC) (here as VRC3),
expressed as:
VRC3 = RC = ln RXA - ln RMA (8)
Given that there exists a range of RCA alternative indices suggested and employed in
the literature to measure comparative advantage, some inconsistent results may occur
obtained by the use of different RCA indices. Interpretation of the RCA indices in the ordinal
or cardinal senses is another field of dispute. Furthermore, the stability and the consistency of
alternative measures of RCA have been called into questioned (e.g. Balance et al., 1987;
Yeats, 1985; Hinloopen and Van Marrewijjk, 2001). It is therefore encouraged that the policy
makers need cautious interpretation of RCA indices by especially underlining probabilities of
revealing a comparative advantage or disadvantage.
iii) trade measures of intra-industry trade (Greenaway and Milner, 1986), ie. Trade Overlap
Index, TO (Finger, 1975; Finger and de Rosa, 1979) Grubel-Lloyd Index, GL (Grubel and
Lloyd, 1975) and Brülhart B Marginal Intra-Industry Trade Index, Brülhart-B (Brülhart,
1994).
Trade measures of intra-industry trade show, to what extent, intra-industry
specialization exists. In this paper, the trade measure named RCA2 is employed as an
indicator for competitiveness. When similar logic is applied, measurement of intra-industry
trade also shows the competitiveness. As the share of the intra-industry trade in the total trade
decreases, competitiveness at this industry increases. Various measures of intra-industry trade
have been offered in the literature. In this paper, we employ the most well-known and
employed measures.
• Grubel-Lloyd Index/ G-L and Trade Overlap Index/ TO
G-L = 1 – ( |xi - mi| / xi + mi) (10)
where xi and mi are exports and imports of industry i (Grubel and Lloyd, 1975). This
measure is equivalent to the trade overlap index (TOI) offered by Finger (1975):
TO = 2 min (xi,mi) / (xi + mi) (11)
Both GL and TO approach +1 as trade becomes balanced, and 0 as either exports or imports
dominate. That is, coefficients vary between 0 and +1. A higher coefficient implies that intra-
industry specialization exists6.
• Brülhart B Marginal Intra-Industry Trade Index/ Brülhart-B
Brülhart-B = (∆X-∆M) / |∆X|+|∆M| (13)
The Brülhart-B index takes values between -1 and +1. The index gives information on
two dimensions. First, information about the proportion of marginal intra-industry trade
(MIIT), and second, country-specific sectoral performance. As regard the first dimension, the
closer Brülhart-B is to 0, the higher is MIIT. If Brülhart-B is equal to 0, the marginal trade in
the particular industry is purely the intra-industry type, while at both -1 and +1 it shows
marginal trade to be purely the inter-industry type. Regarding the second dimension, the
definition of the sectoral performance is the change in exports and imports in relation to each
other. When Brülhart-B = -1, ∆M was ≥ 0 while ∆X was ∆≤0 over the examined period. The
opposite is true for Brülhart-B = 1. In other words, when Brülhart-B >0 then this implies that
∆X>∆M, and when Brülhart-B<0 then this reflects that ∆X<∆M (Brülhart, 1994; 606-607).
III. TRADE RELATIONS OF TURKEY WITH THE EUROPEAN UNION
As far as the EU is concerned, Turkey is the only country signed the Customs Union
(CU) aggreement with the EU (in 1996) before the membership. A unique country example of
signing the CU without any form of active participation in Brussels, ie without full
membership. This has led to a trade liberalisation and increased competitive pressure for both
sides. Turkey has started negotiations for full-membership with the EU in 2005 after the
acknowledgement of country’s fulfilment of the pre-conditions by the EU such as the well
known “political criteria” on the one hand, and “economic criteria” which includes the
6 Finger (1975) suggests that the measurements of intra-industry trade stems from misclassification. In a later work with DeRosa, Finger points out that this finding is a “trade overlap” but not intra-industry trade (Finger and DeRosa, 1979). However, in later works the term “trade overlap”an the intra-industry trade are used in the same meaning.
establishing of a well-functioning market economy, existence of free and functioning
competition (so called the Copenhagen “economic” criteria), on the other. The beginning of
negotiations has opened the door of a new era and paved the way for full-membership
Ten years of experience in the CU has made Turkey, no doubt, more trade liberalized
country on the one hand, and more capable of competing in the very competitive EU market.
Thus one can easily expect that Turkey is well trade-integrated with the EU as far as any new
member country signed in 2004 or 2007.7 The figures in Table 1 implies that early years of
the CU (ie 1996-1998) marked fairly imbalanced trade (due to remarkable increase in imports
but almost very slight increase in exports: that is a trade creation effect with one leg is
missing!) between Turkey and the EU. 2000-2001 are the years of the most severe economic
crisis in the country’s history. Turkey’s accession to the EU is anticipated by 2020 (see
EUECOPOL, 2006) In the meantime, relative competitiveness will play a crucial role in
shaping changes in trade flows and patterns between Turkey, members and third countries. It
is thus important to explore the trade patterns and trade specialization (Utkulu and Seymen,
2003; Utkulu et al. 2004).
At present, over 50 per cent of Turkey’s trade is with the EU. This tends to rise with
beginning of negotiations. The Current account deficit of the country reached to a peak level
of 8 % of its GDP in 2006 (34 billion US$) mainly not due to the EU countries but due to
third countries. The year 2006 also mark a peak level of the Foreign Direct Investment (FDI)
which amounted to 20 billion US$, the FDI to Turkey is expected to reach to about 34 billion
US$ by the end of 2007 for which the start of the negotiations played a role to a greater
extent.
Economic relations between two parties have been strong since the early 1950s, but
were intensified over recent decades. The long-standing preferences between Turkey and the
EU have resulted in the EU being not only the most important market for Turkey (51.6 per
cent of Turkey’s exports in 2006) but also one of the main sources for imported goods (46.1
per cent of Turkey’s imports in 2006) (See Table 1).
The CU between Turkey and the EU went far beyond a basic custom union with free
international trade and common external tariffs, and has given a new impetus to the
liberalization process in Turkey. Apart from the liberalisation of tariffs and adoption of the
EU’s common external tariff for industrial products and the industrial components of
7 To have more conclusive opinion, see our empirical findings of the Trade Entropy Index / TEI
processed agricultural products by Turkey, the agreement also embraces a number of
integration elements which includes the adoption of the Community’s commercial policy
towards third countries including textile quotas, the adoption of the free trade agreements with
all the EU’s preferential trade partners; co-operation on the harmonisation of agricultural
policy, mutual minimisation of restriction on trade in services, harmonisation of Turkey’s
legislation to that of the EU in the area of competition policy, intellectual and industrial
property rights, public procurement and technical barriers to trade (WTO, 1999; Harrison et.
al., 1996). The scope of the CU excludes Turkey from some of the crucial aspects of the
common market: the common agricultural policy, including the free circulation of agricultural
products; the free movement of labour and capital; and move towards a single currency.
Unlike countries in the European Economic Area, Turkey is also a subject to anti-dumping
measures by the EU. The financial support originally envisaged from the EU to Turkey has
not yet been made available.
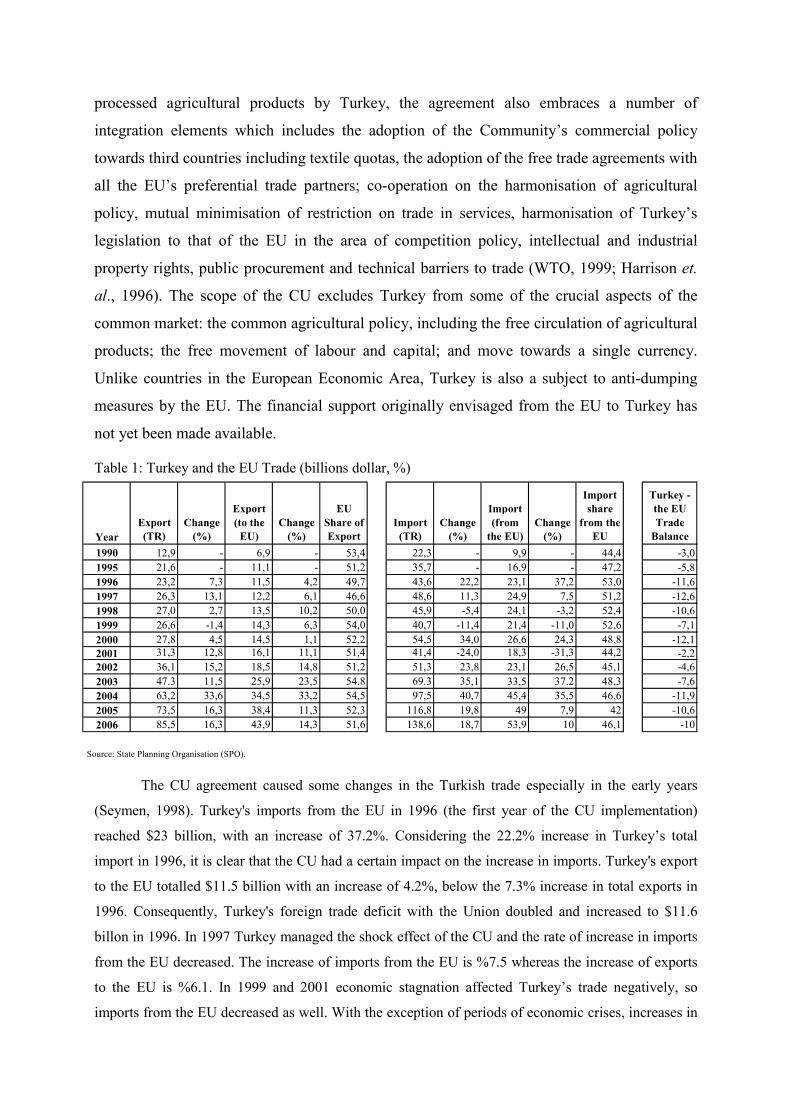
Table 1: Turkey and the EU Trade (billions dollar, %)
The CU agreement caused some changes in the Turkish trade especially in the early years
(Seymen, 1998). Turkey's imports from the EU in 1996 (the first year of the CU implementation)
reached $23 billion, with an increase of 37.2%. Considering the 22.2% increase in Turkey’s total
import in 1996, it is clear that the CU had a certain impact on the increase in imports. Turkey's export
to the EU totalled $11.5 billion with an increase of 4.2%, below the 7.3% increase in total exports in
1996. Consequently, Turkey's foreign trade deficit with the Union doubled and increased to $11.6
billon in 1996. In 1997 Turkey managed the shock effect of the CU and the rate of increase in imports
from the EU decreased. The increase of imports from the EU is %7.5 whereas the increase of exports
to the EU is %6.1. In 1999 and 2001 economic stagnation affected Turkey’s trade negatively, so
imports from the EU decreased as well. With the exception of periods of economic crises, increases in
YearExport (TR)
Change (%)
Export (to the
EU)Change
(%)
EU Share of Export
Import (TR)
Change (%)
Import (from
the EU)Change
(%)
Import share
from the EU
Turkey - the EU Trade
Balance1990 12,9 - 6,9 - 53,4 22,3 - 9,9 - 44,4 -3,01995 21,6 - 11,1 - 51,2 35,7 - 16,9 - 47,2 -5,81996 23,2 7,3 11,5 4,2 49,7 43,6 22,2 23,1 37,2 53,0 -11,61997 26,3 13,1 12,2 6,1 46,6 48,6 11,3 24,9 7,5 51,2 -12,61998 27,0 2,7 13,5 10,2 50,0 45,9 -5,4 24,1 -3,2 52,4 -10,61999 26,6 -1,4 14,3 6,3 54,0 40,7 -11,4 21,4 -11,0 52,6 -7,12000 27,8 4,5 14,5 1,1 52,2 54,5 34,0 26,6 24,3 48,8 -12,12001 31,3 12,8 16,1 11,1 51,4 41,4 -24,0 18,3 -31,3 44,2 -2,22002 36,1 15,2 18,5 14,8 51,2 51,3 23,8 23,1 26,5 45,1 -4,62003 47.3 11,5 25,9 23,5 54.8 69.3 35,1 33,5 37.2 48,3 -7,62004 63,2 33,6 34,5 33,2 54,5 97,5 40,7 45,4 35,5 46,6 -11,92005 73,5 16,3 38,4 11,3 52,3 116,8 19,8 49 7,9 42 -10,62006 85,5 16,3 43,9 14,3 51,6 138,6 18,7 53,9 10 46,1 -10
Source: State Planning Organisation (SPO).
imports were greater than the exports increases. So resulting trade deficits was high. In 2006 Turkey’s
exports to the EU is $43.9 billions. Turkey’s import from the EU is $53.9 billions. Turkey’s trade
deficit with the Union is $10 billions in 2006. Figures in Table 1 suggest that the EU share in the
Turkish exports and imports have always been around 50 per cent. This shows that Turkey and the EU
have been traditional and stable trade partners over time. This fact has not changed even in the years
of economic crises of 1999, 2001 and after.
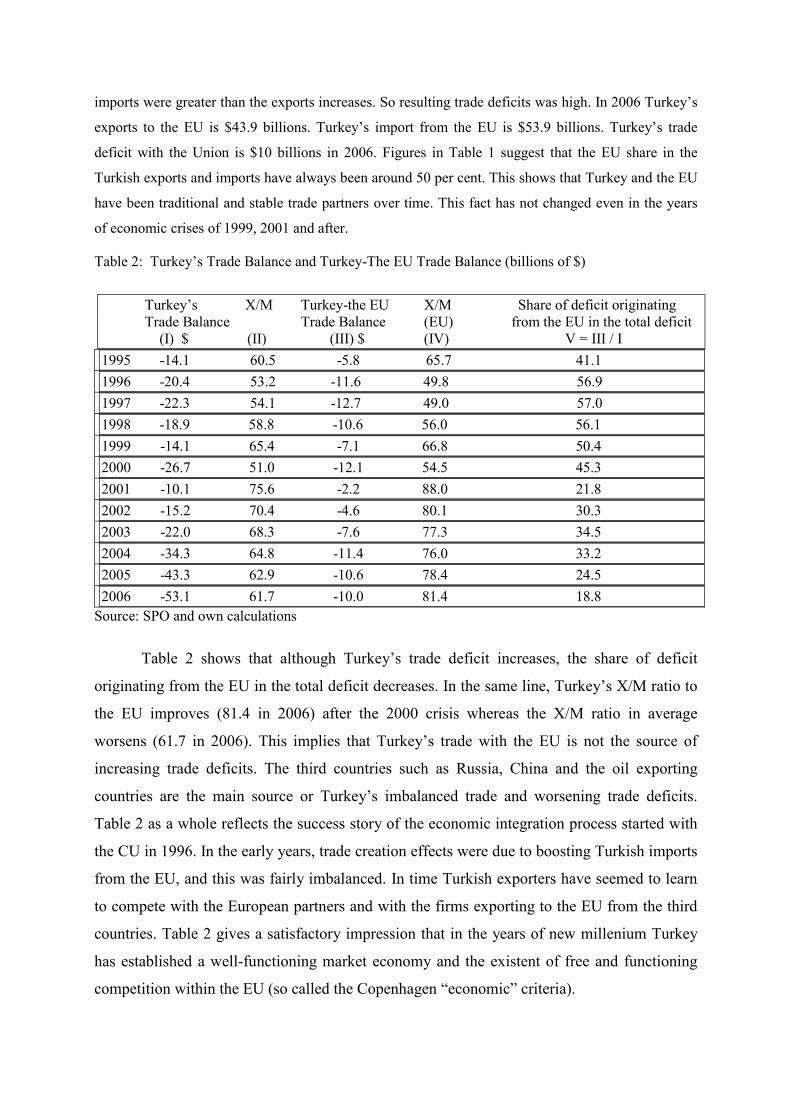
Table 2: Turkey’s Trade Balance and Turkey-The EU Trade Balance (billions of $)
Turkey’s X/M Turkey-the EU X/M Share of deficit originating Trade Balance Trade Balance (EU) from the EU in the total deficit
(I) $ (II) (III) $ (IV) V = III / I 1995 -14.1 60.5 -5.8 65.7 41.1 1996 -20.4 53.2 -11.6 49.8 56.9 1997 -22.3 54.1 -12.7 49.0 57.0 1998 -18.9 58.8 -10.6 56.0 56.1 1999 -14.1 65.4 -7.1 66.8 50.4 2000 -26.7 51.0 -12.1 54.5 45.3 2001 -10.1 75.6 -2.2 88.0 21.8 2002 -15.2 70.4 -4.6 80.1 30.3 2003 -22.0 68.3 -7.6 77.3 34.5 2004 -34.3 64.8 -11.4 76.0 33.2 2005 -43.3 62.9 -10.6 78.4 24.5 2006 -53.1 61.7 -10.0 81.4 18.8
Source: SPO and own calculations
Table 2 shows that although Turkey’s trade deficit increases, the share of deficit
originating from the EU in the total deficit decreases. In the same line, Turkey’s X/M ratio to
the EU improves (81.4 in 2006) after the 2000 crisis whereas the X/M ratio in average
worsens (61.7 in 2006). This implies that Turkey’s trade with the EU is not the source of
increasing trade deficits. The third countries such as Russia, China and the oil exporting
countries are the main source or Turkey’s imbalanced trade and worsening trade deficits.
Table 2 as a whole reflects the success story of the economic integration process started with
the CU in 1996. In the early years, trade creation effects were due to boosting Turkish imports
from the EU, and this was fairly imbalanced. In time Turkish exporters have seemed to learn
to compete with the European partners and with the firms exporting to the EU from the third
countries. Table 2 gives a satisfactory impression that in the years of new millenium Turkey
has established a well-functioning market economy and the existent of free and functioning
competition within the EU (so called the Copenhagen “economic” criteria).
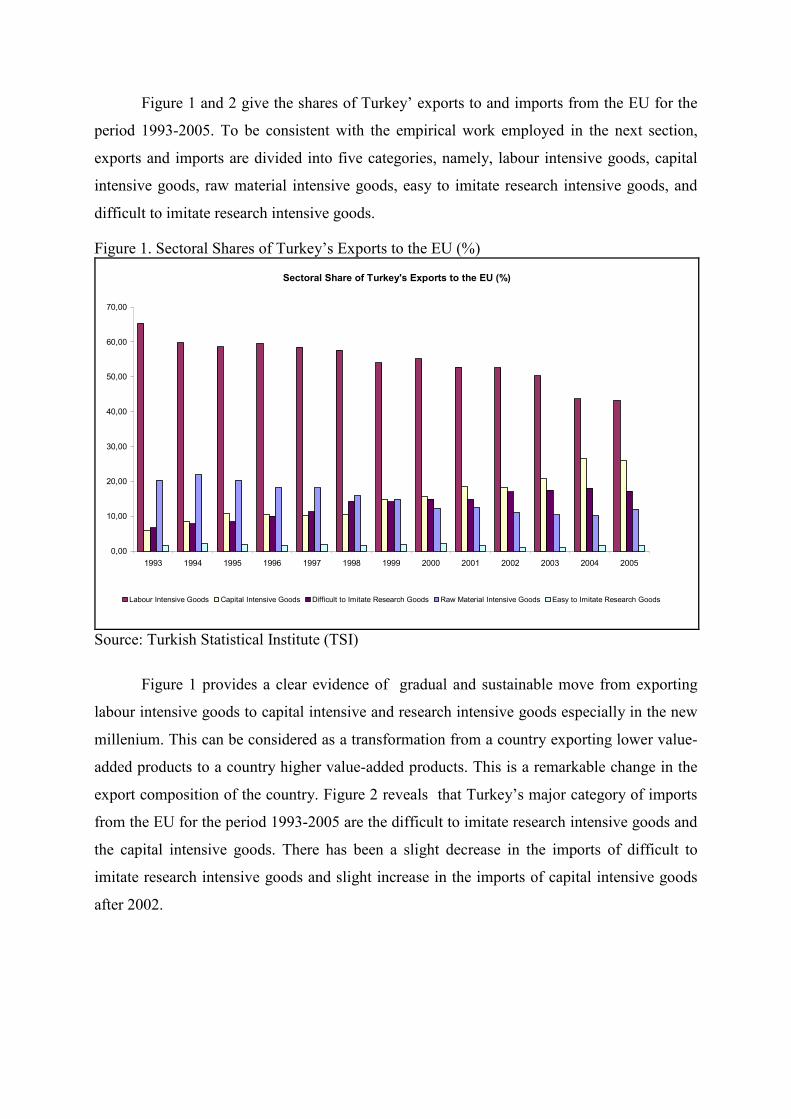
Figure 1 and 2 give the shares of Turkey’ exports to and imports from the EU for the
period 1993-2005. To be consistent with the empirical work employed in the next section,
exports and imports are divided into five categories, namely, labour intensive goods, capital
intensive goods, raw material intensive goods, easy to imitate research intensive goods, and
difficult to imitate research intensive goods.
Figure 1. Sectoral Shares of Turkey’s Exports to the EU (%)
Sectoral Share of Turkey's Exports to the EU (%)
0,00
10,00
20,00
30,00
40,00
50,00
60,00
70,00
1993 1994 1995 1996 1997 1998 1999 2000 2001 2002 2003 2004 2005
Labour Intensive Goods Capital Intensive Goods Difficult to Imitate Research Goods Raw Material Intensive Goods Easy to Imitate Research Goods
Source: Turkish Statistical Institute (TSI)
Figure 1 provides a clear evidence of gradual and sustainable move from exporting
labour intensive goods to capital intensive and research intensive goods especially in the new
millenium. This can be considered as a transformation from a country exporting lower value-
added products to a country higher value-added products. This is a remarkable change in the
export composition of the country. Figure 2 reveals that Turkey’s major category of imports
from the EU for the period 1993-2005 are the difficult to imitate research intensive goods and
the capital intensive goods. There has been a slight decrease in the imports of difficult to
imitate research intensive goods and slight increase in the imports of capital intensive goods
after 2002.
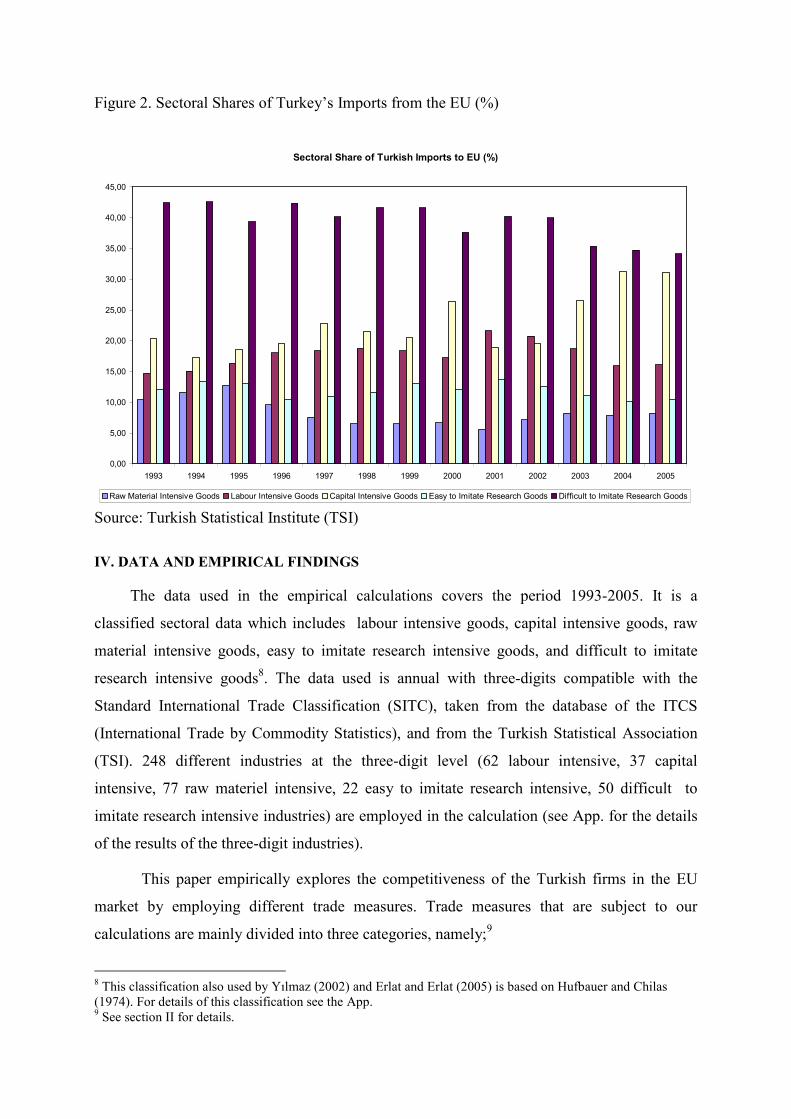
Figure 2. Sectoral Shares of Turkey’s Imports from the EU (%)
Sectoral Share of Turkish Imports to EU (%)
0,00
5,00
10,00
15,00
20,00
25,00
30,00
35,00
40,00
45,00
1993 1994 1995 1996 1997 1998 1999 2000 2001 2002 2003 2004 2005
Raw Material Intensive Goods Labour Intensive Goods Capital Intensive Goods Easy to Imitate Research Goods Difficult to Imitate Research Goods Source: Turkish Statistical Institute (TSI)
IV. DATA AND EMPIRICAL FINDINGS
The data used in the empirical calculations covers the period 1993-2005. It is a
classified sectoral data which includes labour intensive goods, capital intensive goods, raw
material intensive goods, easy to imitate research intensive goods, and difficult to imitate
research intensive goods8. The data used is annual with three-digits compatible with the
Standard International Trade Classification (SITC), taken from the database of the ITCS
(International Trade by Commodity Statistics), and from the Turkish Statistical Association
(TSI). 248 different industries at the three-digit level (62 labour intensive, 37 capital
intensive, 77 raw materiel intensive, 22 easy to imitate research intensive, 50 difficult to
imitate research intensive industries) are employed in the calculation (see App. for the details
of the results of the three-digit industries).
This paper empirically explores the competitiveness of the Turkish firms in the EU
market by employing different trade measures. Trade measures that are subject to our
calculations are mainly divided into three categories, namely;9
8 This classification also used by Yılmaz (2002) and Erlat and Erlat (2005) is based on Hufbauer and Chilas (1974). For details of this classification see the App. 9 See section II for details.
measure of concentration/dispersion of trade flows
• Trade Entropy Index/ TE
TEmi = ∑j
aij ln(1/aij) with 0<aij< 1 and ∑j
aij=1
TExi = ∑j
bij ln(1/bij) with 0<bij< 1 and ∑j
bij=1
trade measures of inter-industry trade
• RCA1 = CEP = (Xij / Xit) / (Xnj / Xnt) = (Xij / Xnj ) / (Xit / Xnt) (original Balassa
index)
• RCA2 = (Xij - Mij) / (Xij + Mij)
• RCA3 = (Xij / Xit) / (Mij / Mit) = (Xij / Mij) / (Xit / Mit)
• RCA4 = ln (Xij / Xit) / (Mij / Mit) *100 = ln (Xij / Mij) / (Xit /Mit) *100
• VRC1 = RTA = RXA - RMA = (Xij/ Xit) / (Xnj/ Xnt) - (Mij/ Mit) / (Mnj/ Mnt)
• VRC2 = ln RXA = ln RCA1
• VRC3 = RC = ln RXA - ln RMA
trade measures of intra-industry trade
• Grubel-Lloyd Index/ G-L and Trade Overlap Index/ TO
G-L = 1 – ( |Xi - Mi| / Xi + Mi)
TO = 2 min (Xi,Mi) / (Xi + Mi)
• RCA2 = (Xij - Mij) / (Xij + Mij)
• Brülhart B Marginal Intra-Industry Trade Index/ Brülhart-B
Brülhart-B = (∆X-∆M) / |∆X|+|∆M|
TE index measures the concentration or dispersion of the trade flow of the country in
hand (Turkey in this article). As regards the empirics of the TE in this article, we are
interested in the level of integration of Turkey in to the EU. This level of integration will be
the starting point of deeper and detailed empirical analysis of trade measures of inter-industry
trade and intra-industry trade. As explained earlier, the lower the index the less dispersed is
the export (or import) of that country. That is, the lower the index the more concentrated is
the export (or import) of that country. Accordingly, a country with low concentration is
regarded being well integrated in to the world trade, while a country with a high concentration
implies that country’s trade is restricted to a small number of trade partners (Laaser, Schrader
2002: 17).
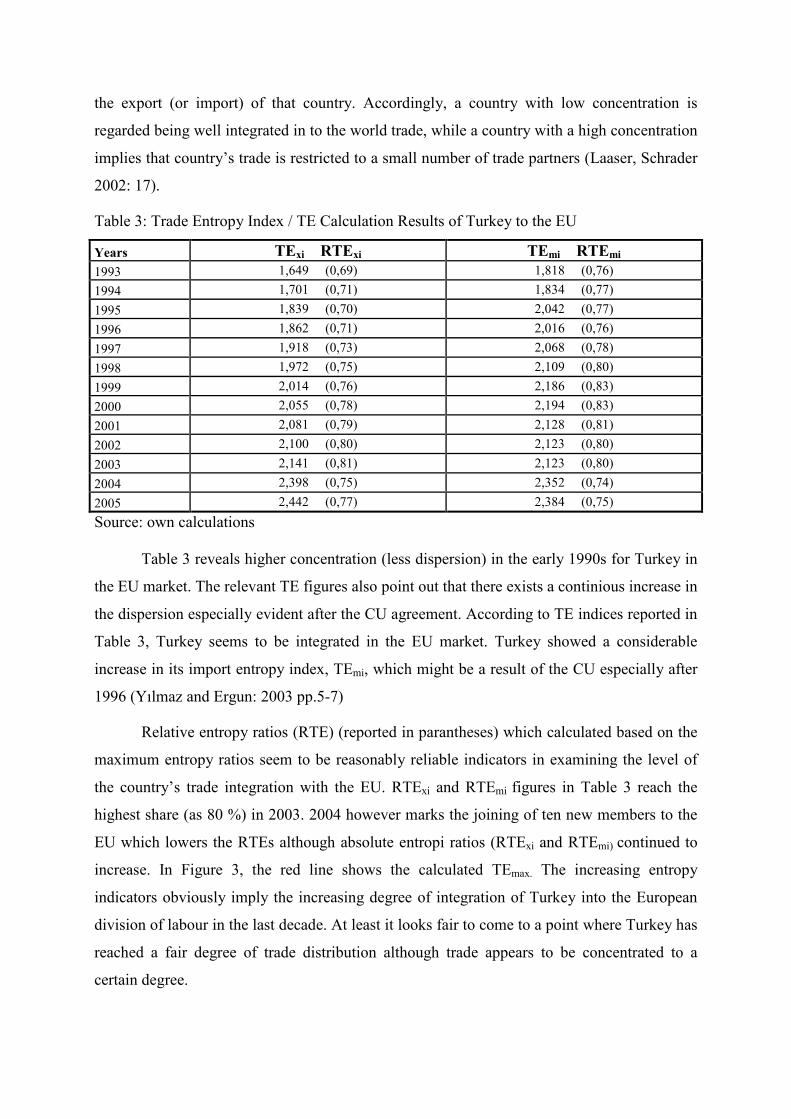
Table 3: Trade Entropy Index / TE Calculation Results of Turkey to the EU
Years TExi RTExi TEmi RTEmi 1993 1,649 (0,69) 1,818 (0,76) 1994 1,701 (0,71) 1,834 (0,77) 1995 1,839 (0,70) 2,042 (0,77) 1996 1,862 (0,71) 2,016 (0,76) 1997 1,918 (0,73) 2,068 (0,78) 1998 1,972 (0,75) 2,109 (0,80) 1999 2,014 (0,76) 2,186 (0,83) 2000 2,055 (0,78) 2,194 (0,83) 2001 2,081 (0,79) 2,128 (0,81) 2002 2,100 (0,80) 2,123 (0,80) 2003 2,141 (0,81) 2,123 (0,80) 2004 2,398 (0,75) 2,352 (0,74) 2005 2,442 (0,77) 2,384 (0,75) Source: own calculations
Table 3 reveals higher concentration (less dispersion) in the early 1990s for Turkey in
the EU market. The relevant TE figures also point out that there exists a continious increase in
the dispersion especially evident after the CU agreement. According to TE indices reported in
Table 3, Turkey seems to be integrated in the EU market. Turkey showed a considerable
increase in its import entropy index, TEmi, which might be a result of the CU especially after
1996 (Yılmaz and Ergun: 2003 pp.5-7)
Relative entropy ratios (RTE) (reported in parantheses) which calculated based on the
maximum entropy ratios seem to be reasonably reliable indicators in examining the level of
the country’s trade integration with the EU. RTExi and RTEmi figures in Table 3 reach the
highest share (as 80 %) in 2003. 2004 however marks the joining of ten new members to the
EU which lowers the RTEs although absolute entropi ratios (RTExi and RTEmi) continued to
increase. In Figure 3, the red line shows the calculated TEmax. The increasing entropy
indicators obviously imply the increasing degree of integration of Turkey into the European
division of labour in the last decade. At least it looks fair to come to a point where Turkey has
reached a fair degree of trade distribution although trade appears to be concentrated to a
certain degree.
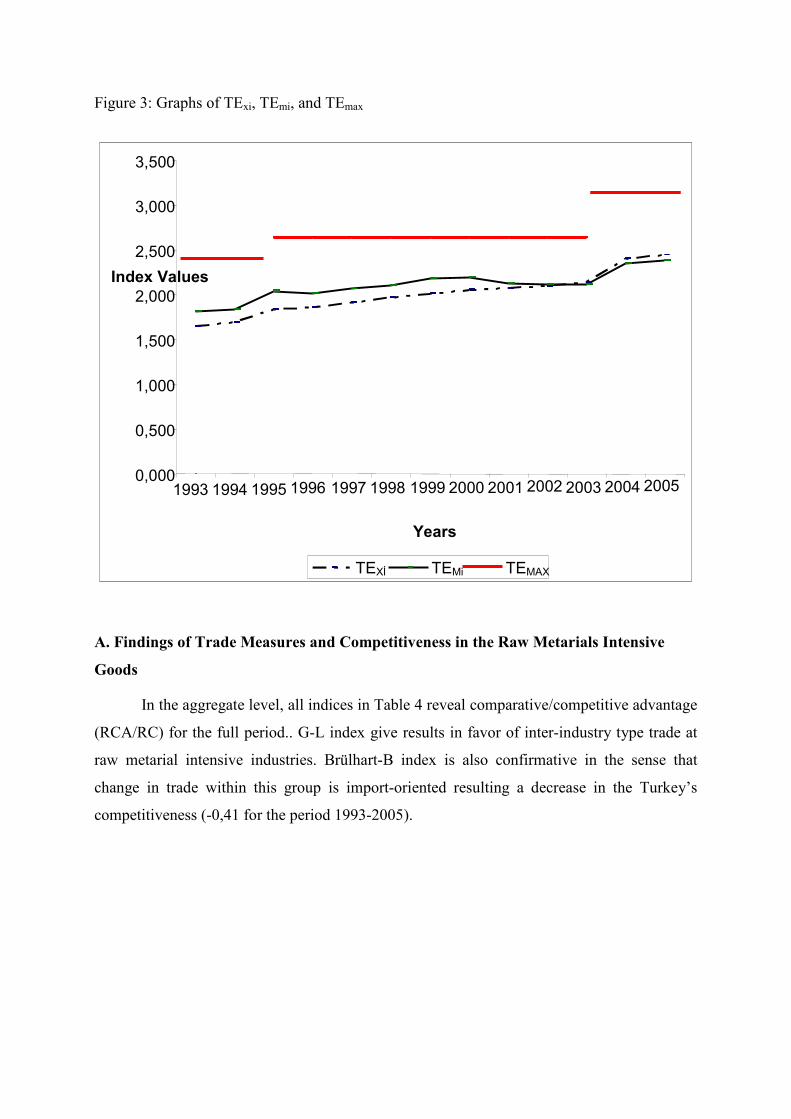
Figure 3: Graphs of TExi, TEmi, and TEmax
A. Findings of Trade Measures and Competitiveness in the Raw Metarials Intensive
Goods
In the aggregate level, all indices in Table 4 reveal comparative/competitive advantage
(RCA/RC) for the full period.. G-L index give results in favor of inter-industry type trade at
raw metarial intensive industries. Brülhart-B index is also confirmative in the sense that
change in trade within this group is import-oriented resulting a decrease in the Turkey’s
competitiveness (-0,41 for the period 1993-2005).
0,000
0,500
1,000
1,500
2,000
2,500
3,000
3,500
1993 1994 1995 1996 1997 1998 1999 2000 2001 2002 2003 2004 2005
Years
Index Values
TEXİ TEMi TEMAX
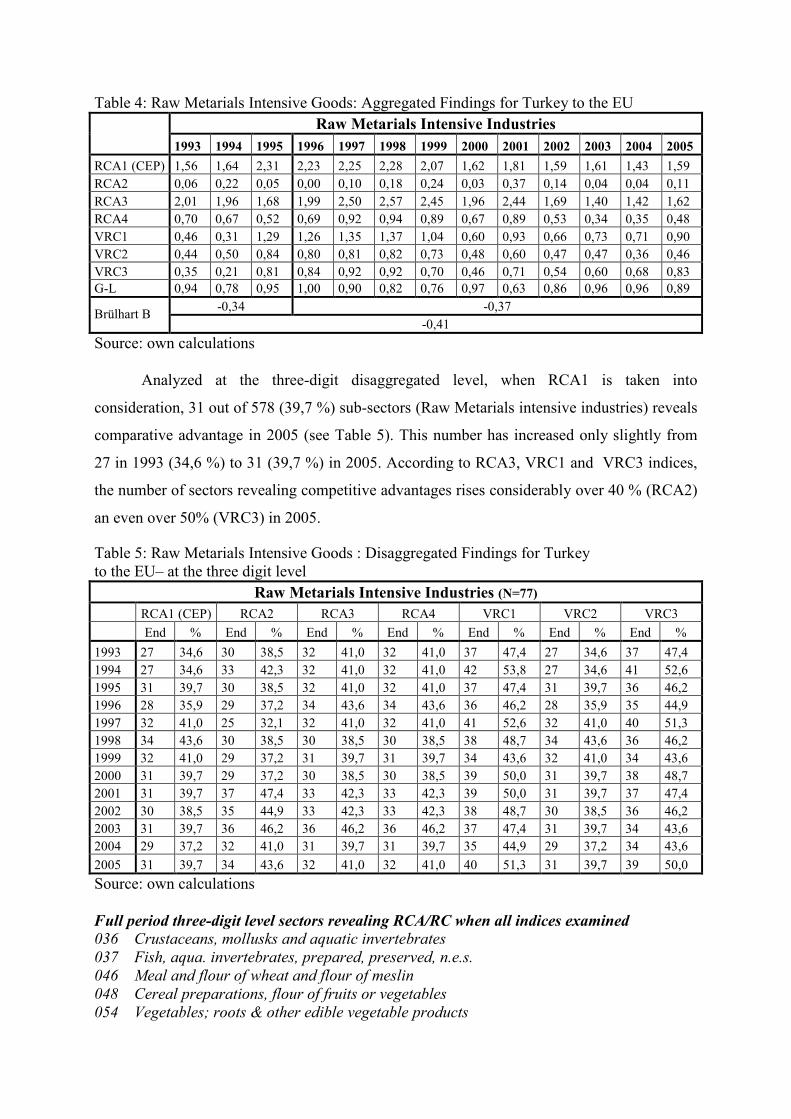
Table 4: Raw Metarials Intensive Goods: Aggregated Findings for Turkey to the EU Raw Metarials Intensive Industries
1993 1994 1995 1996 1997 1998 1999 2000 2001 2002 2003 2004 2005 RCA1 (CEP) 1,56 1,64 2,31 2,23 2,25 2,28 2,07 1,62 1,81 1,59 1,61 1,43 1,59 RCA2 0,06 0,22 0,05 0,00 0,10 0,18 0,24 0,03 0,37 0,14 0,04 0,04 0,11 RCA3 2,01 1,96 1,68 1,99 2,50 2,57 2,45 1,96 2,44 1,69 1,40 1,42 1,62 RCA4 0,70 0,67 0,52 0,69 0,92 0,94 0,89 0,67 0,89 0,53 0,34 0,35 0,48 VRC1 0,46 0,31 1,29 1,26 1,35 1,37 1,04 0,60 0,93 0,66 0,73 0,71 0,90 VRC2 0,44 0,50 0,84 0,80 0,81 0,82 0,73 0,48 0,60 0,47 0,47 0,36 0,46 VRC3 0,35 0,21 0,81 0,84 0,92 0,92 0,70 0,46 0,71 0,54 0,60 0,68 0,83 G-L 0,94 0,78 0,95 1,00 0,90 0,82 0,76 0,97 0,63 0,86 0,96 0,96 0,89
-0,34 -0,37 Brülhart B -0,41
Source: own calculations
Analyzed at the three-digit disaggregated level, when RCA1 is taken into
consideration, 31 out of 578 (39,7 %) sub-sectors (Raw Metarials intensive industries) reveals
comparative advantage in 2005 (see Table 5). This number has increased only slightly from
27 in 1993 (34,6 %) to 31 (39,7 %) in 2005. According to RCA3, VRC1 and VRC3 indices,
the number of sectors revealing competitive advantages rises considerably over 40 % (RCA2)
an even over 50% (VRC3) in 2005.
Table 5: Raw Metarials Intensive Goods : Disaggregated Findings for Turkey to the EU– at the three digit level
Raw Metarials Intensive Industries (N=77) RCA1 (CEP) RCA2 RCA3 RCA4 VRC1 VRC2 VRC3 End % End % End % End % End % End % End %
1993 27 34,6 30 38,5 32 41,0 32 41,0 37 47,4 27 34,6 37 47,4 1994 27 34,6 33 42,3 32 41,0 32 41,0 42 53,8 27 34,6 41 52,6 1995 31 39,7 30 38,5 32 41,0 32 41,0 37 47,4 31 39,7 36 46,2 1996 28 35,9 29 37,2 34 43,6 34 43,6 36 46,2 28 35,9 35 44,9 1997 32 41,0 25 32,1 32 41,0 32 41,0 41 52,6 32 41,0 40 51,3 1998 34 43,6 30 38,5 30 38,5 30 38,5 38 48,7 34 43,6 36 46,2 1999 32 41,0 29 37,2 31 39,7 31 39,7 34 43,6 32 41,0 34 43,6 2000 31 39,7 29 37,2 30 38,5 30 38,5 39 50,0 31 39,7 38 48,7 2001 31 39,7 37 47,4 33 42,3 33 42,3 39 50,0 31 39,7 37 47,4 2002 30 38,5 35 44,9 33 42,3 33 42,3 38 48,7 30 38,5 36 46,2 2003 31 39,7 36 46,2 36 46,2 36 46,2 37 47,4 31 39,7 34 43,6 2004 29 37,2 32 41,0 31 39,7 31 39,7 35 44,9 29 37,2 34 43,6 2005 31 39,7 34 43,6 32 41,0 32 41,0 40 51,3 31 39,7 39 50,0 Source: own calculations Full period three-digit level sectors revealing RCA/RC when all indices examined 036 Crustaceans, mollusks and aquatic invertebrates 037 Fish, aqua. invertebrates, prepared, preserved, n.e.s. 046 Meal and flour of wheat and flour of meslin 048 Cereal preparations, flour of fruits or vegetables 054 Vegetables; roots & other edible vegetable products
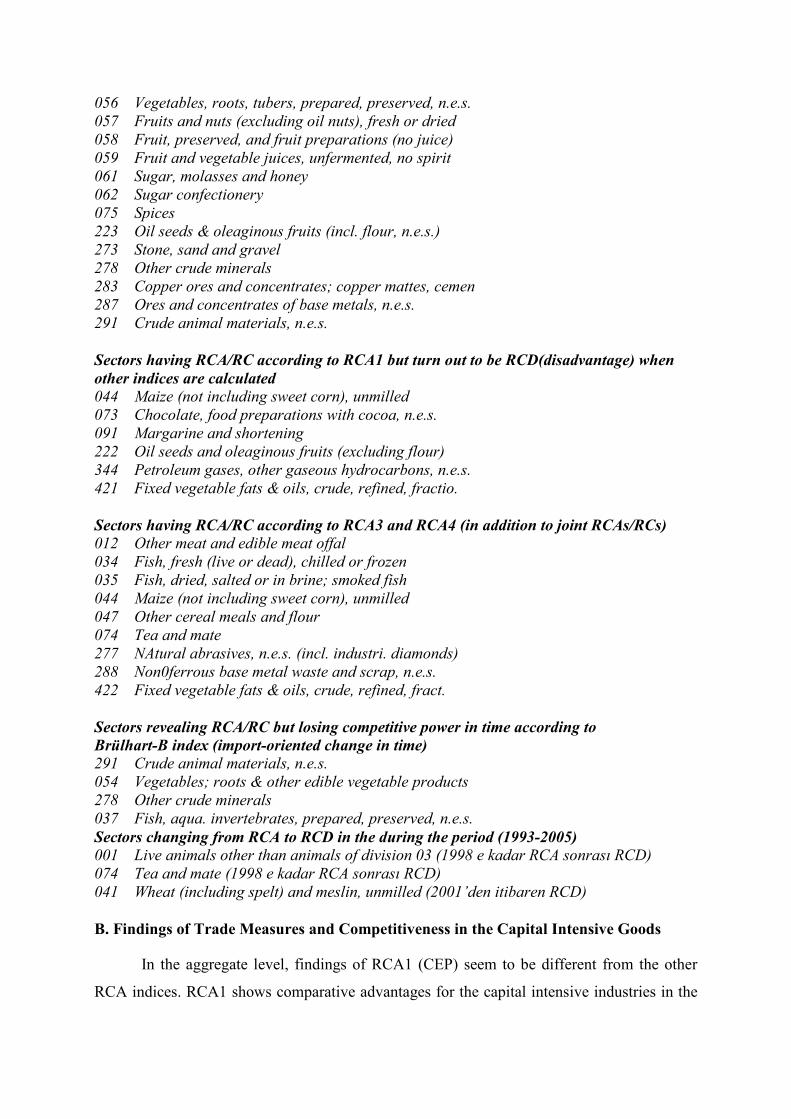
056 Vegetables, roots, tubers, prepared, preserved, n.e.s. 057 Fruits and nuts (excluding oil nuts), fresh or dried 058 Fruit, preserved, and fruit preparations (no juice) 059 Fruit and vegetable juices, unfermented, no spirit 061 Sugar, molasses and honey 062 Sugar confectionery 075 Spices 223 Oil seeds & oleaginous fruits (incl. flour, n.e.s.) 273 Stone, sand and gravel 278 Other crude minerals 283 Copper ores and concentrates; copper mattes, cemen 287 Ores and concentrates of base metals, n.e.s. 291 Crude animal materials, n.e.s. Sectors having RCA/RC according to RCA1 but turn out to be RCD(disadvantage) when other indices are calculated 044 Maize (not including sweet corn), unmilled 073 Chocolate, food preparations with cocoa, n.e.s. 091 Margarine and shortening 222 Oil seeds and oleaginous fruits (excluding flour) 344 Petroleum gases, other gaseous hydrocarbons, n.e.s. 421 Fixed vegetable fats & oils, crude, refined, fractio. Sectors having RCA/RC according to RCA3 and RCA4 (in addition to joint RCAs/RCs) 012 Other meat and edible meat offal 034 Fish, fresh (live or dead), chilled or frozen 035 Fish, dried, salted or in brine; smoked fish 044 Maize (not including sweet corn), unmilled 047 Other cereal meals and flour 074 Tea and mate 277 NAtural abrasives, n.e.s. (incl. industri. diamonds) 288 Non0ferrous base metal waste and scrap, n.e.s. 422 Fixed vegetable fats & oils, crude, refined, fract. Sectors revealing RCA/RC but losing competitive power in time according to Brülhart-B index (import-oriented change in time) 291 Crude animal materials, n.e.s. 054 Vegetables; roots & other edible vegetable products 278 Other crude minerals 037 Fish, aqua. invertebrates, prepared, preserved, n.e.s. Sectors changing from RCA to RCD in the during the period (1993-2005) 001 Live animals other than animals of division 03 (1998 e kadar RCA sonrası RCD) 074 Tea and mate (1998 e kadar RCA sonrası RCD) 041 Wheat (including spelt) and meslin, unmilled (2001’den itibaren RCD) B. Findings of Trade Measures and Competitiveness in the Capital Intensive Goods
In the aggregate level, findings of RCA1 (CEP) seem to be different from the other
RCA indices. RCA1 shows comparative advantages for the capital intensive industries in the
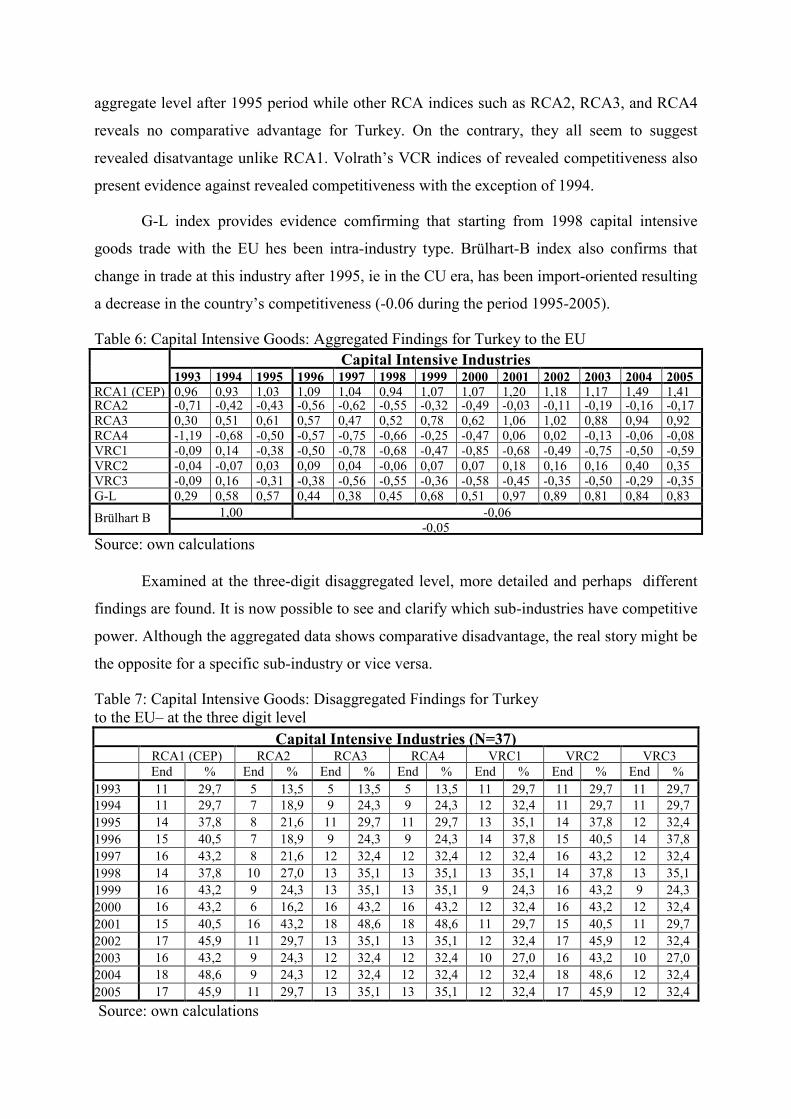
aggregate level after 1995 period while other RCA indices such as RCA2, RCA3, and RCA4
reveals no comparative advantage for Turkey. On the contrary, they all seem to suggest
revealed disatvantage unlike RCA1. Volrath’s VCR indices of revealed competitiveness also
present evidence against revealed competitiveness with the exception of 1994.
G-L index provides evidence comfirming that starting from 1998 capital intensive
goods trade with the EU hes been intra-industry type. Brülhart-B index also confirms that
change in trade at this industry after 1995, ie in the CU era, has been import-oriented resulting
a decrease in the country’s competitiveness (-0.06 during the period 1995-2005).
Table 6: Capital Intensive Goods: Aggregated Findings for Turkey to the EU Capital Intensive Industries
1993 1994 1995 1996 1997 1998 1999 2000 2001 2002 2003 2004 2005RCA1 (CEP) 0,96 0,93 1,03 1,09 1,04 0,94 1,07 1,07 1,20 1,18 1,17 1,49 1,41RCA2 -0,71 -0,42 -0,43 -0,56 -0,62 -0,55 -0,32 -0,49 -0,03 -0,11 -0,19 -0,16 -0,17RCA3 0,30 0,51 0,61 0,57 0,47 0,52 0,78 0,62 1,06 1,02 0,88 0,94 0,92RCA4 -1,19 -0,68 -0,50 -0,57 -0,75 -0,66 -0,25 -0,47 0,06 0,02 -0,13 -0,06 -0,08VRC1 -0,09 0,14 -0,38 -0,50 -0,78 -0,68 -0,47 -0,85 -0,68 -0,49 -0,75 -0,50 -0,59VRC2 -0,04 -0,07 0,03 0,09 0,04 -0,06 0,07 0,07 0,18 0,16 0,16 0,40 0,35VRC3 -0,09 0,16 -0,31 -0,38 -0,56 -0,55 -0,36 -0,58 -0,45 -0,35 -0,50 -0,29 -0,35G-L 0,29 0,58 0,57 0,44 0,38 0,45 0,68 0,51 0,97 0,89 0,81 0,84 0,83
1,00 -0,06Brülhart B -0,05
Source: own calculations
Examined at the three-digit disaggregated level, more detailed and perhaps different
findings are found. It is now possible to see and clarify which sub-industries have competitive
power. Although the aggregated data shows comparative disadvantage, the real story might be
the opposite for a specific sub-industry or vice versa.
Table 7: Capital Intensive Goods: Disaggregated Findings for Turkey to the EU– at the three digit level
Capital Intensive Industries (N=37)RCA1 (CEP) RCA2 RCA3 RCA4 VRC1 VRC2 VRC3End % End % End % End % End % End % End %
1993 11 29,7 5 13,5 5 13,5 5 13,5 11 29,7 11 29,7 11 29,71994 11 29,7 7 18,9 9 24,3 9 24,3 12 32,4 11 29,7 11 29,7 1995 14 37,8 8 21,6 11 29,7 11 29,7 13 35,1 14 37,8 12 32,4 1996 15 40,5 7 18,9 9 24,3 9 24,3 14 37,8 15 40,5 14 37,8 1997 16 43,2 8 21,6 12 32,4 12 32,4 12 32,4 16 43,2 12 32,4 1998 14 37,8 10 27,0 13 35,1 13 35,1 13 35,1 14 37,8 13 35,1 1999 16 43,2 9 24,3 13 35,1 13 35,1 9 24,3 16 43,2 9 24,3 2000 16 43,2 6 16,2 16 43,2 16 43,2 12 32,4 16 43,2 12 32,4 2001 15 40,5 16 43,2 18 48,6 18 48,6 11 29,7 15 40,5 11 29,7 2002 17 45,9 11 29,7 13 35,1 13 35,1 12 32,4 17 45,9 12 32,4 2003 16 43,2 9 24,3 12 32,4 12 32,4 10 27,0 16 43,2 10 27,0 2004 18 48,6 9 24,3 12 32,4 12 32,4 12 32,4 18 48,6 12 32,4 2005 17 45,9 11 29,7 13 35,1 13 35,1 12 32,4 17 45,9 12 32,4 Source: own calculations
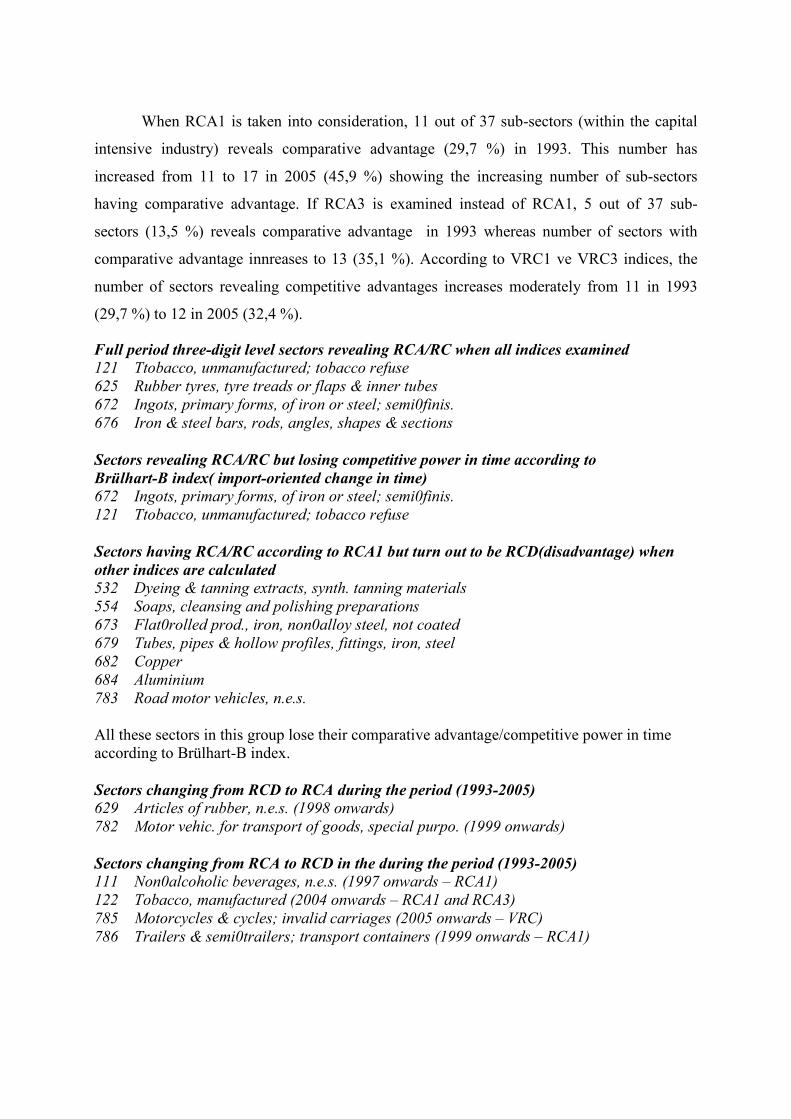
When RCA1 is taken into consideration, 11 out of 37 sub-sectors (within the capital
intensive industry) reveals comparative advantage (29,7 %) in 1993. This number has
increased from 11 to 17 in 2005 (45,9 %) showing the increasing number of sub-sectors
having comparative advantage. If RCA3 is examined instead of RCA1, 5 out of 37 sub-
sectors (13,5 %) reveals comparative advantage in 1993 whereas number of sectors with
comparative advantage innreases to 13 (35,1 %). According to VRC1 ve VRC3 indices, the
number of sectors revealing competitive advantages increases moderately from 11 in 1993
(29,7 %) to 12 in 2005 (32,4 %).
Full period three-digit level sectors revealing RCA/RC when all indices examined 121 Ttobacco, unmanufactured; tobacco refuse 625 Rubber tyres, tyre treads or flaps & inner tubes 672 Ingots, primary forms, of iron or steel; semi0finis. 676 Iron & steel bars, rods, angles, shapes & sections Sectors revealing RCA/RC but losing competitive power in time according to Brülhart-B index( import-oriented change in time) 672 Ingots, primary forms, of iron or steel; semi0finis. 121 Ttobacco, unmanufactured; tobacco refuse Sectors having RCA/RC according to RCA1 but turn out to be RCD(disadvantage) when other indices are calculated 532 Dyeing & tanning extracts, synth. tanning materials 554 Soaps, cleansing and polishing preparations 673 Flat0rolled prod., iron, non0alloy steel, not coated 679 Tubes, pipes & hollow profiles, fittings, iron, steel 682 Copper 684 Aluminium 783 Road motor vehicles, n.e.s. All these sectors in this group lose their comparative advantage/competitive power in time according to Brülhart-B index. Sectors changing from RCD to RCA during the period (1993-2005) 629 Articles of rubber, n.e.s. (1998 onwards) 782 Motor vehic. for transport of goods, special purpo. (1999 onwards) Sectors changing from RCA to RCD in the during the period (1993-2005) 111 Non0alcoholic beverages, n.e.s. (1997 onwards – RCA1) 122 Tobacco, manufactured (2004 onwards – RCA1 and RCA3) 785 Motorcycles & cycles; invalid carriages (2005 onwards – VRC) 786 Trailers & semi0trailers; transport containers (1999 onwards – RCA1)
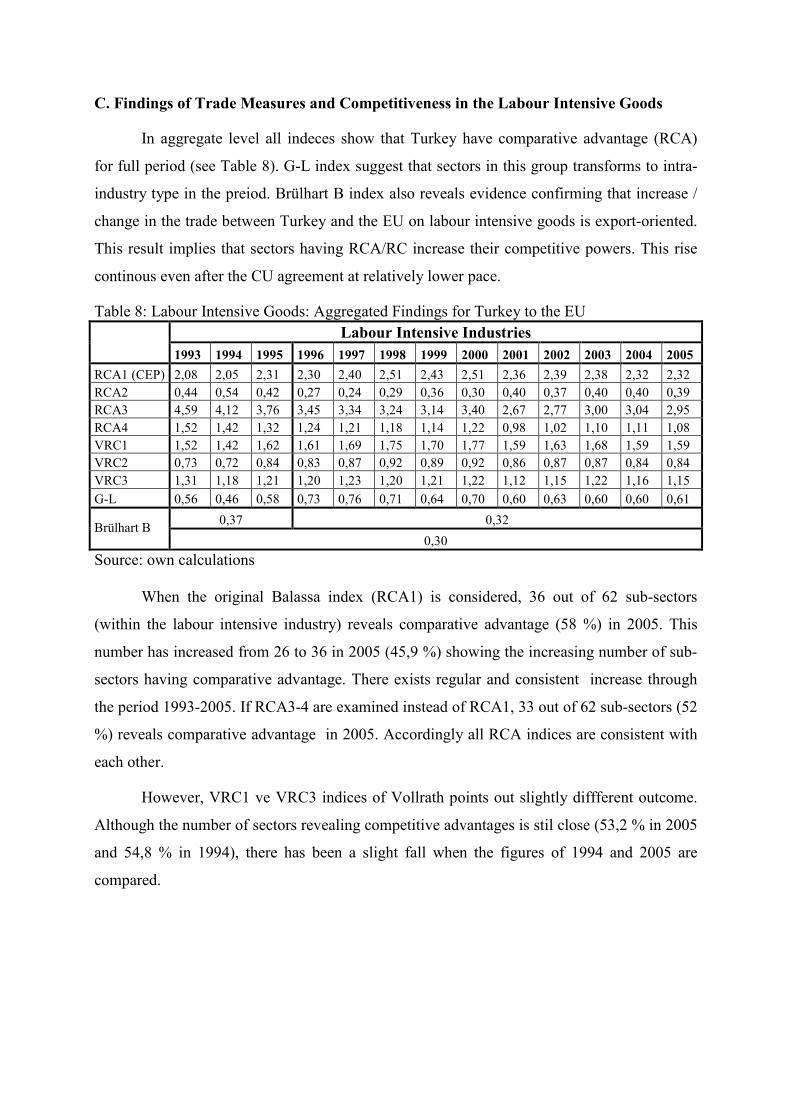
C. Findings of Trade Measures and Competitiveness in the Labour Intensive Goods
In aggregate level all indeces show that Turkey have comparative advantage (RCA)
for full period (see Table 8). G-L index suggest that sectors in this group transforms to intra-
industry type in the preiod. Brülhart B index also reveals evidence confirming that increase /
change in the trade between Turkey and the EU on labour intensive goods is export-oriented.
This result implies that sectors having RCA/RC increase their competitive powers. This rise
continous even after the CU agreement at relatively lower pace.
Table 8: Labour Intensive Goods: Aggregated Findings for Turkey to the EU Labour Intensive Industries
1993 1994 1995 1996 1997 1998 1999 2000 2001 2002 2003 2004 2005 RCA1 (CEP) 2,08 2,05 2,31 2,30 2,40 2,51 2,43 2,51 2,36 2,39 2,38 2,32 2,32 RCA2 0,44 0,54 0,42 0,27 0,24 0,29 0,36 0,30 0,40 0,37 0,40 0,40 0,39 RCA3 4,59 4,12 3,76 3,45 3,34 3,24 3,14 3,40 2,67 2,77 3,00 3,04 2,95 RCA4 1,52 1,42 1,32 1,24 1,21 1,18 1,14 1,22 0,98 1,02 1,10 1,11 1,08 VRC1 1,52 1,42 1,62 1,61 1,69 1,75 1,70 1,77 1,59 1,63 1,68 1,59 1,59 VRC2 0,73 0,72 0,84 0,83 0,87 0,92 0,89 0,92 0,86 0,87 0,87 0,84 0,84 VRC3 1,31 1,18 1,21 1,20 1,23 1,20 1,21 1,22 1,12 1,15 1,22 1,16 1,15 G-L 0,56 0,46 0,58 0,73 0,76 0,71 0,64 0,70 0,60 0,63 0,60 0,60 0,61
0,37 0,32 Brülhart B 0,30
Source: own calculations
When the original Balassa index (RCA1) is considered, 36 out of 62 sub-sectors
(within the labour intensive industry) reveals comparative advantage (58 %) in 2005. This
number has increased from 26 to 36 in 2005 (45,9 %) showing the increasing number of sub-
sectors having comparative advantage. There exists regular and consistent increase through
the period 1993-2005. If RCA3-4 are examined instead of RCA1, 33 out of 62 sub-sectors (52
%) reveals comparative advantage in 2005. Accordingly all RCA indices are consistent with
each other.
However, VRC1 ve VRC3 indices of Vollrath points out slightly diffferent outcome.
Although the number of sectors revealing competitive advantages is stil close (53,2 % in 2005
and 54,8 % in 1994), there has been a slight fall when the figures of 1994 and 2005 are
compared.
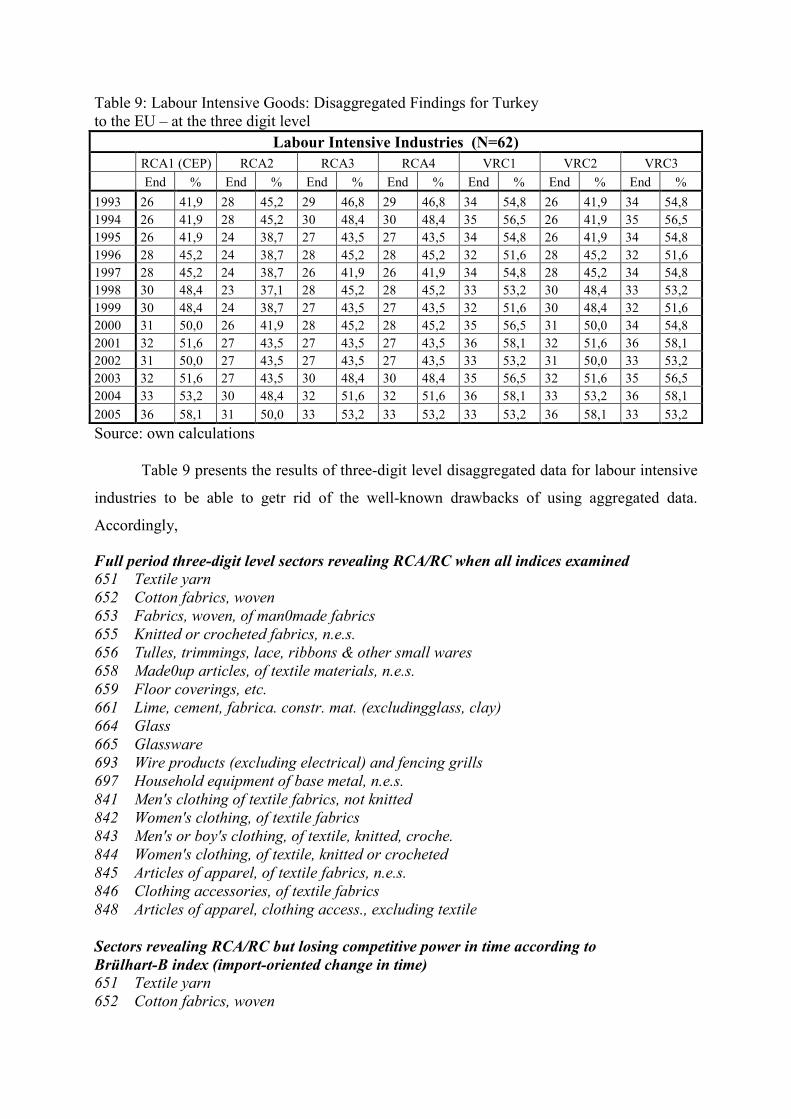
Table 9: Labour Intensive Goods: Disaggregated Findings for Turkey to the EU – at the three digit level
Labour Intensive Industries (N=62) RCA1 (CEP) RCA2 RCA3 RCA4 VRC1 VRC2 VRC3 End % End % End % End % End % End % End %
1993 26 41,9 28 45,2 29 46,8 29 46,8 34 54,8 26 41,9 34 54,8 1994 26 41,9 28 45,2 30 48,4 30 48,4 35 56,5 26 41,9 35 56,5 1995 26 41,9 24 38,7 27 43,5 27 43,5 34 54,8 26 41,9 34 54,8 1996 28 45,2 24 38,7 28 45,2 28 45,2 32 51,6 28 45,2 32 51,6 1997 28 45,2 24 38,7 26 41,9 26 41,9 34 54,8 28 45,2 34 54,8 1998 30 48,4 23 37,1 28 45,2 28 45,2 33 53,2 30 48,4 33 53,2 1999 30 48,4 24 38,7 27 43,5 27 43,5 32 51,6 30 48,4 32 51,6 2000 31 50,0 26 41,9 28 45,2 28 45,2 35 56,5 31 50,0 34 54,8 2001 32 51,6 27 43,5 27 43,5 27 43,5 36 58,1 32 51,6 36 58,1 2002 31 50,0 27 43,5 27 43,5 27 43,5 33 53,2 31 50,0 33 53,2 2003 32 51,6 27 43,5 30 48,4 30 48,4 35 56,5 32 51,6 35 56,5 2004 33 53,2 30 48,4 32 51,6 32 51,6 36 58,1 33 53,2 36 58,1 2005 36 58,1 31 50,0 33 53,2 33 53,2 33 53,2 36 58,1 33 53,2 Source: own calculations
Table 9 presents the results of three-digit level disaggregated data for labour intensive
industries to be able to getr rid of the well-known drawbacks of using aggregated data.
Accordingly,
Full period three-digit level sectors revealing RCA/RC when all indices examined 651 Textile yarn 652 Cotton fabrics, woven 653 Fabrics, woven, of man0made fabrics 655 Knitted or crocheted fabrics, n.e.s. 656 Tulles, trimmings, lace, ribbons & other small wares 658 Made0up articles, of textile materials, n.e.s. 659 Floor coverings, etc. 661 Lime, cement, fabrica. constr. mat. (excludingglass, clay) 664 Glass 665 Glassware 693 Wire products (excluding electrical) and fencing grills 697 Household equipment of base metal, n.e.s. 841 Men's clothing of textile fabrics, not knitted 842 Women's clothing, of textile fabrics 843 Men's or boy's clothing, of textile, knitted, croche. 844 Women's clothing, of textile, knitted or crocheted 845 Articles of apparel, of textile fabrics, n.e.s. 846 Clothing accessories, of textile fabrics 848 Articles of apparel, clothing access., excluding textile Sectors revealing RCA/RC but losing competitive power in time according to Brülhart-B index (import-oriented change in time) 651 Textile yarn 652 Cotton fabrics, woven
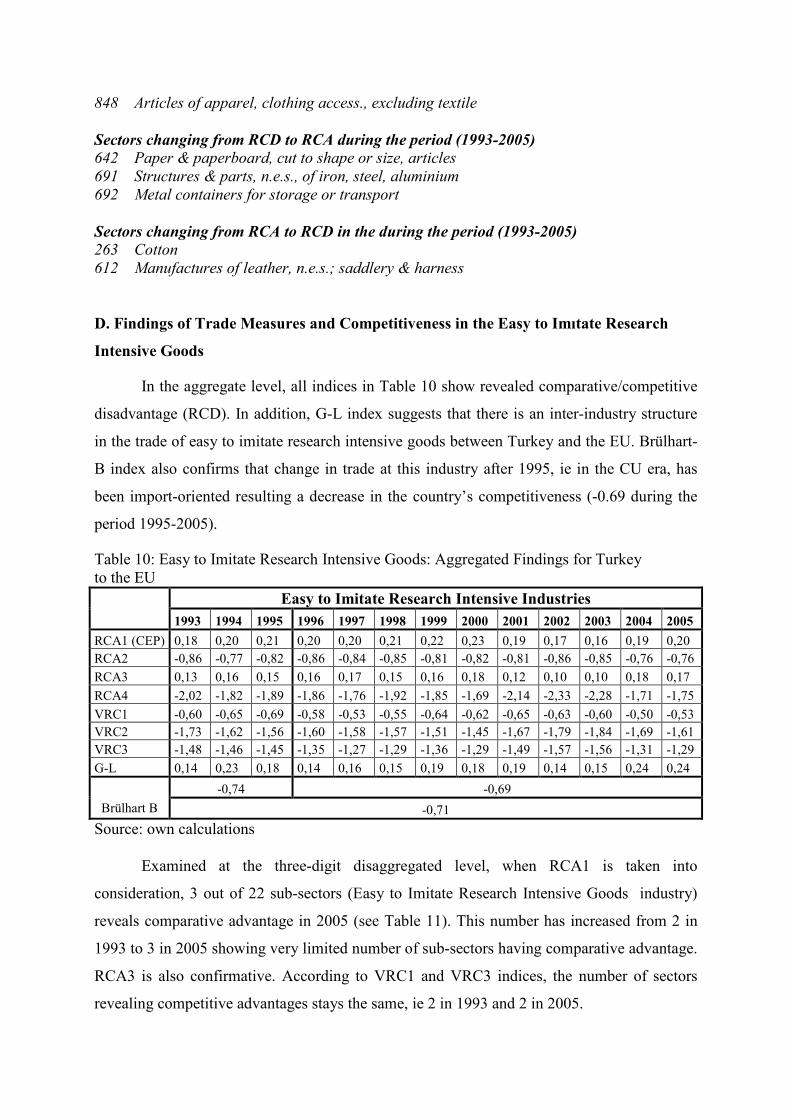
848 Articles of apparel, clothing access., excluding textile Sectors changing from RCD to RCA during the period (1993-2005) 642 Paper & paperboard, cut to shape or size, articles 691 Structures & parts, n.e.s., of iron, steel, aluminium 692 Metal containers for storage or transport Sectors changing from RCA to RCD in the during the period (1993-2005) 263 Cotton 612 Manufactures of leather, n.e.s.; saddlery & harness
D. Findings of Trade Measures and Competitiveness in the Easy to Imıtate Research
Intensive Goods
In the aggregate level, all indices in Table 10 show revealed comparative/competitive
disadvantage (RCD). In addition, G-L index suggests that there is an inter-industry structure
in the trade of easy to imitate research intensive goods between Turkey and the EU. Brülhart-
B index also confirms that change in trade at this industry after 1995, ie in the CU era, has
been import-oriented resulting a decrease in the country’s competitiveness (-0.69 during the
period 1995-2005).
Table 10: Easy to Imitate Research Intensive Goods: Aggregated Findings for Turkey to the EU
Easy to Imitate Research Intensive Industries 1993 1994 1995 1996 1997 1998 1999 2000 2001 2002 2003 2004 2005
RCA1 (CEP) 0,18 0,20 0,21 0,20 0,20 0,21 0,22 0,23 0,19 0,17 0,16 0,19 0,20 RCA2 -0,86 -0,77 -0,82 -0,86 -0,84 -0,85 -0,81 -0,82 -0,81 -0,86 -0,85 -0,76 -0,76 RCA3 0,13 0,16 0,15 0,16 0,17 0,15 0,16 0,18 0,12 0,10 0,10 0,18 0,17 RCA4 -2,02 -1,82 -1,89 -1,86 -1,76 -1,92 -1,85 -1,69 -2,14 -2,33 -2,28 -1,71 -1,75 VRC1 -0,60 -0,65 -0,69 -0,58 -0,53 -0,55 -0,64 -0,62 -0,65 -0,63 -0,60 -0,50 -0,53 VRC2 -1,73 -1,62 -1,56 -1,60 -1,58 -1,57 -1,51 -1,45 -1,67 -1,79 -1,84 -1,69 -1,61 VRC3 -1,48 -1,46 -1,45 -1,35 -1,27 -1,29 -1,36 -1,29 -1,49 -1,57 -1,56 -1,31 -1,29 G-L 0,14 0,23 0,18 0,14 0,16 0,15 0,19 0,18 0,19 0,14 0,15 0,24 0,24
-0,74 -0,69 Brülhart B -0,71
Source: own calculations
Examined at the three-digit disaggregated level, when RCA1 is taken into
consideration, 3 out of 22 sub-sectors (Easy to Imitate Research Intensive Goods industry)
reveals comparative advantage in 2005 (see Table 11). This number has increased from 2 in
1993 to 3 in 2005 showing very limited number of sub-sectors having comparative advantage.
RCA3 is also confirmative. According to VRC1 and VRC3 indices, the number of sectors
revealing competitive advantages stays the same, ie 2 in 1993 and 2 in 2005.
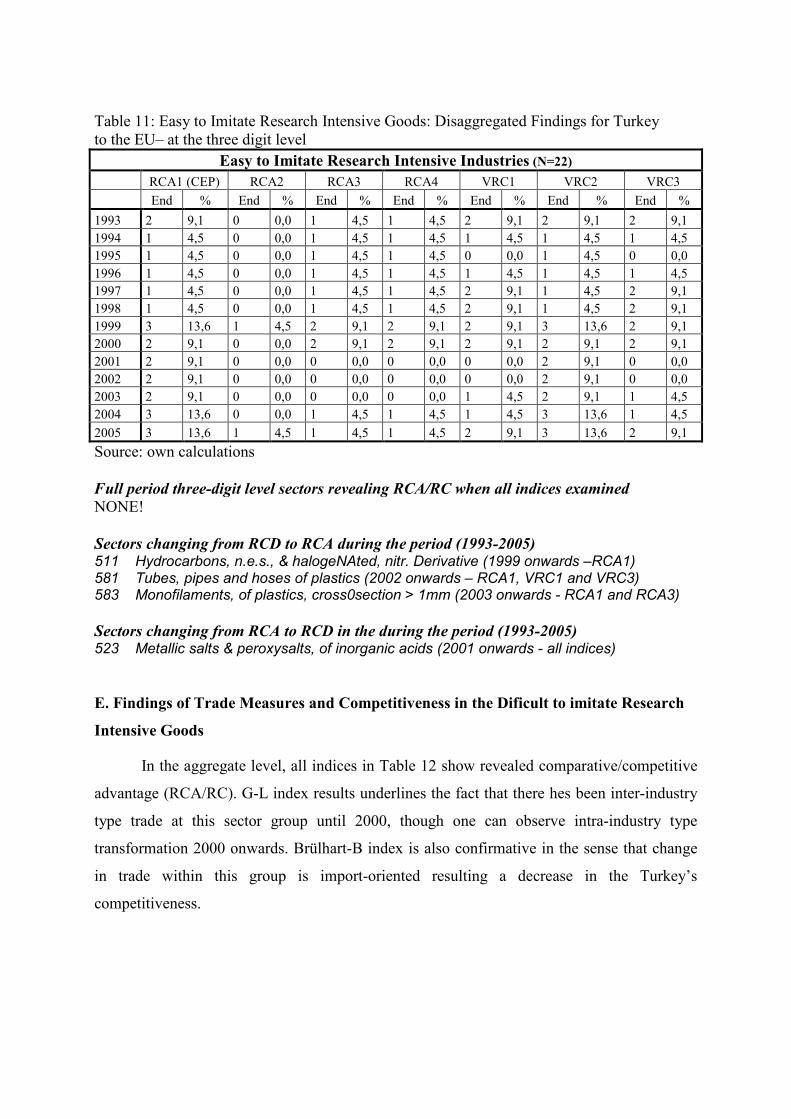
Table 11: Easy to Imitate Research Intensive Goods: Disaggregated Findings for Turkey to the EU– at the three digit level
Easy to Imitate Research Intensive Industries (N=22) RCA1 (CEP) RCA2 RCA3 RCA4 VRC1 VRC2 VRC3 End % End % End % End % End % End % End %
1993 2 9,1 0 0,0 1 4,5 1 4,5 2 9,1 2 9,1 2 9,1 1994 1 4,5 0 0,0 1 4,5 1 4,5 1 4,5 1 4,5 1 4,5 1995 1 4,5 0 0,0 1 4,5 1 4,5 0 0,0 1 4,5 0 0,0 1996 1 4,5 0 0,0 1 4,5 1 4,5 1 4,5 1 4,5 1 4,5 1997 1 4,5 0 0,0 1 4,5 1 4,5 2 9,1 1 4,5 2 9,1 1998 1 4,5 0 0,0 1 4,5 1 4,5 2 9,1 1 4,5 2 9,1 1999 3 13,6 1 4,5 2 9,1 2 9,1 2 9,1 3 13,6 2 9,1 2000 2 9,1 0 0,0 2 9,1 2 9,1 2 9,1 2 9,1 2 9,1 2001 2 9,1 0 0,0 0 0,0 0 0,0 0 0,0 2 9,1 0 0,0 2002 2 9,1 0 0,0 0 0,0 0 0,0 0 0,0 2 9,1 0 0,0 2003 2 9,1 0 0,0 0 0,0 0 0,0 1 4,5 2 9,1 1 4,5 2004 3 13,6 0 0,0 1 4,5 1 4,5 1 4,5 3 13,6 1 4,5 2005 3 13,6 1 4,5 1 4,5 1 4,5 2 9,1 3 13,6 2 9,1 Source: own calculations Full period three-digit level sectors revealing RCA/RC when all indices examined NONE! Sectors changing from RCD to RCA during the period (1993-2005) 511 Hydrocarbons, n.e.s., & halogeNAted, nitr. Derivative (1999 onwards –RCA1) 581 Tubes, pipes and hoses of plastics (2002 onwards – RCA1, VRC1 and VRC3) 583 Monofilaments, of plastics, cross0section > 1mm (2003 onwards - RCA1 and RCA3) Sectors changing from RCA to RCD in the during the period (1993-2005) 523 Metallic salts & peroxysalts, of inorganic acids (2001 onwards - all indices)
E. Findings of Trade Measures and Competitiveness in the Dificult to imitate Research
Intensive Goods
In the aggregate level, all indices in Table 12 show revealed comparative/competitive
advantage (RCA/RC). G-L index results underlines the fact that there hes been inter-industry
type trade at this sector group until 2000, though one can observe intra-industry type
transformation 2000 onwards. Brülhart-B index is also confirmative in the sense that change
in trade within this group is import-oriented resulting a decrease in the Turkey’s
competitiveness.
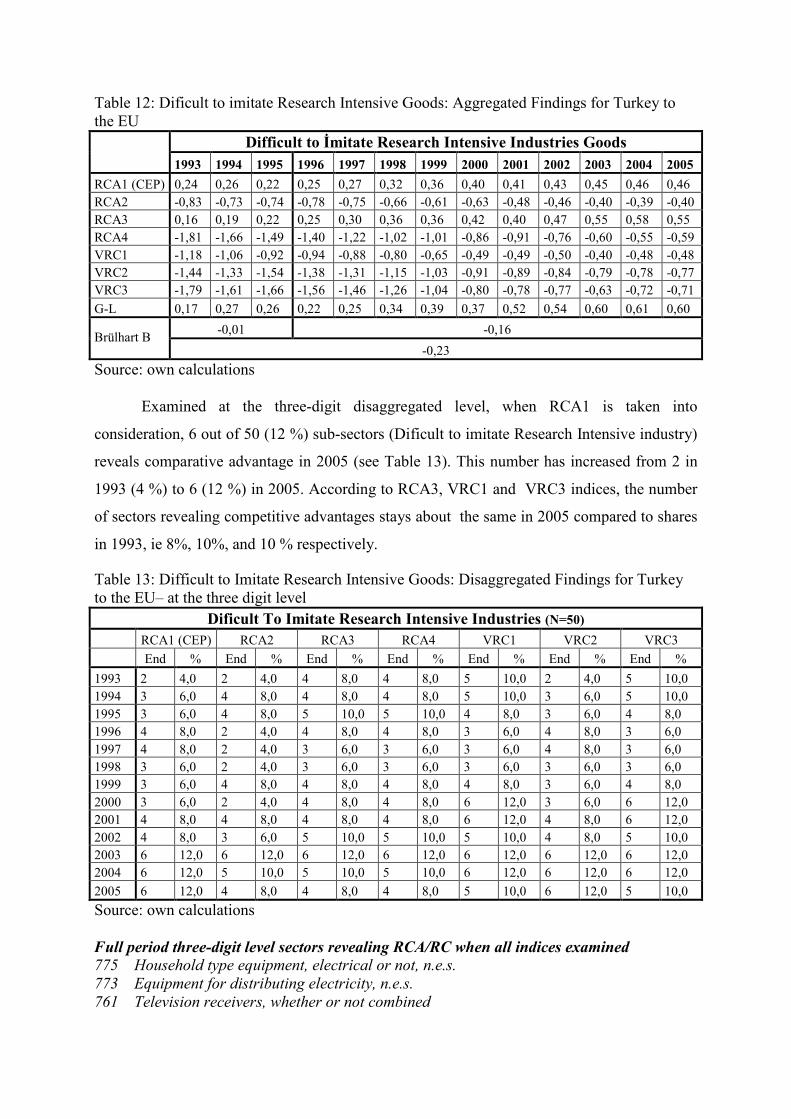
Table 12: Dificult to imitate Research Intensive Goods: Aggregated Findings for Turkey to the EU
Difficult to İmitate Research Intensive Industries Goods 1993 1994 1995 1996 1997 1998 1999 2000 2001 2002 2003 2004 2005
RCA1 (CEP) 0,24 0,26 0,22 0,25 0,27 0,32 0,36 0,40 0,41 0,43 0,45 0,46 0,46 RCA2 -0,83 -0,73 -0,74 -0,78 -0,75 -0,66 -0,61 -0,63 -0,48 -0,46 -0,40 -0,39 -0,40 RCA3 0,16 0,19 0,22 0,25 0,30 0,36 0,36 0,42 0,40 0,47 0,55 0,58 0,55 RCA4 -1,81 -1,66 -1,49 -1,40 -1,22 -1,02 -1,01 -0,86 -0,91 -0,76 -0,60 -0,55 -0,59 VRC1 -1,18 -1,06 -0,92 -0,94 -0,88 -0,80 -0,65 -0,49 -0,49 -0,50 -0,40 -0,48 -0,48 VRC2 -1,44 -1,33 -1,54 -1,38 -1,31 -1,15 -1,03 -0,91 -0,89 -0,84 -0,79 -0,78 -0,77 VRC3 -1,79 -1,61 -1,66 -1,56 -1,46 -1,26 -1,04 -0,80 -0,78 -0,77 -0,63 -0,72 -0,71 G-L 0,17 0,27 0,26 0,22 0,25 0,34 0,39 0,37 0,52 0,54 0,60 0,61 0,60
-0,01 -0,16 Brülhart B -0,23
Source: own calculations
Examined at the three-digit disaggregated level, when RCA1 is taken into
consideration, 6 out of 50 (12 %) sub-sectors (Dificult to imitate Research Intensive industry)
reveals comparative advantage in 2005 (see Table 13). This number has increased from 2 in
1993 (4 %) to 6 (12 %) in 2005. According to RCA3, VRC1 and VRC3 indices, the number
of sectors revealing competitive advantages stays about the same in 2005 compared to shares
in 1993, ie 8%, 10%, and 10 % respectively.
Table 13: Difficult to Imitate Research Intensive Goods: Disaggregated Findings for Turkey to the EU– at the three digit level
Dificult To Imitate Research Intensive Industries (N=50) RCA1 (CEP) RCA2 RCA3 RCA4 VRC1 VRC2 VRC3 End % End % End % End % End % End % End %
1993 2 4,0 2 4,0 4 8,0 4 8,0 5 10,0 2 4,0 5 10,0 1994 3 6,0 4 8,0 4 8,0 4 8,0 5 10,0 3 6,0 5 10,0 1995 3 6,0 4 8,0 5 10,0 5 10,0 4 8,0 3 6,0 4 8,0 1996 4 8,0 2 4,0 4 8,0 4 8,0 3 6,0 4 8,0 3 6,0 1997 4 8,0 2 4,0 3 6,0 3 6,0 3 6,0 4 8,0 3 6,0 1998 3 6,0 2 4,0 3 6,0 3 6,0 3 6,0 3 6,0 3 6,0 1999 3 6,0 4 8,0 4 8,0 4 8,0 4 8,0 3 6,0 4 8,0 2000 3 6,0 2 4,0 4 8,0 4 8,0 6 12,0 3 6,0 6 12,0 2001 4 8,0 4 8,0 4 8,0 4 8,0 6 12,0 4 8,0 6 12,0 2002 4 8,0 3 6,0 5 10,0 5 10,0 5 10,0 4 8,0 5 10,0 2003 6 12,0 6 12,0 6 12,0 6 12,0 6 12,0 6 12,0 6 12,0 2004 6 12,0 5 10,0 5 10,0 5 10,0 6 12,0 6 12,0 6 12,0 2005 6 12,0 4 8,0 4 8,0 4 8,0 5 10,0 6 12,0 5 10,0 Source: own calculations Full period three-digit level sectors revealing RCA/RC when all indices examined 775 Household type equipment, electrical or not, n.e.s. 773 Equipment for distributing electricity, n.e.s. 761 Television receivers, whether or not combined
All sectors in this group gain their comparative advantage/competitive power in time according to Brülhart-B index since the change is export-oriented Sectors changing from RCD to RCA during the period (1993-2005) 722 Tractors (excluding those of 71414 & 74415)(2003 onwards – RCA1) 733 Mach.0tools for working metal, excluding removing mate.(2003 onwards – RCA1) 763 Sound recorders or reproducers; television record.(2003onwards – RCA3, VRC1 and VRC3) 792 Aircraft & associated equipment; spacecraft, etc.(1999onwards – RCA3) 793 Ships, boats & floating structures (2004onwards – RCA1, RCA3, VRC1 and VRC3)
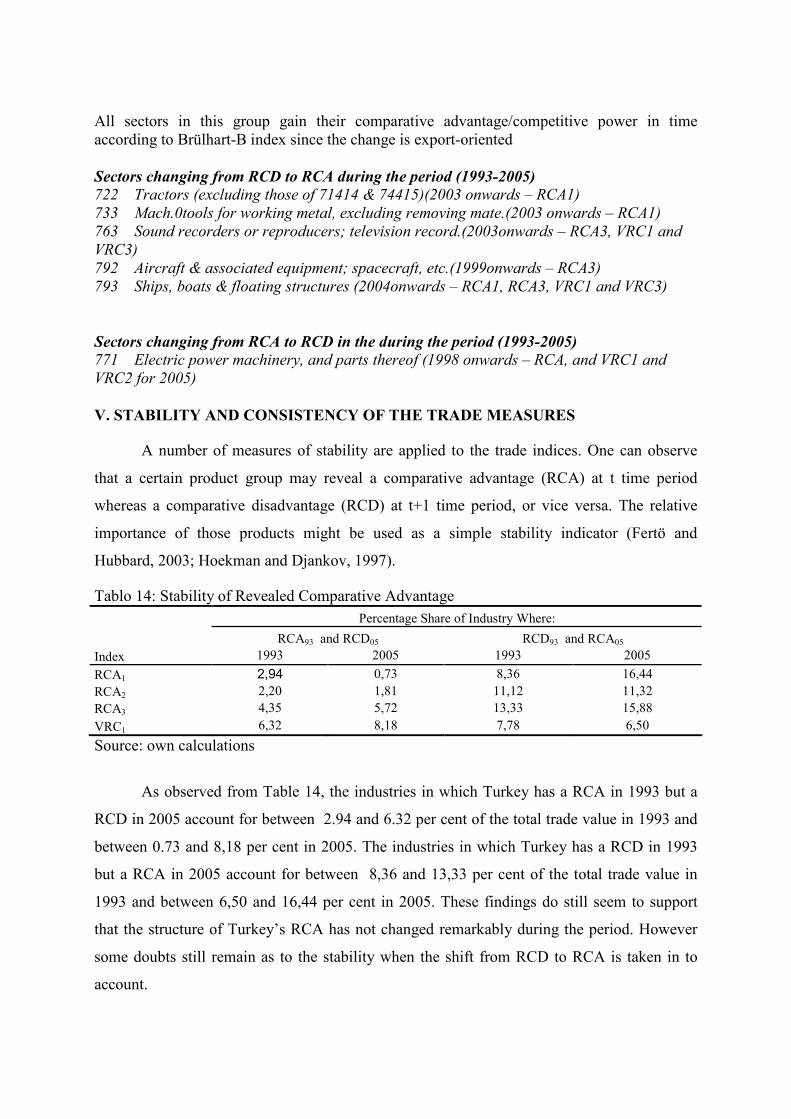
Sectors changing from RCA to RCD in the during the period (1993-2005) 771 Electric power machinery, and parts thereof (1998 onwards – RCA, and VRC1 and VRC2 for 2005) V. STABILITY AND CONSISTENCY OF THE TRADE MEASURES
A number of measures of stability are applied to the trade indices. One can observe
that a certain product group may reveal a comparative advantage (RCA) at t time period
whereas a comparative disadvantage (RCD) at t+1 time period, or vice versa. The relative
importance of those products might be used as a simple stability indicator (Fertö and
Hubbard, 2003; Hoekman and Djankov, 1997).
Tablo 14: Stability of Revealed Comparative Advantage Percentage Share of Industry Where:
RCA93 and RCD05 RCD93 and RCA05 Index 1993 2005 1993 2005 RCA1 2,94 0,73 8,36 16,44 RCA2 2,20 1,81 11,12 11,32 RCA3 4,35 5,72 13,33 15,88 VRC1 6,32 8,18 7,78 6,50 Source: own calculations
As observed from Table 14, the industries in which Turkey has a RCA in 1993 but a
RCD in 2005 account for between 2.94 and 6.32 per cent of the total trade value in 1993 and
between 0.73 and 8,18 per cent in 2005. The industries in which Turkey has a RCD in 1993
but a RCA in 2005 account for between 8,36 and 13,33 per cent of the total trade value in
1993 and between 6,50 and 16,44 per cent in 2005. These findings do still seem to support
that the structure of Turkey’s RCA has not changed remarkably during the period. However
some doubts still remain as to the stability when the shift from RCD to RCA is taken in to
account.
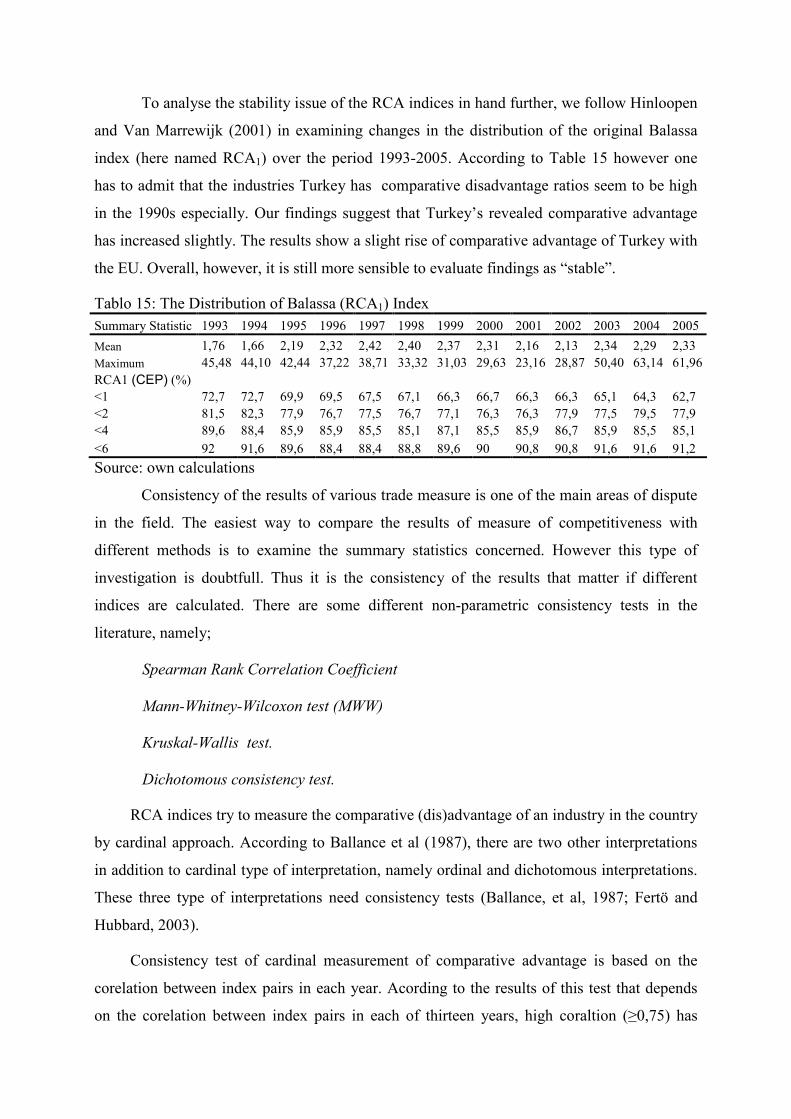
To analyse the stability issue of the RCA indices in hand further, we follow Hinloopen
and Van Marrewijk (2001) in examining changes in the distribution of the original Balassa
index (here named RCA1) over the period 1993-2005. According to Table 15 however one
has to admit that the industries Turkey has comparative disadvantage ratios seem to be high
in the 1990s especially. Our findings suggest that Turkey’s revealed comparative advantage
has increased slightly. The results show a slight rise of comparative advantage of Turkey with
the EU. Overall, however, it is still more sensible to evaluate findings as “stable”.
Tablo 15: The Distribution of Balassa (RCA1) Index Summary Statistic 1993 1994 1995 1996 1997 1998 1999 2000 2001 2002 2003 2004 2005 Mean 1,76 1,66 2,19 2,32 2,42 2,40 2,37 2,31 2,16 2,13 2,34 2,29 2,33 Maximum 45,48 44,10 42,44 37,22 38,71 33,32 31,03 29,63 23,16 28,87 50,40 63,14 61,96RCA1 (CEP) (%) <1 72,7 72,7 69,9 69,5 67,5 67,1 66,3 66,7 66,3 66,3 65,1 64,3 62,7 <2 81,5 82,3 77,9 76,7 77,5 76,7 77,1 76,3 76,3 77,9 77,5 79,5 77,9 <4 89,6 88,4 85,9 85,9 85,5 85,1 87,1 85,5 85,9 86,7 85,9 85,5 85,1 <6 92 91,6 89,6 88,4 88,4 88,8 89,6 90 90,8 90,8 91,6 91,6 91,2 Source: own calculations
Consistency of the results of various trade measure is one of the main areas of dispute
in the field. The easiest way to compare the results of measure of competitiveness with
different methods is to examine the summary statistics concerned. However this type of
investigation is doubtfull. Thus it is the consistency of the results that matter if different
indices are calculated. There are some different non-parametric consistency tests in the
literature, namely;
• Spearman Rank Correlation Coefficient
• Mann-Whitney-Wilcoxon test (MWW)
• Kruskal-Wallis test.
• Dichotomous consistency test.
RCA indices try to measure the comparative (dis)advantage of an industry in the country
by cardinal approach. According to Ballance et al (1987), there are two other interpretations
in addition to cardinal type of interpretation, namely ordinal and dichotomous interpretations.
These three type of interpretations need consistency tests (Ballance, et al, 1987; Fertö and
Hubbard, 2003).
Consistency test of cardinal measurement of comparative advantage is based on the
corelation between index pairs in each year. Acording to the results of this test that depends
on the corelation between index pairs in each of thirteen years, high coraltion (≥0,75) has
been attained only between three pairs. This shows that indices do not reveal consistent
results for cardinal interpretation of comparative advantage.
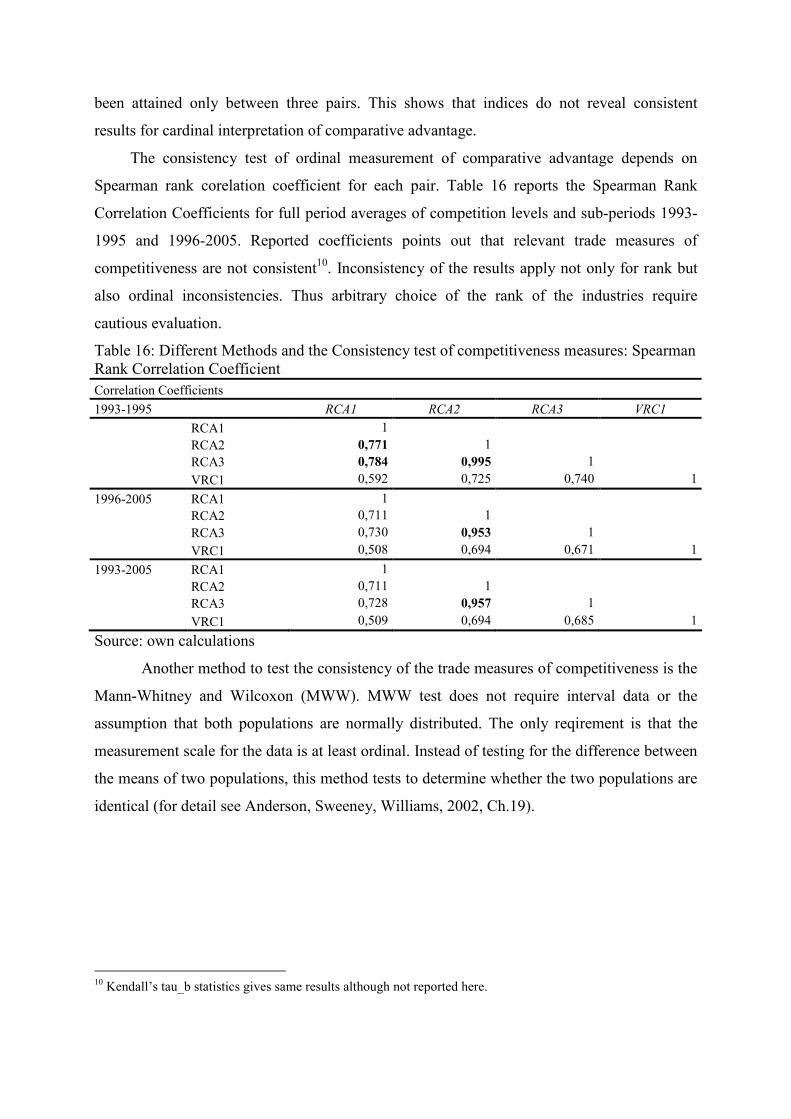
The consistency test of ordinal measurement of comparative advantage depends on
Spearman rank corelation coefficient for each pair. Table 16 reports the Spearman Rank
Correlation Coefficients for full period averages of competition levels and sub-periods 1993-
1995 and 1996-2005. Reported coefficients points out that relevant trade measures of
competitiveness are not consistent10. Inconsistency of the results apply not only for rank but
also ordinal inconsistencies. Thus arbitrary choice of the rank of the industries require
cautious evaluation.
Table 16: Different Methods and the Consistency test of competitiveness measures: Spearman Rank Correlation Coefficient Correlation Coefficients 1993-1995 RCA1 RCA2 RCA3 VRC1
RCA1 1RCA2 0,771 1RCA3 0,784 0,995 1VRC1 0,592 0,725 0,740 1
1996-2005 RCA1 1RCA2 0,711 1RCA3 0,730 0,953 1VRC1 0,508 0,694 0,671 1
1993-2005 RCA1 1RCA2 0,711 1RCA3 0,728 0,957 1VRC1 0,509 0,694 0,685 1
Source: own calculations
Another method to test the consistency of the trade measures of competitiveness is the
Mann-Whitney and Wilcoxon (MWW). MWW test does not require interval data or the
assumption that both populations are normally distributed. The only reqirement is that the
measurement scale for the data is at least ordinal. Instead of testing for the difference between
the means of two populations, this method tests to determine whether the two populations are
identical (for detail see Anderson, Sweeney, Williams, 2002, Ch.19).
10 Kendall’s tau_b statistics gives same results although not reported here.
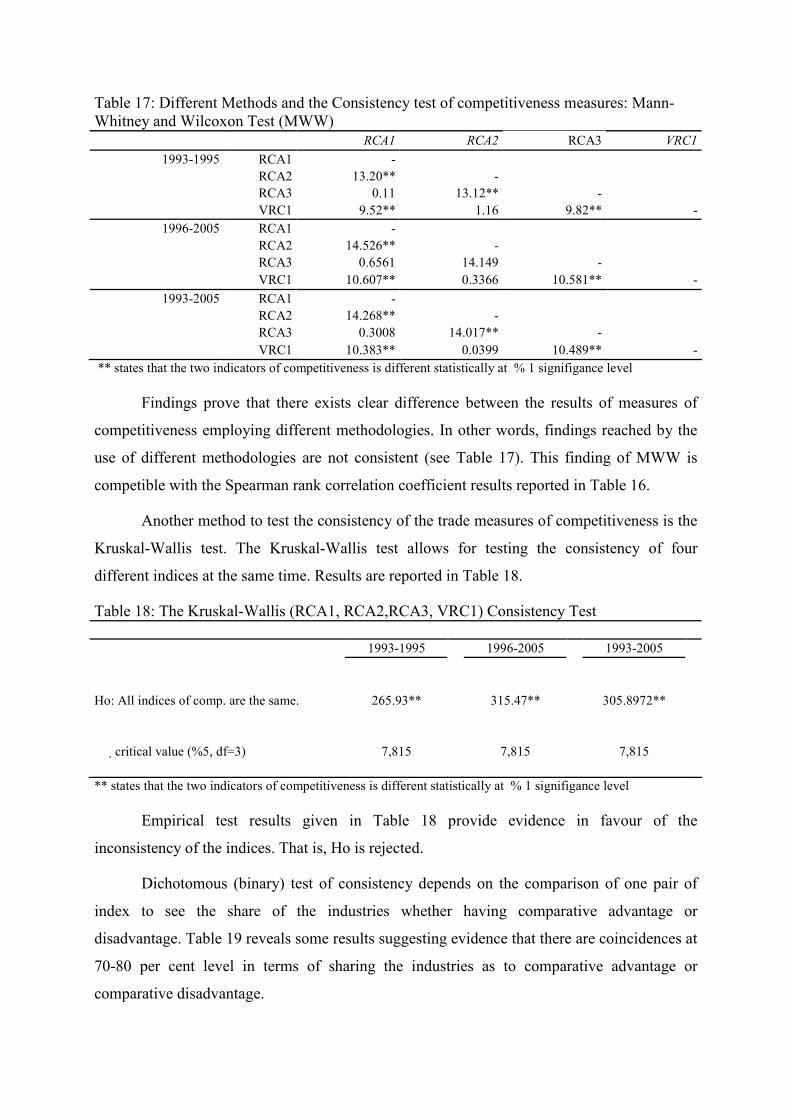
Table 17: Different Methods and the Consistency test of competitiveness measures: Mann-Whitney and Wilcoxon Test (MWW)
RCA1 RCA2 RCA3 VRC11993-1995 RCA1 -
RCA2 13.20** -RCA3 0.11 13.12** -VRC1 9.52** 1.16 9.82** -
1996-2005 RCA1 -RCA2 14.526** -RCA3 0.6561 14.149 -VRC1 10.607** 0.3366 10.581** -
1993-2005 RCA1 -RCA2 14.268** -RCA3 0.3008 14.017** -VRC1 10.383** 0.0399 10.489** -
** states that the two indicators of competitiveness is different statistically at % 1 signifigance level
Findings prove that there exists clear difference between the results of measures of
competitiveness employing different methodologies. In other words, findings reached by the
use of different methodologies are not consistent (see Table 17). This finding of MWW is
competible with the Spearman rank correlation coefficient results reported in Table 16.
Another method to test the consistency of the trade measures of competitiveness is the
Kruskal-Wallis test. The Kruskal-Wallis test allows for testing the consistency of four
different indices at the same time. Results are reported in Table 18.
Table 18: The Kruskal-Wallis (RCA1, RCA2,RCA3, VRC1) Consistency Test
1993-1995 1996-2005 1993-2005
Ho: All indices of comp. are the same. 265.93**
315.47**
305.8972**
�� critical value (%5, df=3) 7,815 7,815 7,815
** states that the two indicators of competitiveness is different statistically at % 1 signifigance level
Empirical test results given in Table 18 provide evidence in favour of the
inconsistency of the indices. That is, Ho is rejected.
Dichotomous (binary) test of consistency depends on the comparison of one pair of
index to see the share of the industries whether having comparative advantage or
disadvantage. Table 19 reveals some results suggesting evidence that there are coincidences at
70-80 per cent level in terms of sharing the industries as to comparative advantage or
comparative disadvantage.
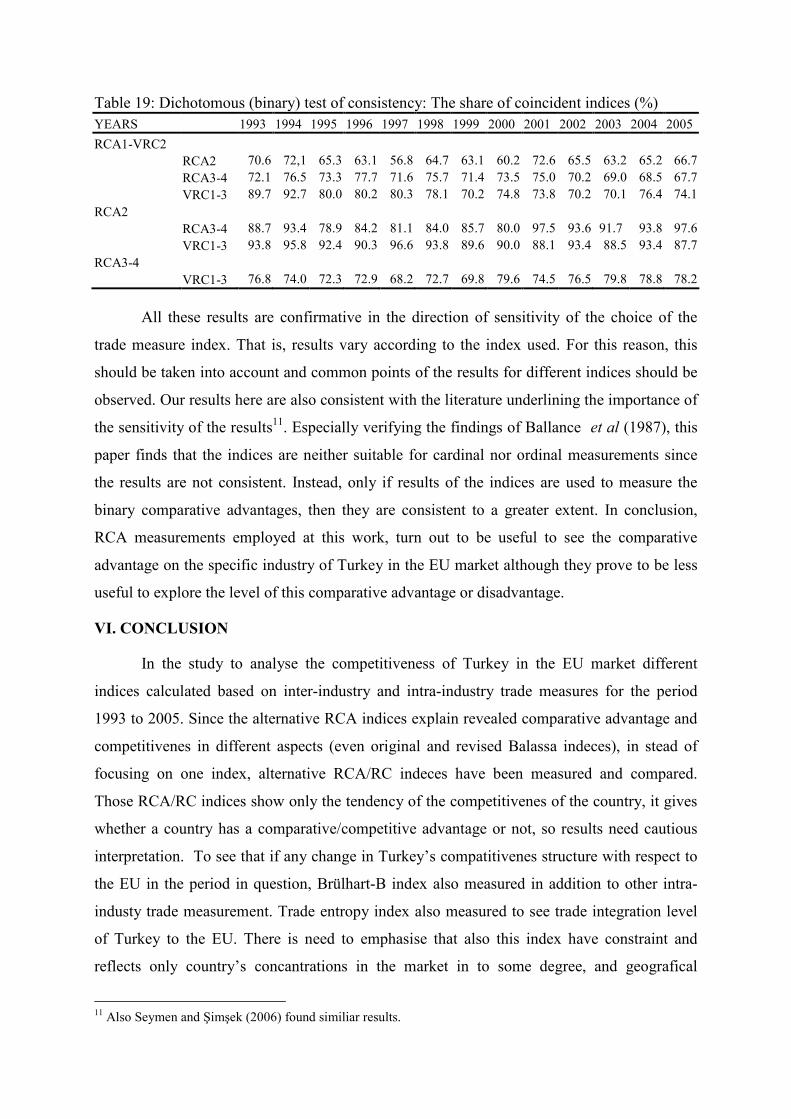
Table 19: Dichotomous (binary) test of consistency: The share of coincident indices (%) YEARS 1993 1994 1995 1996 1997 1998 1999 2000 2001 2002 2003 2004 2005RCA1-VRC2
RCA2 70.6 72,1 65.3 63.1 56.8 64.7 63.1 60.2 72.6 65.5 63.2 65.2 66.7RCA3-4 72.1 76.5 73.3 77.7 71.6 75.7 71.4 73.5 75.0 70.2 69.0 68.5 67.7VRC1-3 89.7 92.7 80.0 80.2 80.3 78.1 70.2 74.8 73.8 70.2 70.1 76.4 74.1
RCA2 RCA3-4 88.7 93.4 78.9 84.2 81.1 84.0 85.7 80.0 97.5 93.6 91.7 93.8 97.6VRC1-3 93.8 95.8 92.4 90.3 96.6 93.8 89.6 90.0 88.1 93.4 88.5 93.4 87.7
RCA3-4 VRC1-3 76.8 74.0 72.3 72.9 68.2 72.7 69.8 79.6 74.5 76.5 79.8 78.8 78.2
All these results are confirmative in the direction of sensitivity of the choice of the
trade measure index. That is, results vary according to the index used. For this reason, this
should be taken into account and common points of the results for different indices should be
observed. Our results here are also consistent with the literature underlining the importance of
the sensitivity of the results11. Especially verifying the findings of Ballance et al (1987), this
paper finds that the indices are neither suitable for cardinal nor ordinal measurements since
the results are not consistent. Instead, only if results of the indices are used to measure the
binary comparative advantages, then they are consistent to a greater extent. In conclusion,
RCA measurements employed at this work, turn out to be useful to see the comparative
advantage on the specific industry of Turkey in the EU market although they prove to be less
useful to explore the level of this comparative advantage or disadvantage.
VI. CONCLUSION
In the study to analyse the competitiveness of Turkey in the EU market different
indices calculated based on inter-industry and intra-industry trade measures for the period
1993 to 2005. Since the alternative RCA indices explain revealed comparative advantage and
competitivenes in different aspects (even original and revised Balassa indeces), in stead of
focusing on one index, alternative RCA/RC indeces have been measured and compared.
Those RCA/RC indices show only the tendency of the competitivenes of the country, it gives
whether a country has a comparative/competitive advantage or not, so results need cautious
interpretation. To see that if any change in Turkey’s compatitivenes structure with respect to
the EU in the period in question, Brülhart-B index also measured in addition to other intra-
industy trade measurement. Trade entropy index also measured to see trade integration level
of Turkey to the EU. There is need to emphasise that also this index have constraint and
reflects only country’s concantrations in the market in to some degree, and geografical
11 Also Seymen and Şimşek (2006) found similiar results.
distance and the number of countries (in the EU market in our study) should be taken in to
consideration.
It is also important that RCA calculations are based on observed trade data. Thus,
there are possible influences of government interventions in the markets such as tariffs, quotas
or subsidies. Although we have not measured the effect of government interventions on the
RCA indices, we can still confirm that distortions are at reasonably minimal levels. Due to the
implementation of the CU especially, there exists no tariffs and quotas on industrial
commodities between Turkey and the EU. Furthermore, Turkey has preferential trade
agreement with the EU on agricultural products.
In the study, the stability and consistency of alternative measures of RCA has been
called into question. this paper finds that the indices are neither suitable for cardinal nor
ordinal measurements since the results are not consistent. Instead, only if results of the indices
are used to measure the binary comparative advantages, then they are consistent to a greater
extent. In conclusion, RCA measurements employed at this work, turn out to be useful to see
the comparative advantage on the specific industry of Turkey in the EU market although they
prove to be less useful to explore the level of this comparative advantage or disadvantage.
The results in the clasification based on technological nature of the sectors show that
in aggregate level, Turkey have comparative/competitive advantage in raw materials and
labour intensive goods. For the Capital intensive goods, in aggregate level findings of
original Balassa index seem to be different from the other RCA indices. In according to the
results Turkey has relative export advantage in capital goods. On the other hand, other
indeces which include import performance show that in this clasification has revealed
comparative disadvantage. In aggregate level, Turkey has comparative disadvantage in the
research intensive (both easy and difficult to immitiate researh intensive goods. To eliminate
the aggregation problem, we also analyse sectors in 3 digit level by observation. This
observation gave the chance of capturing the sectors which has RCA in all indices and the
sectors which shows substantional improvement in the period.
REFERENCES
Anderson, D. R., Sweeney, D. J., and Williams, T. E. (2002), Statistics for Business and
Economics, South-Western College Publishing/Thomson Learning,
Balance, R.H., H. Forstner and T. Murray (1987), “Consistency Tests of Alternative Measures
of Comparative Advantage”, Review of Economics and Statistics, 69, 157-61.
Balassa, B. (1965), “Trade Liberalisation and ‘Revealed’ Comparative Advantage”, The
Manchester School, 33, 99-123.
Balassa, B. (1977), “’Revealed’ Comparative Advantage Revisited”, The Manchester School,
45, 327-44.
Balassa, B. (1989), Comparative Advantage, Trade Policy and Economic Development,
Harvester Wheatsheaf, New York.
Brülhart, M. (1994), “Marginal Intra-Industry Trade: Measurement and Relevance for the
Pattern of Industrial Adjustment”, Weltwirtschaftliches Archiv, 130(3), 600-613.
Dimelis, S. and K. Gatsios (1995), “Trade with Central and Eastern Europe: The Case of
Greece”, in R. Faini and R. Portes (eds.), EU Trade with Eastern Europe: Adjustment
and Opportunities, London: CEPR.
Erlat, G. and H. Erlat (2005), “Do Turkish Exports Have Comparative Advantage with
Respect to the European Union Market, 1990-2000”, Proceedings of the Middle East
Economic Association, 7, http://www.sba.luc.edu/orgs/meea/volume7/erlat.pdf
(11.11.2005).
EUECOPOL (2006), European Economic Policy, European Integration and EU Enlargement
with Special Reference to the Issue of Turkish Membership, Conference held in May
2006, Brussels, http://euecopol.fh-brandenburg.de/ (17.07.2007).
Fertö, I. And L.J. Hubbard (2003), “Revealed Comparative Advantage and Competitiveness
in Hungarian Agri-Food Sectors”, The World Economy, 26(2), 247-59.
Finger, J. M. (1975), “Trade Overlap and Intra-Industry Trade“, Economic Inquiry, 13, 581-
589.
Finger, J. M. and D. A. DeRosa (1979), “Trade Overlap, Comparative Advantage and
Protection”, In On the Economics of Intra-Industry Trade, Ed. Herbert Giersch,
Institut für Weltwirtschaft an der Universtat Kiel, Tübingen, 213-40.
Greenaway, D. and C. Milner (1986), The Economics of Intra-Industry Trade, Basil
Blackwell Ltd., UK, Basil Blackwell Inc., USA.
Greenaway, D. and C. Milner (1993), Trade and Industrial Policy in Developing Countries: A
Manual of Policy Analysis, The Macmillan Press, esp. Part IV Evaluating Comparative
Advantage, 181-208.
Grubel, H. G. and P. J. Lloyd (1975), Intra-Industry Trade: The Theory and Measurement of
International Trade in Differentiated Products, John Willey, New York.
Harrison, G.W., F.T. Rutherford and D. Tarr (1996), “Economic Implications for Turkey of a
Customs Union with the European Union”, World Bank Policy Research Working
Paper No. 1599, Washington D.C. May.
Hinloopen, J. and C. Van Marrewijk (2001), “On the Empirical Distribution of the Balassa
Index”, Weltwirtschaftliches Archiv, 137, 1-35.
Hoekman, B. and S. Djankov (1997), “Determinants of the Export Structure of Countries in
Central and Eastern Europe”, World Bank Economic Review, 11, 471-87.
Hufbauer, C.G. and J. C. Chilas (1974), “Specialization by Industrial Countries: Extent and
Consequences”, in The International Division of Labour: Problems and Perspectives,
International Symposium, Ed. H. Giersch, J.C.B. Mohr, Tubingen, 3-38.
Laaser, C. F. and K. Schrader (2002), “European Integration and Changing Trade Patterns:
The Case of the Baltic Statets”, Kiel Working Paper, No.1088, January.
Liesner, H.H. (1958), “The European Common Market and British Industry”, Economic
Journal, 68, 302-16.
Marwah, K. and L. R. Klein (1995), “The Possibility of Nesting South Asia in Asia-Pacific
Economic Integration”, Journal of Asian Economics, 6(1), 1-27.
OECD (2005), International Trade by Commodity Statistics, SITC Revision 3, CD-ROM
Database.
Seymen D. (1998), “The Effects of the Customs Union on Turkish Foreign Trade”, One Day
Conference on: European Union’s Policy Towards Turkey Aftermath of the
Luxemburg Summit, University of Birmingham, Birmingham, October.
Seymen, D. and N. Şimşek (2006), “Competitiveness Comperison of Turkey and Chine in the
OECD Market”, Economics, Business, Finance, No.244, 38-51 (Turkish).
Sheskin, D., (1997), Handbook of Parametric and Nonparametric Statistical Procedures,
CRC Press, LLC, United States.
SPO, State Planning Organization, Several Year Statistics.
TSI, Turkish Statistics Institute, Several Year Statistics.
Utkulu U. and D. Seymen (2003), “Trade and Competitiveness between Turkey and the EU:
Time Series Evidence”, Europe in Global World-blending differences, OPEN MINDS
Conference, University of Lodz, Lodz-Polond, September.
Utkulu, U., D. Seymen and A. Arı (2004), “Export Supply and Trade Reform: The Turkish
Evidence”, paper presented at the International Conference on Policy Modelling, Paris
June 30-July 2, 2004.
Vollrath, T.L. (1991), “A Theoretical Evaluation of Alternative Trade Intensity Measures of
Revealed Comparative Advantage”, Weltwirtschaftliches Archiv, 130, 265-79.
WTO (1999), Trade Policy Review-Turkey, Geneva.
Yeats, A.J. (1985), “On the Appropriate Interpretation of the Revealed Comparative
Advantage Index: Implications of a Methodology Based on Industry Sector Analysis”,
Weltwirtschaftliches Archiv, 121(1), 61-73.
Yılmaz, B. (2003), “Turkey’s Competitiveness in the European Union: A Comparison with
Five Candidate Countries – Bulgaria, The Czech Republic, Hungary, Poland, Romania
– and the EU15”, Ezoneplus Working Paper, No.12, February.
Yılmaz, B. and S.J. Ergun (2003), “The Foreign Trade Pattern and Foreign Trade
Specialisation of Candidates of the European Union”, Ezoneplus Working Paper,
No.19, September.
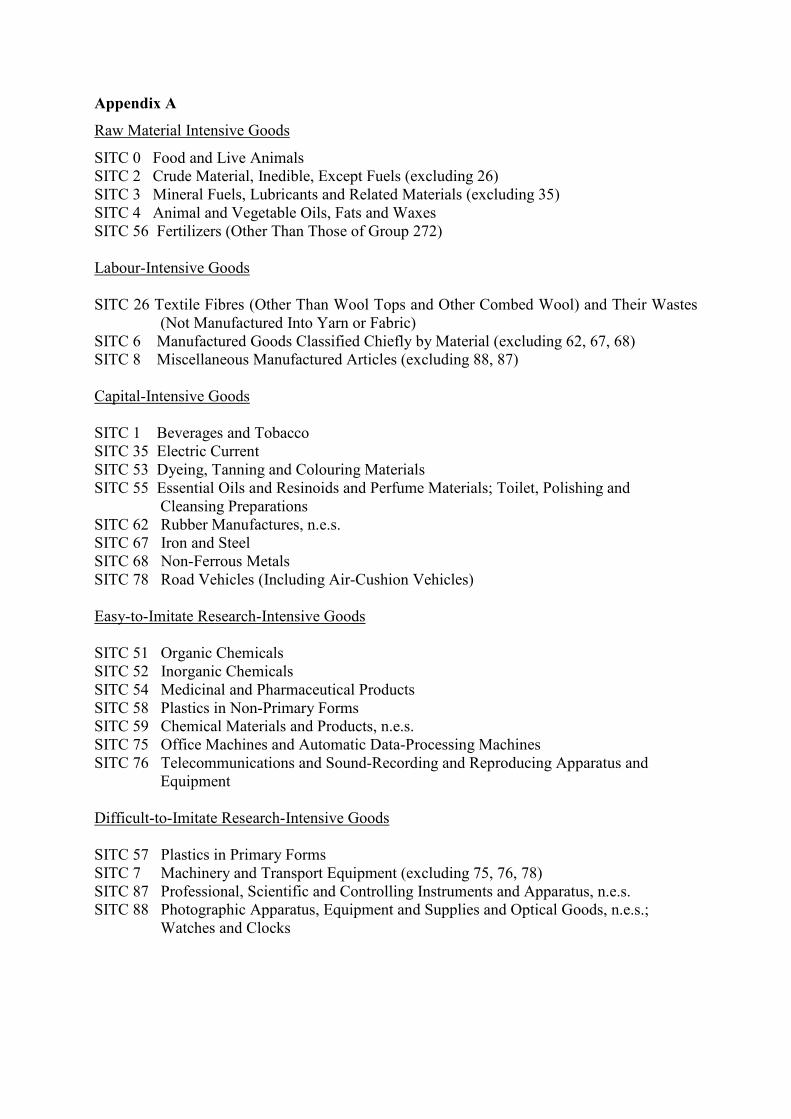
Appendix A
Raw Material Intensive Goods
SITC 0 Food and Live Animals SITC 2 Crude Material, Inedible, Except Fuels (excluding 26) SITC 3 Mineral Fuels, Lubricants and Related Materials (excluding 35) SITC 4 Animal and Vegetable Oils, Fats and Waxes SITC 56 Fertilizers (Other Than Those of Group 272) Labour-Intensive Goods
SITC 26 Textile Fibres (Other Than Wool Tops and Other Combed Wool) and Their Wastes (Not Manufactured Into Yarn or Fabric)
SITC 6 Manufactured Goods Classified Chiefly by Material (excluding 62, 67, 68) SITC 8 Miscellaneous Manufactured Articles (excluding 88, 87) Capital-Intensive Goods
SITC 1 Beverages and Tobacco SITC 35 Electric Current SITC 53 Dyeing, Tanning and Colouring Materials SITC 55 Essential Oils and Resinoids and Perfume Materials; Toilet, Polishing and
Cleansing Preparations SITC 62 Rubber Manufactures, n.e.s. SITC 67 Iron and Steel SITC 68 Non-Ferrous Metals SITC 78 Road Vehicles (Including Air-Cushion Vehicles) Easy-to-Imitate Research-Intensive Goods
SITC 51 Organic Chemicals SITC 52 Inorganic Chemicals SITC 54 Medicinal and Pharmaceutical Products SITC 58 Plastics in Non-Primary Forms SITC 59 Chemical Materials and Products, n.e.s. SITC 75 Office Machines and Automatic Data-Processing Machines SITC 76 Telecommunications and Sound-Recording and Reproducing Apparatus and
Equipment Difficult-to-Imitate Research-Intensive Goods
SITC 57 Plastics in Primary Forms SITC 7 Machinery and Transport Equipment (excluding 75, 76, 78) SITC 87 Professional, Scientific and Controlling Instruments and Apparatus, n.e.s. SITC 88 Photographic Apparatus, Equipment and Supplies and Optical Goods, n.e.s.;
Watches and Clocks
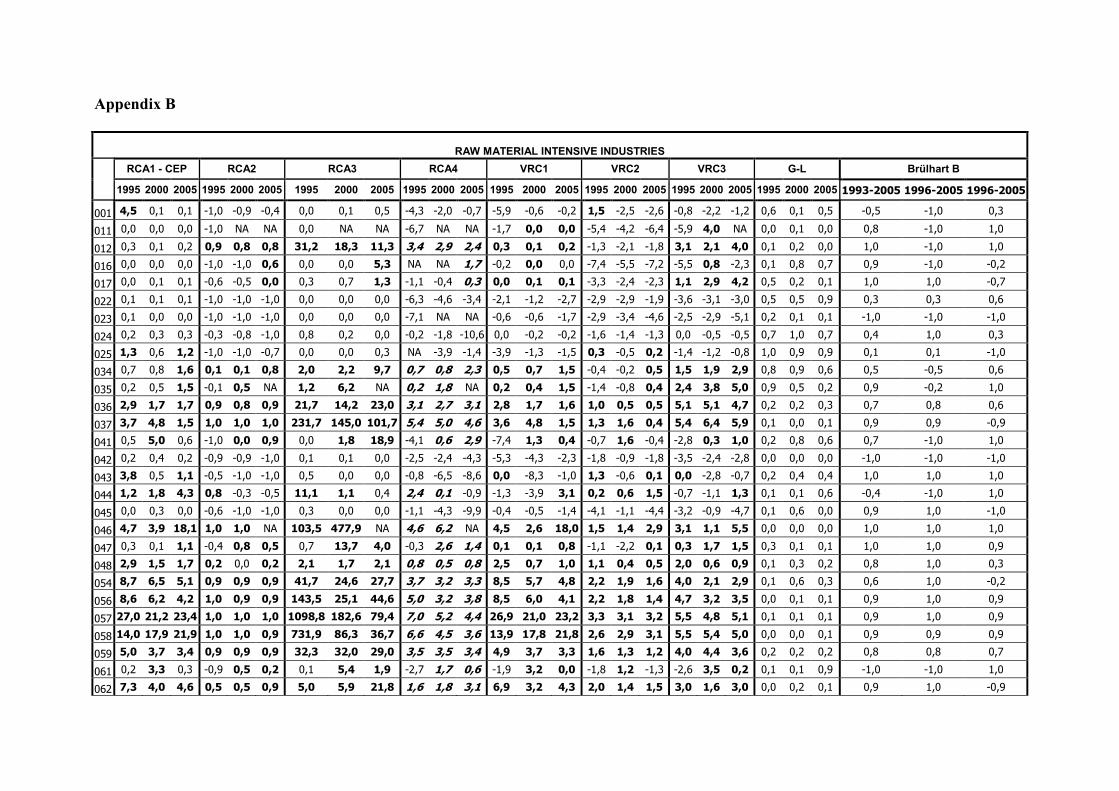
Appendix B
RAW MATERIAL INTENSIVE INDUSTRIESRCA1 - CEP RCA2 RCA3 RCA4 VRC1 VRC2 VRC3 G-L Brülhart B
1995 2000 2005 1995 2000 2005 1995 2000 2005 1995 2000 2005 1995 2000 2005 1995 2000 2005 1995 2000 2005 1995 2000 2005 1993-2005 1996-2005 1996-2005
001 4,5 0,1 0,1 -1,0 -0,9 -0,4 0,0 0,1 0,5 -4,3 -2,0 -0,7 -5,9 -0,6 -0,2 1,5 -2,5 -2,6 -0,8 -2,2 -1,2 0,6 0,1 0,5 -0,5 -1,0 0,3
011 0,0 0,0 0,0 -1,0 NA NA 0,0 NA NA -6,7 NA NA -1,7 0,0 0,0 -5,4 -4,2 -6,4 -5,9 4,0 NA 0,0 0,1 0,0 0,8 -1,0 1,0
012 0,3 0,1 0,2 0,9 0,8 0,8 31,2 18,3 11,3 3,4 2,9 2,4 0,3 0,1 0,2 -1,3 -2,1 -1,8 3,1 2,1 4,0 0,1 0,2 0,0 1,0 -1,0 1,0
016 0,0 0,0 0,0 -1,0 -1,0 0,6 0,0 0,0 5,3 NA NA 1,7 -0,2 0,0 0,0 -7,4 -5,5 -7,2 -5,5 0,8 -2,3 0,1 0,8 0,7 0,9 -1,0 -0,2
017 0,0 0,1 0,1 -0,6 -0,5 0,0 0,3 0,7 1,3 -1,1 -0,4 0,3 0,0 0,1 0,1 -3,3 -2,4 -2,3 1,1 2,9 4,2 0,5 0,2 0,1 1,0 1,0 -0,7
022 0,1 0,1 0,1 -1,0 -1,0 -1,0 0,0 0,0 0,0 -6,3 -4,6 -3,4 -2,1 -1,2 -2,7 -2,9 -2,9 -1,9 -3,6 -3,1 -3,0 0,5 0,5 0,9 0,3 0,3 0,6
023 0,1 0,0 0,0 -1,0 -1,0 -1,0 0,0 0,0 0,0 -7,1 NA NA -0,6 -0,6 -1,7 -2,9 -3,4 -4,6 -2,5 -2,9 -5,1 0,2 0,1 0,1 -1,0 -1,0 -1,0
024 0,2 0,3 0,3 -0,3 -0,8 -1,0 0,8 0,2 0,0 -0,2 -1,8 -10,6 0,0 -0,2 -0,2 -1,6 -1,4 -1,3 0,0 -0,5 -0,5 0,7 1,0 0,7 0,4 1,0 0,3
025 1,3 0,6 1,2 -1,0 -1,0 -0,7 0,0 0,0 0,3 NA -3,9 -1,4 -3,9 -1,3 -1,5 0,3 -0,5 0,2 -1,4 -1,2 -0,8 1,0 0,9 0,9 0,1 0,1 -1,0
034 0,7 0,8 1,6 0,1 0,1 0,8 2,0 2,2 9,7 0,7 0,8 2,3 0,5 0,7 1,5 -0,4 -0,2 0,5 1,5 1,9 2,9 0,8 0,9 0,6 0,5 -0,5 0,6
035 0,2 0,5 1,5 -0,1 0,5 NA 1,2 6,2 NA 0,2 1,8 NA 0,2 0,4 1,5 -1,4 -0,8 0,4 2,4 3,8 5,0 0,9 0,5 0,2 0,9 -0,2 1,0
036 2,9 1,7 1,7 0,9 0,8 0,9 21,7 14,2 23,0 3,1 2,7 3,1 2,8 1,7 1,6 1,0 0,5 0,5 5,1 5,1 4,7 0,2 0,2 0,3 0,7 0,8 0,6
037 3,7 4,8 1,5 1,0 1,0 1,0 231,7 145,0 101,7 5,4 5,0 4,6 3,6 4,8 1,5 1,3 1,6 0,4 5,4 6,4 5,9 0,1 0,0 0,1 0,9 0,9 -0,9
041 0,5 5,0 0,6 -1,0 0,0 0,9 0,0 1,8 18,9 -4,1 0,6 2,9 -7,4 1,3 0,4 -0,7 1,6 -0,4 -2,8 0,3 1,0 0,2 0,8 0,6 0,7 -1,0 1,0
042 0,2 0,4 0,2 -0,9 -0,9 -1,0 0,1 0,1 0,0 -2,5 -2,4 -4,3 -5,3 -4,3 -2,3 -1,8 -0,9 -1,8 -3,5 -2,4 -2,8 0,0 0,0 0,0 -1,0 -1,0 -1,0
043 3,8 0,5 1,1 -0,5 -1,0 -1,0 0,5 0,0 0,0 -0,8 -6,5 -8,6 0,0 -8,3 -1,0 1,3 -0,6 0,1 0,0 -2,8 -0,7 0,2 0,4 0,4 1,0 1,0 1,0
044 1,2 1,8 4,3 0,8 -0,3 -0,5 11,1 1,1 0,4 2,4 0,1 -0,9 -1,3 -3,9 3,1 0,2 0,6 1,5 -0,7 -1,1 1,3 0,1 0,1 0,6 -0,4 -1,0 1,0
045 0,0 0,3 0,0 -0,6 -1,0 -1,0 0,3 0,0 0,0 -1,1 -4,3 -9,9 -0,4 -0,5 -1,4 -4,1 -1,1 -4,4 -3,2 -0,9 -4,7 0,1 0,6 0,0 0,9 1,0 -1,0
046 4,7 3,9 18,1 1,0 1,0 NA 103,5 477,9 NA 4,6 6,2 NA 4,5 2,6 18,0 1,5 1,4 2,9 3,1 1,1 5,5 0,0 0,0 0,0 1,0 1,0 1,0
047 0,3 0,1 1,1 -0,4 0,8 0,5 0,7 13,7 4,0 -0,3 2,6 1,4 0,1 0,1 0,8 -1,1 -2,2 0,1 0,3 1,7 1,5 0,3 0,1 0,1 1,0 1,0 0,9
048 2,9 1,5 1,7 0,2 0,0 0,2 2,1 1,7 2,1 0,8 0,5 0,8 2,5 0,7 1,0 1,1 0,4 0,5 2,0 0,6 0,9 0,1 0,3 0,2 0,8 1,0 0,3
054 8,7 6,5 5,1 0,9 0,9 0,9 41,7 24,6 27,7 3,7 3,2 3,3 8,5 5,7 4,8 2,2 1,9 1,6 4,0 2,1 2,9 0,1 0,6 0,3 0,6 1,0 -0,2
056 8,6 6,2 4,2 1,0 0,9 0,9 143,5 25,1 44,6 5,0 3,2 3,8 8,5 6,0 4,1 2,2 1,8 1,4 4,7 3,2 3,5 0,0 0,1 0,1 0,9 1,0 0,9
057 27,0 21,2 23,4 1,0 1,0 1,0 1098,8 182,6 79,4 7,0 5,2 4,4 26,9 21,0 23,2 3,3 3,1 3,2 5,5 4,8 5,1 0,1 0,1 0,1 0,9 1,0 0,9
058 14,0 17,9 21,9 1,0 1,0 0,9 731,9 86,3 36,7 6,6 4,5 3,6 13,9 17,8 21,8 2,6 2,9 3,1 5,5 5,4 5,0 0,0 0,0 0,1 0,9 0,9 0,9
059 5,0 3,7 3,4 0,9 0,9 0,9 32,3 32,0 29,0 3,5 3,5 3,4 4,9 3,7 3,3 1,6 1,3 1,2 4,0 4,4 3,6 0,2 0,2 0,2 0,8 0,8 0,7
061 0,2 3,3 0,3 -0,9 0,5 0,2 0,1 5,4 1,9 -2,7 1,7 0,6 -1,9 3,2 0,0 -1,8 1,2 -1,3 -2,6 3,5 0,2 0,1 0,1 0,9 -1,0 -1,0 1,0
062 7,3 4,0 4,6 0,5 0,5 0,9 5,0 5,9 21,8 1,6 1,8 3,1 6,9 3,2 4,3 2,0 1,4 1,5 3,0 1,6 3,0 0,0 0,2 0,1 0,9 1,0 -0,9
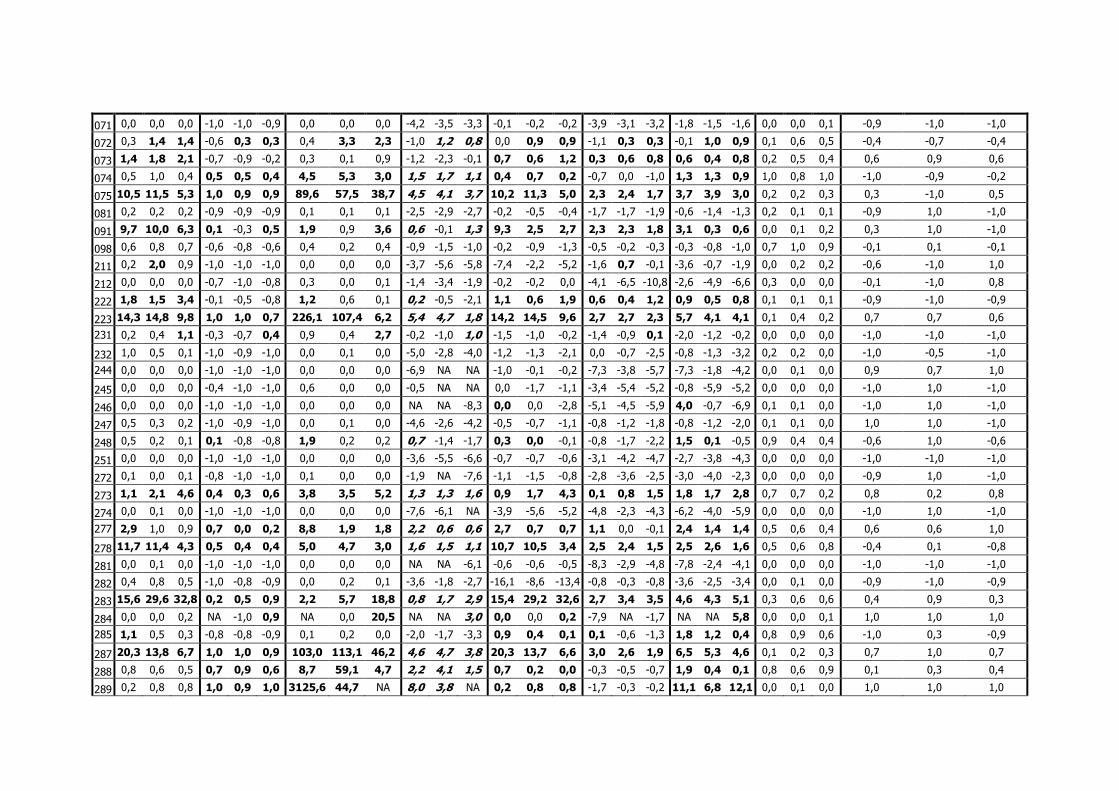
071 0,0 0,0 0,0 -1,0 -1,0 -0,9 0,0 0,0 0,0 -4,2 -3,5 -3,3 -0,1 -0,2 -0,2 -3,9 -3,1 -3,2 -1,8 -1,5 -1,6 0,0 0,0 0,1 -0,9 -1,0 -1,0
072 0,3 1,4 1,4 -0,6 0,3 0,3 0,4 3,3 2,3 -1,0 1,2 0,8 0,0 0,9 0,9 -1,1 0,3 0,3 -0,1 1,0 0,9 0,1 0,6 0,5 -0,4 -0,7 -0,4
073 1,4 1,8 2,1 -0,7 -0,9 -0,2 0,3 0,1 0,9 -1,2 -2,3 -0,1 0,7 0,6 1,2 0,3 0,6 0,8 0,6 0,4 0,8 0,2 0,5 0,4 0,6 0,9 0,6
074 0,5 1,0 0,4 0,5 0,5 0,4 4,5 5,3 3,0 1,5 1,7 1,1 0,4 0,7 0,2 -0,7 0,0 -1,0 1,3 1,3 0,9 1,0 0,8 1,0 -1,0 -0,9 -0,2
075 10,5 11,5 5,3 1,0 0,9 0,9 89,6 57,5 38,7 4,5 4,1 3,7 10,2 11,3 5,0 2,3 2,4 1,7 3,7 3,9 3,0 0,2 0,2 0,3 0,3 -1,0 0,5
081 0,2 0,2 0,2 -0,9 -0,9 -0,9 0,1 0,1 0,1 -2,5 -2,9 -2,7 -0,2 -0,5 -0,4 -1,7 -1,7 -1,9 -0,6 -1,4 -1,3 0,2 0,1 0,1 -0,9 1,0 -1,0
091 9,7 10,0 6,3 0,1 -0,3 0,5 1,9 0,9 3,6 0,6 -0,1 1,3 9,3 2,5 2,7 2,3 2,3 1,8 3,1 0,3 0,6 0,0 0,1 0,2 0,3 1,0 -1,0
098 0,6 0,8 0,7 -0,6 -0,8 -0,6 0,4 0,2 0,4 -0,9 -1,5 -1,0 -0,2 -0,9 -1,3 -0,5 -0,2 -0,3 -0,3 -0,8 -1,0 0,7 1,0 0,9 -0,1 0,1 -0,1
211 0,2 2,0 0,9 -1,0 -1,0 -1,0 0,0 0,0 0,0 -3,7 -5,6 -5,8 -7,4 -2,2 -5,2 -1,6 0,7 -0,1 -3,6 -0,7 -1,9 0,0 0,2 0,2 -0,6 -1,0 1,0
212 0,0 0,0 0,0 -0,7 -1,0 -0,8 0,3 0,0 0,1 -1,4 -3,4 -1,9 -0,2 -0,2 0,0 -4,1 -6,5 -10,8 -2,6 -4,9 -6,6 0,3 0,0 0,0 -0,1 -1,0 0,8
222 1,8 1,5 3,4 -0,1 -0,5 -0,8 1,2 0,6 0,1 0,2 -0,5 -2,1 1,1 0,6 1,9 0,6 0,4 1,2 0,9 0,5 0,8 0,1 0,1 0,1 -0,9 -1,0 -0,9
223 14,3 14,8 9,8 1,0 1,0 0,7 226,1 107,4 6,2 5,4 4,7 1,8 14,2 14,5 9,6 2,7 2,7 2,3 5,7 4,1 4,1 0,1 0,4 0,2 0,7 0,7 0,6
231 0,2 0,4 1,1 -0,3 -0,7 0,4 0,9 0,4 2,7 -0,2 -1,0 1,0 -1,5 -1,0 -0,2 -1,4 -0,9 0,1 -2,0 -1,2 -0,2 0,0 0,0 0,0 -1,0 -1,0 -1,0
232 1,0 0,5 0,1 -1,0 -0,9 -1,0 0,0 0,1 0,0 -5,0 -2,8 -4,0 -1,2 -1,3 -2,1 0,0 -0,7 -2,5 -0,8 -1,3 -3,2 0,2 0,2 0,0 -1,0 -0,5 -1,0
244 0,0 0,0 0,0 -1,0 -1,0 -1,0 0,0 0,0 0,0 -6,9 NA NA -1,0 -0,1 -0,2 -7,3 -3,8 -5,7 -7,3 -1,8 -4,2 0,0 0,1 0,0 0,9 0,7 1,0
245 0,0 0,0 0,0 -0,4 -1,0 -1,0 0,6 0,0 0,0 -0,5 NA NA 0,0 -1,7 -1,1 -3,4 -5,4 -5,2 -0,8 -5,9 -5,2 0,0 0,0 0,0 -1,0 1,0 -1,0
246 0,0 0,0 0,0 -1,0 -1,0 -1,0 0,0 0,0 0,0 NA NA -8,3 0,0 0,0 -2,8 -5,1 -4,5 -5,9 4,0 -0,7 -6,9 0,1 0,1 0,0 -1,0 1,0 -1,0
247 0,5 0,3 0,2 -1,0 -0,9 -1,0 0,0 0,1 0,0 -4,6 -2,6 -4,2 -0,5 -0,7 -1,1 -0,8 -1,2 -1,8 -0,8 -1,2 -2,0 0,1 0,1 0,0 1,0 1,0 -1,0
248 0,5 0,2 0,1 0,1 -0,8 -0,8 1,9 0,2 0,2 0,7 -1,4 -1,7 0,3 0,0 -0,1 -0,8 -1,7 -2,2 1,5 0,1 -0,5 0,9 0,4 0,4 -0,6 1,0 -0,6
251 0,0 0,0 0,0 -1,0 -1,0 -1,0 0,0 0,0 0,0 -3,6 -5,5 -6,6 -0,7 -0,7 -0,6 -3,1 -4,2 -4,7 -2,7 -3,8 -4,3 0,0 0,0 0,0 -1,0 -1,0 -1,0
272 0,1 0,0 0,1 -0,8 -1,0 -1,0 0,1 0,0 0,0 -1,9 NA -7,6 -1,1 -1,5 -0,8 -2,8 -3,6 -2,5 -3,0 -4,0 -2,3 0,0 0,0 0,0 -0,9 1,0 -1,0
273 1,1 2,1 4,6 0,4 0,3 0,6 3,8 3,5 5,2 1,3 1,3 1,6 0,9 1,7 4,3 0,1 0,8 1,5 1,8 1,7 2,8 0,7 0,7 0,2 0,8 0,2 0,8
274 0,0 0,1 0,0 -1,0 -1,0 -1,0 0,0 0,0 0,0 -7,6 -6,1 NA -3,9 -5,6 -5,2 -4,8 -2,3 -4,3 -6,2 -4,0 -5,9 0,0 0,0 0,0 -1,0 1,0 -1,0
277 2,9 1,0 0,9 0,7 0,0 0,2 8,8 1,9 1,8 2,2 0,6 0,6 2,7 0,7 0,7 1,1 0,0 -0,1 2,4 1,4 1,4 0,5 0,6 0,4 0,6 0,6 1,0
278 11,7 11,4 4,3 0,5 0,4 0,4 5,0 4,7 3,0 1,6 1,5 1,1 10,7 10,5 3,4 2,5 2,4 1,5 2,5 2,6 1,6 0,5 0,6 0,8 -0,4 0,1 -0,8
281 0,0 0,1 0,0 -1,0 -1,0 -1,0 0,0 0,0 0,0 NA NA -6,1 -0,6 -0,6 -0,5 -8,3 -2,9 -4,8 -7,8 -2,4 -4,1 0,0 0,0 0,0 -1,0 -1,0 -1,0
282 0,4 0,8 0,5 -1,0 -0,8 -0,9 0,0 0,2 0,1 -3,6 -1,8 -2,7 -16,1 -8,6 -13,4 -0,8 -0,3 -0,8 -3,6 -2,5 -3,4 0,0 0,1 0,0 -0,9 -1,0 -0,9
283 15,6 29,6 32,8 0,2 0,5 0,9 2,2 5,7 18,8 0,8 1,7 2,9 15,4 29,2 32,6 2,7 3,4 3,5 4,6 4,3 5,1 0,3 0,6 0,6 0,4 0,9 0,3
284 0,0 0,0 0,2 NA -1,0 0,9 NA 0,0 20,5 NA NA 3,0 0,0 0,0 0,2 -7,9 NA -1,7 NA NA 5,8 0,0 0,0 0,1 1,0 1,0 1,0
285 1,1 0,5 0,3 -0,8 -0,8 -0,9 0,1 0,2 0,0 -2,0 -1,7 -3,3 0,9 0,4 0,1 0,1 -0,6 -1,3 1,8 1,2 0,4 0,8 0,9 0,6 -1,0 0,3 -0,9
287 20,3 13,8 6,7 1,0 1,0 0,9 103,0 113,1 46,2 4,6 4,7 3,8 20,3 13,7 6,6 3,0 2,6 1,9 6,5 5,3 4,6 0,1 0,2 0,3 0,7 1,0 0,7
288 0,8 0,6 0,5 0,7 0,9 0,6 8,7 59,1 4,7 2,2 4,1 1,5 0,7 0,2 0,0 -0,3 -0,5 -0,7 1,9 0,4 0,1 0,8 0,6 0,9 0,1 0,3 0,4
289 0,2 0,8 0,8 1,0 0,9 1,0 3125,6 44,7 NA 8,0 3,8 NA 0,2 0,8 0,8 -1,7 -0,3 -0,2 11,1 6,8 12,1 0,0 0,1 0,0 1,0 1,0 1,0
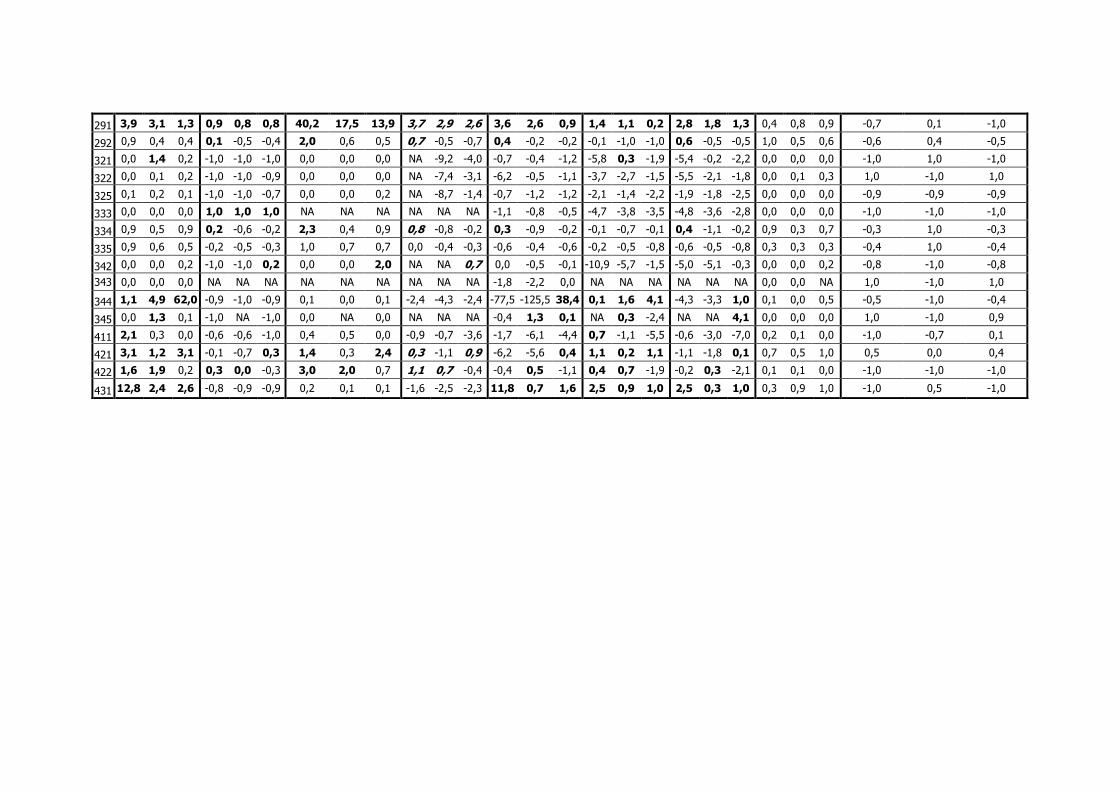
291 3,9 3,1 1,3 0,9 0,8 0,8 40,2 17,5 13,9 3,7 2,9 2,6 3,6 2,6 0,9 1,4 1,1 0,2 2,8 1,8 1,3 0,4 0,8 0,9 -0,7 0,1 -1,0
292 0,9 0,4 0,4 0,1 -0,5 -0,4 2,0 0,6 0,5 0,7 -0,5 -0,7 0,4 -0,2 -0,2 -0,1 -1,0 -1,0 0,6 -0,5 -0,5 1,0 0,5 0,6 -0,6 0,4 -0,5
321 0,0 1,4 0,2 -1,0 -1,0 -1,0 0,0 0,0 0,0 NA -9,2 -4,0 -0,7 -0,4 -1,2 -5,8 0,3 -1,9 -5,4 -0,2 -2,2 0,0 0,0 0,0 -1,0 1,0 -1,0
322 0,0 0,1 0,2 -1,0 -1,0 -0,9 0,0 0,0 0,0 NA -7,4 -3,1 -6,2 -0,5 -1,1 -3,7 -2,7 -1,5 -5,5 -2,1 -1,8 0,0 0,1 0,3 1,0 -1,0 1,0
325 0,1 0,2 0,1 -1,0 -1,0 -0,7 0,0 0,0 0,2 NA -8,7 -1,4 -0,7 -1,2 -1,2 -2,1 -1,4 -2,2 -1,9 -1,8 -2,5 0,0 0,0 0,0 -0,9 -0,9 -0,9
333 0,0 0,0 0,0 1,0 1,0 1,0 NA NA NA NA NA NA -1,1 -0,8 -0,5 -4,7 -3,8 -3,5 -4,8 -3,6 -2,8 0,0 0,0 0,0 -1,0 -1,0 -1,0
334 0,9 0,5 0,9 0,2 -0,6 -0,2 2,3 0,4 0,9 0,8 -0,8 -0,2 0,3 -0,9 -0,2 -0,1 -0,7 -0,1 0,4 -1,1 -0,2 0,9 0,3 0,7 -0,3 1,0 -0,3
335 0,9 0,6 0,5 -0,2 -0,5 -0,3 1,0 0,7 0,7 0,0 -0,4 -0,3 -0,6 -0,4 -0,6 -0,2 -0,5 -0,8 -0,6 -0,5 -0,8 0,3 0,3 0,3 -0,4 1,0 -0,4
342 0,0 0,0 0,2 -1,0 -1,0 0,2 0,0 0,0 2,0 NA NA 0,7 0,0 -0,5 -0,1 -10,9 -5,7 -1,5 -5,0 -5,1 -0,3 0,0 0,0 0,2 -0,8 -1,0 -0,8
343 0,0 0,0 0,0 NA NA NA NA NA NA NA NA NA -1,8 -2,2 0,0 NA NA NA NA NA NA 0,0 0,0 NA 1,0 -1,0 1,0
344 1,1 4,9 62,0 -0,9 -1,0 -0,9 0,1 0,0 0,1 -2,4 -4,3 -2,4 -77,5 -125,5 38,4 0,1 1,6 4,1 -4,3 -3,3 1,0 0,1 0,0 0,5 -0,5 -1,0 -0,4
345 0,0 1,3 0,1 -1,0 NA -1,0 0,0 NA 0,0 NA NA NA -0,4 1,3 0,1 NA 0,3 -2,4 NA NA 4,1 0,0 0,0 0,0 1,0 -1,0 0,9
411 2,1 0,3 0,0 -0,6 -0,6 -1,0 0,4 0,5 0,0 -0,9 -0,7 -3,6 -1,7 -6,1 -4,4 0,7 -1,1 -5,5 -0,6 -3,0 -7,0 0,2 0,1 0,0 -1,0 -0,7 0,1
421 3,1 1,2 3,1 -0,1 -0,7 0,3 1,4 0,3 2,4 0,3 -1,1 0,9 -6,2 -5,6 0,4 1,1 0,2 1,1 -1,1 -1,8 0,1 0,7 0,5 1,0 0,5 0,0 0,4
422 1,6 1,9 0,2 0,3 0,0 -0,3 3,0 2,0 0,7 1,1 0,7 -0,4 -0,4 0,5 -1,1 0,4 0,7 -1,9 -0,2 0,3 -2,1 0,1 0,1 0,0 -1,0 -1,0 -1,0
431 12,8 2,4 2,6 -0,8 -0,9 -0,9 0,2 0,1 0,1 -1,6 -2,5 -2,3 11,8 0,7 1,6 2,5 0,9 1,0 2,5 0,3 1,0 0,3 0,9 1,0 -1,0 0,5 -1,0
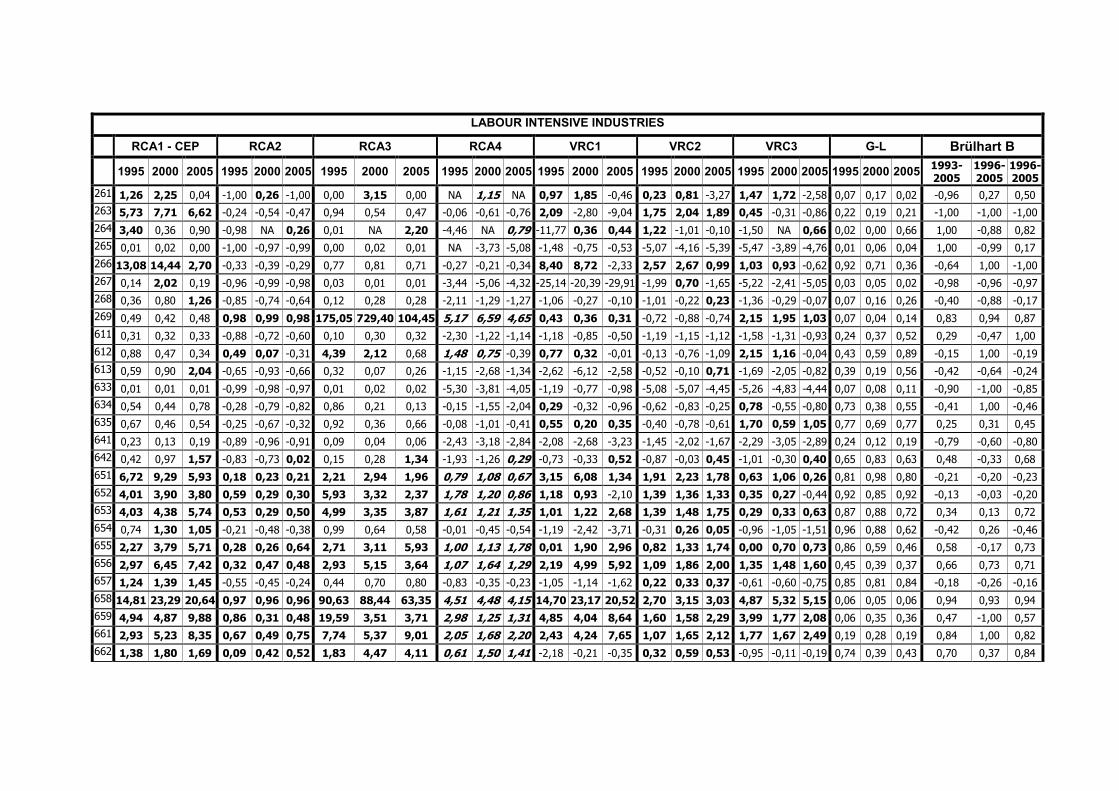
LABOUR INTENSIVE INDUSTRIES
RCA1 - CEP RCA2 RCA3 RCA4 VRC1 VRC2 VRC3 G-L Brülhart B
1995 2000 2005 1995 2000 2005 1995 2000 2005 1995 2000 2005 1995 2000 2005 1995 2000 2005 1995 2000 2005 1995 2000 2005 1993-2005
1996-2005
1996-2005
261 1,26 2,25 0,04 -1,00 0,26 -1,00 0,00 3,15 0,00 NA 1,15 NA 0,97 1,85 -0,46 0,23 0,81 -3,27 1,47 1,72 -2,58 0,07 0,17 0,02 -0,96 0,27 0,50263 5,73 7,71 6,62 -0,24 -0,54 -0,47 0,94 0,54 0,47 -0,06 -0,61 -0,76 2,09 -2,80 -9,04 1,75 2,04 1,89 0,45 -0,31 -0,86 0,22 0,19 0,21 -1,00 -1,00 -1,00264 3,40 0,36 0,90 -0,98 NA 0,26 0,01 NA 2,20 -4,46 NA 0,79 -11,77 0,36 0,44 1,22 -1,01 -0,10 -1,50 NA 0,66 0,02 0,00 0,66 1,00 -0,88 0,82265 0,01 0,02 0,00 -1,00 -0,97 -0,99 0,00 0,02 0,01 NA -3,73 -5,08 -1,48 -0,75 -0,53 -5,07 -4,16 -5,39 -5,47 -3,89 -4,76 0,01 0,06 0,04 1,00 -0,99 0,17266 13,08 14,44 2,70 -0,33 -0,39 -0,29 0,77 0,81 0,71 -0,27 -0,21 -0,34 8,40 8,72 -2,33 2,57 2,67 0,99 1,03 0,93 -0,62 0,92 0,71 0,36 -0,64 1,00 -1,00267 0,14 2,02 0,19 -0,96 -0,99 -0,98 0,03 0,01 0,01 -3,44 -5,06 -4,32 -25,14 -20,39 -29,91 -1,99 0,70 -1,65 -5,22 -2,41 -5,05 0,03 0,05 0,02 -0,98 -0,96 -0,97268 0,36 0,80 1,26 -0,85 -0,74 -0,64 0,12 0,28 0,28 -2,11 -1,29 -1,27 -1,06 -0,27 -0,10 -1,01 -0,22 0,23 -1,36 -0,29 -0,07 0,07 0,16 0,26 -0,40 -0,88 -0,17269 0,49 0,42 0,48 0,98 0,99 0,98 175,05 729,40 104,45 5,17 6,59 4,65 0,43 0,36 0,31 -0,72 -0,88 -0,74 2,15 1,95 1,03 0,07 0,04 0,14 0,83 0,94 0,87611 0,31 0,32 0,33 -0,88 -0,72 -0,60 0,10 0,30 0,32 -2,30 -1,22 -1,14 -1,18 -0,85 -0,50 -1,19 -1,15 -1,12 -1,58 -1,31 -0,93 0,24 0,37 0,52 0,29 -0,47 1,00612 0,88 0,47 0,34 0,49 0,07 -0,31 4,39 2,12 0,68 1,48 0,75 -0,39 0,77 0,32 -0,01 -0,13 -0,76 -1,09 2,15 1,16 -0,04 0,43 0,59 0,89 -0,15 1,00 -0,19613 0,59 0,90 2,04 -0,65 -0,93 -0,66 0,32 0,07 0,26 -1,15 -2,68 -1,34 -2,62 -6,12 -2,58 -0,52 -0,10 0,71 -1,69 -2,05 -0,82 0,39 0,19 0,56 -0,42 -0,64 -0,24633 0,01 0,01 0,01 -0,99 -0,98 -0,97 0,01 0,02 0,02 -5,30 -3,81 -4,05 -1,19 -0,77 -0,98 -5,08 -5,07 -4,45 -5,26 -4,83 -4,44 0,07 0,08 0,11 -0,90 -1,00 -0,85634 0,54 0,44 0,78 -0,28 -0,79 -0,82 0,86 0,21 0,13 -0,15 -1,55 -2,04 0,29 -0,32 -0,96 -0,62 -0,83 -0,25 0,78 -0,55 -0,80 0,73 0,38 0,55 -0,41 1,00 -0,46635 0,67 0,46 0,54 -0,25 -0,67 -0,32 0,92 0,36 0,66 -0,08 -1,01 -0,41 0,55 0,20 0,35 -0,40 -0,78 -0,61 1,70 0,59 1,05 0,77 0,69 0,77 0,25 0,31 0,45641 0,23 0,13 0,19 -0,89 -0,96 -0,91 0,09 0,04 0,06 -2,43 -3,18 -2,84 -2,08 -2,68 -3,23 -1,45 -2,02 -1,67 -2,29 -3,05 -2,89 0,24 0,12 0,19 -0,79 -0,60 -0,80642 0,42 0,97 1,57 -0,83 -0,73 0,02 0,15 0,28 1,34 -1,93 -1,26 0,29 -0,73 -0,33 0,52 -0,87 -0,03 0,45 -1,01 -0,30 0,40 0,65 0,83 0,63 0,48 -0,33 0,68651 6,72 9,29 5,93 0,18 0,23 0,21 2,21 2,94 1,96 0,79 1,08 0,67 3,15 6,08 1,34 1,91 2,23 1,78 0,63 1,06 0,26 0,81 0,98 0,80 -0,21 -0,20 -0,23652 4,01 3,90 3,80 0,59 0,29 0,30 5,93 3,32 2,37 1,78 1,20 0,86 1,18 0,93 -2,10 1,39 1,36 1,33 0,35 0,27 -0,44 0,92 0,85 0,92 -0,13 -0,03 -0,20653 4,03 4,38 5,74 0,53 0,29 0,50 4,99 3,35 3,87 1,61 1,21 1,35 1,01 1,22 2,68 1,39 1,48 1,75 0,29 0,33 0,63 0,87 0,88 0,72 0,34 0,13 0,72654 0,74 1,30 1,05 -0,21 -0,48 -0,38 0,99 0,64 0,58 -0,01 -0,45 -0,54 -1,19 -2,42 -3,71 -0,31 0,26 0,05 -0,96 -1,05 -1,51 0,96 0,88 0,62 -0,42 0,26 -0,46655 2,27 3,79 5,71 0,28 0,26 0,64 2,71 3,11 5,93 1,00 1,13 1,78 0,01 1,90 2,96 0,82 1,33 1,74 0,00 0,70 0,73 0,86 0,59 0,46 0,58 -0,17 0,73656 2,97 6,45 7,42 0,32 0,47 0,48 2,93 5,15 3,64 1,07 1,64 1,29 2,19 4,99 5,92 1,09 1,86 2,00 1,35 1,48 1,60 0,45 0,39 0,37 0,66 0,73 0,71657 1,24 1,39 1,45 -0,55 -0,45 -0,24 0,44 0,70 0,80 -0,83 -0,35 -0,23 -1,05 -1,14 -1,62 0,22 0,33 0,37 -0,61 -0,60 -0,75 0,85 0,81 0,84 -0,18 -0,26 -0,16658 14,81 23,29 20,64 0,97 0,96 0,96 90,63 88,44 63,35 4,51 4,48 4,15 14,70 23,17 20,52 2,70 3,15 3,03 4,87 5,32 5,15 0,06 0,05 0,06 0,94 0,93 0,94659 4,94 4,87 9,88 0,86 0,31 0,48 19,59 3,51 3,71 2,98 1,25 1,31 4,85 4,04 8,64 1,60 1,58 2,29 3,99 1,77 2,08 0,06 0,35 0,36 0,47 -1,00 0,57661 2,93 5,23 8,35 0,67 0,49 0,75 7,74 5,37 9,01 2,05 1,68 2,20 2,43 4,24 7,65 1,07 1,65 2,12 1,77 1,67 2,49 0,19 0,28 0,19 0,84 1,00 0,82662 1,38 1,80 1,69 0,09 0,42 0,52 1,83 4,47 4,11 0,61 1,50 1,41 -2,18 -0,21 -0,35 0,32 0,59 0,53 -0,95 -0,11 -0,19 0,74 0,39 0,43 0,70 0,37 0,84
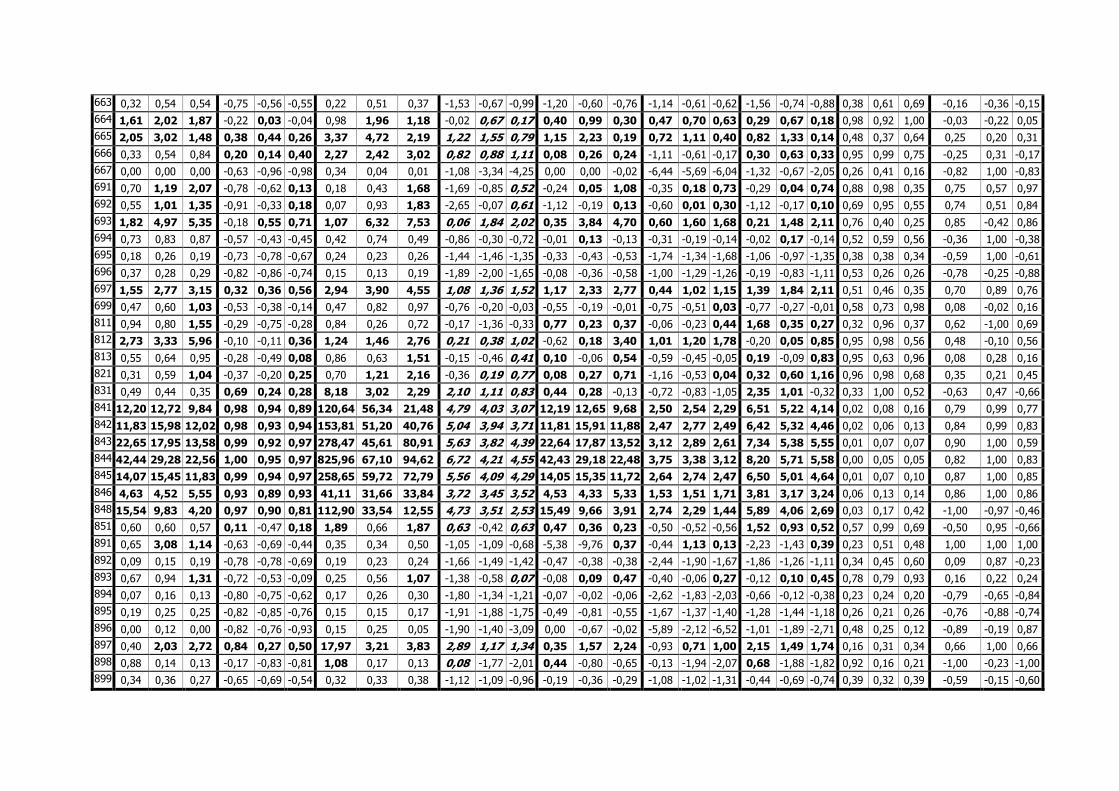
663 0,32 0,54 0,54 -0,75 -0,56 -0,55 0,22 0,51 0,37 -1,53 -0,67 -0,99 -1,20 -0,60 -0,76 -1,14 -0,61 -0,62 -1,56 -0,74 -0,88 0,38 0,61 0,69 -0,16 -0,36 -0,15664 1,61 2,02 1,87 -0,22 0,03 -0,04 0,98 1,96 1,18 -0,02 0,67 0,17 0,40 0,99 0,30 0,47 0,70 0,63 0,29 0,67 0,18 0,98 0,92 1,00 -0,03 -0,22 0,05665 2,05 3,02 1,48 0,38 0,44 0,26 3,37 4,72 2,19 1,22 1,55 0,79 1,15 2,23 0,19 0,72 1,11 0,40 0,82 1,33 0,14 0,48 0,37 0,64 0,25 0,20 0,31666 0,33 0,54 0,84 0,20 0,14 0,40 2,27 2,42 3,02 0,82 0,88 1,11 0,08 0,26 0,24 -1,11 -0,61 -0,17 0,30 0,63 0,33 0,95 0,99 0,75 -0,25 0,31 -0,17667 0,00 0,00 0,00 -0,63 -0,96 -0,98 0,34 0,04 0,01 -1,08 -3,34 -4,25 0,00 0,00 -0,02 -6,44 -5,69 -6,04 -1,32 -0,67 -2,05 0,26 0,41 0,16 -0,82 1,00 -0,83691 0,70 1,19 2,07 -0,78 -0,62 0,13 0,18 0,43 1,68 -1,69 -0,85 0,52 -0,24 0,05 1,08 -0,35 0,18 0,73 -0,29 0,04 0,74 0,88 0,98 0,35 0,75 0,57 0,97692 0,55 1,01 1,35 -0,91 -0,33 0,18 0,07 0,93 1,83 -2,65 -0,07 0,61 -1,12 -0,19 0,13 -0,60 0,01 0,30 -1,12 -0,17 0,10 0,69 0,95 0,55 0,74 0,51 0,84693 1,82 4,97 5,35 -0,18 0,55 0,71 1,07 6,32 7,53 0,06 1,84 2,02 0,35 3,84 4,70 0,60 1,60 1,68 0,21 1,48 2,11 0,76 0,40 0,25 0,85 -0,42 0,86694 0,73 0,83 0,87 -0,57 -0,43 -0,45 0,42 0,74 0,49 -0,86 -0,30 -0,72 -0,01 0,13 -0,13 -0,31 -0,19 -0,14 -0,02 0,17 -0,14 0,52 0,59 0,56 -0,36 1,00 -0,38695 0,18 0,26 0,19 -0,73 -0,78 -0,67 0,24 0,23 0,26 -1,44 -1,46 -1,35 -0,33 -0,43 -0,53 -1,74 -1,34 -1,68 -1,06 -0,97 -1,35 0,38 0,38 0,34 -0,59 1,00 -0,61696 0,37 0,28 0,29 -0,82 -0,86 -0,74 0,15 0,13 0,19 -1,89 -2,00 -1,65 -0,08 -0,36 -0,58 -1,00 -1,29 -1,26 -0,19 -0,83 -1,11 0,53 0,26 0,26 -0,78 -0,25 -0,88697 1,55 2,77 3,15 0,32 0,36 0,56 2,94 3,90 4,55 1,08 1,36 1,52 1,17 2,33 2,77 0,44 1,02 1,15 1,39 1,84 2,11 0,51 0,46 0,35 0,70 0,89 0,76699 0,47 0,60 1,03 -0,53 -0,38 -0,14 0,47 0,82 0,97 -0,76 -0,20 -0,03 -0,55 -0,19 -0,01 -0,75 -0,51 0,03 -0,77 -0,27 -0,01 0,58 0,73 0,98 0,08 -0,02 0,16811 0,94 0,80 1,55 -0,29 -0,75 -0,28 0,84 0,26 0,72 -0,17 -1,36 -0,33 0,77 0,23 0,37 -0,06 -0,23 0,44 1,68 0,35 0,27 0,32 0,96 0,37 0,62 -1,00 0,69812 2,73 3,33 5,96 -0,10 -0,11 0,36 1,24 1,46 2,76 0,21 0,38 1,02 -0,62 0,18 3,40 1,01 1,20 1,78 -0,20 0,05 0,85 0,95 0,98 0,56 0,48 -0,10 0,56813 0,55 0,64 0,95 -0,28 -0,49 0,08 0,86 0,63 1,51 -0,15 -0,46 0,41 0,10 -0,06 0,54 -0,59 -0,45 -0,05 0,19 -0,09 0,83 0,95 0,63 0,96 0,08 0,28 0,16821 0,31 0,59 1,04 -0,37 -0,20 0,25 0,70 1,21 2,16 -0,36 0,19 0,77 0,08 0,27 0,71 -1,16 -0,53 0,04 0,32 0,60 1,16 0,96 0,98 0,68 0,35 0,21 0,45831 0,49 0,44 0,35 0,69 0,24 0,28 8,18 3,02 2,29 2,10 1,11 0,83 0,44 0,28 -0,13 -0,72 -0,83 -1,05 2,35 1,01 -0,32 0,33 1,00 0,52 -0,63 0,47 -0,66841 12,20 12,72 9,84 0,98 0,94 0,89 120,64 56,34 21,48 4,79 4,03 3,07 12,19 12,65 9,68 2,50 2,54 2,29 6,51 5,22 4,14 0,02 0,08 0,16 0,79 0,99 0,77842 11,83 15,98 12,02 0,98 0,93 0,94 153,81 51,20 40,76 5,04 3,94 3,71 11,81 15,91 11,88 2,47 2,77 2,49 6,42 5,32 4,46 0,02 0,06 0,13 0,84 0,99 0,83843 22,65 17,95 13,58 0,99 0,92 0,97 278,47 45,61 80,91 5,63 3,82 4,39 22,64 17,87 13,52 3,12 2,89 2,61 7,34 5,38 5,55 0,01 0,07 0,07 0,90 1,00 0,59844 42,44 29,28 22,56 1,00 0,95 0,97 825,96 67,10 94,62 6,72 4,21 4,55 42,43 29,18 22,48 3,75 3,38 3,12 8,20 5,71 5,58 0,00 0,05 0,05 0,82 1,00 0,83845 14,07 15,45 11,83 0,99 0,94 0,97 258,65 59,72 72,79 5,56 4,09 4,29 14,05 15,35 11,72 2,64 2,74 2,47 6,50 5,01 4,64 0,01 0,07 0,10 0,87 1,00 0,85846 4,63 4,52 5,55 0,93 0,89 0,93 41,11 31,66 33,84 3,72 3,45 3,52 4,53 4,33 5,33 1,53 1,51 1,71 3,81 3,17 3,24 0,06 0,13 0,14 0,86 1,00 0,86848 15,54 9,83 4,20 0,97 0,90 0,81 112,90 33,54 12,55 4,73 3,51 2,53 15,49 9,66 3,91 2,74 2,29 1,44 5,89 4,06 2,69 0,03 0,17 0,42 -1,00 -0,97 -0,46851 0,60 0,60 0,57 0,11 -0,47 0,18 1,89 0,66 1,87 0,63 -0,42 0,63 0,47 0,36 0,23 -0,50 -0,52 -0,56 1,52 0,93 0,52 0,57 0,99 0,69 -0,50 0,95 -0,66891 0,65 3,08 1,14 -0,63 -0,69 -0,44 0,35 0,34 0,50 -1,05 -1,09 -0,68 -5,38 -9,76 0,37 -0,44 1,13 0,13 -2,23 -1,43 0,39 0,23 0,51 0,48 1,00 1,00 1,00892 0,09 0,15 0,19 -0,78 -0,78 -0,69 0,19 0,23 0,24 -1,66 -1,49 -1,42 -0,47 -0,38 -0,38 -2,44 -1,90 -1,67 -1,86 -1,26 -1,11 0,34 0,45 0,60 0,09 0,87 -0,23893 0,67 0,94 1,31 -0,72 -0,53 -0,09 0,25 0,56 1,07 -1,38 -0,58 0,07 -0,08 0,09 0,47 -0,40 -0,06 0,27 -0,12 0,10 0,45 0,78 0,79 0,93 0,16 0,22 0,24894 0,07 0,16 0,13 -0,80 -0,75 -0,62 0,17 0,26 0,30 -1,80 -1,34 -1,21 -0,07 -0,02 -0,06 -2,62 -1,83 -2,03 -0,66 -0,12 -0,38 0,23 0,24 0,20 -0,79 -0,65 -0,84895 0,19 0,25 0,25 -0,82 -0,85 -0,76 0,15 0,15 0,17 -1,91 -1,88 -1,75 -0,49 -0,81 -0,55 -1,67 -1,37 -1,40 -1,28 -1,44 -1,18 0,26 0,21 0,26 -0,76 -0,88 -0,74896 0,00 0,12 0,00 -0,82 -0,76 -0,93 0,15 0,25 0,05 -1,90 -1,40 -3,09 0,00 -0,67 -0,02 -5,89 -2,12 -6,52 -1,01 -1,89 -2,71 0,48 0,25 0,12 -0,89 -0,19 0,87897 0,40 2,03 2,72 0,84 0,27 0,50 17,97 3,21 3,83 2,89 1,17 1,34 0,35 1,57 2,24 -0,93 0,71 1,00 2,15 1,49 1,74 0,16 0,31 0,34 0,66 1,00 0,66898 0,88 0,14 0,13 -0,17 -0,83 -0,81 1,08 0,17 0,13 0,08 -1,77 -2,01 0,44 -0,80 -0,65 -0,13 -1,94 -2,07 0,68 -1,88 -1,82 0,92 0,16 0,21 -1,00 -0,23 -1,00899 0,34 0,36 0,27 -0,65 -0,69 -0,54 0,32 0,33 0,38 -1,12 -1,09 -0,96 -0,19 -0,36 -0,29 -1,08 -1,02 -1,31 -0,44 -0,69 -0,74 0,39 0,32 0,39 -0,59 -0,15 -0,60
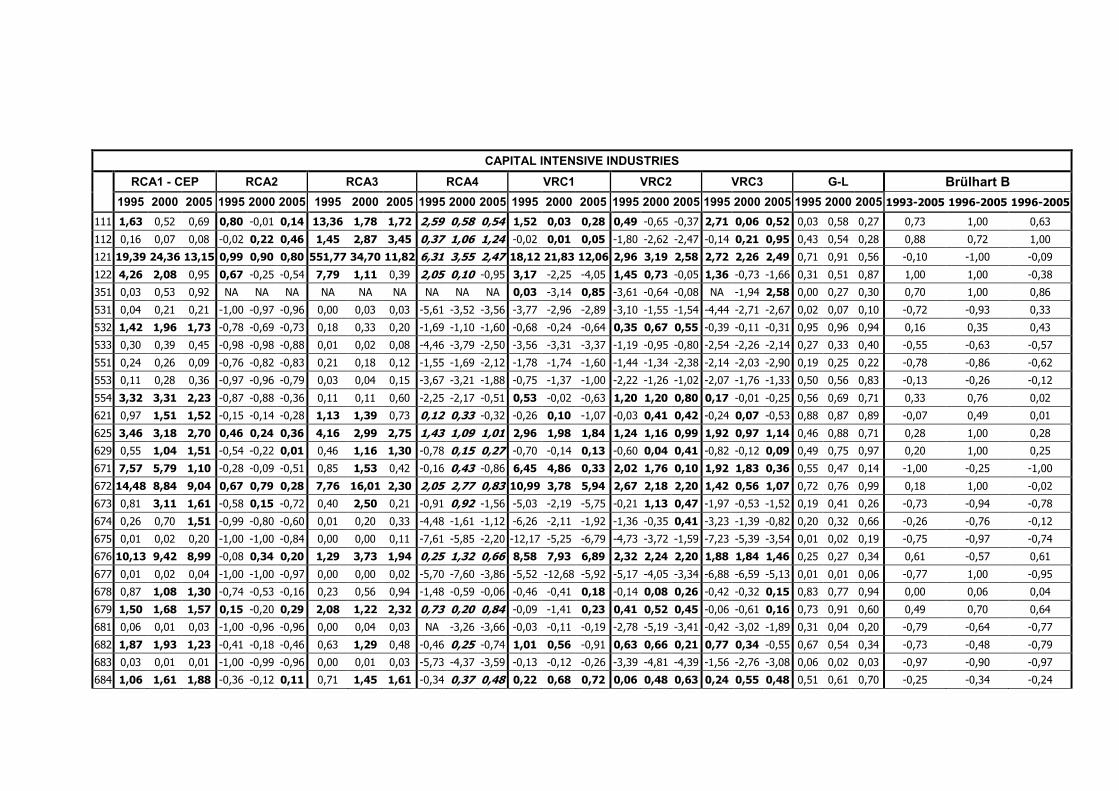
CAPITAL INTENSIVE INDUSTRIES
RCA1 - CEP RCA2 RCA3 RCA4 VRC1 VRC2 VRC3 G-L Brülhart B1995 2000 2005 1995 2000 2005 1995 2000 2005 1995 2000 2005 1995 2000 2005 1995 2000 2005 1995 2000 2005 1995 2000 2005 1993-2005 1996-2005 1996-2005
111 1,63 0,52 0,69 0,80 -0,01 0,14 13,36 1,78 1,72 2,59 0,58 0,54 1,52 0,03 0,28 0,49 -0,65 -0,37 2,71 0,06 0,52 0,03 0,58 0,27 0,73 1,00 0,63
112 0,16 0,07 0,08 -0,02 0,22 0,46 1,45 2,87 3,45 0,37 1,06 1,24 -0,02 0,01 0,05 -1,80 -2,62 -2,47 -0,14 0,21 0,95 0,43 0,54 0,28 0,88 0,72 1,00
121 19,39 24,36 13,15 0,99 0,90 0,80 551,77 34,70 11,82 6,31 3,55 2,47 18,12 21,83 12,06 2,96 3,19 2,58 2,72 2,26 2,49 0,71 0,91 0,56 -0,10 -1,00 -0,09
122 4,26 2,08 0,95 0,67 -0,25 -0,54 7,79 1,11 0,39 2,05 0,10 -0,95 3,17 -2,25 -4,05 1,45 0,73 -0,05 1,36 -0,73 -1,66 0,31 0,51 0,87 1,00 1,00 -0,38
351 0,03 0,53 0,92 NA NA NA NA NA NA NA NA NA 0,03 -3,14 0,85 -3,61 -0,64 -0,08 NA -1,94 2,58 0,00 0,27 0,30 0,70 1,00 0,86
531 0,04 0,21 0,21 -1,00 -0,97 -0,96 0,00 0,03 0,03 -5,61 -3,52 -3,56 -3,77 -2,96 -2,89 -3,10 -1,55 -1,54 -4,44 -2,71 -2,67 0,02 0,07 0,10 -0,72 -0,93 0,33
532 1,42 1,96 1,73 -0,78 -0,69 -0,73 0,18 0,33 0,20 -1,69 -1,10 -1,60 -0,68 -0,24 -0,64 0,35 0,67 0,55 -0,39 -0,11 -0,31 0,95 0,96 0,94 0,16 0,35 0,43
533 0,30 0,39 0,45 -0,98 -0,98 -0,88 0,01 0,02 0,08 -4,46 -3,79 -2,50 -3,56 -3,31 -3,37 -1,19 -0,95 -0,80 -2,54 -2,26 -2,14 0,27 0,33 0,40 -0,55 -0,63 -0,57
551 0,24 0,26 0,09 -0,76 -0,82 -0,83 0,21 0,18 0,12 -1,55 -1,69 -2,12 -1,78 -1,74 -1,60 -1,44 -1,34 -2,38 -2,14 -2,03 -2,90 0,19 0,25 0,22 -0,78 -0,86 -0,62
553 0,11 0,28 0,36 -0,97 -0,96 -0,79 0,03 0,04 0,15 -3,67 -3,21 -1,88 -0,75 -1,37 -1,00 -2,22 -1,26 -1,02 -2,07 -1,76 -1,33 0,50 0,56 0,83 -0,13 -0,26 -0,12
554 3,32 3,31 2,23 -0,87 -0,88 -0,36 0,11 0,11 0,60 -2,25 -2,17 -0,51 0,53 -0,02 -0,63 1,20 1,20 0,80 0,17 -0,01 -0,25 0,56 0,69 0,71 0,33 0,76 0,02
621 0,97 1,51 1,52 -0,15 -0,14 -0,28 1,13 1,39 0,73 0,12 0,33 -0,32 -0,26 0,10 -1,07 -0,03 0,41 0,42 -0,24 0,07 -0,53 0,88 0,87 0,89 -0,07 0,49 0,01
625 3,46 3,18 2,70 0,46 0,24 0,36 4,16 2,99 2,75 1,43 1,09 1,01 2,96 1,98 1,84 1,24 1,16 0,99 1,92 0,97 1,14 0,46 0,88 0,71 0,28 1,00 0,28
629 0,55 1,04 1,51 -0,54 -0,22 0,01 0,46 1,16 1,30 -0,78 0,15 0,27 -0,70 -0,14 0,13 -0,60 0,04 0,41 -0,82 -0,12 0,09 0,49 0,75 0,97 0,20 1,00 0,25
671 7,57 5,79 1,10 -0,28 -0,09 -0,51 0,85 1,53 0,42 -0,16 0,43 -0,86 6,45 4,86 0,33 2,02 1,76 0,10 1,92 1,83 0,36 0,55 0,47 0,14 -1,00 -0,25 -1,00
672 14,48 8,84 9,04 0,67 0,79 0,28 7,76 16,01 2,30 2,05 2,77 0,83 10,99 3,78 5,94 2,67 2,18 2,20 1,42 0,56 1,07 0,72 0,76 0,99 0,18 1,00 -0,02
673 0,81 3,11 1,61 -0,58 0,15 -0,72 0,40 2,50 0,21 -0,91 0,92 -1,56 -5,03 -2,19 -5,75 -0,21 1,13 0,47 -1,97 -0,53 -1,52 0,19 0,41 0,26 -0,73 -0,94 -0,78
674 0,26 0,70 1,51 -0,99 -0,80 -0,60 0,01 0,20 0,33 -4,48 -1,61 -1,12 -6,26 -2,11 -1,92 -1,36 -0,35 0,41 -3,23 -1,39 -0,82 0,20 0,32 0,66 -0,26 -0,76 -0,12
675 0,01 0,02 0,20 -1,00 -1,00 -0,84 0,00 0,00 0,11 -7,61 -5,85 -2,20 -12,17 -5,25 -6,79 -4,73 -3,72 -1,59 -7,23 -5,39 -3,54 0,01 0,02 0,19 -0,75 -0,97 -0,74
676 10,13 9,42 8,99 -0,08 0,34 0,20 1,29 3,73 1,94 0,25 1,32 0,66 8,58 7,93 6,89 2,32 2,24 2,20 1,88 1,84 1,46 0,25 0,27 0,34 0,61 -0,57 0,61
677 0,01 0,02 0,04 -1,00 -1,00 -0,97 0,00 0,00 0,02 -5,70 -7,60 -3,86 -5,52 -12,68 -5,92 -5,17 -4,05 -3,34 -6,88 -6,59 -5,13 0,01 0,01 0,06 -0,77 1,00 -0,95
678 0,87 1,08 1,30 -0,74 -0,53 -0,16 0,23 0,56 0,94 -1,48 -0,59 -0,06 -0,46 -0,41 0,18 -0,14 0,08 0,26 -0,42 -0,32 0,15 0,83 0,77 0,94 0,00 0,06 0,04
679 1,50 1,68 1,57 0,15 -0,20 0,29 2,08 1,22 2,32 0,73 0,20 0,84 -0,09 -1,41 0,23 0,41 0,52 0,45 -0,06 -0,61 0,16 0,73 0,91 0,60 0,49 0,70 0,64
681 0,06 0,01 0,03 -1,00 -0,96 -0,96 0,00 0,04 0,03 NA -3,26 -3,66 -0,03 -0,11 -0,19 -2,78 -5,19 -3,41 -0,42 -3,02 -1,89 0,31 0,04 0,20 -0,79 -0,64 -0,77
682 1,87 1,93 1,23 -0,41 -0,18 -0,46 0,63 1,29 0,48 -0,46 0,25 -0,74 1,01 0,56 -0,91 0,63 0,66 0,21 0,77 0,34 -0,55 0,67 0,54 0,34 -0,73 -0,48 -0,79
683 0,03 0,01 0,01 -1,00 -0,99 -0,96 0,00 0,01 0,03 -5,73 -4,37 -3,59 -0,13 -0,12 -0,26 -3,39 -4,81 -4,39 -1,56 -2,76 -3,08 0,06 0,02 0,03 -0,97 -0,90 -0,97
684 1,06 1,61 1,88 -0,36 -0,12 0,11 0,71 1,45 1,61 -0,34 0,37 0,48 0,22 0,68 0,72 0,06 0,48 0,63 0,24 0,55 0,48 0,51 0,61 0,70 -0,25 -0,34 -0,24
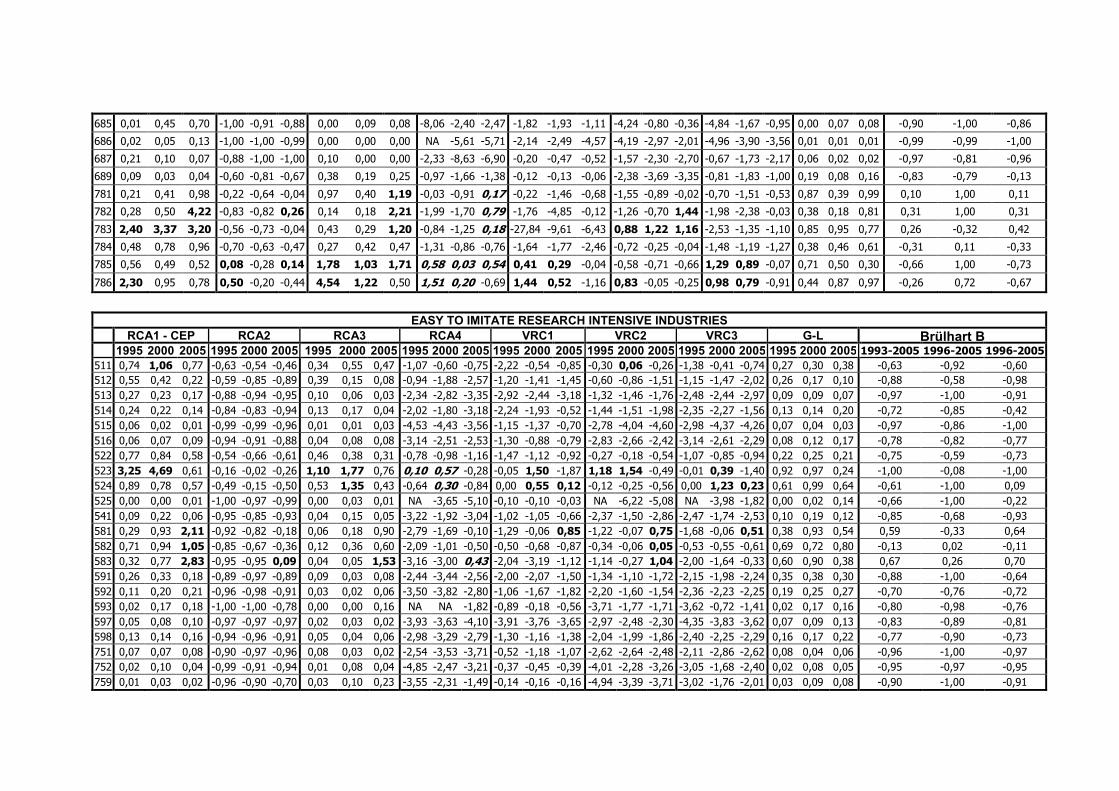
685 0,01 0,45 0,70 -1,00 -0,91 -0,88 0,00 0,09 0,08 -8,06 -2,40 -2,47 -1,82 -1,93 -1,11 -4,24 -0,80 -0,36 -4,84 -1,67 -0,95 0,00 0,07 0,08 -0,90 -1,00 -0,86
686 0,02 0,05 0,13 -1,00 -1,00 -0,99 0,00 0,00 0,00 NA -5,61 -5,71 -2,14 -2,49 -4,57 -4,19 -2,97 -2,01 -4,96 -3,90 -3,56 0,01 0,01 0,01 -0,99 -0,99 -1,00
687 0,21 0,10 0,07 -0,88 -1,00 -1,00 0,10 0,00 0,00 -2,33 -8,63 -6,90 -0,20 -0,47 -0,52 -1,57 -2,30 -2,70 -0,67 -1,73 -2,17 0,06 0,02 0,02 -0,97 -0,81 -0,96
689 0,09 0,03 0,04 -0,60 -0,81 -0,67 0,38 0,19 0,25 -0,97 -1,66 -1,38 -0,12 -0,13 -0,06 -2,38 -3,69 -3,35 -0,81 -1,83 -1,00 0,19 0,08 0,16 -0,83 -0,79 -0,13
781 0,21 0,41 0,98 -0,22 -0,64 -0,04 0,97 0,40 1,19 -0,03 -0,91 0,17 -0,22 -1,46 -0,68 -1,55 -0,89 -0,02 -0,70 -1,51 -0,53 0,87 0,39 0,99 0,10 1,00 0,11
782 0,28 0,50 4,22 -0,83 -0,82 0,26 0,14 0,18 2,21 -1,99 -1,70 0,79 -1,76 -4,85 -0,12 -1,26 -0,70 1,44 -1,98 -2,38 -0,03 0,38 0,18 0,81 0,31 1,00 0,31
783 2,40 3,37 3,20 -0,56 -0,73 -0,04 0,43 0,29 1,20 -0,84 -1,25 0,18 -27,84 -9,61 -6,43 0,88 1,22 1,16 -2,53 -1,35 -1,10 0,85 0,95 0,77 0,26 -0,32 0,42
784 0,48 0,78 0,96 -0,70 -0,63 -0,47 0,27 0,42 0,47 -1,31 -0,86 -0,76 -1,64 -1,77 -2,46 -0,72 -0,25 -0,04 -1,48 -1,19 -1,27 0,38 0,46 0,61 -0,31 0,11 -0,33
785 0,56 0,49 0,52 0,08 -0,28 0,14 1,78 1,03 1,71 0,58 0,03 0,54 0,41 0,29 -0,04 -0,58 -0,71 -0,66 1,29 0,89 -0,07 0,71 0,50 0,30 -0,66 1,00 -0,73
786 2,30 0,95 0,78 0,50 -0,20 -0,44 4,54 1,22 0,50 1,51 0,20 -0,69 1,44 0,52 -1,16 0,83 -0,05 -0,25 0,98 0,79 -0,91 0,44 0,87 0,97 -0,26 0,72 -0,67
EASY TO IMITATE RESEARCH INTENSIVE INDUSTRIESRCA1 - CEP RCA2 RCA3 RCA4 VRC1 VRC2 VRC3 G-L Brülhart B
1995 2000 2005 1995 2000 2005 1995 2000 2005 1995 2000 2005 1995 2000 2005 1995 2000 2005 1995 2000 2005 1995 2000 2005 1993-2005 1996-2005 1996-2005511 0,74 1,06 0,77 -0,63 -0,54 -0,46 0,34 0,55 0,47 -1,07 -0,60 -0,75 -2,22 -0,54 -0,85 -0,30 0,06 -0,26 -1,38 -0,41 -0,74 0,27 0,30 0,38 -0,63 -0,92 -0,60512 0,55 0,42 0,22 -0,59 -0,85 -0,89 0,39 0,15 0,08 -0,94 -1,88 -2,57 -1,20 -1,41 -1,45 -0,60 -0,86 -1,51 -1,15 -1,47 -2,02 0,26 0,17 0,10 -0,88 -0,58 -0,98513 0,27 0,23 0,17 -0,88 -0,94 -0,95 0,10 0,06 0,03 -2,34 -2,82 -3,35 -2,92 -2,44 -3,18 -1,32 -1,46 -1,76 -2,48 -2,44 -2,97 0,09 0,09 0,07 -0,97 -1,00 -0,91514 0,24 0,22 0,14 -0,84 -0,83 -0,94 0,13 0,17 0,04 -2,02 -1,80 -3,18 -2,24 -1,93 -0,52 -1,44 -1,51 -1,98 -2,35 -2,27 -1,56 0,13 0,14 0,20 -0,72 -0,85 -0,42515 0,06 0,02 0,01 -0,99 -0,99 -0,96 0,01 0,01 0,03 -4,53 -4,43 -3,56 -1,15 -1,37 -0,70 -2,78 -4,04 -4,60 -2,98 -4,37 -4,26 0,07 0,04 0,03 -0,97 -0,86 -1,00516 0,06 0,07 0,09 -0,94 -0,91 -0,88 0,04 0,08 0,08 -3,14 -2,51 -2,53 -1,30 -0,88 -0,79 -2,83 -2,66 -2,42 -3,14 -2,61 -2,29 0,08 0,12 0,17 -0,78 -0,82 -0,77522 0,77 0,84 0,58 -0,54 -0,66 -0,61 0,46 0,38 0,31 -0,78 -0,98 -1,16 -1,47 -1,12 -0,92 -0,27 -0,18 -0,54 -1,07 -0,85 -0,94 0,22 0,25 0,21 -0,75 -0,59 -0,73523 3,25 4,69 0,61 -0,16 -0,02 -0,26 1,10 1,77 0,76 0,10 0,57 -0,28 -0,05 1,50 -1,87 1,18 1,54 -0,49 -0,01 0,39 -1,40 0,92 0,97 0,24 -1,00 -0,08 -1,00524 0,89 0,78 0,57 -0,49 -0,15 -0,50 0,53 1,35 0,43 -0,64 0,30 -0,84 0,00 0,55 0,12 -0,12 -0,25 -0,56 0,00 1,23 0,23 0,61 0,99 0,64 -0,61 -1,00 0,09525 0,00 0,00 0,01 -1,00 -0,97 -0,99 0,00 0,03 0,01 NA -3,65 -5,10 -0,10 -0,10 -0,03 NA -6,22 -5,08 NA -3,98 -1,82 0,00 0,02 0,14 -0,66 -1,00 -0,22541 0,09 0,22 0,06 -0,95 -0,85 -0,93 0,04 0,15 0,05 -3,22 -1,92 -3,04 -1,02 -1,05 -0,66 -2,37 -1,50 -2,86 -2,47 -1,74 -2,53 0,10 0,19 0,12 -0,85 -0,68 -0,93581 0,29 0,93 2,11 -0,92 -0,82 -0,18 0,06 0,18 0,90 -2,79 -1,69 -0,10 -1,29 -0,06 0,85 -1,22 -0,07 0,75 -1,68 -0,06 0,51 0,38 0,93 0,54 0,59 -0,33 0,64582 0,71 0,94 1,05 -0,85 -0,67 -0,36 0,12 0,36 0,60 -2,09 -1,01 -0,50 -0,50 -0,68 -0,87 -0,34 -0,06 0,05 -0,53 -0,55 -0,61 0,69 0,72 0,80 -0,13 0,02 -0,11583 0,32 0,77 2,83 -0,95 -0,95 0,09 0,04 0,05 1,53 -3,16 -3,00 0,43 -2,04 -3,19 -1,12 -1,14 -0,27 1,04 -2,00 -1,64 -0,33 0,60 0,90 0,38 0,67 0,26 0,70591 0,26 0,33 0,18 -0,89 -0,97 -0,89 0,09 0,03 0,08 -2,44 -3,44 -2,56 -2,00 -2,07 -1,50 -1,34 -1,10 -1,72 -2,15 -1,98 -2,24 0,35 0,38 0,30 -0,88 -1,00 -0,64592 0,11 0,20 0,21 -0,96 -0,98 -0,91 0,03 0,02 0,06 -3,50 -3,82 -2,80 -1,06 -1,67 -1,82 -2,20 -1,60 -1,54 -2,36 -2,23 -2,25 0,19 0,25 0,27 -0,70 -0,76 -0,72593 0,02 0,17 0,18 -1,00 -1,00 -0,78 0,00 0,00 0,16 NA NA -1,82 -0,89 -0,18 -0,56 -3,71 -1,77 -1,71 -3,62 -0,72 -1,41 0,02 0,17 0,16 -0,80 -0,98 -0,76597 0,05 0,08 0,10 -0,97 -0,97 -0,97 0,02 0,03 0,02 -3,93 -3,63 -4,10 -3,91 -3,76 -3,65 -2,97 -2,48 -2,30 -4,35 -3,83 -3,62 0,07 0,09 0,13 -0,83 -0,89 -0,81598 0,13 0,14 0,16 -0,94 -0,96 -0,91 0,05 0,04 0,06 -2,98 -3,29 -2,79 -1,30 -1,16 -1,38 -2,04 -1,99 -1,86 -2,40 -2,25 -2,29 0,16 0,17 0,22 -0,77 -0,90 -0,73751 0,07 0,07 0,08 -0,90 -0,97 -0,96 0,08 0,03 0,02 -2,54 -3,53 -3,71 -0,52 -1,18 -1,07 -2,62 -2,64 -2,48 -2,11 -2,86 -2,62 0,08 0,04 0,06 -0,96 -1,00 -0,97752 0,02 0,10 0,04 -0,99 -0,91 -0,94 0,01 0,08 0,04 -4,85 -2,47 -3,21 -0,37 -0,45 -0,39 -4,01 -2,28 -3,26 -3,05 -1,68 -2,40 0,02 0,08 0,05 -0,95 -0,97 -0,95759 0,01 0,03 0,02 -0,96 -0,90 -0,70 0,03 0,10 0,23 -3,55 -2,31 -1,49 -0,14 -0,16 -0,16 -4,94 -3,39 -3,71 -3,02 -1,76 -2,01 0,03 0,09 0,08 -0,90 -1,00 -0,91
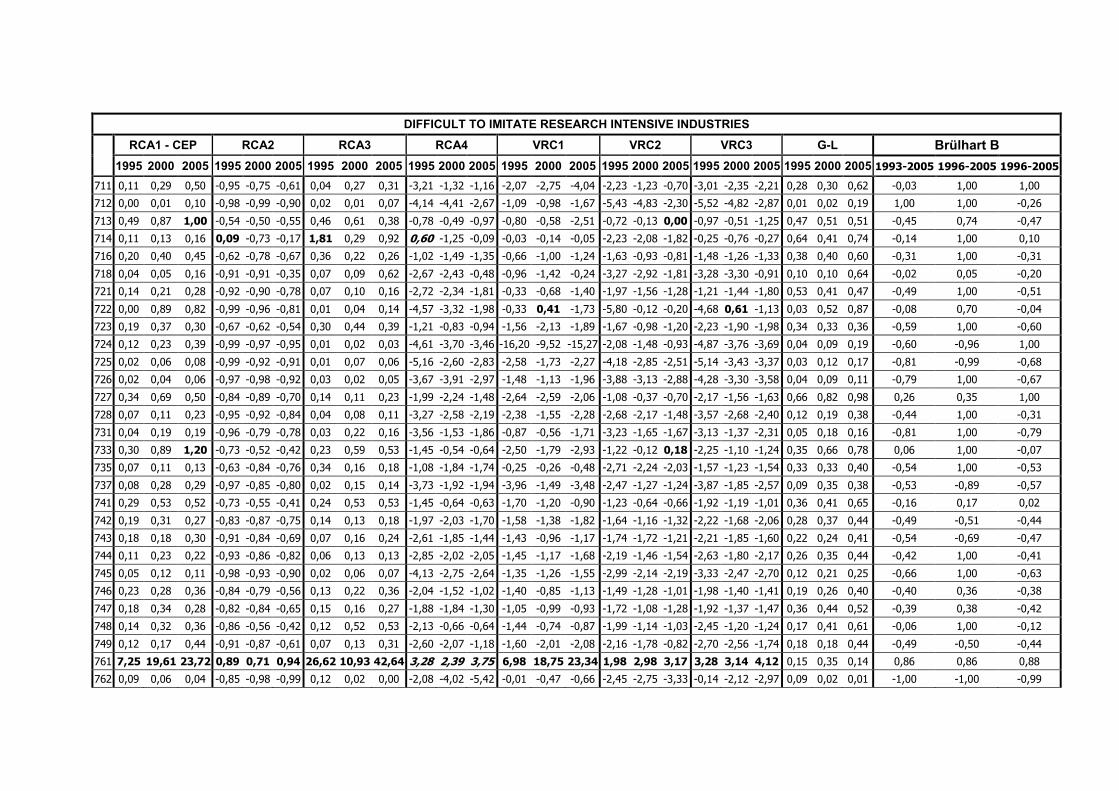
DIFFICULT TO IMITATE RESEARCH INTENSIVE INDUSTRIES
RCA1 - CEP RCA2 RCA3 RCA4 VRC1 VRC2 VRC3 G-L Brülhart B1995 2000 2005 1995 2000 2005 1995 2000 2005 1995 2000 2005 1995 2000 2005 1995 2000 2005 1995 2000 2005 1995 2000 2005 1993-2005 1996-2005 1996-2005
711 0,11 0,29 0,50 -0,95 -0,75 -0,61 0,04 0,27 0,31 -3,21 -1,32 -1,16 -2,07 -2,75 -4,04 -2,23 -1,23 -0,70 -3,01 -2,35 -2,21 0,28 0,30 0,62 -0,03 1,00 1,00
712 0,00 0,01 0,10 -0,98 -0,99 -0,90 0,02 0,01 0,07 -4,14 -4,41 -2,67 -1,09 -0,98 -1,67 -5,43 -4,83 -2,30 -5,52 -4,82 -2,87 0,01 0,02 0,19 1,00 1,00 -0,26
713 0,49 0,87 1,00 -0,54 -0,50 -0,55 0,46 0,61 0,38 -0,78 -0,49 -0,97 -0,80 -0,58 -2,51 -0,72 -0,13 0,00 -0,97 -0,51 -1,25 0,47 0,51 0,51 -0,45 0,74 -0,47
714 0,11 0,13 0,16 0,09 -0,73 -0,17 1,81 0,29 0,92 0,60 -1,25 -0,09 -0,03 -0,14 -0,05 -2,23 -2,08 -1,82 -0,25 -0,76 -0,27 0,64 0,41 0,74 -0,14 1,00 0,10
716 0,20 0,40 0,45 -0,62 -0,78 -0,67 0,36 0,22 0,26 -1,02 -1,49 -1,35 -0,66 -1,00 -1,24 -1,63 -0,93 -0,81 -1,48 -1,26 -1,33 0,38 0,40 0,60 -0,31 1,00 -0,31
718 0,04 0,05 0,16 -0,91 -0,91 -0,35 0,07 0,09 0,62 -2,67 -2,43 -0,48 -0,96 -1,42 -0,24 -3,27 -2,92 -1,81 -3,28 -3,30 -0,91 0,10 0,10 0,64 -0,02 0,05 -0,20
721 0,14 0,21 0,28 -0,92 -0,90 -0,78 0,07 0,10 0,16 -2,72 -2,34 -1,81 -0,33 -0,68 -1,40 -1,97 -1,56 -1,28 -1,21 -1,44 -1,80 0,53 0,41 0,47 -0,49 1,00 -0,51
722 0,00 0,89 0,82 -0,99 -0,96 -0,81 0,01 0,04 0,14 -4,57 -3,32 -1,98 -0,33 0,41 -1,73 -5,80 -0,12 -0,20 -4,68 0,61 -1,13 0,03 0,52 0,87 -0,08 0,70 -0,04
723 0,19 0,37 0,30 -0,67 -0,62 -0,54 0,30 0,44 0,39 -1,21 -0,83 -0,94 -1,56 -2,13 -1,89 -1,67 -0,98 -1,20 -2,23 -1,90 -1,98 0,34 0,33 0,36 -0,59 1,00 -0,60
724 0,12 0,23 0,39 -0,99 -0,97 -0,95 0,01 0,02 0,03 -4,61 -3,70 -3,46 -16,20 -9,52 -15,27 -2,08 -1,48 -0,93 -4,87 -3,76 -3,69 0,04 0,09 0,19 -0,60 -0,96 1,00
725 0,02 0,06 0,08 -0,99 -0,92 -0,91 0,01 0,07 0,06 -5,16 -2,60 -2,83 -2,58 -1,73 -2,27 -4,18 -2,85 -2,51 -5,14 -3,43 -3,37 0,03 0,12 0,17 -0,81 -0,99 -0,68
726 0,02 0,04 0,06 -0,97 -0,98 -0,92 0,03 0,02 0,05 -3,67 -3,91 -2,97 -1,48 -1,13 -1,96 -3,88 -3,13 -2,88 -4,28 -3,30 -3,58 0,04 0,09 0,11 -0,79 1,00 -0,67
727 0,34 0,69 0,50 -0,84 -0,89 -0,70 0,14 0,11 0,23 -1,99 -2,24 -1,48 -2,64 -2,59 -2,06 -1,08 -0,37 -0,70 -2,17 -1,56 -1,63 0,66 0,82 0,98 0,26 0,35 1,00
728 0,07 0,11 0,23 -0,95 -0,92 -0,84 0,04 0,08 0,11 -3,27 -2,58 -2,19 -2,38 -1,55 -2,28 -2,68 -2,17 -1,48 -3,57 -2,68 -2,40 0,12 0,19 0,38 -0,44 1,00 -0,31
731 0,04 0,19 0,19 -0,96 -0,79 -0,78 0,03 0,22 0,16 -3,56 -1,53 -1,86 -0,87 -0,56 -1,71 -3,23 -1,65 -1,67 -3,13 -1,37 -2,31 0,05 0,18 0,16 -0,81 1,00 -0,79
733 0,30 0,89 1,20 -0,73 -0,52 -0,42 0,23 0,59 0,53 -1,45 -0,54 -0,64 -2,50 -1,79 -2,93 -1,22 -0,12 0,18 -2,25 -1,10 -1,24 0,35 0,66 0,78 0,06 1,00 -0,07
735 0,07 0,11 0,13 -0,63 -0,84 -0,76 0,34 0,16 0,18 -1,08 -1,84 -1,74 -0,25 -0,26 -0,48 -2,71 -2,24 -2,03 -1,57 -1,23 -1,54 0,33 0,33 0,40 -0,54 1,00 -0,53
737 0,08 0,28 0,29 -0,97 -0,85 -0,80 0,02 0,15 0,14 -3,73 -1,92 -1,94 -3,96 -1,49 -3,48 -2,47 -1,27 -1,24 -3,87 -1,85 -2,57 0,09 0,35 0,38 -0,53 -0,89 -0,57
741 0,29 0,53 0,52 -0,73 -0,55 -0,41 0,24 0,53 0,53 -1,45 -0,64 -0,63 -1,70 -1,20 -0,90 -1,23 -0,64 -0,66 -1,92 -1,19 -1,01 0,36 0,41 0,65 -0,16 0,17 0,02
742 0,19 0,31 0,27 -0,83 -0,87 -0,75 0,14 0,13 0,18 -1,97 -2,03 -1,70 -1,58 -1,38 -1,82 -1,64 -1,16 -1,32 -2,22 -1,68 -2,06 0,28 0,37 0,44 -0,49 -0,51 -0,44
743 0,18 0,18 0,30 -0,91 -0,84 -0,69 0,07 0,16 0,24 -2,61 -1,85 -1,44 -1,43 -0,96 -1,17 -1,74 -1,72 -1,21 -2,21 -1,85 -1,60 0,22 0,24 0,41 -0,54 -0,69 -0,47
744 0,11 0,23 0,22 -0,93 -0,86 -0,82 0,06 0,13 0,13 -2,85 -2,02 -2,05 -1,45 -1,17 -1,68 -2,19 -1,46 -1,54 -2,63 -1,80 -2,17 0,26 0,35 0,44 -0,42 1,00 -0,41
745 0,05 0,12 0,11 -0,98 -0,93 -0,90 0,02 0,06 0,07 -4,13 -2,75 -2,64 -1,35 -1,26 -1,55 -2,99 -2,14 -2,19 -3,33 -2,47 -2,70 0,12 0,21 0,25 -0,66 1,00 -0,63
746 0,23 0,28 0,36 -0,84 -0,79 -0,56 0,13 0,22 0,36 -2,04 -1,52 -1,02 -1,40 -0,85 -1,13 -1,49 -1,28 -1,01 -1,98 -1,40 -1,41 0,19 0,26 0,40 -0,40 0,36 -0,38
747 0,18 0,34 0,28 -0,82 -0,84 -0,65 0,15 0,16 0,27 -1,88 -1,84 -1,30 -1,05 -0,99 -0,93 -1,72 -1,08 -1,28 -1,92 -1,37 -1,47 0,36 0,44 0,52 -0,39 0,38 -0,42
748 0,14 0,32 0,36 -0,86 -0,56 -0,42 0,12 0,52 0,53 -2,13 -0,66 -0,64 -1,44 -0,74 -0,87 -1,99 -1,14 -1,03 -2,45 -1,20 -1,24 0,17 0,41 0,61 -0,06 1,00 -0,12
749 0,12 0,17 0,44 -0,91 -0,87 -0,61 0,07 0,13 0,31 -2,60 -2,07 -1,18 -1,60 -2,01 -2,08 -2,16 -1,78 -0,82 -2,70 -2,56 -1,74 0,18 0,18 0,44 -0,49 -0,50 -0,44
761 7,25 19,61 23,72 0,89 0,71 0,94 26,62 10,93 42,64 3,28 2,39 3,75 6,98 18,75 23,34 1,98 2,98 3,17 3,28 3,14 4,12 0,15 0,35 0,14 0,86 0,86 0,88
762 0,09 0,06 0,04 -0,85 -0,98 -0,99 0,12 0,02 0,00 -2,08 -4,02 -5,42 -0,01 -0,47 -0,66 -2,45 -2,75 -3,33 -0,14 -2,12 -2,97 0,09 0,02 0,01 -1,00 -1,00 -0,99
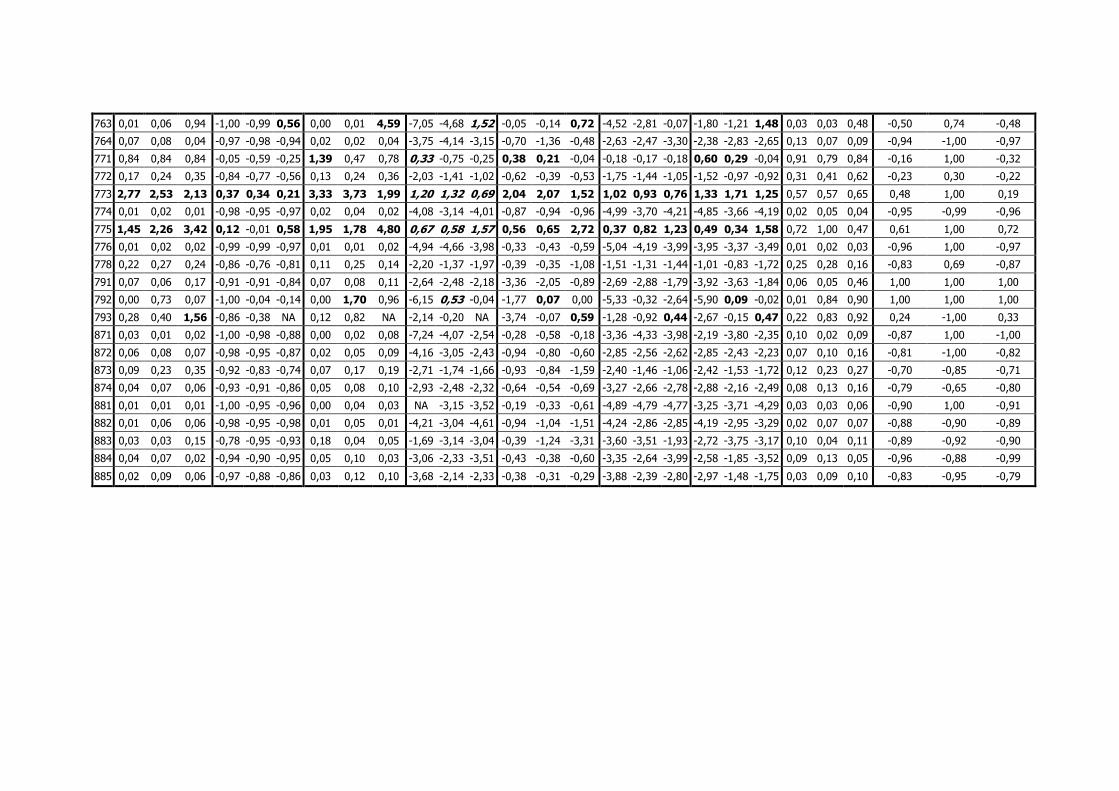
763 0,01 0,06 0,94 -1,00 -0,99 0,56 0,00 0,01 4,59 -7,05 -4,68 1,52 -0,05 -0,14 0,72 -4,52 -2,81 -0,07 -1,80 -1,21 1,48 0,03 0,03 0,48 -0,50 0,74 -0,48
764 0,07 0,08 0,04 -0,97 -0,98 -0,94 0,02 0,02 0,04 -3,75 -4,14 -3,15 -0,70 -1,36 -0,48 -2,63 -2,47 -3,30 -2,38 -2,83 -2,65 0,13 0,07 0,09 -0,94 -1,00 -0,97
771 0,84 0,84 0,84 -0,05 -0,59 -0,25 1,39 0,47 0,78 0,33 -0,75 -0,25 0,38 0,21 -0,04 -0,18 -0,17 -0,18 0,60 0,29 -0,04 0,91 0,79 0,84 -0,16 1,00 -0,32
772 0,17 0,24 0,35 -0,84 -0,77 -0,56 0,13 0,24 0,36 -2,03 -1,41 -1,02 -0,62 -0,39 -0,53 -1,75 -1,44 -1,05 -1,52 -0,97 -0,92 0,31 0,41 0,62 -0,23 0,30 -0,22
773 2,77 2,53 2,13 0,37 0,34 0,21 3,33 3,73 1,99 1,20 1,32 0,69 2,04 2,07 1,52 1,02 0,93 0,76 1,33 1,71 1,25 0,57 0,57 0,65 0,48 1,00 0,19
774 0,01 0,02 0,01 -0,98 -0,95 -0,97 0,02 0,04 0,02 -4,08 -3,14 -4,01 -0,87 -0,94 -0,96 -4,99 -3,70 -4,21 -4,85 -3,66 -4,19 0,02 0,05 0,04 -0,95 -0,99 -0,96
775 1,45 2,26 3,42 0,12 -0,01 0,58 1,95 1,78 4,80 0,67 0,58 1,57 0,56 0,65 2,72 0,37 0,82 1,23 0,49 0,34 1,58 0,72 1,00 0,47 0,61 1,00 0,72
776 0,01 0,02 0,02 -0,99 -0,99 -0,97 0,01 0,01 0,02 -4,94 -4,66 -3,98 -0,33 -0,43 -0,59 -5,04 -4,19 -3,99 -3,95 -3,37 -3,49 0,01 0,02 0,03 -0,96 1,00 -0,97
778 0,22 0,27 0,24 -0,86 -0,76 -0,81 0,11 0,25 0,14 -2,20 -1,37 -1,97 -0,39 -0,35 -1,08 -1,51 -1,31 -1,44 -1,01 -0,83 -1,72 0,25 0,28 0,16 -0,83 0,69 -0,87
791 0,07 0,06 0,17 -0,91 -0,91 -0,84 0,07 0,08 0,11 -2,64 -2,48 -2,18 -3,36 -2,05 -0,89 -2,69 -2,88 -1,79 -3,92 -3,63 -1,84 0,06 0,05 0,46 1,00 1,00 1,00
792 0,00 0,73 0,07 -1,00 -0,04 -0,14 0,00 1,70 0,96 -6,15 0,53 -0,04 -1,77 0,07 0,00 -5,33 -0,32 -2,64 -5,90 0,09 -0,02 0,01 0,84 0,90 1,00 1,00 1,00
793 0,28 0,40 1,56 -0,86 -0,38 NA 0,12 0,82 NA -2,14 -0,20 NA -3,74 -0,07 0,59 -1,28 -0,92 0,44 -2,67 -0,15 0,47 0,22 0,83 0,92 0,24 -1,00 0,33
871 0,03 0,01 0,02 -1,00 -0,98 -0,88 0,00 0,02 0,08 -7,24 -4,07 -2,54 -0,28 -0,58 -0,18 -3,36 -4,33 -3,98 -2,19 -3,80 -2,35 0,10 0,02 0,09 -0,87 1,00 -1,00
872 0,06 0,08 0,07 -0,98 -0,95 -0,87 0,02 0,05 0,09 -4,16 -3,05 -2,43 -0,94 -0,80 -0,60 -2,85 -2,56 -2,62 -2,85 -2,43 -2,23 0,07 0,10 0,16 -0,81 -1,00 -0,82
873 0,09 0,23 0,35 -0,92 -0,83 -0,74 0,07 0,17 0,19 -2,71 -1,74 -1,66 -0,93 -0,84 -1,59 -2,40 -1,46 -1,06 -2,42 -1,53 -1,72 0,12 0,23 0,27 -0,70 -0,85 -0,71
874 0,04 0,07 0,06 -0,93 -0,91 -0,86 0,05 0,08 0,10 -2,93 -2,48 -2,32 -0,64 -0,54 -0,69 -3,27 -2,66 -2,78 -2,88 -2,16 -2,49 0,08 0,13 0,16 -0,79 -0,65 -0,80
881 0,01 0,01 0,01 -1,00 -0,95 -0,96 0,00 0,04 0,03 NA -3,15 -3,52 -0,19 -0,33 -0,61 -4,89 -4,79 -4,77 -3,25 -3,71 -4,29 0,03 0,03 0,06 -0,90 1,00 -0,91
882 0,01 0,06 0,06 -0,98 -0,95 -0,98 0,01 0,05 0,01 -4,21 -3,04 -4,61 -0,94 -1,04 -1,51 -4,24 -2,86 -2,85 -4,19 -2,95 -3,29 0,02 0,07 0,07 -0,88 -0,90 -0,89
883 0,03 0,03 0,15 -0,78 -0,95 -0,93 0,18 0,04 0,05 -1,69 -3,14 -3,04 -0,39 -1,24 -3,31 -3,60 -3,51 -1,93 -2,72 -3,75 -3,17 0,10 0,04 0,11 -0,89 -0,92 -0,90
884 0,04 0,07 0,02 -0,94 -0,90 -0,95 0,05 0,10 0,03 -3,06 -2,33 -3,51 -0,43 -0,38 -0,60 -3,35 -2,64 -3,99 -2,58 -1,85 -3,52 0,09 0,13 0,05 -0,96 -0,88 -0,99
885 0,02 0,09 0,06 -0,97 -0,88 -0,86 0,03 0,12 0,10 -3,68 -2,14 -2,33 -0,38 -0,31 -0,29 -3,88 -2,39 -2,80 -2,97 -1,48 -1,75 0,03 0,09 0,10 -0,83 -0,95 -0,79